
Optimization of Precursor Synthesis Conditions of (2S,4S)4–[18F]FPArg and Its Application in Glioma Imaging


Abstract
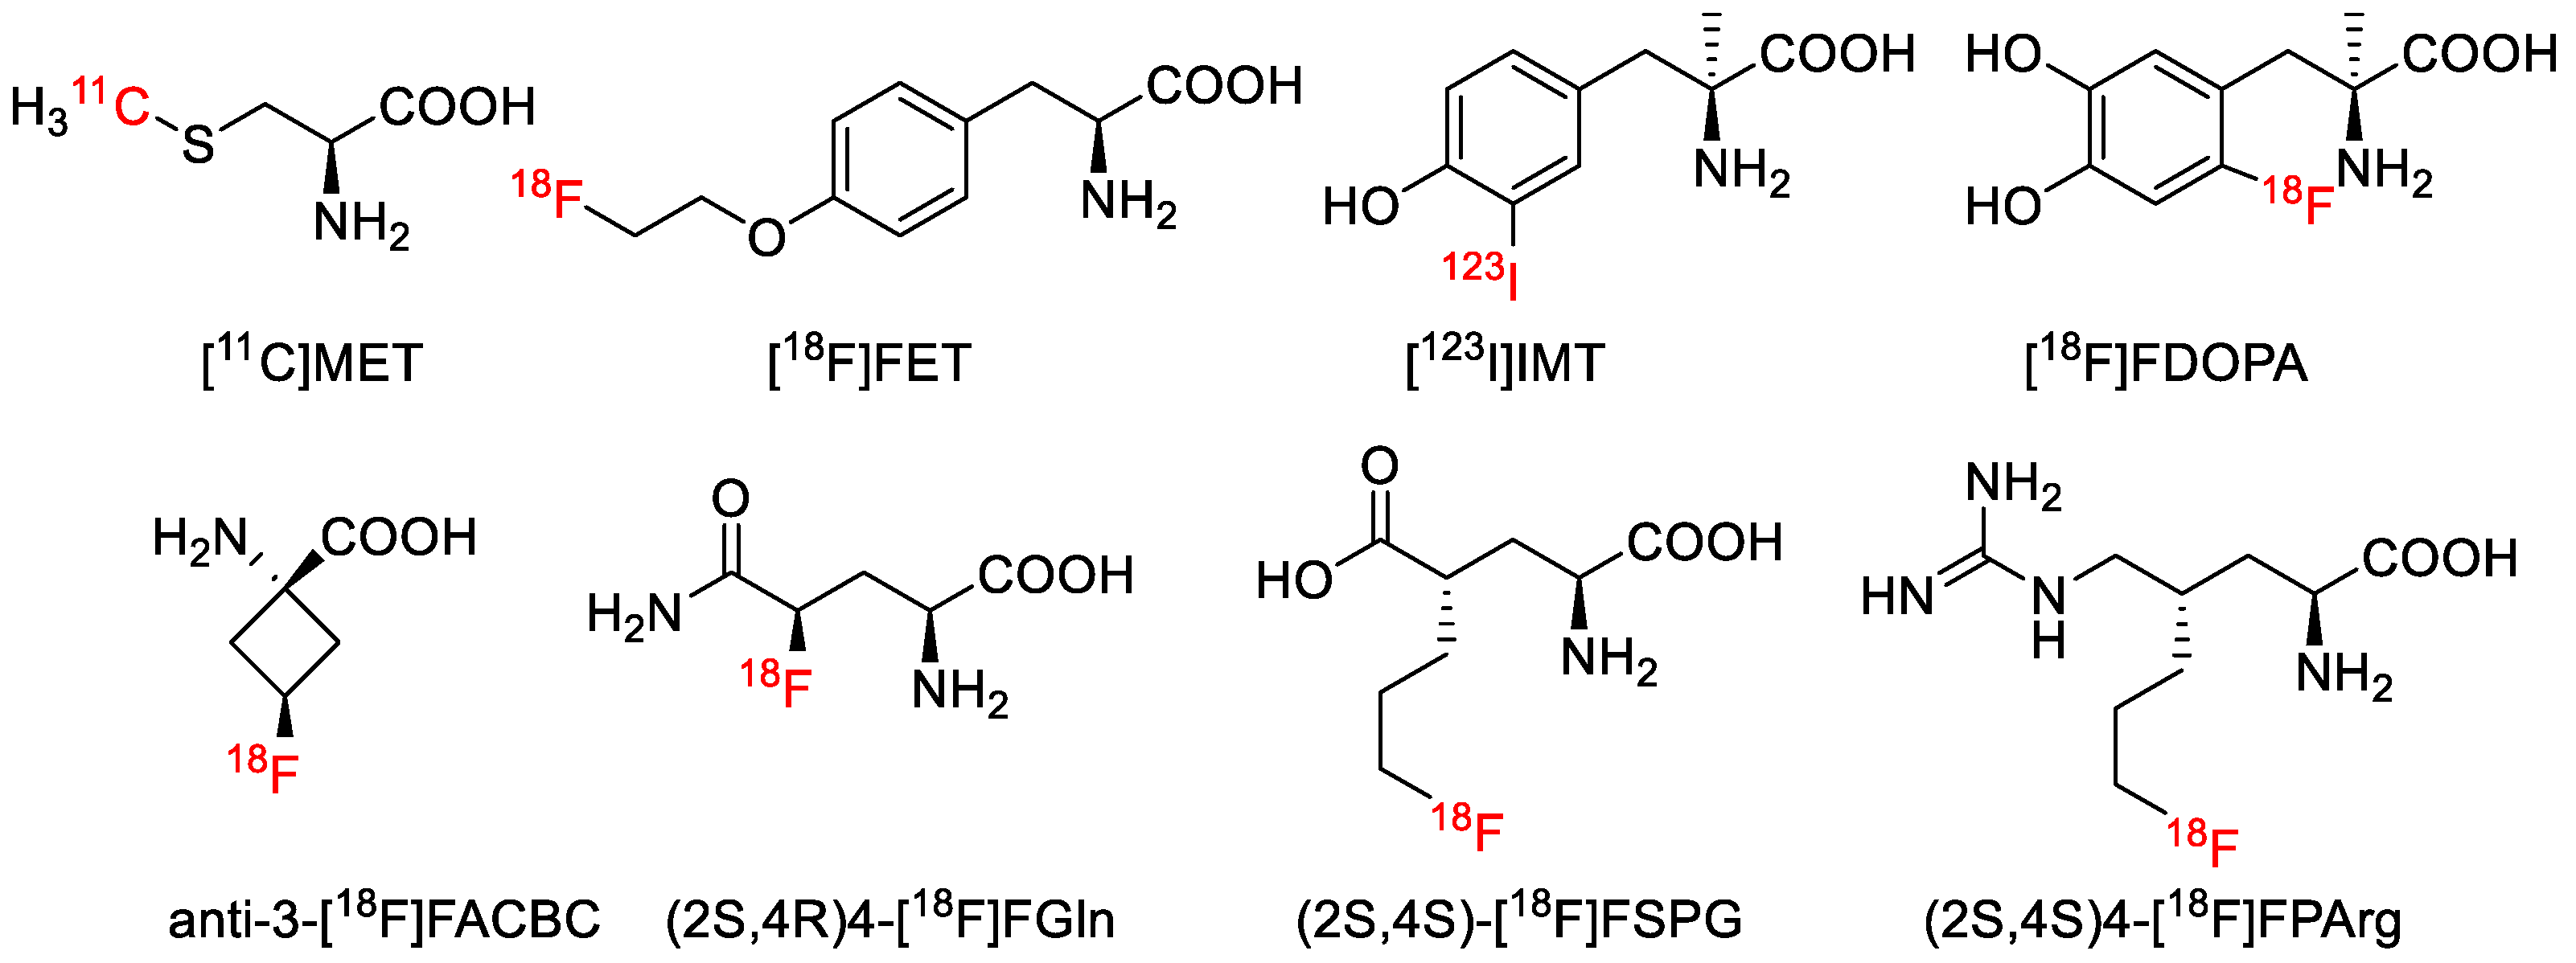
1. Introduction
2. Results
2.1. Optimization of Precursor Synthesis Conditions of (2S,4S)4–[18F]FPArg
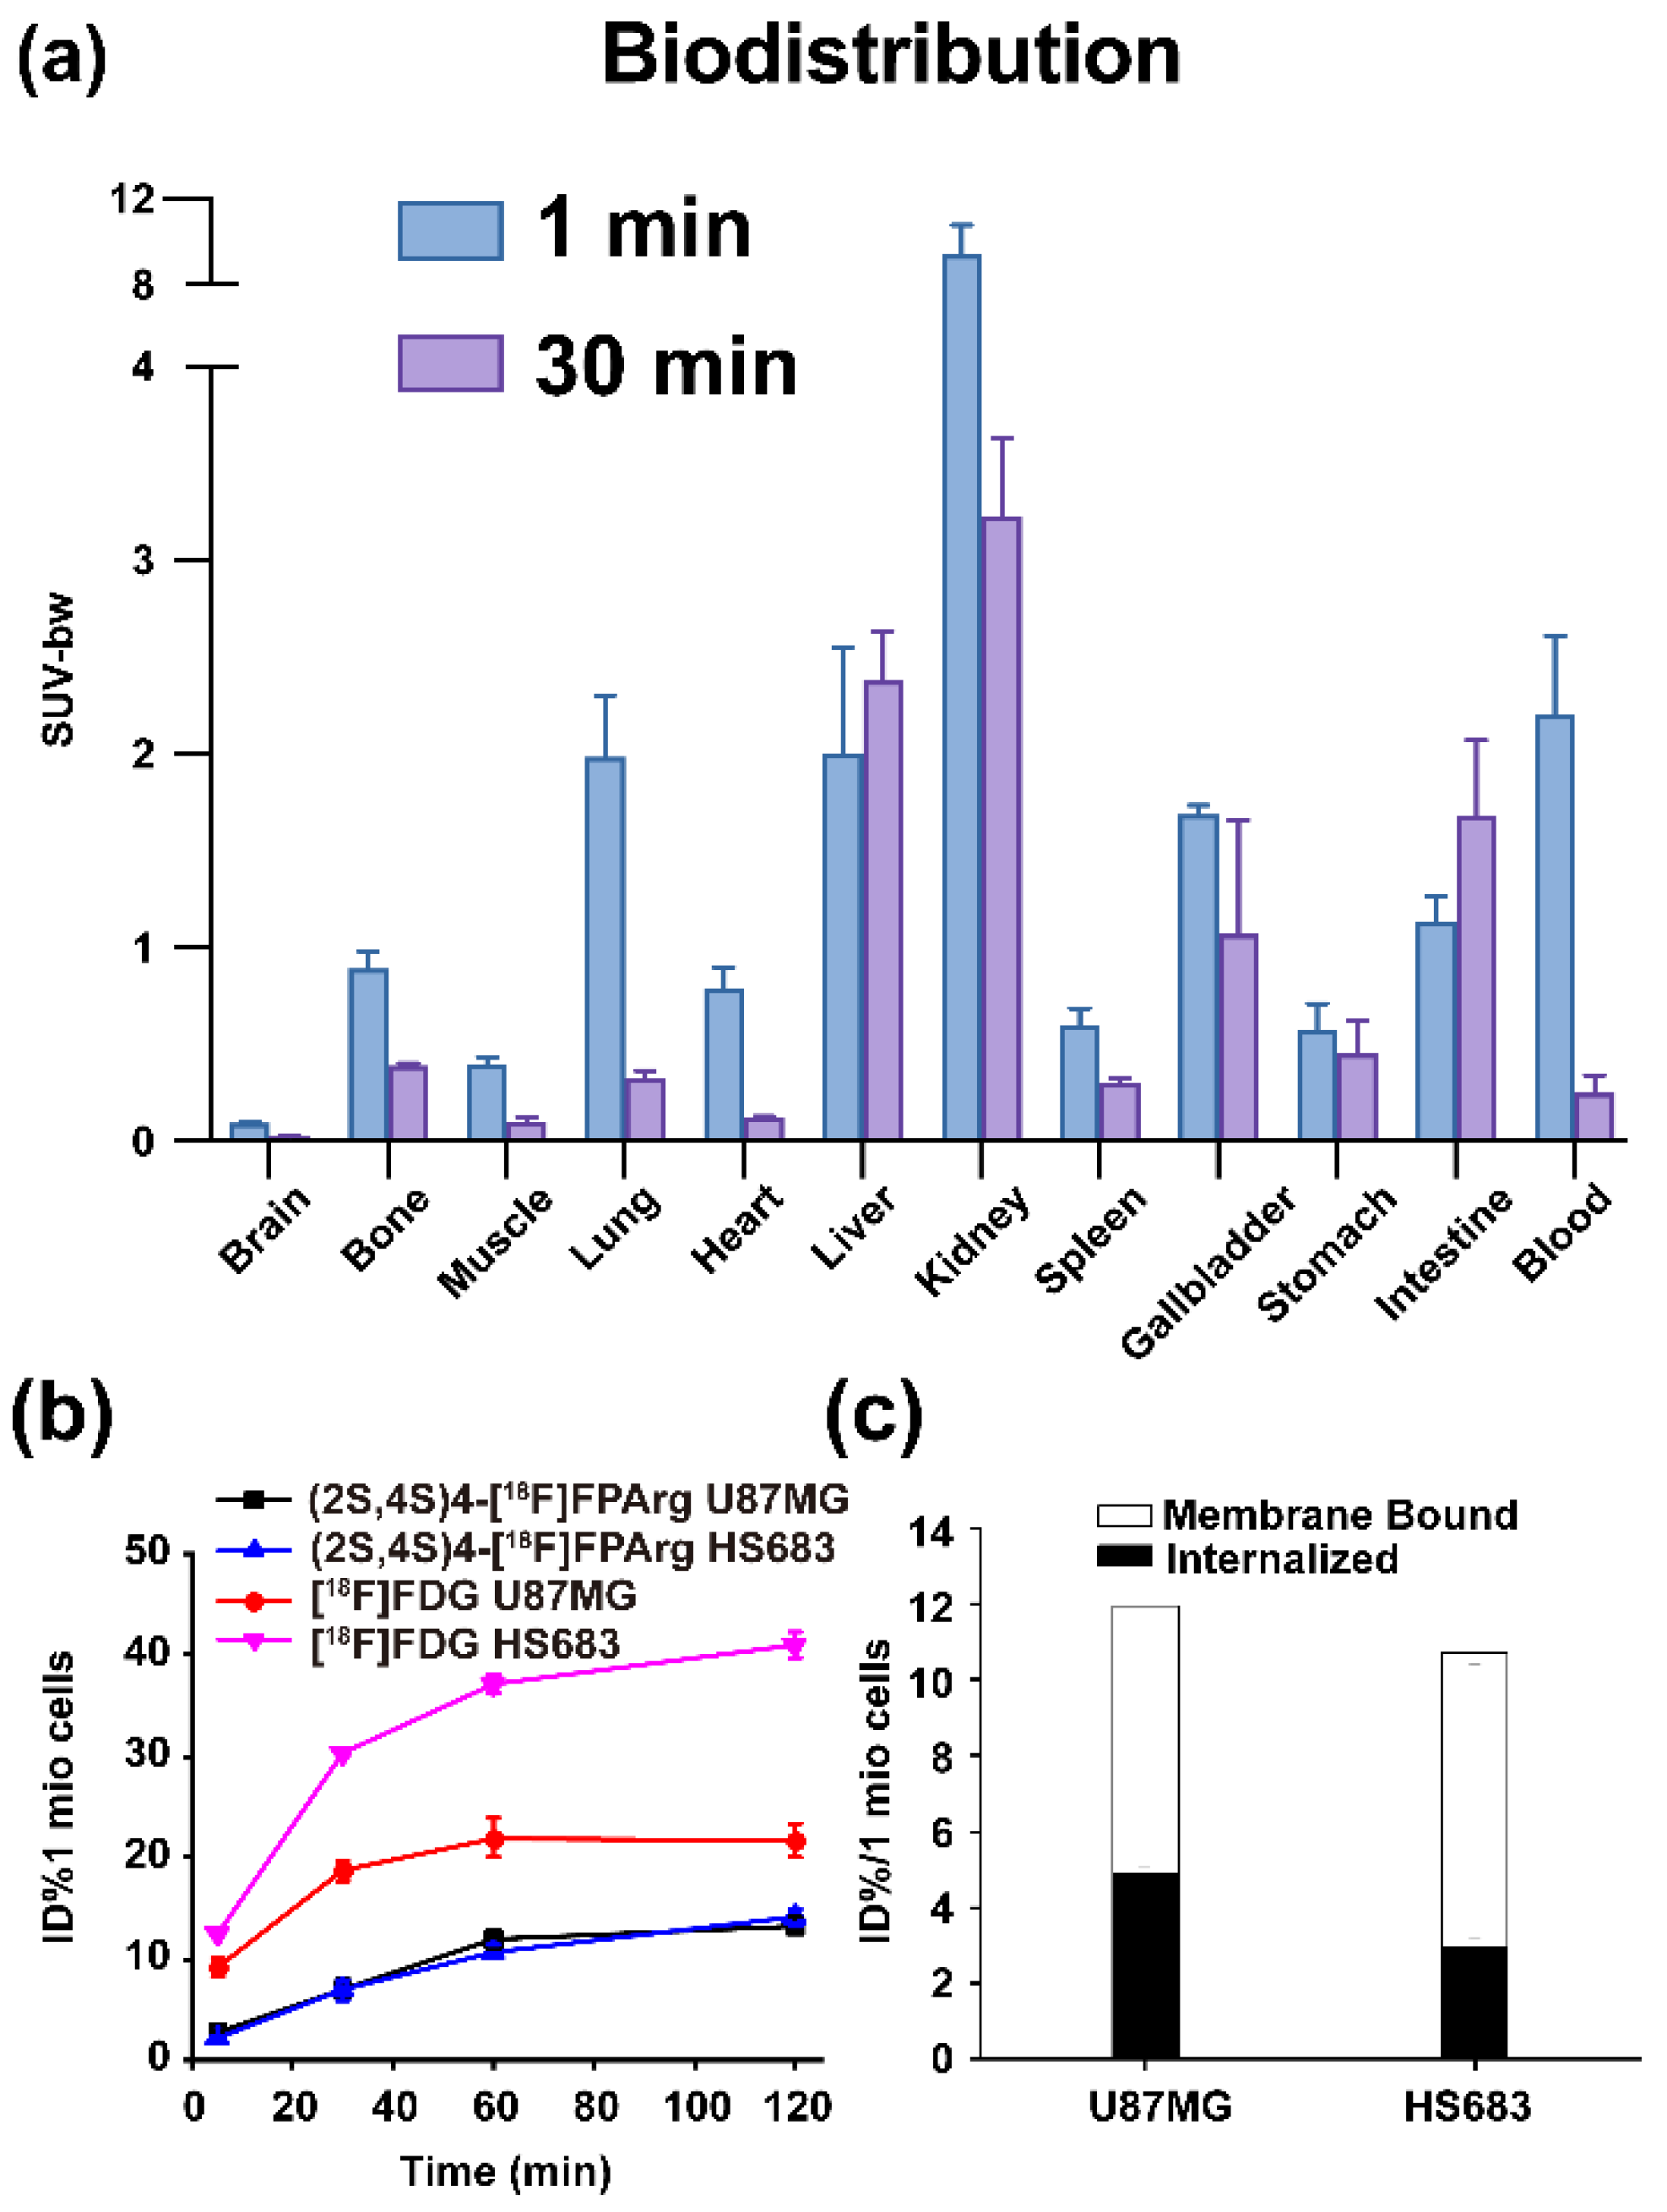
2.2. BALB/c Mouse Biodistribution
2.3. Cell Uptakes, Internalization and Efflux Experiments
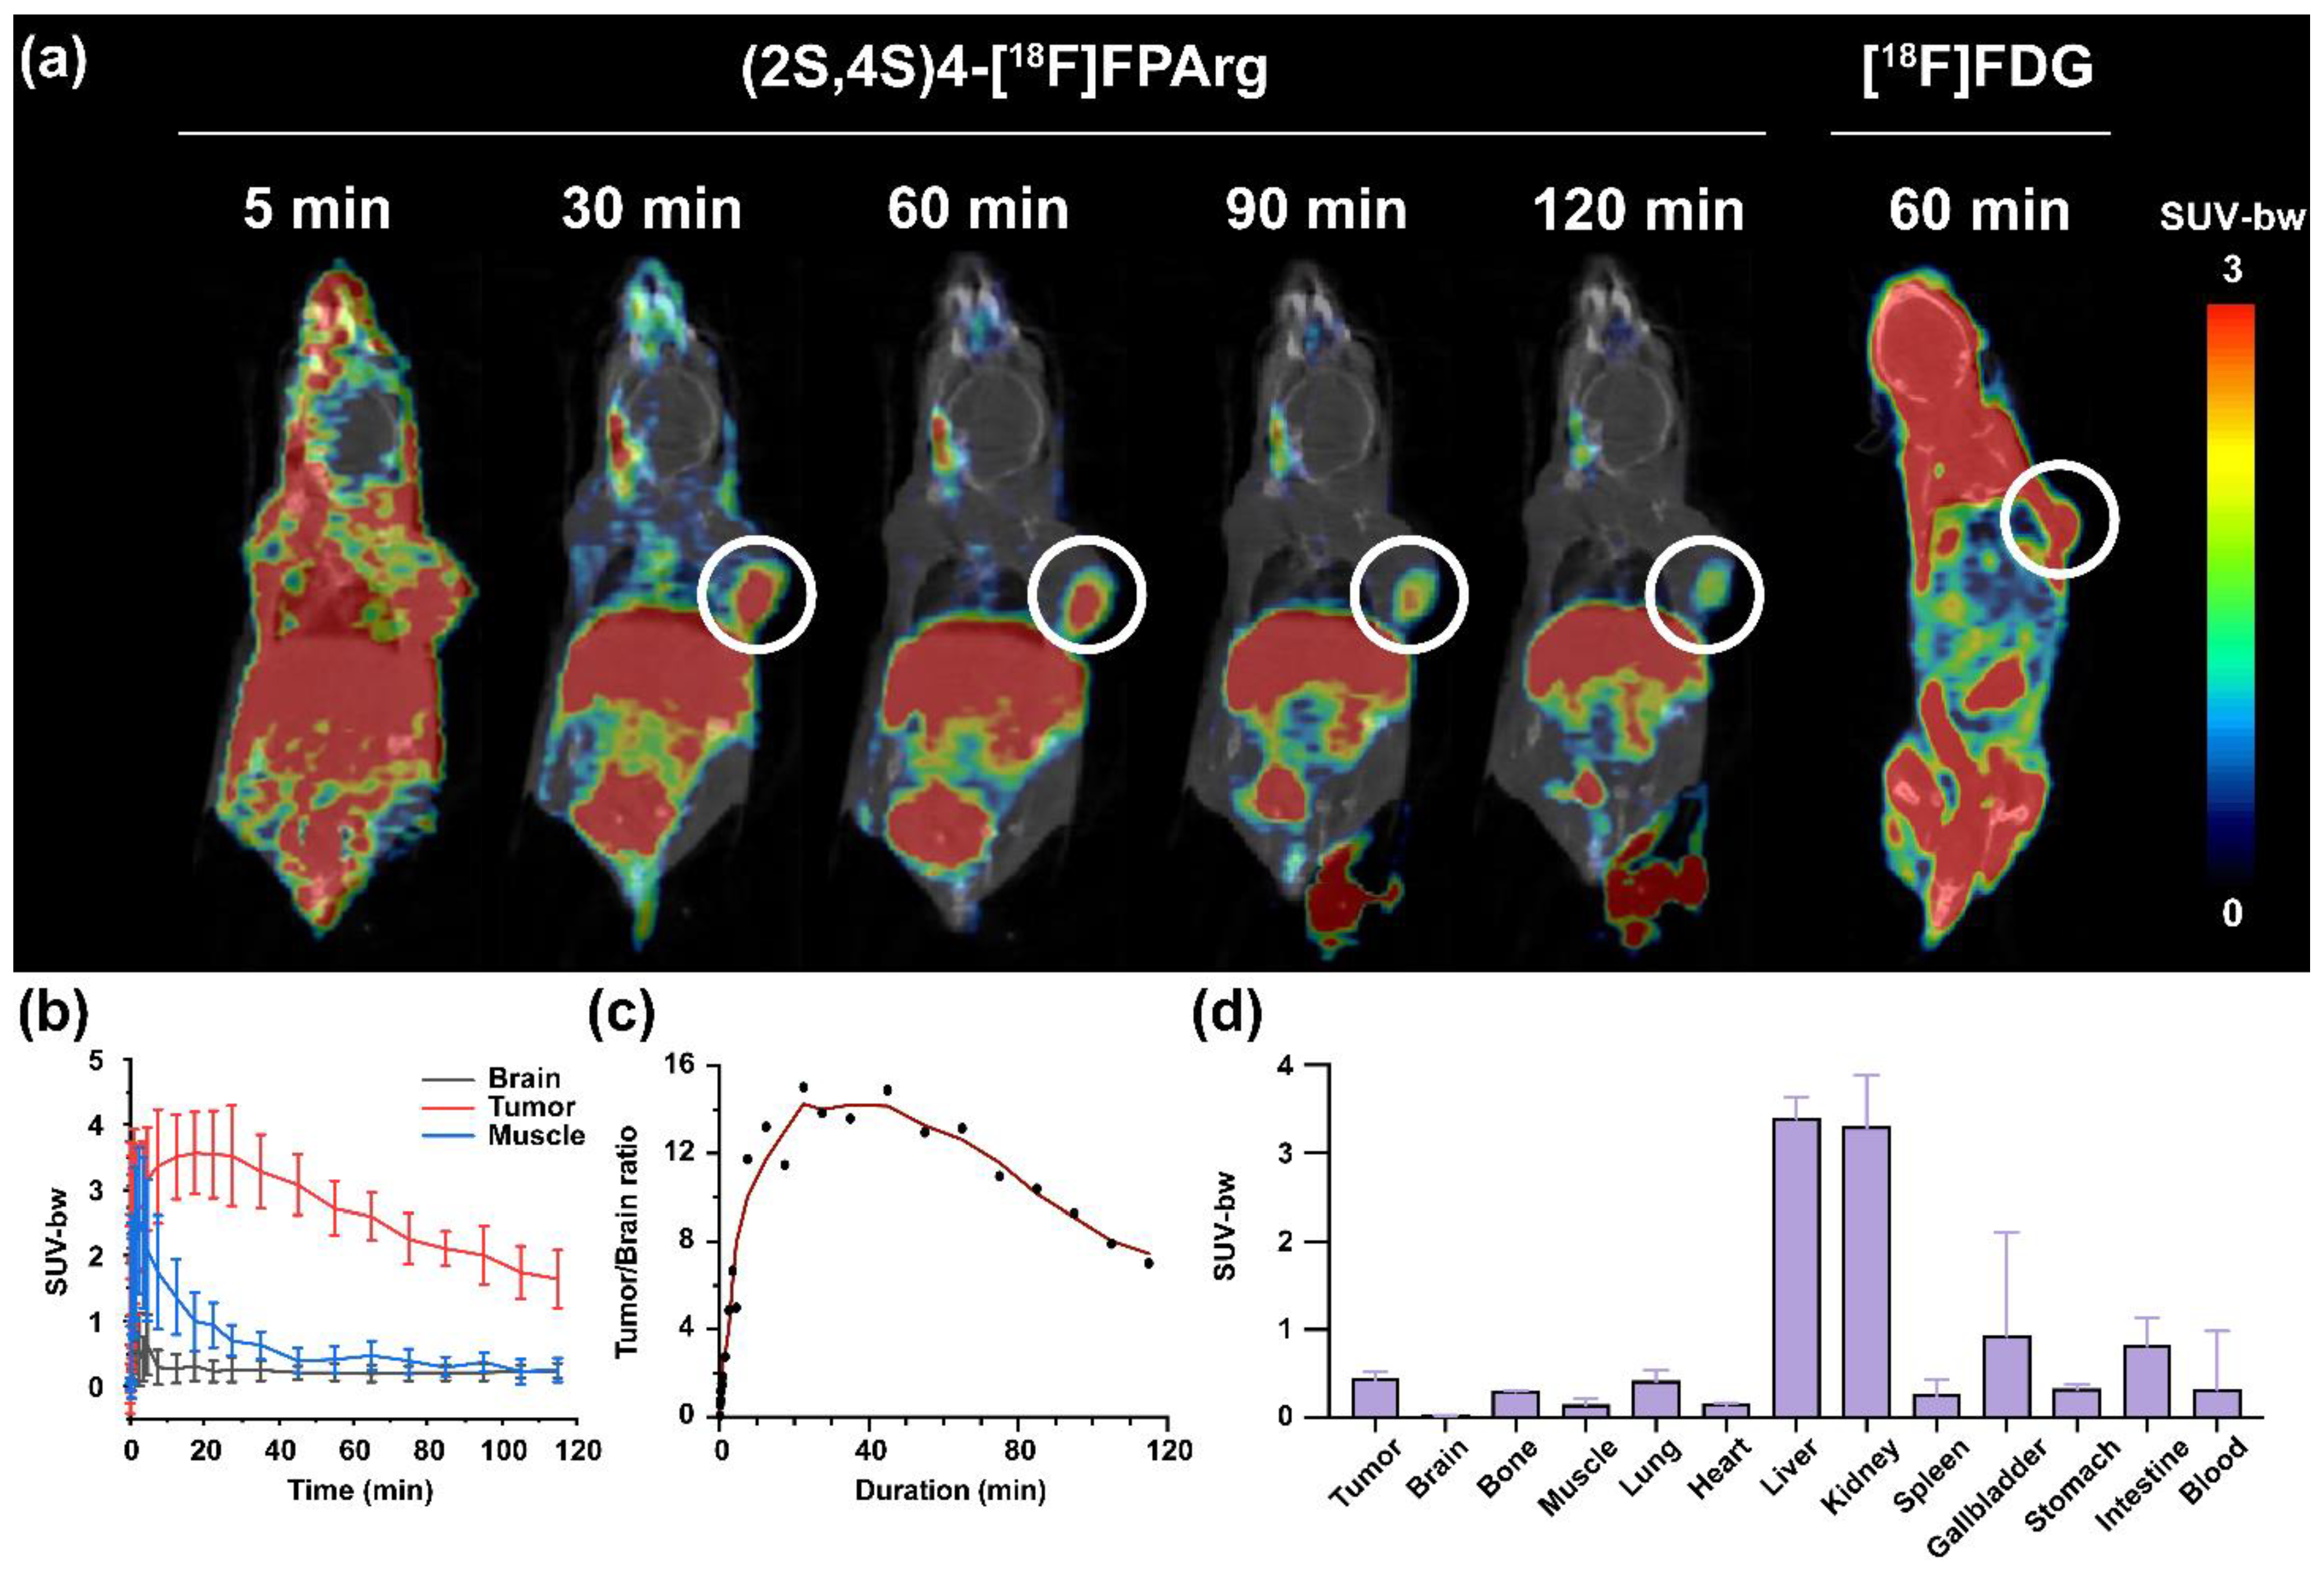
2.4. Small Animal PET–CT Imaging and Biodistribution in Nude Mice Bearing U87MG Tumors
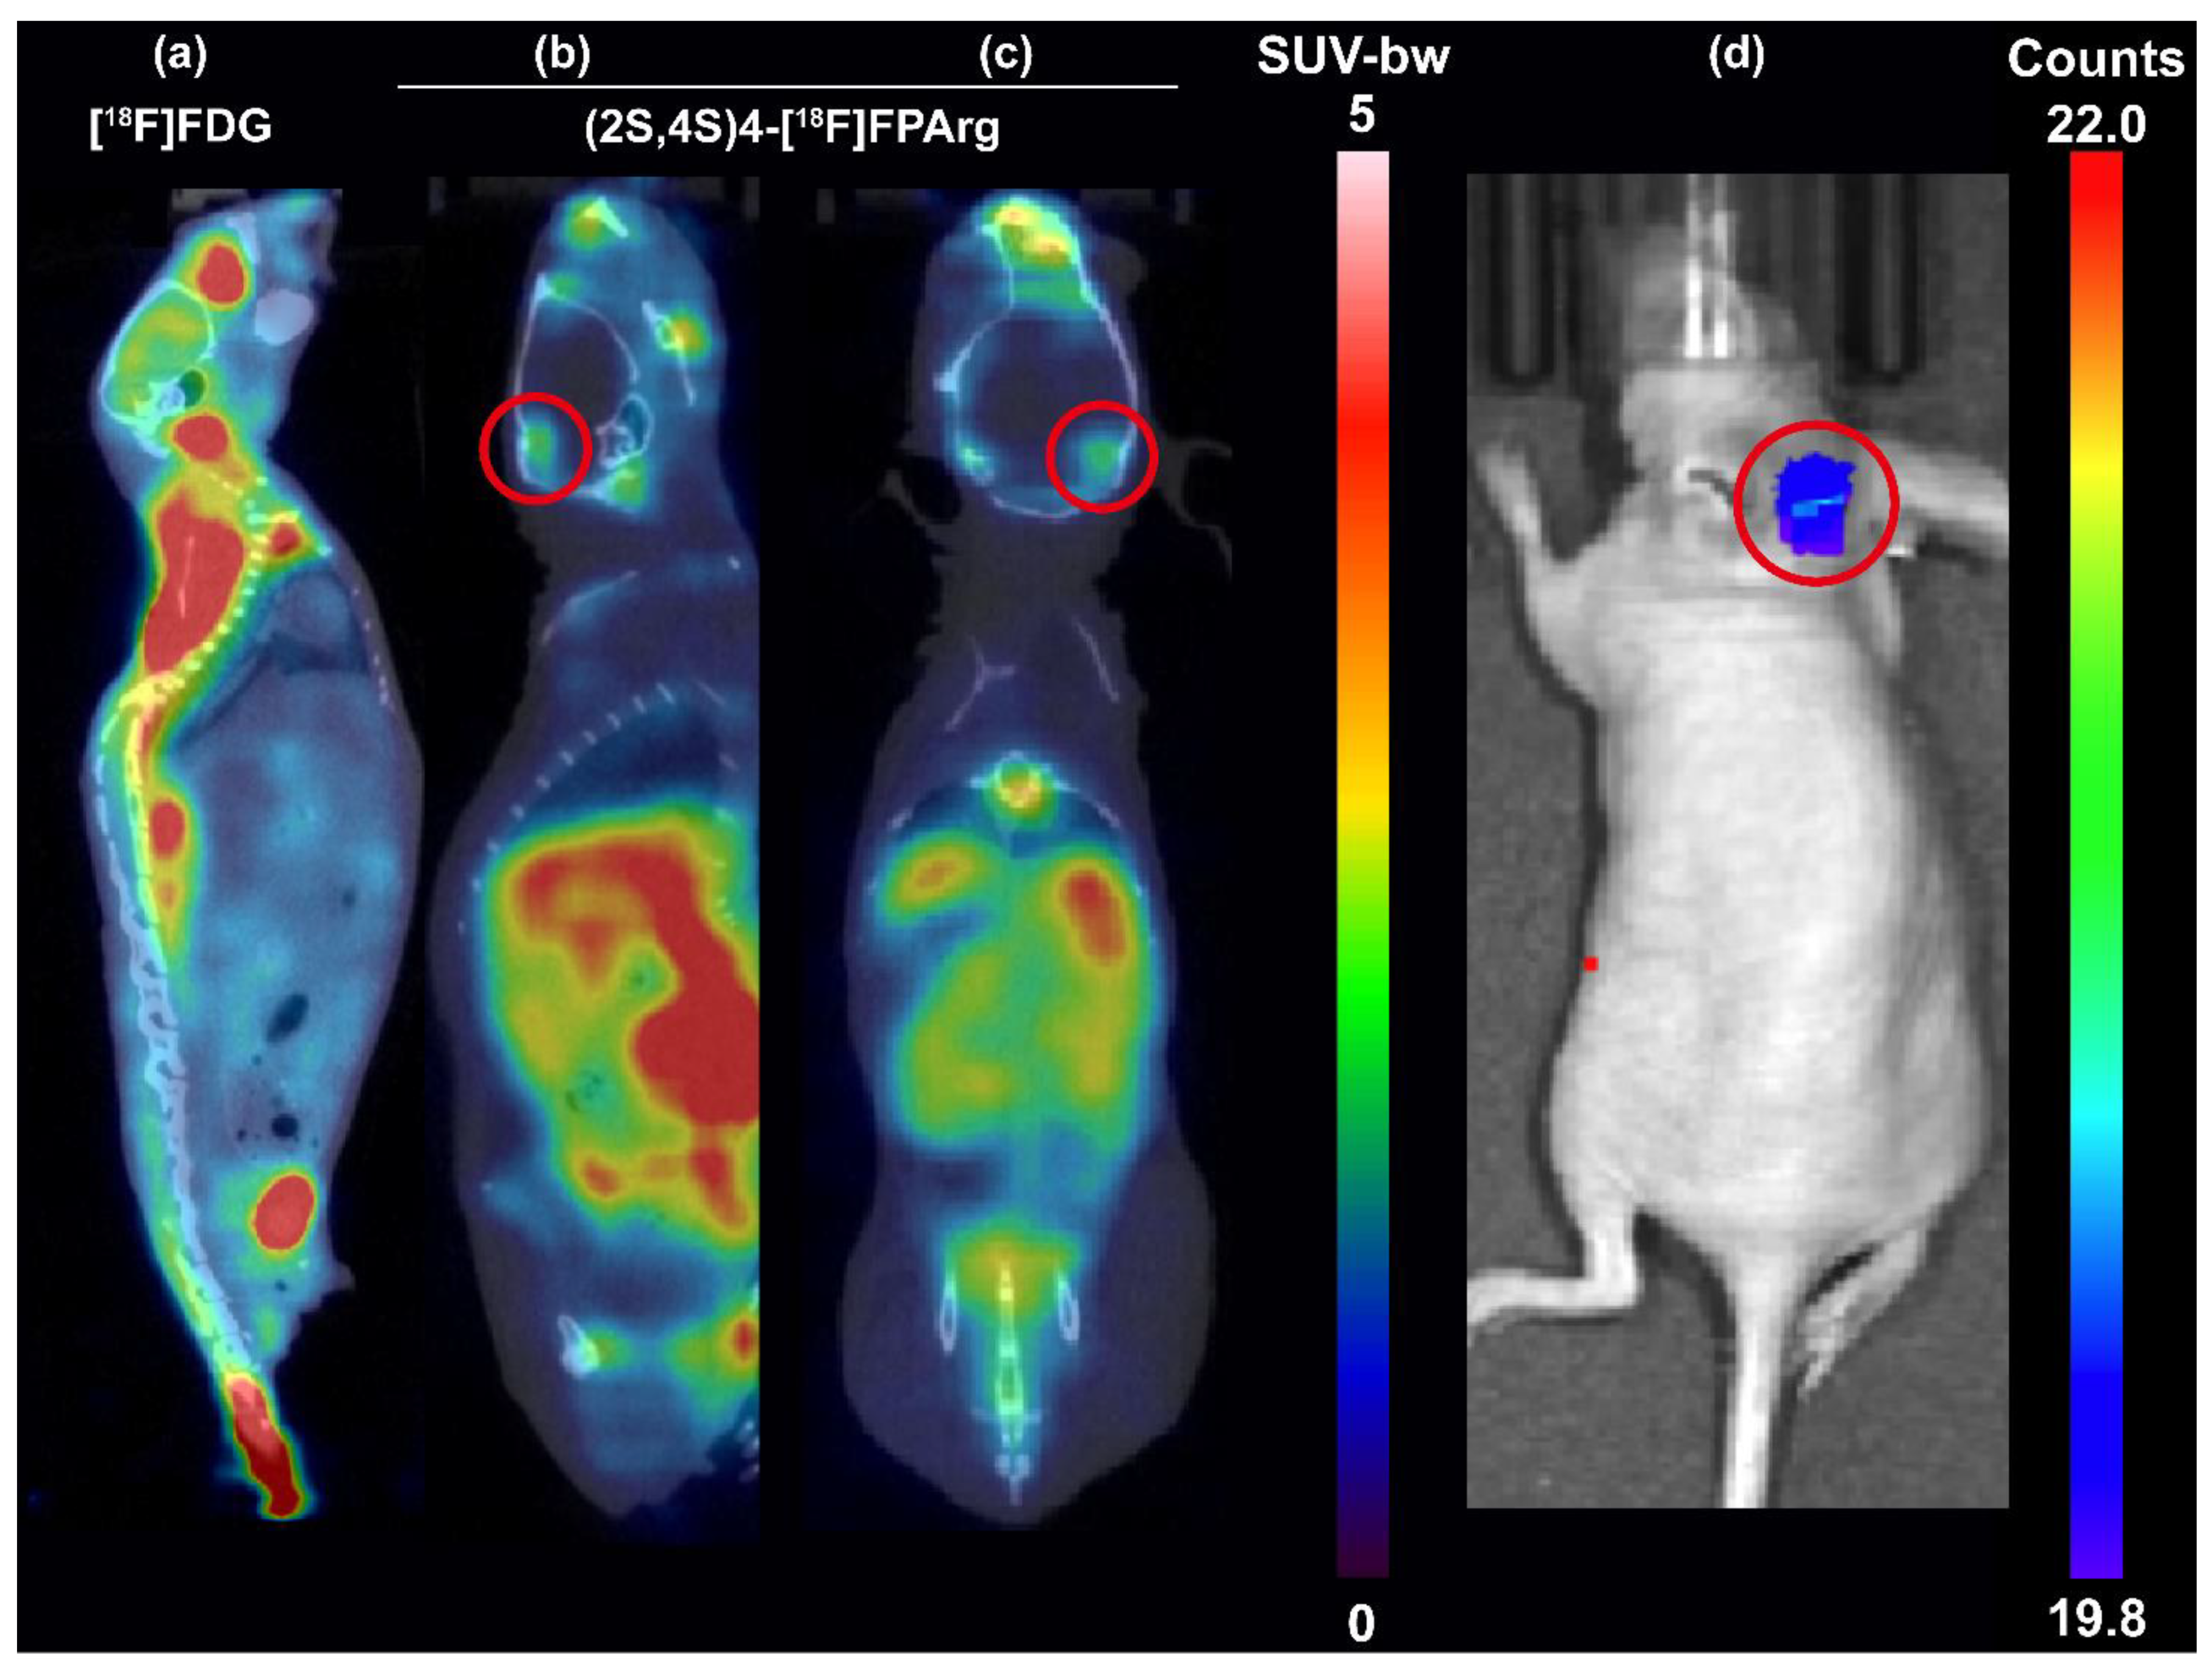
2.5. Small Animal PET–CT Imaging in HS683–Luc Orthotopic Glioma Mouse Model
3. Discussion
4. Materials and Methods
4.1. Synthesis of Tert–Butyl (2S,4S)–4–(((E)–N,N’–Bis(Tert–Butoxycarbonyl)–1H–Pyrazole–1–Carboximidamido)Methyl)–2–((Tert–Butoxycarbonyl)Amino)–7–Hydroxyheptanoate (4)
4.2. Radiolabeling
4.3. Cell Lines and Tumor Models
4.4. Biodistribution
4.5. Cell Uptake, Internalization and Efflux Experiments
4.6. MicroPET–CT Imaging
4.7. Bioluminescence Imaging
4.8. Estimated Human Dosimetry of (2S,4S)4–[18F]FPArg
5. Conclusions
Supplementary Materials
Author Contributions
Funding
Institutional Review Board Statement
Informed Consent Statement
Data Availability Statement
Acknowledgments
Conflicts of Interest
Abbreviations
References
- Lieu, E.L.; Nguyen, T.; Rhyne, S.; Kim, T. Amino acids in cancer. Exp. Mol. Med. 2020, 52, 15–30. [Google Scholar] [CrossRef] [PubMed]
- Mossine, A.V.; Thompson, S.; Brooks, A.F.; Sowa, A.R.; Miller, J.M.; Scott, P.J. Fluorine–18 patents (2009–2015). Part 2: New radiochemistry. Pharm. Pat. Anal. 2016, 5, 319–349. [Google Scholar] [CrossRef] [PubMed]
- Witte, D.; Ali, N.; Carlson, N.; Younes, M. Overexpression of the neutral amino acid transporter ASCT2 in human colorectal adenocarcinoma. Anticancer Res. 2002, 22, 2555–2557. [Google Scholar]
- Fuchs, B.C.; Bode, B.P. Amino acid transporters ASCT2 and LAT1 in cancer: Partners in crime? Semin. Cancer Biol. 2005, 15, 254–266. [Google Scholar] [CrossRef]
- Nishii, R.; Higashi, T.; Kagawa, S.; Kishibe, Y.; Takahashi, M.; Yamauchi, H.; Motoyama, H.; Kawakami, K.; Nakaoku, T.; Nohara, J.; et al. Diagnostic usefulness of an amino acid tracer, alpha–[N–methyl–(11)C]–methylaminoisobutyric acid ((11)C–MeAIB), in the PET diagnosis of chest malignancies. Ann. Nucl. Med. 2013, 27, 808–821. [Google Scholar] [CrossRef] [PubMed]
- Closs, E.I.; Boissel, J.P.; Habermeier, A.; Rotmann, A. Structure and function of cationic amino acid transporters (CATs). J. Membr. Biol. 2006, 213, 67–77. [Google Scholar] [CrossRef]
- McConathy, J.; Yu, W.; Jarkas, N.; Seo, W.; Schuster, D.M.; Goodman, M.M. Radiohalogenated nonnatural amino acids as PET and SPECT tumor imaging agents. Med. Res. Rev. 2012, 32, 868–905. [Google Scholar] [CrossRef] [PubMed]
- Leskinen–Kallio, S.; Nagren, K.; Lehikoinen, P.; Ruotsalainen, U.; Joensuu, H. Uptake of 11C–methionine in breast cancer studied by PET. An association with the size of S–phase fraction. Br. J. Cance. 1991, 64, 1121–1124. [Google Scholar] [CrossRef]
- Singhal, T.; Narayanan, T.K.; Jain, V.; Mukherjee, J.; Mantil, J. 11C–L–methionine positron emission tomography in the clinical management of cerebral gliomas. Mol. Imaging Biol. 2008, 10, 1–18. [Google Scholar] [CrossRef]
- Hutterer, M.; Nowosielski, M.; Putzer, D.; Waitz, D.; Tinkhauser, G.; Kostron, H.; Muigg, A.; Virgolini, I.J.; Staffen, W.; Trinka, E.; et al. O–(2–18F–fluoroethyl)–L–tyrosine PET predicts failure of antiangiogenic treatment in patients with recurrent high–grade glioma. J. Nucl. Med. 2011, 52, 856–864. [Google Scholar] [CrossRef] [PubMed]
- Pauleit, D.; Stoffels, G.; Bachofner, A.; Floeth, F.W.; Sabel, M.; Herzog, H.; Tellmann, L.; Jansen, P.; Reifenberger, G.; Hamacher, K.; et al. Comparison of 18F–FET and 18F–FDG PET in brain tumors. Nucl. Med. Biol. 2009, 36, 779–787. [Google Scholar] [CrossRef]
- Pöpperl, G.; Kreth, F.W.; Mehrkens, J.H.; Herms, J.; Seelos, K.; Koch, W.; Gildehaus, F.J.; Kretzschmar, H.A.; Tonn, J.C.; Tatsch, K. FET PET for the evaluation of untreated gliomas: Correlation of FET uptake and uptake kinetics with tumour grading. Eur. J. Nucl. Med. Mol. I. 2007, 34, 1933–1942. [Google Scholar] [CrossRef] [PubMed]
- Pauleit, D.; Floeth, F.; Tellmann, L.; Hamacher, K.; Hautzel, H.; Muller, H.W.; Coenen, H.H.; Langen, K.J. Comparison of O–(2–18F–fluoroethyl)–L–tyrosine PET and 3–123I–iodo–alpha–methyl–L–tyrosine SPECT in brain tumors. J. Nucl. Med. 2004, 45, 374–381. [Google Scholar] [PubMed]
- Minn, H.; Kauhanen, S.; Seppanen, M.; Nuutila, P. 18F–FDOPA: A multiple–target molecule. J. Nucl. Med. 2009, 50, 1915–1918. [Google Scholar] [CrossRef] [PubMed]
- Koerts, J.; Leenders, K.L.; Koning, M.; Portman, A.T.; van Beilen, M. Striatal dopaminergic activity (FDOPA–PET) associated with cognitive items of a depression scale (MADRS) in Parkinson’s disease. Eur. J. Neurosci. 2007, 25, 3132–3136. [Google Scholar] [CrossRef]
- Qu, W.; Zha, Z.; Ploessl, K.; Lieberman, B.P.; Zhu, L.; Wise, D.R.; Thompson, C.B.; Kung, H.F. Synthesis of optically pure 4–fluoro–glutamines as potential metabolic imaging agents for tumors. J. Am. Chem. Soc. 2011, 133, 1122–1133. [Google Scholar] [CrossRef] [PubMed]
- Ploessl, K.; Wang, L.; Lieberman, B.P.; Qu, W.; Kung, H.F. Comparative evaluation of 18F–labeled glutamic acid and glutamine as tumor metabolic imaging agents. J. Nucl. Med. 2012, 53, 1616–1624. [Google Scholar] [CrossRef] [PubMed]
- Smolarz, K.; Krause, B.J.; Graner, F.P.; Wagner, F.M.; Hultsch, C.; Bacher–Stier, C.; Sparks, R.B.; Ramsay, S.; Fels, L.M.; Dinkelborg, L.M.; et al. (S)–4–(3–18F–fluoropropyl)–L–glutamic acid: An 18F–labeled tumor–specific probe for PET/CT imaging–dosimetry. J. Nucl. Med. 2013, 54, 861–866. [Google Scholar] [CrossRef]
- Wu, R.; Liu, S.; Liu, Y.; Sun, Y.; Cheng, X.; Huang, Y.; Yang, Z.; Wu, Z. Synthesis and biological evaluation of [(18)F](2S,4S)4–(3–fluoropropyl) arginine as a tumor imaging agent. Eur. J. Med. Chem. 2019, 183, 111730. [Google Scholar] [CrossRef]
- Huang, Y.; Liu, S.; Wu, R.; Zhang, L.; Zhang, Y.; Hong, H.; Zhang, A.; Xiao, H.; Liu, Y.; Wu, Z.; et al. Synthesis and preliminary evaluation of a novel glutamine derivative: (2S,4S)4–[(18)F]FEBGln. Bioorg. Med. Chem. Lett. 2019, 29, 1047–1050. [Google Scholar] [CrossRef]
- McConathy, J.; Martarello, L.; Malveaux, E.J.; Camp, V.M.; Simpson, N.E.; Simpson, C.P.; Bowers, G.D.; Olson, J.J.; Goodman, M.M. Radiolabeled amino acids for tumor imaging with PET: Radiosynthesis and biological evaluation of 2–amino–3–[18F]fluoro–2–methylpropanoic acid and 3–[18F]fluoro–2–methyl–2–(methylamino)propanoic acid. J. Med. Chem. 2002, 45, 2240–2249. [Google Scholar] [CrossRef] [PubMed]
- Sommerauer, M.; Galldiks, N.; Barbe, M.T.; Stoffels, G.; Willuweit, A.; Coenen, H.H.; Schroeter, M.; Timmermann, L.; Fink, G.R.; Langen, K.J. Cis–4–[18F]fluoro–D–proline detects neurodegeneration in patients with akinetic–rigid parkinsonism. Nucl. Med. Commun. 2019, 40, 383–387. [Google Scholar] [CrossRef]
- Yu, W.; McConathy, J.; Williams, L.; Camp, V.M.; Malveaux, E.J.; Zhang, Z.; Olson, J.J.; Goodman, M.M. Synthesis, radiolabeling, and biological evaluation of (R)– and (S)–2–amino–3–[(18)F]fluoro–2–methylpropanoic acid (FAMP) and (R)– and (S)–3–[(18)F]fluoro–2–methyl–2–N–(methylamino)propanoic acid (NMeFAMP) as potential PET radioligands for imaging brain tumors. J. Med. Chem. 2010, 53, 876–886. [Google Scholar]
- Liu, S.; Wu, R.; Sun, Y.; Ploessl, K.; Zhang, Y.; Liu, Y.; Wu, Z.; Zhu, L.; Kung, H.F. Design, synthesis and evaluation of a novel glutamine derivative (2S,4R)–2–amino–4–cyano–4–[18F]fluorobutanoic acid. New J. Chem. 2020, 44, 9109–9117. [Google Scholar] [CrossRef]
- Turkbey, B.; Mena, E.; Shih, J.; Pinto, P.A.; Merino, M.J.; Lindenberg, M.L.; Bernardo, M.; McKinney, Y.L.; Adler, S.; Owenius, R.; et al. Localized Prostate Cancer Detection with (18)F FACBC PET/CT: Comparison with MR Imaging and Histopathologic Analysis. Radiology 2014, 270, 849–856. [Google Scholar] [CrossRef]
- Galldiks, N.; Langen, K.J. Amino Acid PET—An Imaging Option to Identify Treatment Response, Posttherapeutic Effects, and Tumor Recurrence? Front. Neurol. 2016, 7, 120. [Google Scholar] [CrossRef]
- Huang, C.; McConathy, J. Radiolabeled amino acids for oncologic imaging. J. Nucl. Med. 2013, 54, 1007–1010. [Google Scholar] [CrossRef]
- Zhang, Y.; Chung, S.F.; Tam, S.Y.; Leung, Y.C.; Guan, X. Arginine deprivation as a strategy for cancer therapy: An insight into drug design and drug combination. Cancer Lett. 2021, 502, 58–70. [Google Scholar] [CrossRef]
- Fung, M.K.L.; Chan, G.C.F. Drug–induced amino acid deprivation as strategy for cancer therapy. J. Hematol. Oncol. 2017, 10, 144. [Google Scholar] [CrossRef]
- Cancer Cell Line Encyclopedia. Available online: https://portals.broadinstitute.org/ccle (accessed on 7 June 2022).
- Salmanoglu, E. The role of [18F]FDG PET/CT for gastric cancer management. Nucl. Med. Rev. Cent. East Eur. 2021, 24, 99–103. [Google Scholar] [CrossRef]
- Shreve, P.; Anzai, Y.; Wahl, R. Pitfalls in oncologic diagnosis with FDG PET imaging: Physiologic and benign variants. Radiographics 1999, 19, 61–77. [Google Scholar] [CrossRef]
- Schoder, H.; Ong, S.C. Fundamentals of molecular imaging: Rationale and applications with relevance for radiation oncology. Semin. Nucl. Med. 2008, 38, 119–128. [Google Scholar] [CrossRef] [PubMed][Green Version]
- Sundin, A.; Garske, U.; Orlefors, H. Nuclear imaging of neuroendocrine tumours. Best Pract. Res. Clin. Endocrinol Metab. 2007, 21, 69–85. [Google Scholar] [CrossRef]
- So, A.; Pointon, O.; Hodgson, R.; Burgess, J. An assessment of 18F–FDG PET/CT for thoracic screening and risk stratification of pulmonary nodules in multiple endocrine neoplasia type 1. Clinic. Endocrinol. 2018, 88, 683–691. [Google Scholar] [CrossRef] [PubMed]
- Humbert, A.L.; Lecoanet, G.; Moog, S.; Bouderraoui, F.; Bresler, L.; Vignaud, J.M.; Chevalier, E.; Brunaud, L.; Klein, M.; Cuny, T. The computed tomography adrenal wash–out analysis properly classifies cortisol secreting adrenocortical adenomas. Endocrine 2018, 59, 529–537. [Google Scholar] [CrossRef]
- Linden, H.; Clark, A.; Fowler, A.; Novakova, A.; Mankoff, D.; Dehdashti, F. Abstract OT1–06–04: [ 18 F] fluoroestradiol (FES) PET as a predictive measure for endocrine therapy in women with newly diagnosed metastatic breast cancer. Cancer Res. 2018, 78, OT1-06-04. [Google Scholar] [CrossRef]
- Eder, M.; Schäfer, M.; Bauder–Wüst, U.; Hull, W.E.; Wängler, C.; Mier, W.; Haberkorn, U.; Eisenhut, M. 68Ga–Complex Lipophilicity and the Targeting Property of a Urea–Based PSMA Inhibitor for PET Imaging. Bioconjug. Chem. 2012, 23, 688–697. [Google Scholar] [CrossRef]
- Giesel, F.L.; Hadaschik, B.; Cardinale, J.; Radtke, J.; Vinsensia, M.; Lehnert, W.; Kesch, C.; Tolstov, Y.; Singer, S.; Grabe, N. F–18 labelled PSMA–1007: Biodistribution, radiation dosimetry and histopathological validation of tumor lesions in prostate cancer patients. Eur. J. Nucl. Med. Mol. I. 2017, 44, 678–688. [Google Scholar] [CrossRef]
- Rowe, S.P.; Buck, A.; Bundschuh, R.A.; Lapa, C.; Serfling, S.E.; Derlin, T.; Higuchi, T.; Gorin, M.A.; Pomper, M.G.; Werner, R.A. [18F]DCFPyL PET/CT for Imaging of Prostate Cancer. Nuklearmedizin–Nucl. Med. 2022, 61, 240–246. [Google Scholar] [CrossRef]
- Loktev, A.; Lindner, T.; Mier, W.; Debus, J.; Altmann, A.; Jäger, D.; Giesel, F.; Kratochwil, C.; Barthe, P.; Roumestand, C.; et al. Tumor–Imaging Method Targeting Cancer–Associated Fibroblasts. J. Nucl.Med. 2018, 59, 1423. [Google Scholar] [CrossRef]
- Lindner, T.; Loktev, A.; Altmann, A.; Giesel, F.; Kratochwil, C.; Debus, J.; Jäger, D.; Mier, W.; Haberkorn, U. Development of Quinoline–Based Theranostic Ligands for the Targeting of Fibroblast Activation Protein. J. Nucl.Med. 2018, 59, 1415. [Google Scholar] [CrossRef] [PubMed]
- Palmisciano, P.; Watanabe, G.; Conching, A.; Ogasawara, C.; Ferini, G.; Bin–Alamer, O.; Haider, A.S.; Sabini, M.G.; Cuttone, G.; Cosentino, S. The Role of [68Ga]Ga–DOTA–SSTR PET Radiotracers in Brain Tumors: A Systematic Review of the Literature and Ongoing Clinical Trials. Cancer 2022, 14, 2925. [Google Scholar] [CrossRef] [PubMed]
- Ahmadi Bidakhvidi, N.; Goffin, K.; Dekervel, J.; Baete, K.; Nackaerts, K.; Clement, P.; Van Cutsem, E.; Verslype, C.; Deroose, C.M. Peptide Receptor Radionuclide Therapy Targeting the Somatostatin Receptor: Basic Principles, Clinical Applications and Optimization Strategies. Cancer 2022, 14, 129. [Google Scholar] [CrossRef] [PubMed]
- Vaz, S.C.; Oliveira, F.; Herrmann, K.; Veit–Haibach, P. Nuclear medicine and molecular imaging advances in the 21st century. Br. J. Radiol. 2020, 93, 20200095. [Google Scholar] [CrossRef]
- Parente, A.; van Waarde, A.; Shoji, A.; de Paula Faria, D.; Maas, B.; Zijlma, R.; Dierckx, R.A.; Langendijk, J.A.; de Vries, E.F.; Doorduin, J. PET Imaging with S–[11C]Methyl–L–Cysteine and L–[Methyl–11C]Methionine in Rat Models of Glioma, Glioma Radiotherapy, and Neuroinflammation. Mol. Imaging Biol. 2018, 20, 465–472. [Google Scholar] [CrossRef]
- Verhoeven, J.; Bolcaen, J.; de Meulenaere, V.; Kersemans, K.; Descamps, B.; Donche, S.; van den Broecke, C.; Boterberg, T.; Kalala, J.P.; Deblaere, K.; et al. Technical feasibility of [(18)F]FET and [(18)F]FAZA PET guided radiotherapy in a F98 glioblastoma rat model. Radiat. Oncol. 2019, 14, 89. [Google Scholar] [CrossRef]
- Cosentino, S.; Scopelliti, F.; Murè, G.; Baldari, S.; Ippolito, M. 11C–Methionine. In Radiopharmaceuticals: A Guide to PET/CT and PET/MRI; Calabria, F., Schillaci, O., Eds.; Springer International Publishing: Cham, Switzerland, 2020; pp. 193–209. [Google Scholar]
- Götz, I.; Grosu, A.L. [(18)F]FET–PET Imaging for Treatment and Response Monitoring of Radiation Therapy in Malignant Glioma Patients – A Review. Front. Oncol. 2013, 3, 104. [Google Scholar] [CrossRef] [PubMed]
- Clément, A.; Zaragori, T.; Filosa, R.; Ovdiichuk, O.; Beaumont, M.; Collet, C.; Roeder, E.; Martin, B.; Maskali, F.; Barberi–Heyob, M.; et al. Multi–tracer and multiparametric PET imaging to detect the IDH mutation in glioma: A preclinical translational in vitro, in vivo, and ex vivo study. Cancer Imaging 2022, 22, 16. [Google Scholar] [CrossRef] [PubMed]
- Doi, Y.; Kanagawa, M.; Maya, Y.; Tanaka, A.; Oka, S.; Nakata, N.; Toyama, M.; Matsumoto, H.; Shirakami, Y. Evaluation of trans–1–amino–3–18F–fluorocyclobutanecarboxylic acid accumulation in low–grade glioma in chemically induced rat models: PET and autoradiography compared with morphological images and histopathological findings. Nucl. Med. Biol. 2015, 42, 664–672. [Google Scholar] [CrossRef] [PubMed]
- Mikou, A.; Cabayé, A.; Goupil, A.; Bertrand, H.O.; Mothet, J.P.; Acher, F.C. Asc–1 Transporter (SLC7A10): Homology Models And Molecular Dynamics Insights Into The First Steps Of The Transport Mechanism. Sci. Rep. 2020, 10, 3731. [Google Scholar] [CrossRef] [PubMed]
- Errasti–Murugarren, E.; Fort, J.; Bartoccioni, P.; Díaz, L.; Pardon, E.; Carpena, X.; Espino–Guarch, M.; Zorzano, A.; Ziegler, C.; Steyaert, J.; et al. Amino acid transporter structure and molecular bases for the asymmetry of substrate interaction. Nat. Commun. 2019, 10, 1807. [Google Scholar] [CrossRef] [PubMed]
- Khalil, A.A.; Jameson, M.J.; Broaddus, W.C.; Lin, P.S.; Dever, S.M.; Golding, S.E.; Rosenberg, E.; Valerie, K.; Chung, T.D. The Influence of Hypoxia and pH on Bioluminescence Imaging of Luciferase–Transfected Tumor Cells and Xenografts. Inter. J. Mol. Imaging 2013, 2013, 287697. [Google Scholar] [CrossRef] [PubMed]


Publisher’s Note: MDPI stays neutral with regard to jurisdictional claims in published maps and institutional affiliations. |
© 2022 by the authors. Licensee MDPI, Basel, Switzerland. This article is an open access article distributed under the terms and conditions of the Creative Commons Attribution (CC BY) license (https://creativecommons.org/licenses/by/4.0/).
Share and Cite
Huang, Y.; Zhang, L.; Wang, M.; Li, C.; Zheng, W.; Chen, H.; Liang, Y.; Wu, Z. Optimization of Precursor Synthesis Conditions of (2S,4S)4–[18F]FPArg and Its Application in Glioma Imaging. Pharmaceuticals 2022, 15, 946. https://doi.org/10.3390/ph15080946
Huang Y, Zhang L, Wang M, Li C, Zheng W, Chen H, Liang Y, Wu Z. Optimization of Precursor Synthesis Conditions of (2S,4S)4–[18F]FPArg and Its Application in Glioma Imaging. Pharmaceuticals. 2022; 15(8):946. https://doi.org/10.3390/ph15080946
Chicago/Turabian StyleHuang, Yong, Lu Zhang, Meng Wang, Chengze Li, Wei Zheng, Hualong Chen, Ying Liang, and Zehui Wu. 2022. "Optimization of Precursor Synthesis Conditions of (2S,4S)4–[18F]FPArg and Its Application in Glioma Imaging" Pharmaceuticals 15, no. 8: 946. https://doi.org/10.3390/ph15080946
APA StyleHuang, Y., Zhang, L., Wang, M., Li, C., Zheng, W., Chen, H., Liang, Y., & Wu, Z. (2022). Optimization of Precursor Synthesis Conditions of (2S,4S)4–[18F]FPArg and Its Application in Glioma Imaging. Pharmaceuticals, 15(8), 946. https://doi.org/10.3390/ph15080946