
Lycorine Ameliorates Thioacetamide-Induced Hepatic Fibrosis in Rats: Emphasis on Antioxidant, Anti-Inflammatory, and STAT3 Inhibition Effects


Abstract
1. Introduction
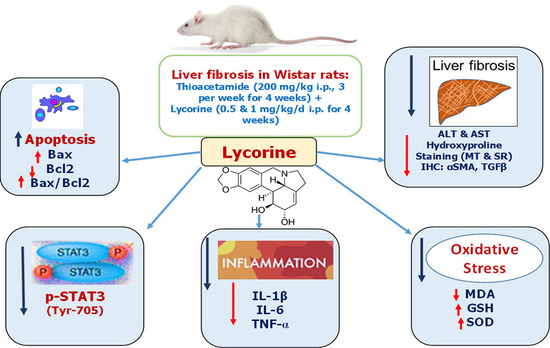
2. Results
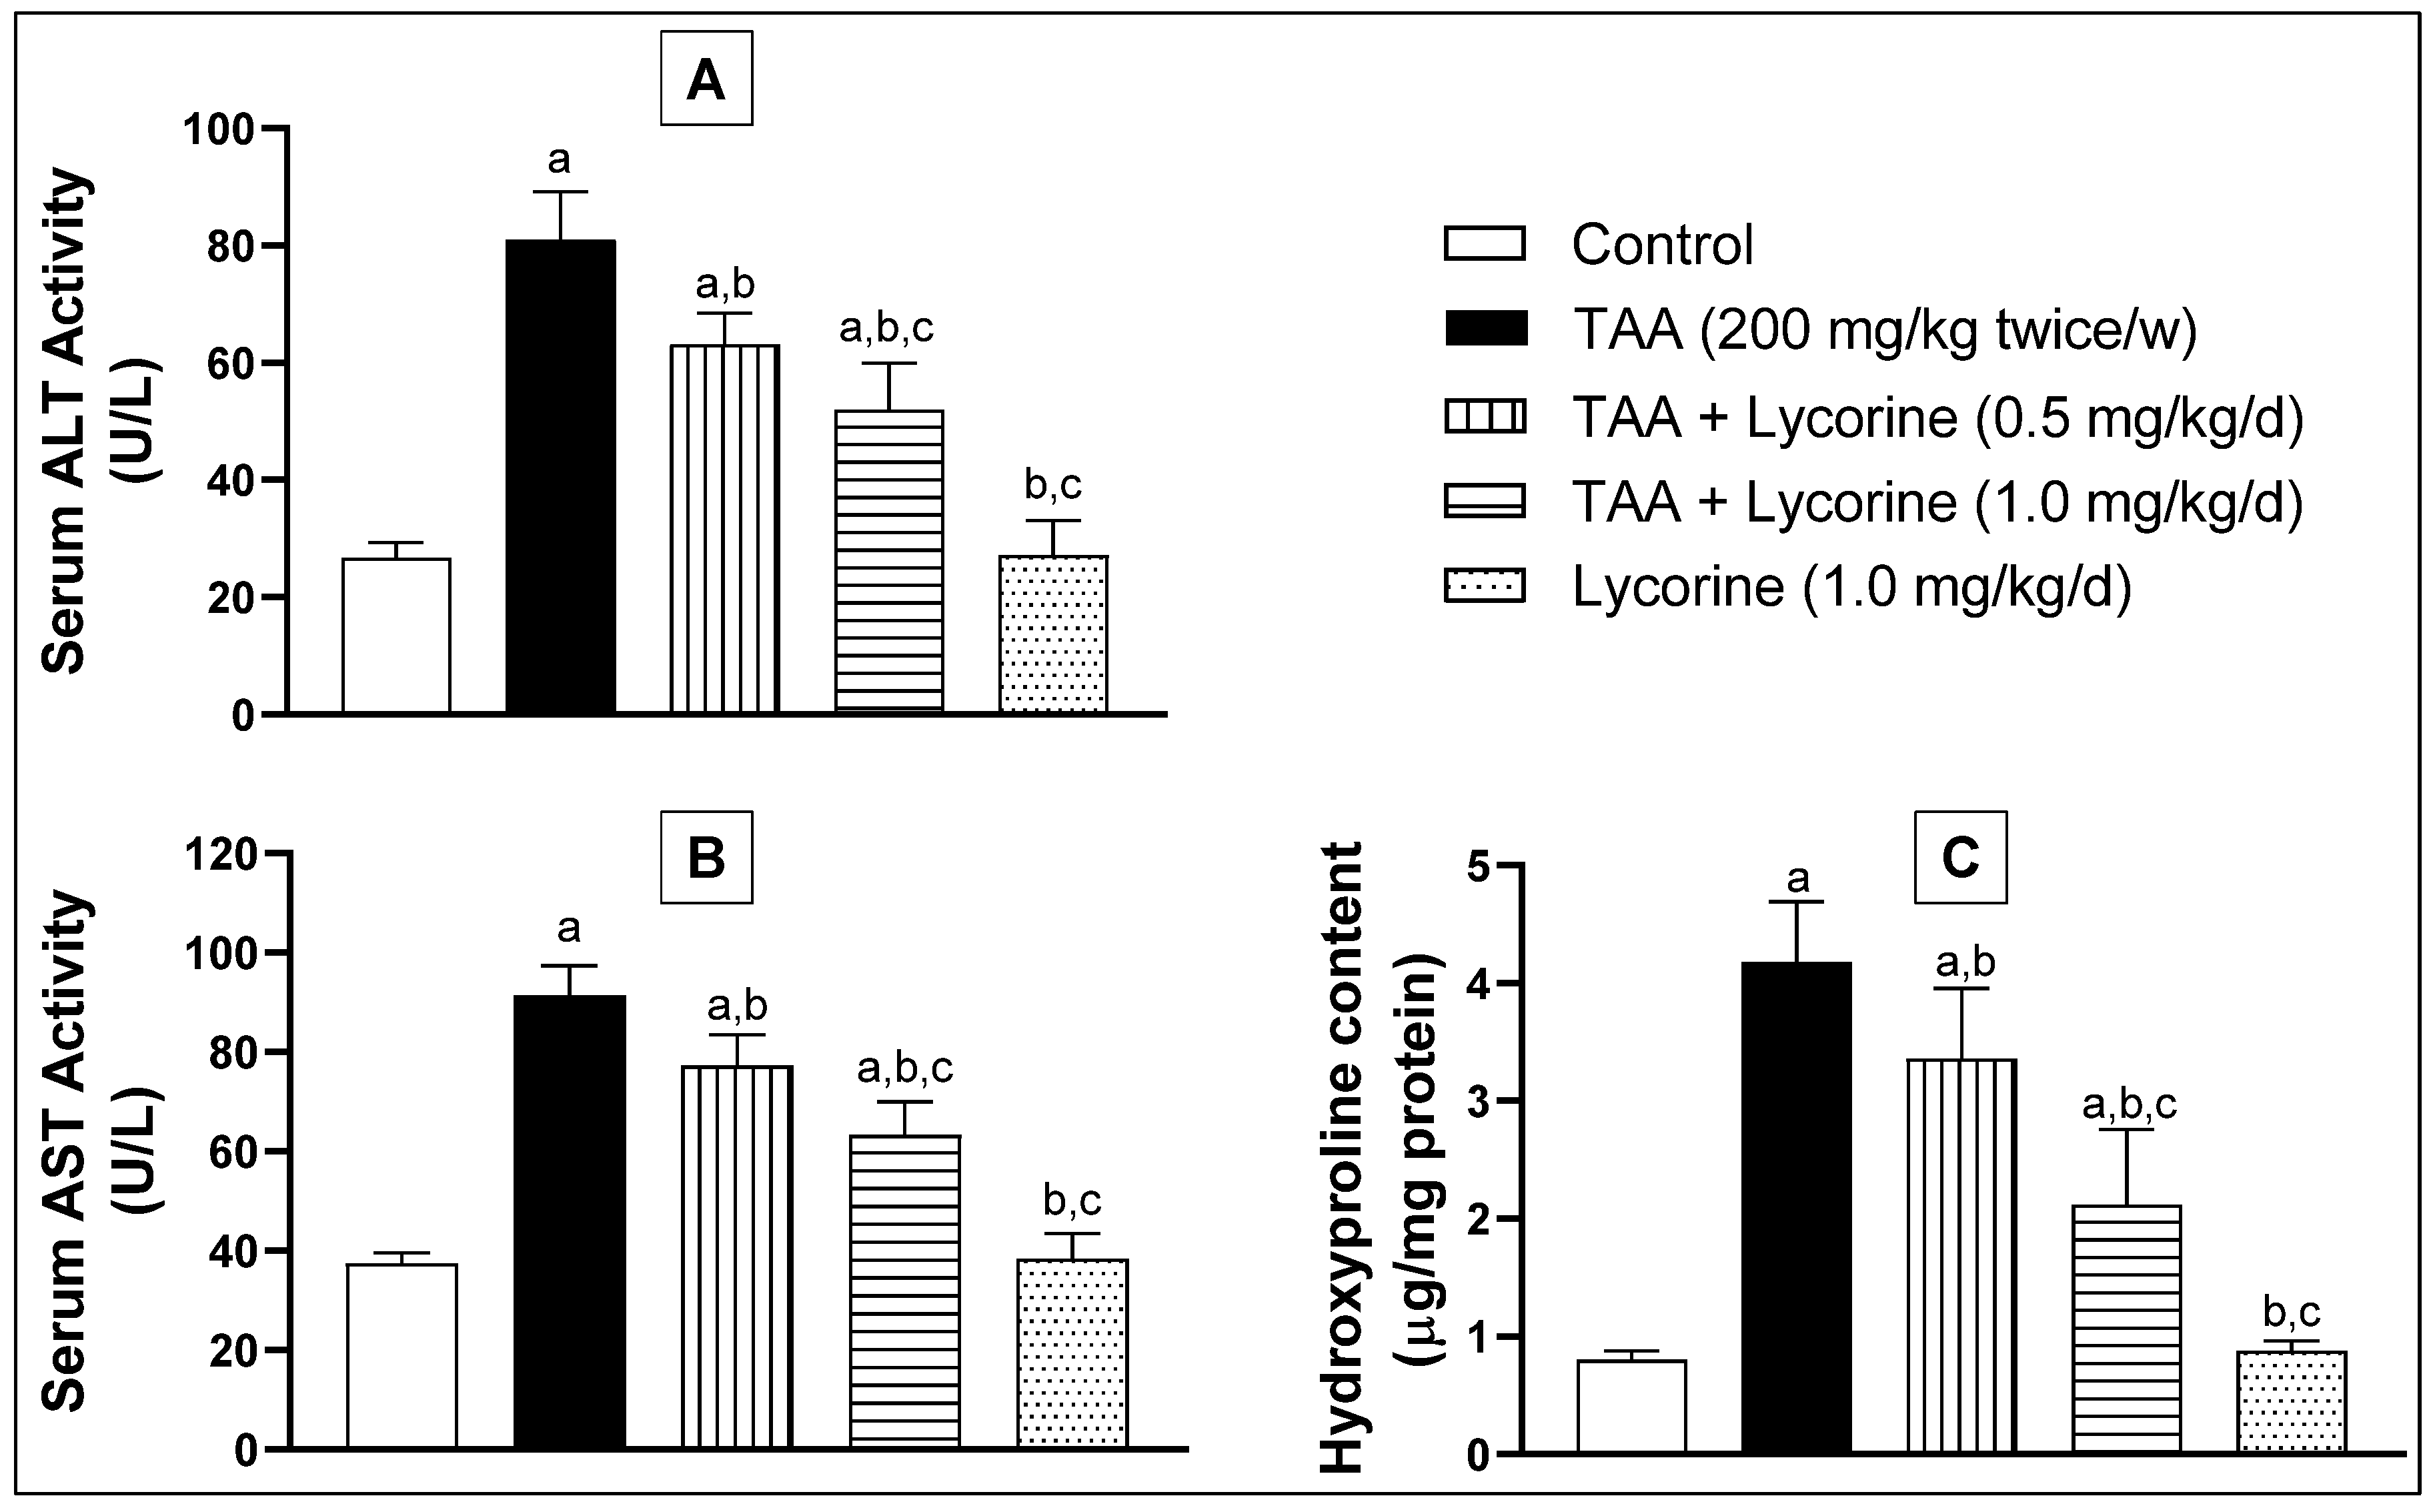
2.1. Assessment of Hepatic Fibrosis
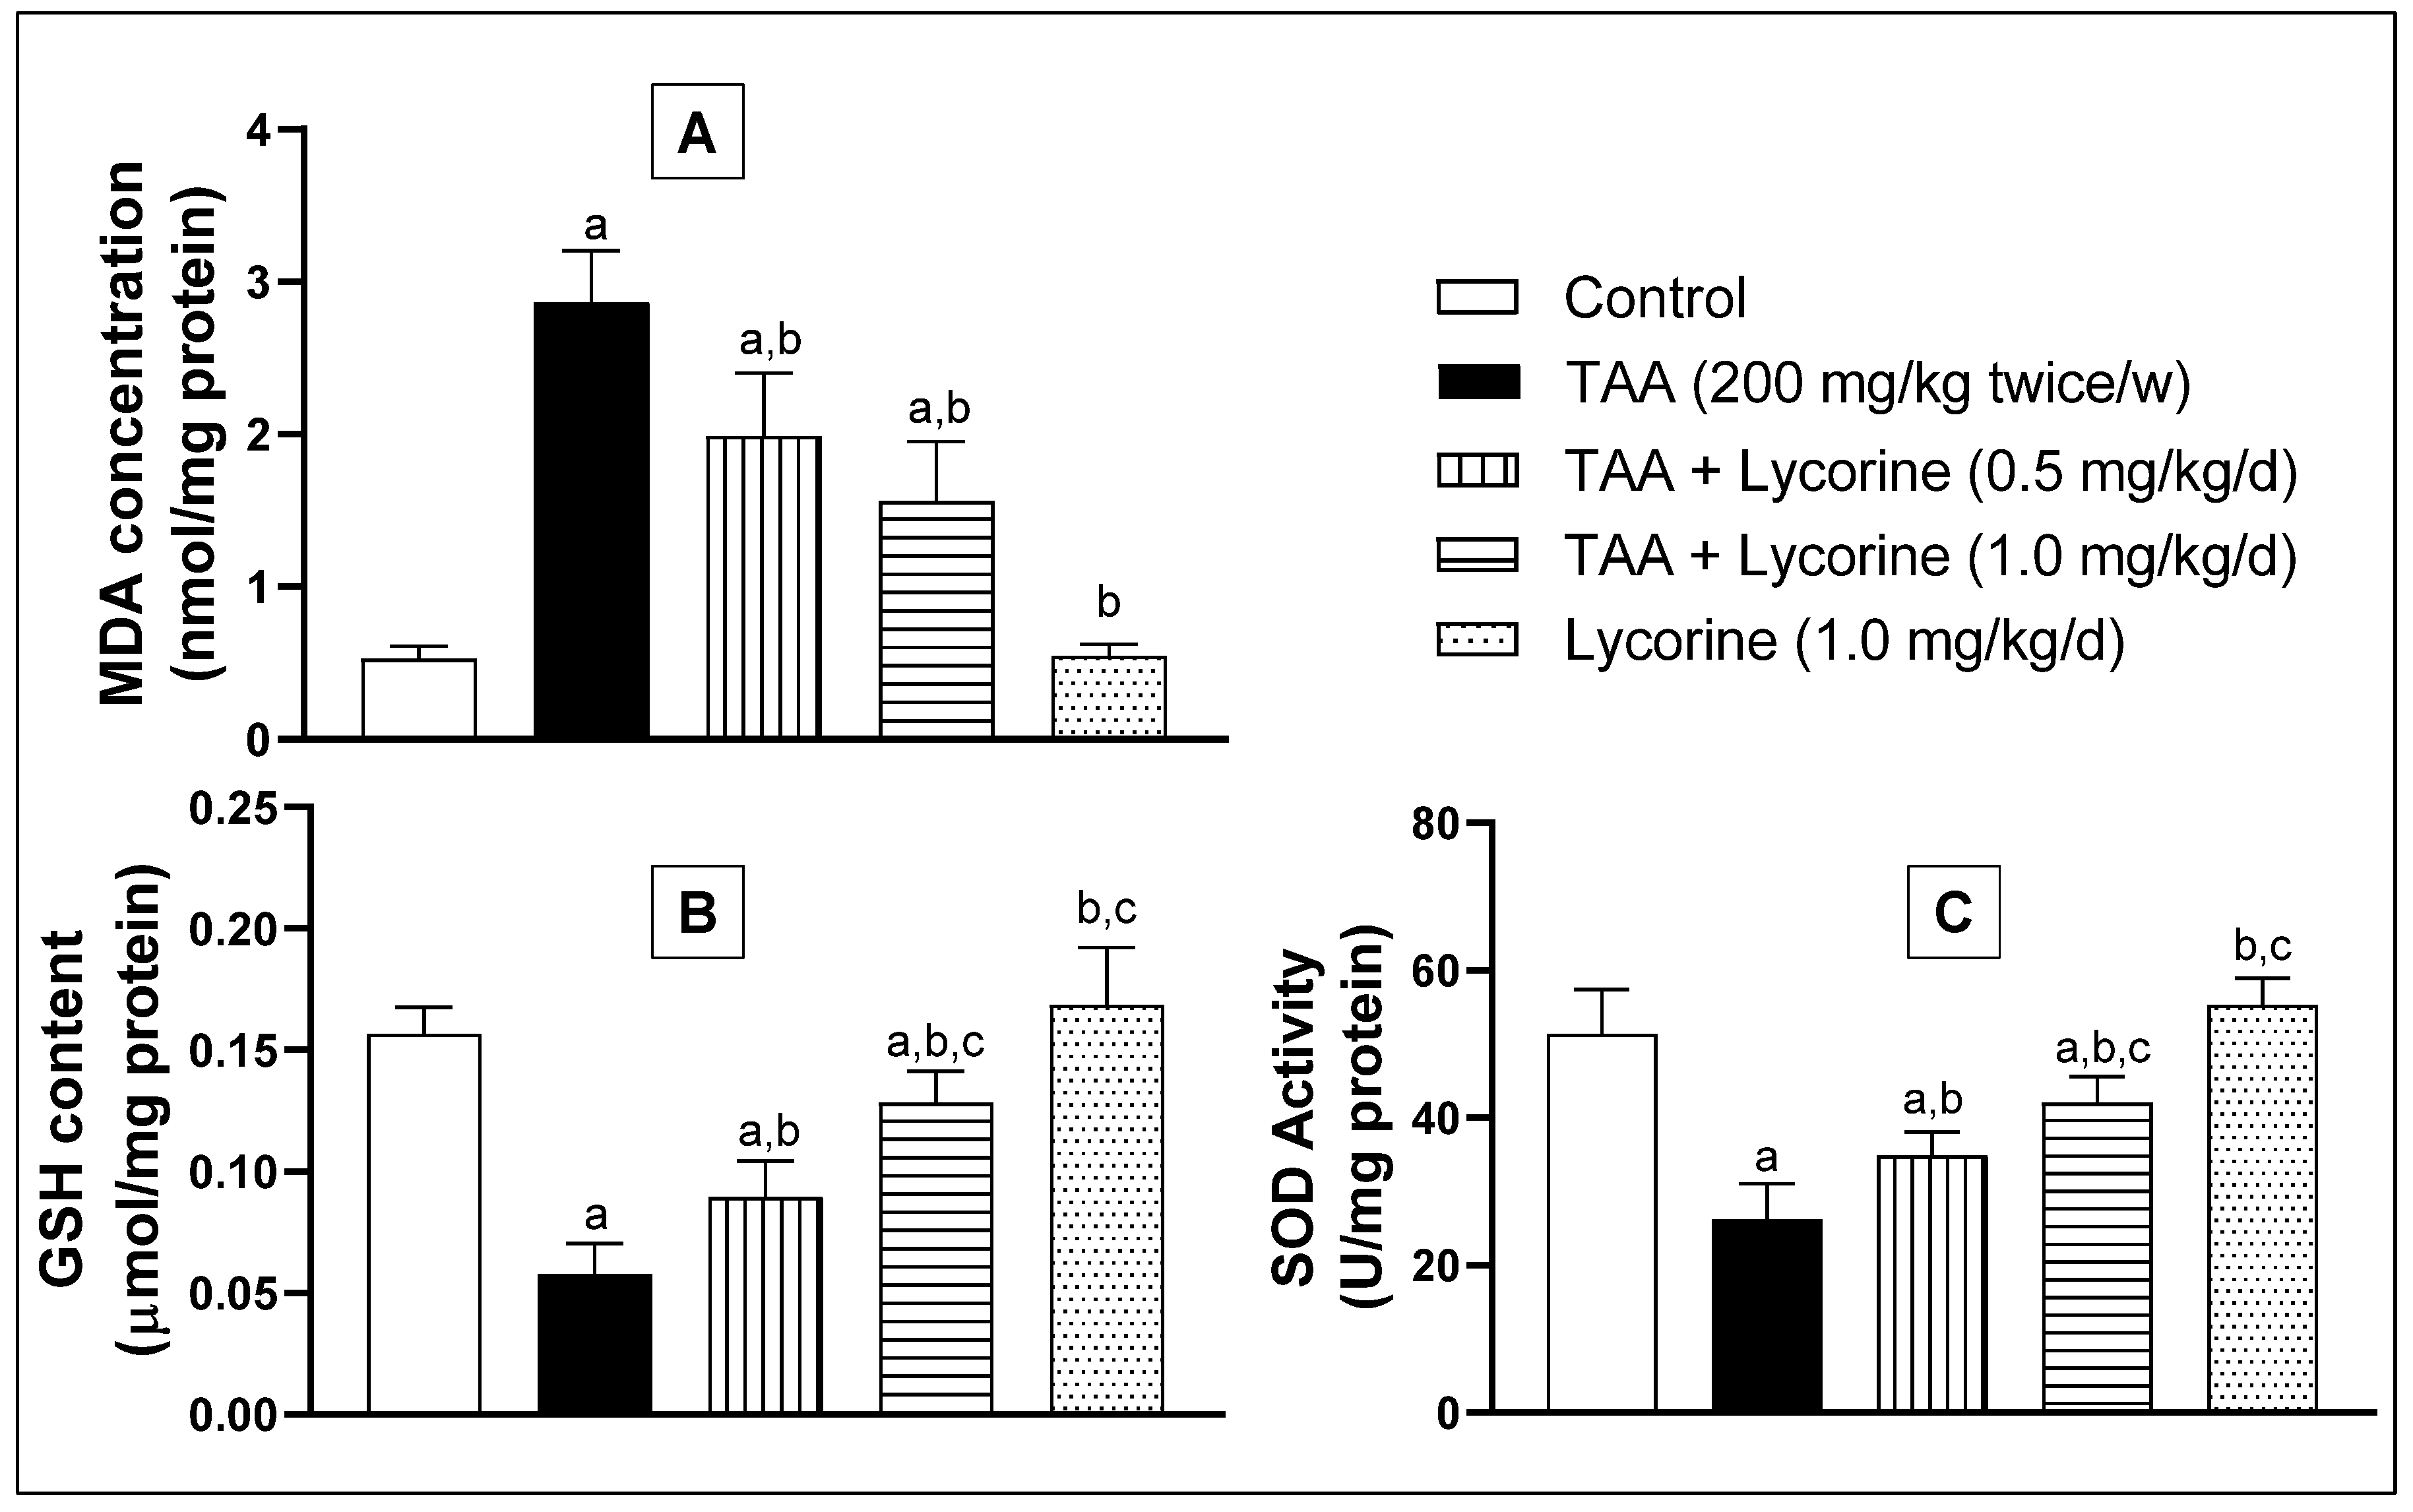
2.2. Assessment of Oxidative Status
2.3. Assessment of Inflammatory Status
2.4. Assessment of STAT3
3. Discussion
4. Materials and Methods
4.1. Chemicals
4.2. Animals
4.3. Experimental Design
4.4. Assessment of Hepatic Fibrosis
4.4.1. Determination of ALT, AST, and Hydroxyproline
4.4.2. Histopathological Examination
4.4.3. Immunohistochemical Staining of α Smooth Muscle Actin (αSMA) and Transforming Growth Factor β (TGFβ1)
4.5. Assessment of Oxidative Status
4.6. Assessment of Inflammatory Status
4.7. Assessment of STAT3 Pathway
4.7.1. Immunohistochemical Staining of Phospho STAT3 (Y705)
4.7.2. Reverse Transcriptase–Polymerase Chain Reaction (RT-PCR) Analyses of Bax and Bcl-2 Gene Expressions
4.8. Determination of the Total Protein Content in Hepatic Homogenates
4.9. Statistical Analysis
5. Conclusions
Author Contributions
Funding
Institutional Review Board Statement
Informed Consent Statement
Data Availability Statement
Acknowledgments
Conflicts of Interest
References
- Rouiller, C. The Liver: Morphology, Biochemistry, Physiology; Academic Press: Cambridge, MA, USA, 2013. [Google Scholar]
- Asrani, S.K.; Devarbhavi, H.; Eaton, J.; Kamath, P.S. Burden of liver diseases in the world. J. Hepatol. 2019, 70, 151–171. [Google Scholar] [CrossRef] [PubMed]
- Bataller, R.; Brenner, D.A. Liver fibrosis. J. Clin. Investig. 2005, 115, 209–218. [Google Scholar] [CrossRef] [PubMed]
- Pinzani, M. Pathophysiology of Liver Fibrosis. Dig. Dis. 2015, 33, 492–497. [Google Scholar] [CrossRef] [PubMed]
- Seki, E.; Brenner, D.A. Recent advancement of molecular mechanisms of liver fibrosis. J. Hepato-Biliary-Pancreat. Sci. 2015, 22, 512–518. [Google Scholar] [CrossRef] [PubMed]
- Novo, E.; Parola, M. Redox mechanisms in hepatic chronic wound healing and fibrogenesis. Fibrogenes. Tissue Repair 2008, 1, 5. [Google Scholar] [CrossRef] [PubMed]
- Dauer, D.J.; Ferraro, B.; Song, L.; Yu, B.; Mora, L.; Buettner, R.; Enkemann, S.; Jove, R.; Haura, E.B. Stat3 regulates genes common to both wound healing and cancer. Oncogene 2005, 24, 3397–3408. [Google Scholar] [CrossRef] [PubMed]
- Levy, D.E.; Darnell, J.E. STATs: Transcriptional control and biological impact. Nat. Rev. Mol. Cell Biol. 2002, 3, 651–662. [Google Scholar] [CrossRef] [PubMed]
- Ogata, H.; Chinen, T.; Yoshida, T.; Kinjyo, I.; Takaesu, G.; Shiraishi, H.; Iida, M.; Kobayashi, T.; Yoshimura, A. Loss of SOCS3 in the liver promotes fibrosis by enhancing STAT3-mediated TGF-β1 production. Oncogene 2006, 25, 2520–2530. [Google Scholar] [CrossRef] [PubMed]
- Hirano, T.; Ishihara, K.; Hibi, M. Roles of STAT3 in mediating the cell growth, differentiation and survival signals relayed through the IL-6 family of cytokine receptors. Oncogene 2000, 19, 2548–2556. [Google Scholar] [CrossRef] [PubMed]
- Hiraganahalli, B.D.; Chinampudur, V.C.; Dethe, S.; Mundkinajeddu, D.; Pandre, M.K.; Balachandran, J.; Agarwal, A. Hepatoprotective and antioxidant activity of standardized herbal extracts. Pharmacogn. Mag. 2012, 8, 116–123. [Google Scholar] [CrossRef]
- De Leo, P.; Dalessandro, G.; De Santis, A.; Arrigoni, O. Inhibitory effect of lycorine on cell division and cell elongation. Plant Cell Physiol. 1973, 14, 481–486. [Google Scholar] [CrossRef]
- Liu, X.S.; Jiang, J.; Jiao, X.Y.; Wu, Y.E.; Lin, J.H.; Cai, Y.M. Lycorine induces apoptosis and down-regulation of Mcl-1 in human leukemia cells. Cancer Lett. 2009, 274, 16–24. [Google Scholar] [CrossRef] [PubMed]
- McNulty, J.; Nair, J.J.; Bastida, J.; Pandey, S.; Griffin, C. Structure-activity studies on the lycorine pharmacophore: A potent inducer of apoptosis in human leukemia cells. Phytochemistry 2009, 70, 913–919. [Google Scholar] [CrossRef] [PubMed]
- Oleyede, K.G.; Oke, M.J.; Raji, Y.; Olugbade, T. Antioxidant and Anticonvulsant Alkaloids in Crinum ornatum Bulb Extract. World J. Chem. 2010, 5, 26–31. [Google Scholar]
- Çitoǧlu, G.S.; Acikara, O.B.; Yilmaz, B.S.; Özbek, H. Evaluation of analgesic, anti-inflammatory and hepatoprotective effects of lycorine from Sternbergia fisheriana (Herbert) Rupr. Fitoterapia 2012, 83, 81–87. [Google Scholar] [CrossRef]
- Wu, S.; Qiu, Y.; Shao, Y.; Yin, S.; Wang, R.; Pang, X.; Ma, J.; Zhang, C.; Wu, B.; Koo, S.; et al. Lycorine Displays Potent Antitumor Efficacy in Colon Carcinoma by Targeting STAT3. Front. Pharmacol. 2018, 9, 881. [Google Scholar] [CrossRef] [PubMed]
- Liang, Q.; Cai, W.; Zhao, Y.; Xu, H.; Tang, H.; Chen, D.; Qian, F.; Sun, L. Lycorine ameliorates bleomycin-induced pulmonary fibrosis via inhibiting NLRP3 inflammasome activation and pyroptosis. Pharmacol. Res. 2020, 158, 104884. [Google Scholar] [CrossRef] [PubMed]
- Schimmel, K.; Jung, M.; Foinquinos, A.; José, G.S.; Beaumont, J.; Bock, K.; Grote-Levi, L.; Xiao, K.; Bär, C.; Pfanne, A.; et al. Natural compound library screening identifies new molecules for the treatment of cardiac fibrosis and diastolic dysfunction. Circulation 2020, 141, 751–767. [Google Scholar] [CrossRef]
- Ni, T.; Huang, X.; Pan, S.; Lu, Z. Dihydrolycorine Attenuates Cardiac Fibrosis and Dysfunction by Downregulating Runx1 following Myocardial Infarction. Oxid. Med. Cell. Longev. 2021, 2021, 8528239. [Google Scholar] [CrossRef]
- Wu, J.; Fu, Y.; Wu, Y.X.; Wu, Z.X.; Wang, Z.H.; Li, P. Lycorine ameliorates isoproterenol-induced cardiac dysfunction mainly via inhibiting inflammation, fibrosis, oxidative stress and apoptosis. Bioengineered 2021, 12, 5583–5594. [Google Scholar] [CrossRef]
- Wallace, M.; Hamesch, K.; Lunova, M.; Kim, Y.; Weiskirchen, R.; Strnad, P.; Friedman, S.L. Standard Operating Procedures in Experimental Liver Research: Thioacetamide model in mice and rats. Lab. Anim. 2015, 49, 21–29. [Google Scholar] [CrossRef] [PubMed]
- Lam, P.; Cheung, F.; Tan, H.Y.; Wang, N.; Yuen, M.F.; Feng, Y. Hepatoprotective effects of chinese medicinal herbs: A focus on anti-inflammatory and anti-oxidative activities. Int. J. Mol. Sci. 2016, 17, 465. [Google Scholar] [CrossRef]
- Ilavenil, S.; Kaleeswaran, B.; Sumitha, P.; Tamilvendan, D.; Ravikumar, S. Protection of human erythrocyte using Crinum asiaticum extract and lycorine from oxidative damage induced by 2-amidinopropane. Saudi J. Biol. Sci. 2011, 18, 181–187. [Google Scholar] [CrossRef] [PubMed]
- Kang, J.; Zhang, Y.; Cao, X.; Fan, J.; Li, G.; Wang, Q.; Diao, Y.; Zhao, Z.; Luo, L.; Yin, Z. Lycorine inhibits lipopolysaccharide-induced iNOS and COX-2 up-regulation in RAW264.7 cells through suppressing P38 and STATs activation and increases the survival rate of mice after LPS challenge. Int. Immunopharmacol. 2012, 12, 249–256. [Google Scholar] [CrossRef] [PubMed]
- Crespo Yanguas, S.; Cogliati, B.; Willebrords, J.; Maes, M.; Colle, I.; van den Bossche, B.; de Oliveira, C.P.M.S.; Andraus, W.; Alves, V.A.; Leclercq, I.; et al. Experimental models of liver fibrosis. Arch. Toxicol. 2016, 90, 1025–1048. [Google Scholar] [CrossRef] [PubMed]
- Chilakapati, J.; Korrapati, M.C.; Shankar, K.; Hill, R.A.; Warbritton, A.; Latendresse, J.R.; Mehendale, H.M. Role of CYP2E1 and saturation kinetics in the bioactivation of thioacetamide: Effects of diet restriction and phenobarbital. Toxicol. Appl. Pharmacol. 2007, 219, 72–84. [Google Scholar] [CrossRef] [PubMed]
- Kang, J.S.; Wanibuchi, H.; Morimura, K.; Wongpoomchai, R.; Chusiri, Y.; Gonzalez, F.J.; Fukushima, S. Role of CYP2E1 in thioacetamide-induced mouse hepatotoxicity. Toxicol. Appl. Pharmacol. 2008, 228, 295–300. [Google Scholar] [CrossRef] [PubMed]
- Hajovsky, H.; Hu, G.; Koen, Y.; Sarma, D.; Cui, W.; Moore, D.S.; Staudinger, J.L.; Hanzlik, R.P. Metabolism and toxicity of thioacetamide and thioacetamide S-Oxide in rat hepatocytes. Chem. Res. Toxicol. 2012, 25, 1955–1963. [Google Scholar] [CrossRef] [PubMed]
- Mederacke, I.; Hsu, C.C.; Troeger, J.S.; Huebener, P.; Mu, X.; Dapito, D.H.; Pradere, J.P.; Schwabe, R.F. Fate tracing reveals hepatic stellate cells as dominant contributors to liver fibrosis independent of its aetiology. Nat. Commun. 2013, 4, 2823. [Google Scholar] [CrossRef]
- Iwaisako, K.; Jiang, C.; Zhang, M.; Cong, M.; Moore-Morris, T.J.; Park, T.J.; Liu, X.; Xu, J.; Wang, P.; Paik, Y.H.; et al. Origin of myofibroblasts in the fibrotic liver in mice. Proc. Natl. Acad. Sci. USA 2014, 111, E3297–E3305. [Google Scholar] [CrossRef] [PubMed]
- Friedman, S.L. Mechanisms of Hepatic Fibrogenesis. Gastroenterology 2008, 134, 1655–1669. [Google Scholar] [CrossRef] [PubMed]
- Ricard-Blum, S.; Baffet, G.; Théret, N. Molecular and tissue alterations of collagens in fibrosis. Matrix Biol. 2018, 68–69, 122–149. [Google Scholar] [CrossRef] [PubMed]
- Voisin, A.; Damon-Soubeyrand, C.; Bravard, S.; Saez, F.; Drevet, J.R.; Guiton, R. Differential expression and localisation of TGF-β isoforms and receptors in the murine epididymis. Sci. Rep. 2020, 10, 995. [Google Scholar] [CrossRef] [PubMed]
- Prud’homme, G.J. Pathobiology of transforming growth factor β in cancer, fibrosis and immunologic disease, and therapeutic considerations. Lab. Investig. 2007, 87, 1077–1091. [Google Scholar] [CrossRef] [PubMed]
- Chung, J.Y.F.; Chan, M.K.K.; Li, J.S.F.; Chan, A.S.W.; Tang, P.C.T.; Leung, K.T.; To, K.F.; Lan, H.Y.; Tang, P.M.K. TGF-β Signaling: From Tissue Fibrosis to Tumor Microenvironment. Int. J. Mol. Sci. 2021, 22, 7575. [Google Scholar] [CrossRef]
- Xu, M.Y.; Hu, J.J.; Shen, J.; Wang, M.L.; Zhang, Q.Q.; Qu, Y.; Lu, L.G. Stat3 signaling activation crosslinking of TGF-β1 in hepatic stellate cell exacerbates liver injury and fibrosis. Biochim. Biophys. Acta-Mol. Basis Dis. 2014, 1842, 2237–2245. [Google Scholar] [CrossRef]
- Ilavenil, S.; Karthik, D.; Arasu, M.V.; Vijayakumar, M.; Srigopalram, S.; Arokiyaraj, S.; Ravikumar, S.; Choi, K.C.; Ravikumar, S. Hepatoprotective mechanism of lycorine against carbon tetrachloride induced toxicity in swiss albino mice—A proteomic approach Keywords: Lycorine CCl 4 Oxidative stress 2D gel MALDI-TOF-MS ATP synthase Regucalcin HSP 60. Asian Pac. J. Reprod. 2015, 4, 123–128. [Google Scholar] [CrossRef]
- Robert, S.; Gicquel, T.; Bodin, A.; Lagente, V.; Boichot, E. Characterization of the MMP/TIMP imbalance and collagen production induced by IL-1 β or TNF-α release from human hepatic stellate cells. PLoS ONE 2016, 11, e0153118. [Google Scholar] [CrossRef] [PubMed]
- Mikami, M.; Kitahara, M.; Kitano, M.; Ariki, Y.; Mimaki, Y.; Sashida, Y.; Yamazaki, M.; Yui, S. Suppressive activity of lycoricidinol (narciclasine) against cytotoxicity of neutrophil-derived calprotectin, and its suppressive effect on rat adjuvant arthritis model. Biol. Pharm. Bull. 1999, 22, 674–678. [Google Scholar] [CrossRef][Green Version]
- Zhao, J.; Qi, Y.F.; Yu, Y.R. STAT3: A key regulator in liver fibrosis. Ann. Hepatol. 2021, 21, 100224. [Google Scholar] [CrossRef]
- Choi, S.; Jung, H.J.; Kim, M.W.; Kang, J.H.; Shin, D.; Jang, Y.S.; Yoon, Y.S.; Oh, S.H. A novel STAT3 inhibitor, STX-0119, attenuates liver fibrosis by inactivating hepatic stellate cells in mice. Biochem. Biophys. Res. Commun. 2019, 513, 49–55. [Google Scholar] [CrossRef] [PubMed]
- Lopez, O.N.; Bohanon, F.J.; Wang, X.; Ye, N.; Corsello, T.; Rojas-Khalil, Y.; Chen, H.; Chen, H.; Zhou, J.; Radhakrishnan, R.S. STAT3 Inhibition Suppresses Hepatic Stellate Cell Fibrogenesis: HJC0123, a Potential Therapeutic Agent for Liver Fibrosis. RSC Adv. 2016, 6, 100652. [Google Scholar] [CrossRef] [PubMed]
- Sallam, A.M.; Esmat, A.; Abdel-Naim, A.B. Cucurbitacin-B attenuates CCL4-induced hepatic fibrosis in mice through inhibition of STAT-3. Chem. Biol. Drug Des. 2018, 91, 933–941. [Google Scholar] [CrossRef] [PubMed]
- Fan, J.; Chen, Q.; Wei, L.; Zhou, X.; Wang, R.; Zhang, H. Asiatic acid ameliorates CCL4-induced liver fibrosis in rats: Involvement of Nrf2/ARE, NF-κB/iκBα, and JAK1/STAT3 signaling pathways. Drug Des. Dev. Ther. 2018, 12, 3595. [Google Scholar] [CrossRef] [PubMed]
- Gong, Z.; Ye, H.; Huo, Y.; Wang, L.; Huang, Y.; Huang, M.; Yuan, X. S-allyl-cysteine attenuates carbon tetrachloride-induced liver fibrosis in rats by targeting STAT3/SMAD3 pathway. Am. J. Transl. Res. 2018, 10, 1337–1346. [Google Scholar] [PubMed]
- Lin, I.Y.; Chiou, Y.S.; Wu, L.C.; Tsai, C.Y.; Chen, C.T.; Chuang, W.C.; Lee, M.C.; Lin, C.C.; Lin, T.T.; Chen, S.C.; et al. CCM111 prevents hepatic fibrosis via cooperative inhibition of TGF-β, Wnt and STAT3 signaling pathways. J. Food Drug Anal. 2019, 27, 184–194. [Google Scholar] [CrossRef] [PubMed]
- Liu, J.; Hu, W.X.; He, L.F.; Ye, M.; Li, Y. Effects of lycorine on HL-60 cells via arresting cell cycle and inducing apoptosis. FEBS Lett. 2004, 578, 245–250. [Google Scholar] [CrossRef] [PubMed]
- Li, L.; Dai, H.-J.; Ye, M.; Wang, S.-L.; Xiao, X.-J.; Zheng, J.; Chen, H.-Y.; Luo, Y.-H.; Liu, J. Lycorine induces cell-cycle arrest in the G0/G1 phase in K562 cells via HDAC inhibition. Cancer Cell Int. 2012, 12, 49. [Google Scholar] [CrossRef]
- He, J.; Hong, B.; Bian, M.; Jin, H.; Chen, J.; Shao, J.; Zhang, F.; Zheng, S. Docosahexaenoic acid inhibits hepatic stellate cell activation to attenuate liver fibrosis in a PPARγ-dependent manner. Int. Immunopharmacol. 2019, 75, 105816. [Google Scholar] [CrossRef]
- Koda, Y.; Teratani, T.; Chu, P.-S.; Hagihara, Y.; Mikami, Y.; Harada, Y.; Tsujikawa, H.; Miyamoto, K.; Suzuki, T.; Taniki, N.; et al. CD8+ tissue-resident memory T cells promote liver fibrosis resolution by inducing apoptosis of hepatic stellate cells. Nat. Commun. 2021, 12, 4474. [Google Scholar] [CrossRef] [PubMed]
- Hubrecht, R.C.; Carter, E. The 3Rs and Humane Experimental Technique: Implementing Change. Animals 2019, 9, 754. [Google Scholar] [CrossRef] [PubMed]
- Struck, M.B.; Andrutis, K.A.; Ramirez, H.E.; Battles, A.H. Effect of a short-term fast on ketamine-xylazine anesthesia in rats. J. Am. Assoc. Lab. Anim. Sci. 2011, 50, 344–348. [Google Scholar] [PubMed]
- Bancroft, J.D.; Gamble, M. Theory and Practice of Histological Techniques, 6th ed.; Elsevier Health Sciences: Amsterdam, The Netherlands, 2008. [Google Scholar]
- Buchwalow, I.B.; Böcker, W. Immuno-Histochemistry Basics and Methods; Springer: Heidelberg, Germany, 2010; ISBN 978-3-642-04608-7. [Google Scholar]
- Sun, Y.; Oberley, L.W.; Li, Y. A simple method for clinical assay of superoxide dismutase. Clin. Chem. 1988, 34, 497–500. [Google Scholar] [CrossRef] [PubMed]


| Primer | Sequence | Gene Bank Association Number |
|---|---|---|
| Bax | Forward: 5′-TTCAACTGGGGCCGCGTGG TT-3′ Reverse: 5′-GGAGAGGAGGCCTTCCCAGCCA-3′ | XM_011250780.1 |
| Bcl2 | Forward: 5′-ATCGCTCTGTGGATGACTGAGTAC-3′ Reverse: 5′-AGAGACAGCCAGGAGAAATCAAAC-3′ | XM_0512835.1 |
| GAPDH | Forward: 5′-TCCCTCAAGATTGTCAGCAA-3′ Reverse: 5′-AGATCCACAACGGATACATT-3′ | NM_ 028301.2 |
Publisher’s Note: MDPI stays neutral with regard to jurisdictional claims in published maps and institutional affiliations. |
© 2022 by the authors. Licensee MDPI, Basel, Switzerland. This article is an open access article distributed under the terms and conditions of the Creative Commons Attribution (CC BY) license (https://creativecommons.org/licenses/by/4.0/).
Share and Cite
Alkreathy, H.M.; Esmat, A. Lycorine Ameliorates Thioacetamide-Induced Hepatic Fibrosis in Rats: Emphasis on Antioxidant, Anti-Inflammatory, and STAT3 Inhibition Effects. Pharmaceuticals 2022, 15, 369. https://doi.org/10.3390/ph15030369
Alkreathy HM, Esmat A. Lycorine Ameliorates Thioacetamide-Induced Hepatic Fibrosis in Rats: Emphasis on Antioxidant, Anti-Inflammatory, and STAT3 Inhibition Effects. Pharmaceuticals. 2022; 15(3):369. https://doi.org/10.3390/ph15030369
Chicago/Turabian StyleAlkreathy, Huda Mohammed, and Ahmed Esmat. 2022. "Lycorine Ameliorates Thioacetamide-Induced Hepatic Fibrosis in Rats: Emphasis on Antioxidant, Anti-Inflammatory, and STAT3 Inhibition Effects" Pharmaceuticals 15, no. 3: 369. https://doi.org/10.3390/ph15030369
APA StyleAlkreathy, H. M., & Esmat, A. (2022). Lycorine Ameliorates Thioacetamide-Induced Hepatic Fibrosis in Rats: Emphasis on Antioxidant, Anti-Inflammatory, and STAT3 Inhibition Effects. Pharmaceuticals, 15(3), 369. https://doi.org/10.3390/ph15030369