
USP Reference Standard Monoclonal Antibodies: Tools to Verify Glycan Structure

Abstract
:1. Introduction
2. Results and Discussion
2.1. Glycan Profiling and Proposed Identifications
2.2. Applications for Verification Glycan Structures and Assessing Critical Quality Attributes of mAbs
3. Materials and Methods
3.1. Reagents and Materials
3.2. PNGase Digestion to Remove Glycans from mAbs
3.3. RFMS Labeling of Released Glycans
3.4. Glycan Purification
3.5. UPLC-MS Analysis
3.6. Data Analysis
4. Conclusions
Author Contributions
Funding
Institutional Review Board Statement
Informed Consent Statement
Data Availability Statement
Acknowledgments
Conflicts of Interest
Disclaimer
Abbreviations
References
- De Leoz, M.L.A.; Duewer, D.L.; Fung, A.; Liu, L.; Yau, H.K.; Potter, O.; Staples, G.O.; Furuki, K.; Frenkel, R.; Hu, Y.; et al. NIST Interlaboratory Study on Glycosylation Analysis of Monoclonal Antibodies: Comparison of Results from Diverse Analytical Methods. Mol. Cell. Proteom. 2020, 19, 11–30. [Google Scholar] [CrossRef] [PubMed] [Green Version]
- Wang, T.; Hoi, K.M.; Stöckmann, H.; Wan, C.; Sim, L.C.; Tay, N.H.B.K.S.J.; Poo, C.H.; Woen, S.; Yang, Y.; Zhang, P.; et al. LC/MS-based Intact IgG and Released Glycan Analysis for Bioprocessing Applications. Biotechnol. J. 2018, 13, 1700185. [Google Scholar] [CrossRef] [PubMed]
- Hilliard, M.; Alley, W.R.; McManus, C.A.; Yu, Y.Q.; Hallinan, S.; Gebler, J.; Rudd, P.M. Glycan characterization of the NIST RM monoclonal antibody using a total analytical solution: From sample preparation to data analysis. mAbs 2017, 9, 1349–1359. [Google Scholar] [CrossRef] [PubMed]
- Higel, F.; Sandl, T.; Kao, C.-Y.; Pechinger, N.; Sörgel, F.; Friess, W.; Wolschin, F.; Seidl, A. N-glycans of complex glycosylated biopharmaceuticals and their impact on protein clearance. Eur. J. Pharm. Biopharm. 2019, 139, 123–131. [Google Scholar] [CrossRef] [PubMed]
- Reusch, D.; Tejada, M.L. Fc glycans of therapeutic antibodies as critical quality attributes. Glycobiology 2015, 25, 1325–1334. [Google Scholar] [CrossRef] [PubMed] [Green Version]
- Wang, Z.; Zhu, J.; Lu, H. Antibody glycosylation: Impact on antibody drug characteristics and quality control. Appl. Microbiol. Biotechnol. 2020, 104, 1905–1914. [Google Scholar] [CrossRef] [PubMed]
- Zhao, J.; Peng, W.; Dong, X.; Mechref, Y. Analysis of NIST Monoclonal Antibody Reference Material Glycosylation Using the LC–MS/MS-Based Glycoproteomic Approach. J. Proteome Res. 2021, 20, 818–830. [Google Scholar] [CrossRef] [PubMed]
- Guo, J.; Tu, H.; Chillara, A.K.; Chang, E.; Atouf, F. More comprehensive standards for monitoring glycosylation. Anal. Biochem. 2021, 612, 113896. [Google Scholar] [CrossRef] [PubMed]
- Guo, J.; Tu, H.; Atouf, F. Measurement of macro- and micro-heterogeneity of glycosylation in biopharmaceuticals: A pharmacopeia perspective. Future Drug Discov. 2020, 2, 48. [Google Scholar] [CrossRef]
- Zhang, X.; Reed, C.E.; Birdsall, R.E.; Yu, Y.Q.; Chen, W. High-Throughput Analysis of Fluorescently Labeled N-Glycans Derived from Biotherapeutics Using an Automated LC-MS-Based Solution. SLAS Technol. Transl. Life Sci. Innov. 2020, 25, 380–387. [Google Scholar] [CrossRef] [PubMed]
- Lauber, M.A.; Yu, Y.-Q.; Brousmiche, D.W.; Hua, Z.; Koza, S.M.; Magnelli, P.; Guthrie, E.; Taron, C.H.; Fountain, K.J. Rapid Preparation of Released N-Glycans for HILIC Analysis Using a Labeling Reagent that Facilitates Sensitive Fluorescence and ESI-MS Detection. Anal. Chem. 2015, 87, 5401–5409. [Google Scholar] [CrossRef] [PubMed]
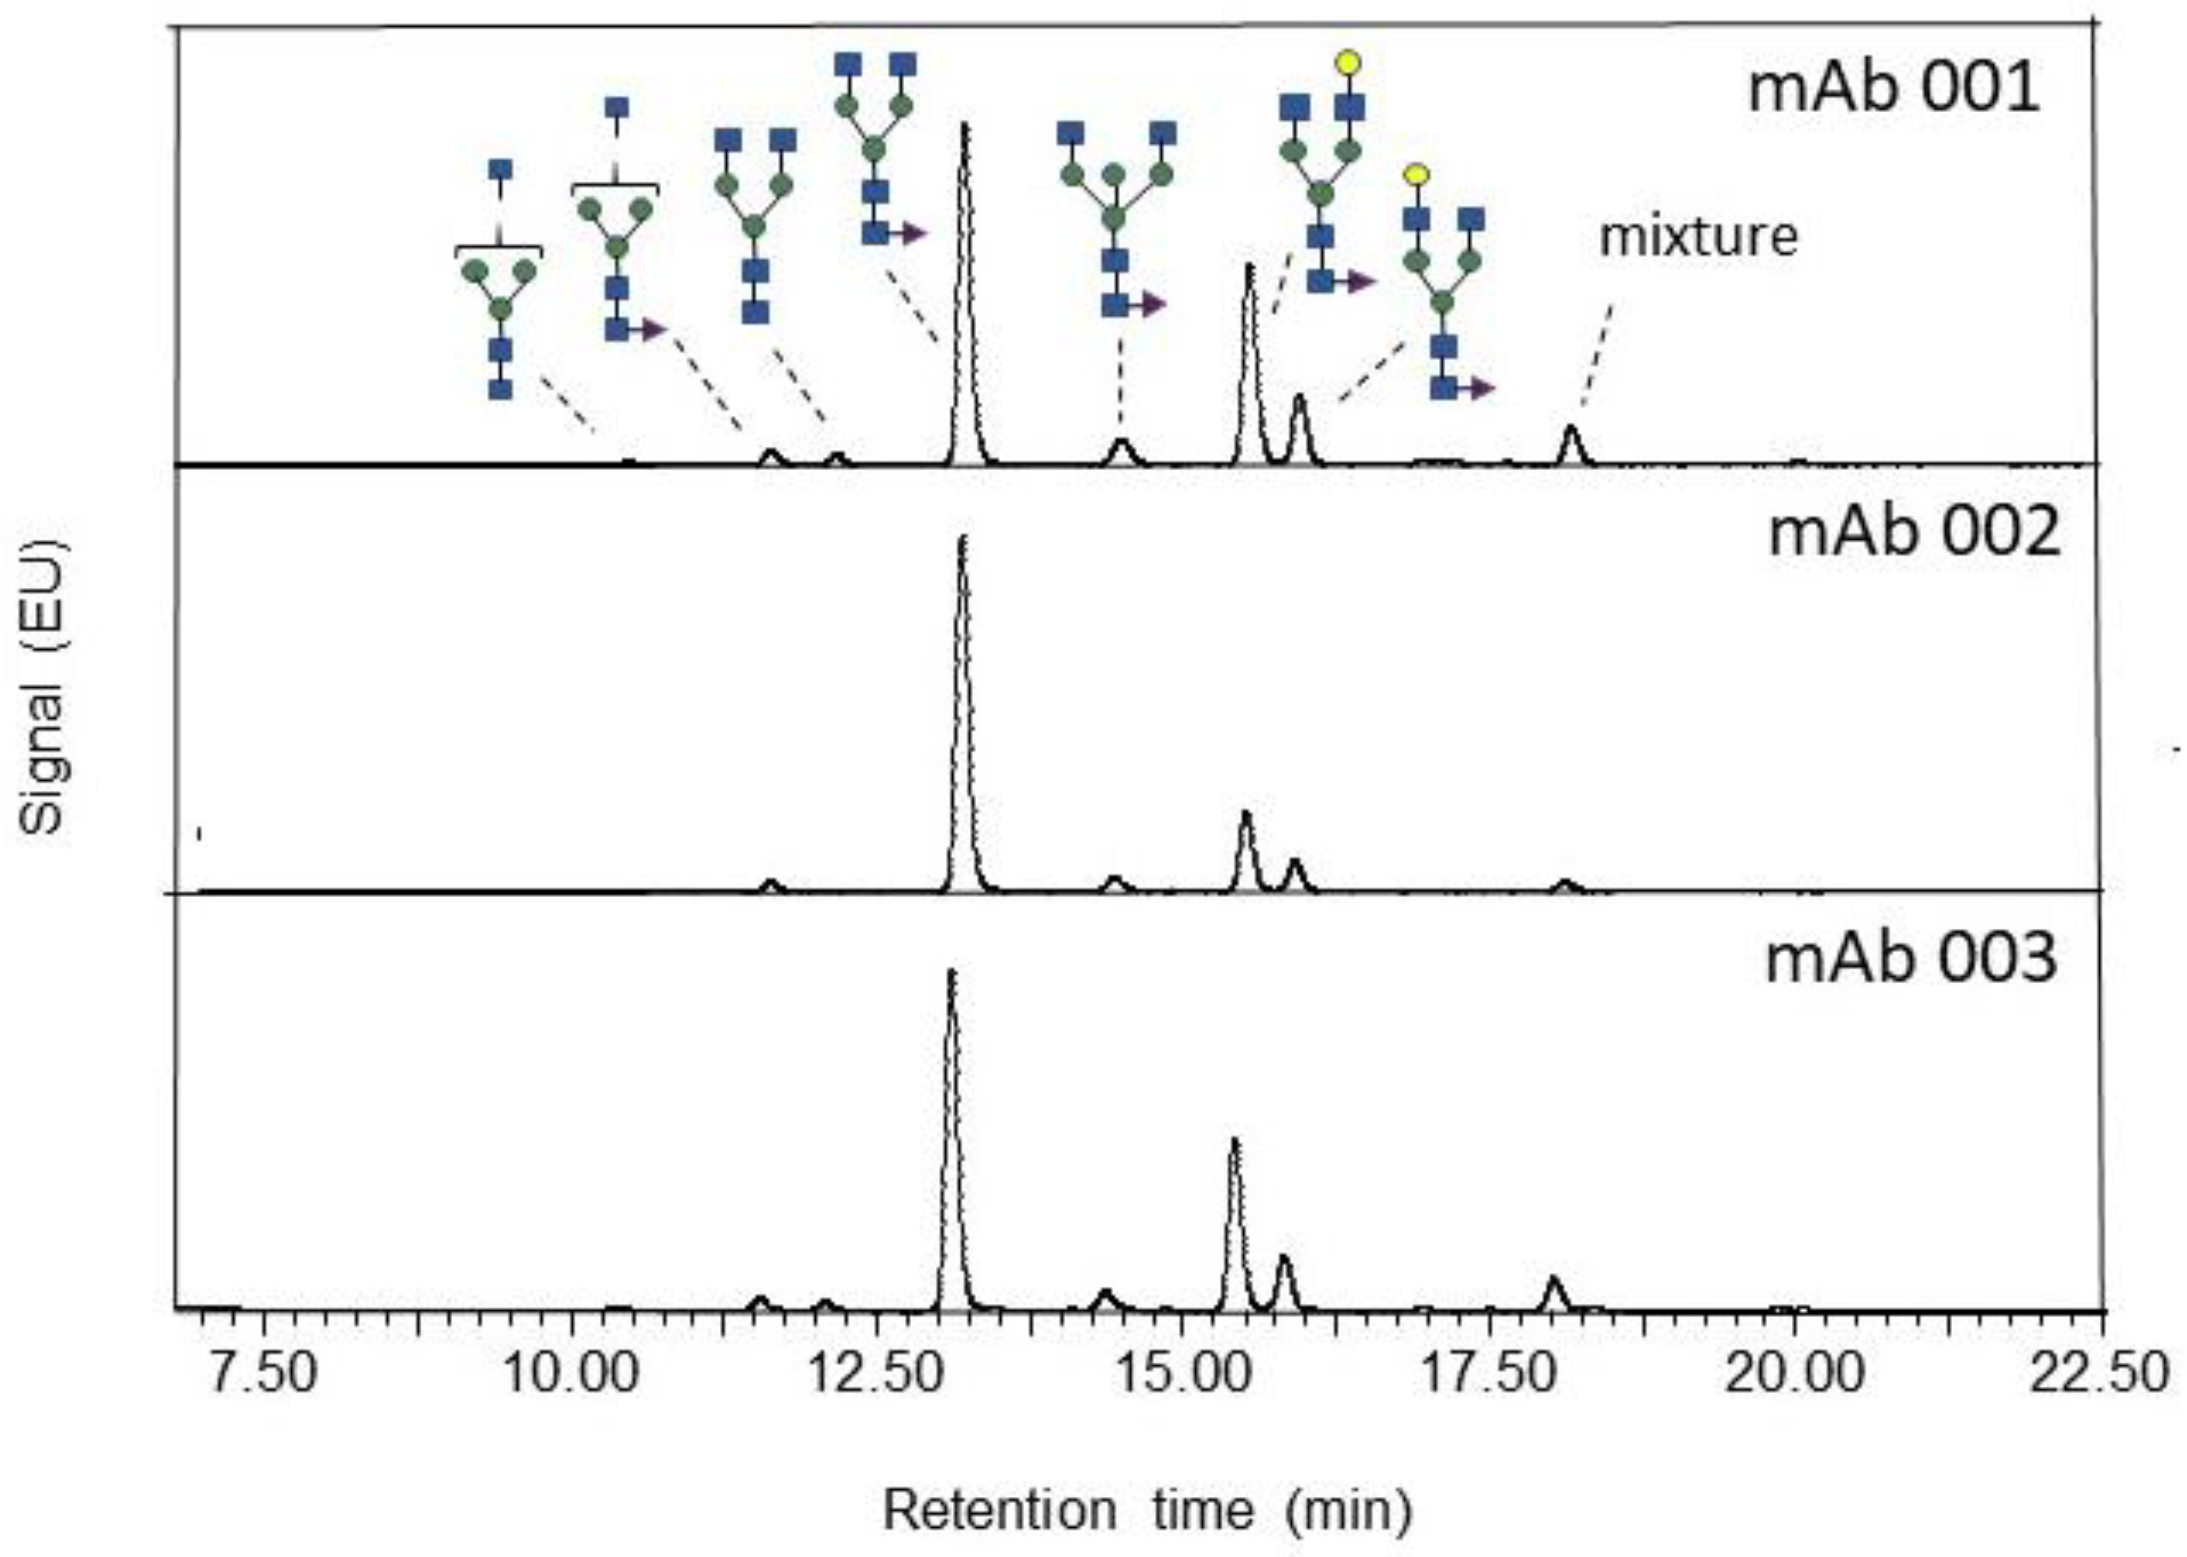

| Component Name | Observed RT (min) | Peak Area (%) | Expected Glucose Units | Glucose Units | Expected Mass (Da) | Observed Mass (Da) | Observed m/z | Mass Error (ppm) |
|---|---|---|---|---|---|---|---|---|
| F(6)M3 | 9.92 | 0. | 4.77 | 4.79 | 1367.5603 | 1367.5689 | 684.7923 | 6.31 |
| A1 | 10.52 | 0.3 | 4.96 | 4.99 | 1424.5818 | 1424.5943 | 713.3049 | 8.83 |
| F(6)A1 | 11.72 | 2.0 | 5.31 | 5.36 | 1570.6397 | 1570.6523 | 786.3340 | 8.04 |
| A2 | 12.15 | 1.2 | 5.49 | 5.53 | 1627.6611 | 1627.6721 | 814.8439 | 6.76 |
| F(6)A2 | 13.31 | 44.5 | 5.82 | 5.86 | 1773.7190 | 1773.7381 | 887.8769 | 8.82 |
| M5 Isomer | 14.30 | 0.1 | 6.19 | 6.18 | 1545.6080 | 1545.6171 | 773.8164 | 5.91 |
| F(6)A2B | 14.60 | 4.7 | 6.19 | 6.27 | 1976.7984 | 1976.8105 | 989.4131 | 6.14 |
| M5 | 6.19 | 1545.6080 | 1545.6167 | 773.8162 | 5.65 | |||
| F(6)A1G(4)1 | 6.22 | 1732.6925 | 1732.7011 | 867.3584 | 4.99 | |||
| A2[6]G(4)1 | 6.26 | 1789.7139 | 1789.7197 | 895.8677 | 3.23 | |||
| A2[3]G(4)1 | 15.08 | 0.2 | 6.38 | 6.43 | 1789.7139 | 1789.7269 | 895.8713 | 7.25 |
| F(6)A2[6]G(4)1 | 15.67 | 27.2 | 6.53 | 6.62 | 1935.7719 | 1935.7857 | 968.9007 | 7.17 |
| F(6)A2[3]G(4)1 | 16.08 | 9.36 | 6.69 | 6.76 | 1935.7719 | 1935.7847 | 968.9002 | 6.65 |
| F(6)M5A1 | 16.44 | 0.1 | 6.91 | 6.87 | 1894.7453 | 1894.7571 | 948.3864 | 6.41 |
| F(6)M4A1G(4)1 | 17.10 | 0.4 | 7.12 | 7.10 | 1894.7453 | 1894.7551 | 948.3854 | 5.35 |
| F(6)A1G(4)1Ga(3)1 | 7.12 | |||||||
| M6 | 7.11 | 1707.6609 | 1707.6687 | 854.8422 | 4.61 | |||
| M6D3 | 7.12 | |||||||
| Unknown 1 | 17.25 | 0.8 | 7.15 | 2023.7993 | 1012.907 | |||
| M6D1 | 17.35 | 0.3 | 7.14 | 7.18 | 1707.6609 | 1707.6701 | 854.8429 | 5.43 |
| A2G(4)1Ga(3)1 | 7.05 | 1951.7668 | 1951.7815 | 976.8986 | 7.55 | |||
| A2G(4)2 | 7.10 | |||||||
| F(6)A3G(4)1 | 17.72 | 0.2 | 6.91 | 7.29 | 2138.8512 | 2138.8661 | 1070.4410 | 7.08 |
| F(6)A2[3]BG(4)1 | 6.97 | |||||||
| F(6)A3G(4)1 iso | 7.02 | |||||||
| F(6)A3G(4)3S(3,3,3)3 | 17.80 | 0.3 | 7.41 | 7.34 | 2226.8673 | 2226.8789 | 1114.4770 | 5.24 |
| F(6)A2[6]G(4)1Ga(3)1 | 18.31 | 5.9 | 7.38 | 7.51 | 2097.8247 | 2097.8369 | 1049.9263 | 5.84 |
| F(6)A2G(4)2 | 7.43 | |||||||
| F(6)A2[3]G(4)1Ga(3)1 | 7.55 | |||||||
| F(6)A2[3]G(4)1S(3)1 | 7.53 | 2226.8673 | 2226.8837 | 1114.4497 | 7.39 | |||
| M4A1G(4)1Ga(3)1 | 18.64 | 0.2 | 7.42 | 7.63 | 1910.7402 | 1910.7541 | 956.3849 | 7.28 |
| M5A1G(4)1 | 7.43 | |||||||
| F(6)M5A1G(4)1 | 19.04 | 0.2 | 7.74 | 7.77 | 2056.7981 | 2056.8119 | 1029.4138 | 6.71 |
| F(6)M4A1G(4)1Ga(3)1 | 19.56 | 0.2 | 7.80 | 7.93 | 2056.7981 | 2056.8123 | 1029.4140 | 6.90 |
| M7D3 | 7.81 | 1869.7137 | 1869.7283 | 935.8720 | 7.84 | |||
| M7 | 20.03 | 0.1 | 8.0 | 8.14 | 1869.7137 | 1869.7269 | 935.8713 | 7.09 |
| M7D1 | 8.03 | |||||||
| F(6)A3G(4)1Ga(3)1 iso | 7.88 | 2300.9041 | 2300.9221 | 1151.4689 | 7.88 | |||
| F(6)A2G(4)2S(3)1 | 20.16 | 0.5 | 8.12 | 8.19 | 2388.9201 | 2388.9355 | 1195.4756 | 6.46 |
| F(6)A2G(4)2S(6)1 | 20.37 | 0.3 | 8.55 | 8.26 | 2388.9201 | 2388.9361 | 1195.4759 | 6.71 |
| F(6)A2G(4)2Ga(3)1 | 20.72 | 0.1 | 8.25 | 8.39 | 2259.8775 | 2259.8925 | 1130.9541 | 6.65 |
| F(6)M4A1G(4)1Sg(6)1 | 8.58 | 2201.8356 | 2201.8505 | 1101.9331 | 6.79 | |||
| F(6)A2G(4)2Ga(3)1 iso | 8.30 | 2259.8775 | 2259.8925 | 1130.9541 | 6.65 | |||
| M8 | 22.03 | 0.3 | 8.84 | 8.90 | 2031.7665 | 2031.7833 | 1016.8995 | 8.28 |
| M8D1D3 | 8.82 | |||||||
| M8D2D3 | 8.76 | |||||||
| F(6)A2G(4)2S(3,3)2 | 22.25 | 0.3 | 8.85 | 8.99 | 2680.0155 | 2680.0299 | 1341.0228 | 5.38 |
| Component Name | Observed RT (min) | Peak Area (%) | Expected Glucose Units | Glucose Units | Expected Mass (Da) | Observed Mass (Da) | Observed m/z | Mass Error (ppm) |
|---|---|---|---|---|---|---|---|---|
| M3 | 8.74 | 0.1 | 4.36 | 4.41 | 1221.5024 | 1221.5113 | 611.7635 | 7.31 |
| A1 | 10.52 | 0.1 | 4.96 | 4.99 | 1424.5818 | 1424.5911 | 713.3034 | 6.55 |
| F(6)A1 | 11.7 | 1.7 | 5.31 | 5.36 | 1570.6397 | 1570.6483 | 786.3320 | 5.50 |
| A2 | 12.24 | 0.2 | 5.49 | 5.53 | 1627.6611 | 1627.6797 | 814.8427 | 5.30 |
| F(6)A2 | 13.28 | 67.8 | 5.82 | 5.85 | 1773.7190 | 1773.7337 | 887.8747 | 8.30 |
| M5 Isomer | 14.25 | 0.1 | 6.19 | 6.16 | 1545.6080 | 1545.6187 | 773.8172 | 6.94 |
| F(6)A2B | 14.52 | 3.3 | 6.19 | 6.25 | 1976.7684 | 1976.8115 | 989.4136 | 6.64 |
| M5 | 6.19 | 1545.6080 | 1545.6217 | 773.8187 | 8.88 | |||
| F(6)A1G(4)1 | 6.22 | 1732.6925 | 1732.7069 | 867.3613 | 8.33 | |||
| A2[6]G(4)1 | 6.26 | 1789.7139 | 1789.7231 | 895.8694 | 5.16 | |||
| F(6)A3 | 15.32 | 0.1 | 6.27 | 6.53 | 1976.7984 | 1976.8125 | 989.4141 | 7.15 |
| F(6)A2[6]G(4)1 | 15.60 | 16.0 | 6.53 | 6.60 | 1935.7719 | 1935.7871 | 968.9014 | 7.87 |
| F(6)A2[3]G(4)1 | 15.99 | 6.5 | 6.69 | 6.73 | 1935.7719 | 1935.7845 | 968.9001 | 6.52 |
| F(6)M5A1 | 16.34 | 0.1 | 6.89 | 6.87 | 1894.7453 | 1894.7569 | 948.3863 | 6.14 |
| F(6)M4A1G(4)1 | 17.00 | 0.1 | 6.99 | 7.05 | 1894.7453 | 1894.7607 | 948.3882 | 8.14 |
| F(6)A1G(4)1Ga(3)1 | 7.02 | |||||||
| M6 | 7.11 | 1707.6609 | 1707.6737 | 854.8447 | 7.46 | |||
| M6D3 | 7.12 | |||||||
| Unknown 1 | 17.04 | 0.1 | 7.08 | 2023.8045 | 1012.9101 | |||
| M6D1 | 17.27 | 0.3 | 7.14 | 7.15 | 1707.6609 | 1707.6703 | 854.8430 | 5.47 |
| A2G(4)1Ga(3)1 | 7.05 | 1951.7668 | 1951.7771 | 976.8964 | 5.20 | |||
| A2G(4)2 | 7.10 | |||||||
| F(6)A3G(4)1 | 17.6 | 0.1 | 6.91 | 7.27 | 2138.8512 | 2138.8667 | 1070.4412 | 7.36 |
| F(6)A2[3]BG(4)1 | 6.97 | |||||||
| F(6)A3G(4)1 iso | 7.02 | |||||||
| F(6)A3G(4)3S(3,3,3)3 | 17.59 | 0.2 | 7.41 | 7.26 | 2226.8673 | 2226.8667 | 1114.4503 | 8.06 |
| F(6)A2[3]G(4)1S(3)1 | 7.53 | |||||||
| F(6)A2[6]G(4)1Ga(3)1 | 18.20 | 2.2 | 7.38 | 7.48 | 2097.8247 | 2097.8395 | 1049.9276 | 6.93 |
| F(6)A2G(4)2 | 7.43 | |||||||
| F(6)A2[3]G1(4)Ga(3)1 | 7.55 | |||||||
| F(6)A2[3]G(4)1S(3)1 | 7.53 | 2226.8673 | 2226.8859 | 1114.4508 | 8.51 | |||
| M4A1G(4)1Ga(3)1 | 18.51 | 0.1 | 7.42 | 7.58 | 1910.7402 | 1910.7521 | 956.3873 | 6.35 |
| M5A1G(4)1 | 7.43 | |||||||
| F(6)M5A1G(4)1 | 18.92 | 0.1 | 7.74 | 7.73 | 2056.7981 | 2056.8119 | 1029.4138 | 6.78 |
| F(6)M4A1G(4)1Ga(3)1 | 19.46 | 0.1 | 7.80 | 7.93 | 2056.7981 | 2056.8099 | 1029.4128 | 5.81 |
| M7D3 | 7.81 | 1869.7137 | 1869.7253 | 935.8705 | 6.07 | |||
| M7 | 19.89 | 0.1 | 8.0 | 8.08 | 1869.7137 | 1869.7283 | 835.8720 | 7.67 |
| M7D1 | 8.03 | |||||||
| F(6)A2G(4)2S(3)1 | 20.05 | 0.1 | 8.12 | 8.14 | 2388.9201 | 2388.9409 | 1195.4783 | 8.77 |
| F(6)A2G(4)2S(6)1 | 20.25 | 0.1 | 8.55 | 8.22 | 2388.9201 | 2388.9361 | 1195.4759 | 6.76 |
| M8 | 21.9 | 0.1 | 8.84 | 8.85 | 2031.7665 | 2031.7805 | 1016.8995 | 7.16 |
| M8D1D3 | 8.82 | |||||||
| M8D2D3 | 8.76 | |||||||
| F(6)A3G(4)3 iso | 8.80 | 2462.9569 | 2462.9725 | 1232.4941 | 6.35 | |||
| F(6)A2G(4)2S(3,3)2 | 22.23 | 0.1 | 8.85 | 8.98 | 2680.0155 | 2680.0311 | 1341.0234 | 5.38 |
| Component Name | Observed RT (min) | Peak Area (%) | Expected Glucose Units | Glucose Units | Expected Mass (Da) | Observed Mass (Da) | Observed m/z | Mass Error (ppm) |
|---|---|---|---|---|---|---|---|---|
| A1 | 10.46 | 0.5 | 4.96 | 4.97 | 1424.5818 | 1424.5891 | 713.3024 | 5.01 |
| F(6)A1 | 11.62 | 2.0 | 5.31 | 5.33 | 1570.6397 | 1570.6483 | 786.3320 | 5.49 |
| A2 | 12.15 | 1.3 | 5.49 | 5.50 | 1627.6611 | 1627.6713 | 814.8435 | 6.29 |
| F(6)A2 | 13.19 | 49.6 | 5.82 | 5.83 | 1773.7190 | 1773.7303 | 887.8730 | 6.39 |
| M5 Isomer | 14.25 | 0.1 | 6.19 | 6.13 | 1545.6080 | 1545.6153 | 773.8155 | 4.74 |
| F(6)A2B | 14.52 | 3.7 | 6.19 | 6.22 | 1976.7984 | 1976.8133 | 989.4145 | 7.56 |
| M5 | 6.19 | 1545.6080 | 1545.6159 | 773.8158 | 5.13 | |||
| F(6)A1[3]G(4)1 | 6.22 | 1732.6925 | 1732.7027 | 867.3592 | 5.90 | |||
| A2[6]G(4)1 | 6.26 | 1789.7139 | 1789.7243 | 895.8700 | 5.83 | |||
| A2[3]G(4)1 | 14.93 | 0.1 | 6.38 | 6.38 | 1789.7139 | 1789.7277 | 895.8717 | 7.73 |
| F(6)A2[6]G(4)1 | 15.50 | 26.2 | 6.53 | 6.57 | 1935.7719 | 1935.7879 | 968.9018 | 8.28 |
| F(6)A2[3]G(4)1 | 15.90 | 8.9 | 6.69 | 6.70 | 1935.7719 | 1935.7909 | 968.9033 | 9.83 |
| F(6)M5A1 | 16.19 | 0.1 | 6.89 | 6.79 | 1894.7453 | 1894.7575 | 948.3866 | 6.45 |
| F(6)M4A1G(4)1 | 17.00 | 0.1 | 6.99 | 7.02 | 1894.7453 | 1894.7559 | 948.3858 | 5.61 |
| F(6)A1G(4)1Ga(3)1 | 7.02 | |||||||
| M6 | 7.11 | 1707.6609 | 1707.6699 | 854.8428 | 5.24 | |||
| M6D3 | 7.12 | |||||||
| Unknown 1 | 17.04 | 0.3 | 7.08 | 2023.7967 | 1012.9060 | |||
| M6D1 | 17.13 | 0.1 | 7.14 | 7.11 | 1707.6609 | 1707.6739 | 854.8448 | 7.58 |
| A2G(4)1Ga(3)1 | 7.05 | 1951.7668 | 1951.7773 | 976.8965 | 5.40 | |||
| A2G(4)2 | 7.10 | |||||||
| F(6)A3G(4)3S(3,3,3)3 | 17.59 | 0.2 | 7.41 | 7.26 | 2226.8673 | 2226.8785 | 1114.4471 | 5.04 |
| F(6)A2[6]G(4)1Ga(3)1 | 18.11 | 5.5 | 7.38 | 7.44 | 2097.8247 | 2097.8311 | 1049.9234 | 2.93 |
| F(6)A2G(4)2 | 7.43 | |||||||
| F(6)A2[3]G1Ga(3)1 | 7.55 | |||||||
| F(6)A2[3]G(4)1S(3)1 | 7.53 | 2226.8673 | 2226.8857 | 1114.4507 | 8.28 | |||
| M4A1G(4)1Ga(3)1 | 18.44 | 0.3 | 7.42 | 7.56 | 1910.7402 | 1910.7535 | 956.3846 | 7.09 |
| M5A1G(4)1 | 7.43 | |||||||
| F(6)M5A1G(4)1 | 18.84 | 0.1 | 7.74 | 7.70 | 2056.7981 | 2056.8093 | 1029.4125 | 5.51 |
| F(6)M4A1G(4)1Ga(3)1 | 19.35 | 0.1 | 7.80 | 7.89 | 2056.7981 | 2056.8149 | 1029.4153 | 8.24 |
| M7D3 | 7.81 | 1869.7137 | 1869.7299 | 935.8728 | 8.69 | |||
| M7 | 8.0 | |||||||
| F(6)A2G(4)2S(3)1 | 19.96 | 0.4 | 8.12 | 8.11 | 2388.9201 | 2388.9299 | 1195.4728 | 4.16 |
| F(6)A2G(4)2S(6)1 | 20.15 | 0.2 | 8.55 | 8.18 | 2388.9201 | 2388.9329 | 1195.4743 | 5.42 |
| F(6)A2G(4)2Ga(3)1 | 20.51 | 0.1 | 8.25 | 8.32 | 2259.8775 | 2259.8989 | 1130.9573 | 9.27 |
| F(6)M4A1G(4)1Sg(6)1 | 8.58 | 2201.8356 | 2201.8505 | 1101.9331 | 6.79 | |||
| M8 | 21.8 | 0.1 | 8.84 | 8.85 | 2031.7665 | 2031.7779 | 1016.8968 | 5.88 |
| M8D1D3 | 8.82 | |||||||
| M8D2D3 | 8.76 | |||||||
| F(6)A2G(4)2S(3,3)2 | 22.00 | 0.2 | 9.32 | 8.89 | 2680.0155 | 2680.0289 | 1341.0223 | 5.01 |
| Structural Element | USP mAb 001 | USP mAb 002 | USP mAb 003 |
|---|---|---|---|
| Total Glycans | 47 | 45 | 40 |
| High Mannose | 12 | 12 | 10 |
| Hybrid | 11 | 10 | 11 |
| Complex | 23 | 22 | 18 |
| Unknown * | 1 | 1 | 1 |
| Biantennary | 22 | 25 | 26 |
| Core Fucosylation | 27 | 25 | 21 |
| Sialylation | 6 | 6 | 6 |
| Alpha-Galactosylation | 9 | 6 | 7 |
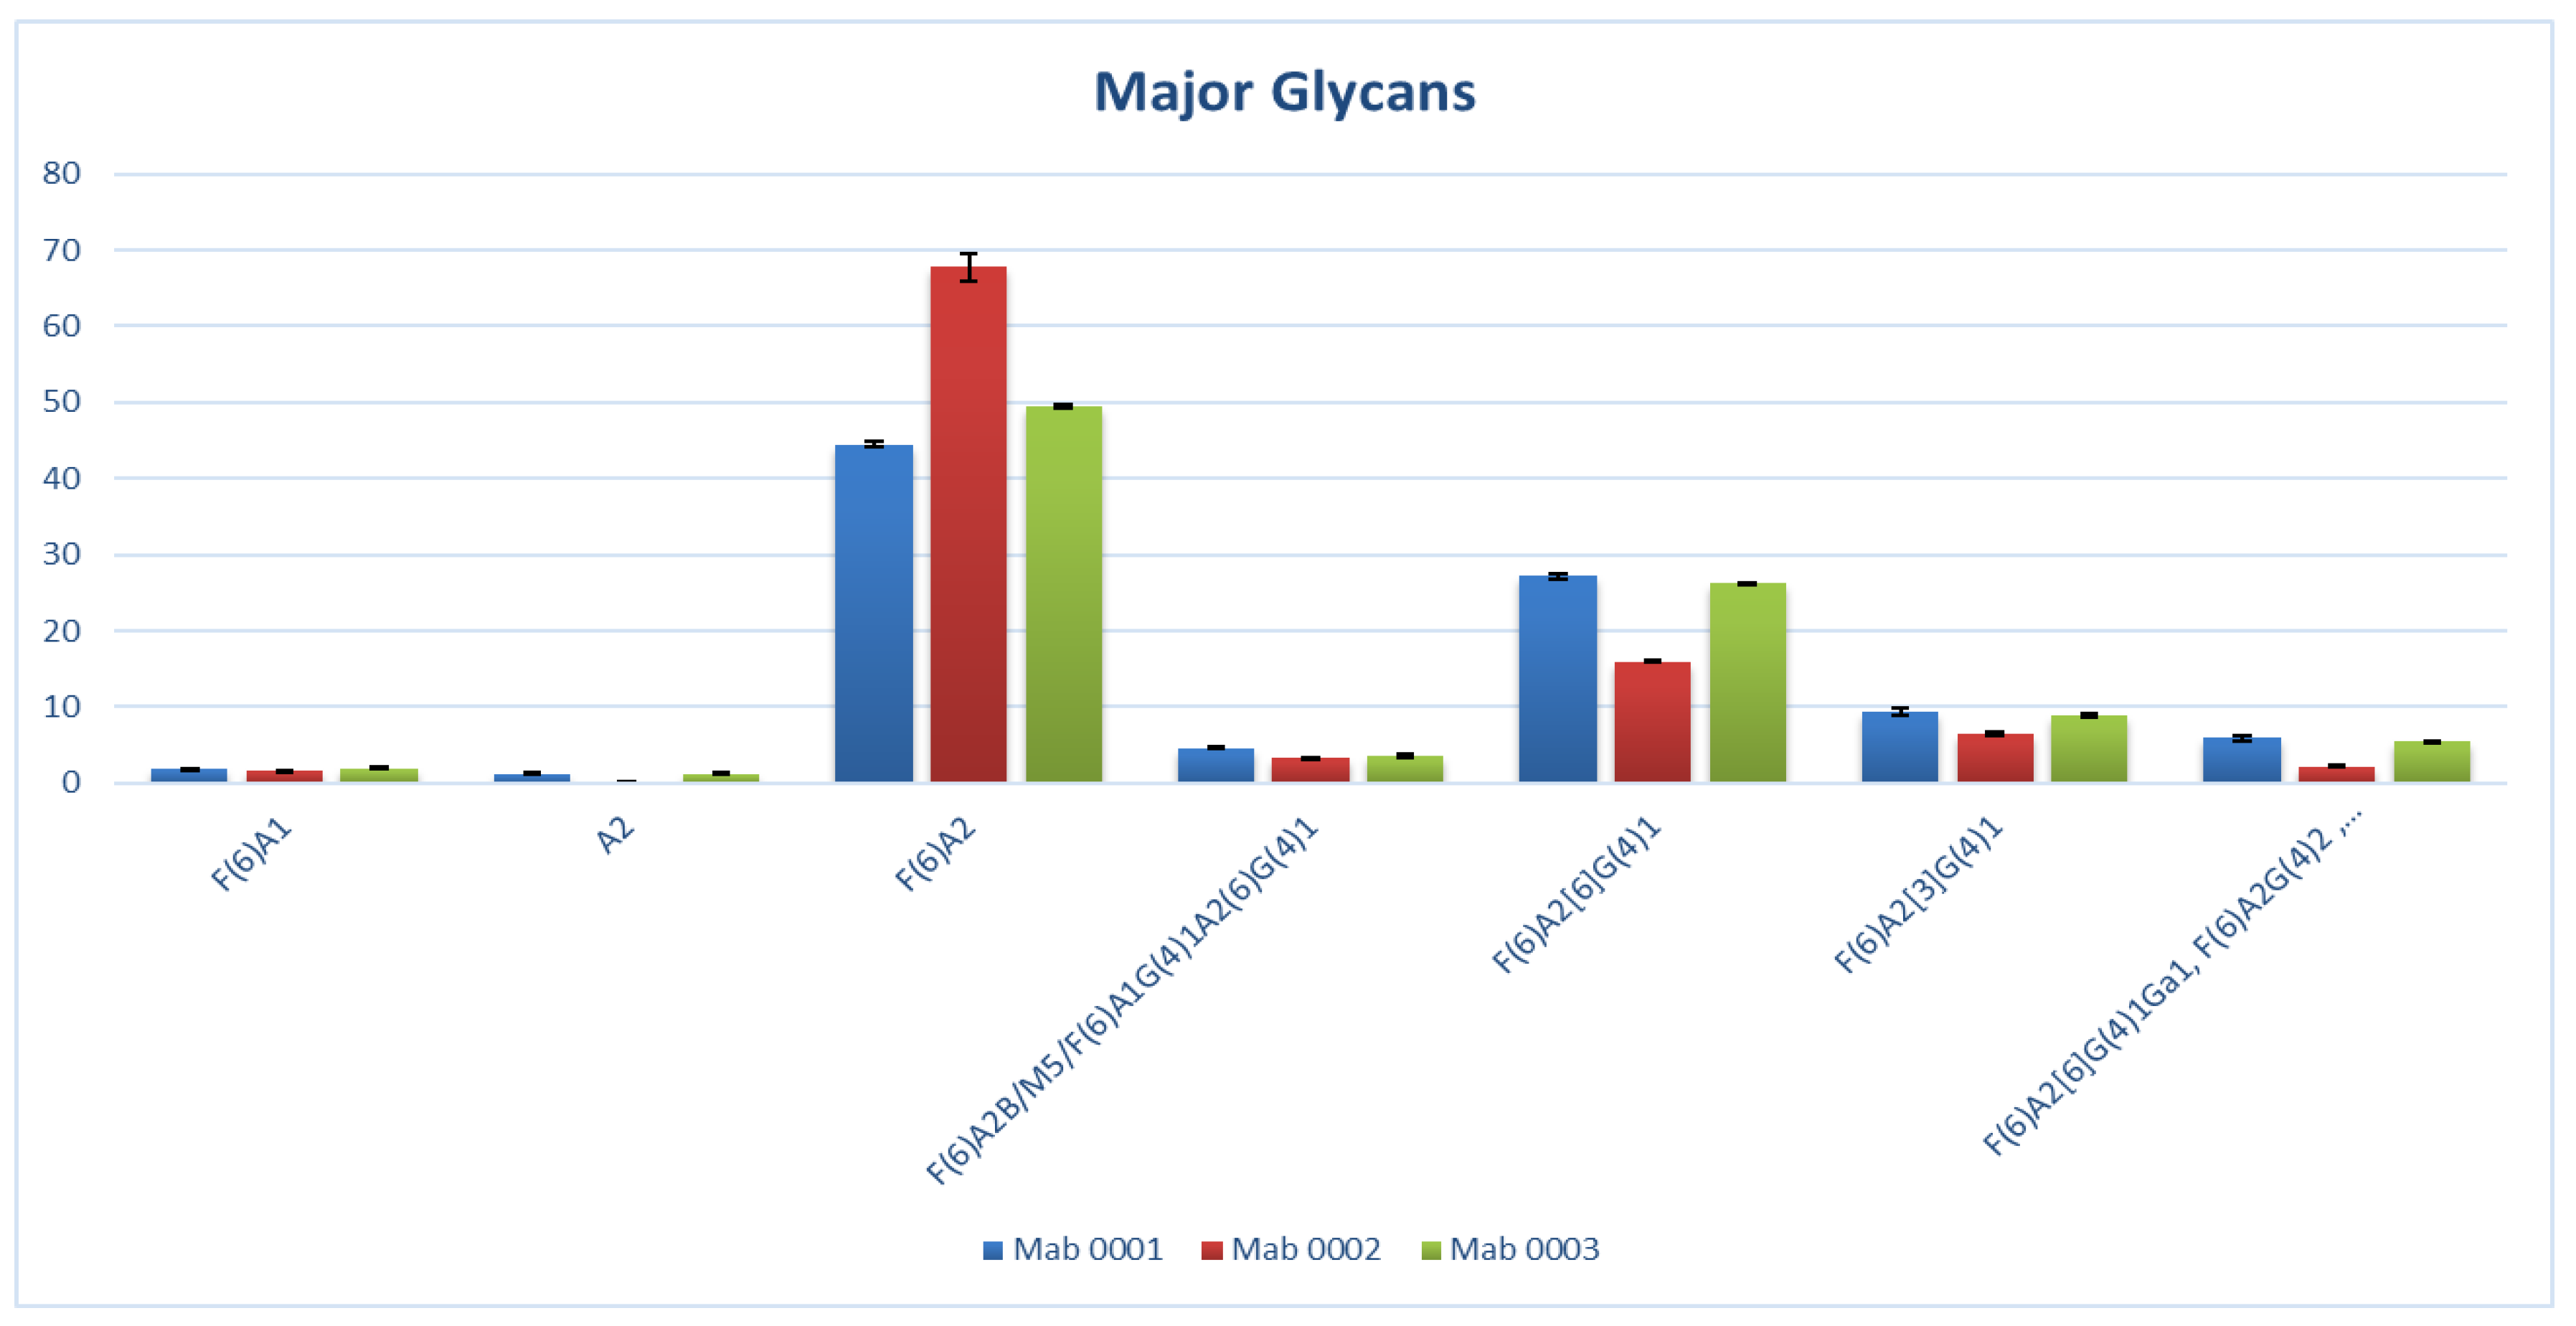
| Glycan | USP mAb 001 | USP mAb 002 | USP mAb 003 | NIST mAb * | NIST mAb ** |
|---|---|---|---|---|---|
| F(6)A2 | 44.46 | 67.81 | 49.56 | 39.09 | 39 |
| F(6)A2[6]G(4)1 | 27.17 | 16 | 26.2 | 28.12 | 37.8 |
| F(6)A2[3]G(4)1 | 9.36 | 6.51 | 8.93 | 10.18 | - |
| F(6)A2G(4)2 | ≤5.89 | ≤2.22 | ≤5.49 | 7.51 | 7.3 |
| F(6)A1 | 1.98 | 1.71 | 1.99 | 2.127 | 2.5 |
Publisher’s Note: MDPI stays neutral with regard to jurisdictional claims in published maps and institutional affiliations. |
© 2022 by the authors. Licensee MDPI, Basel, Switzerland. This article is an open access article distributed under the terms and conditions of the Creative Commons Attribution (CC BY) license (https://creativecommons.org/licenses/by/4.0/).
Share and Cite
Guo, J.; Tu, H.; Jing, L.; McCarthy, D.; Atouf, F. USP Reference Standard Monoclonal Antibodies: Tools to Verify Glycan Structure. Pharmaceuticals 2022, 15, 315. https://doi.org/10.3390/ph15030315
Guo J, Tu H, Jing L, McCarthy D, Atouf F. USP Reference Standard Monoclonal Antibodies: Tools to Verify Glycan Structure. Pharmaceuticals. 2022; 15(3):315. https://doi.org/10.3390/ph15030315
Chicago/Turabian StyleGuo, Jingzhong, Huiping Tu, Li Jing, Diane McCarthy, and Fouad Atouf. 2022. "USP Reference Standard Monoclonal Antibodies: Tools to Verify Glycan Structure" Pharmaceuticals 15, no. 3: 315. https://doi.org/10.3390/ph15030315
APA StyleGuo, J., Tu, H., Jing, L., McCarthy, D., & Atouf, F. (2022). USP Reference Standard Monoclonal Antibodies: Tools to Verify Glycan Structure. Pharmaceuticals, 15(3), 315. https://doi.org/10.3390/ph15030315