
Comparative Studies of Palmatine with Metformin and Glimepiride on the Modulation of Insulin Dependent Signaling Pathway In Vitro, In Vivo & Ex Vivo
 ,
,  , , ,
, , ,  , and
, and
Abstract
1. Introduction
2. Results
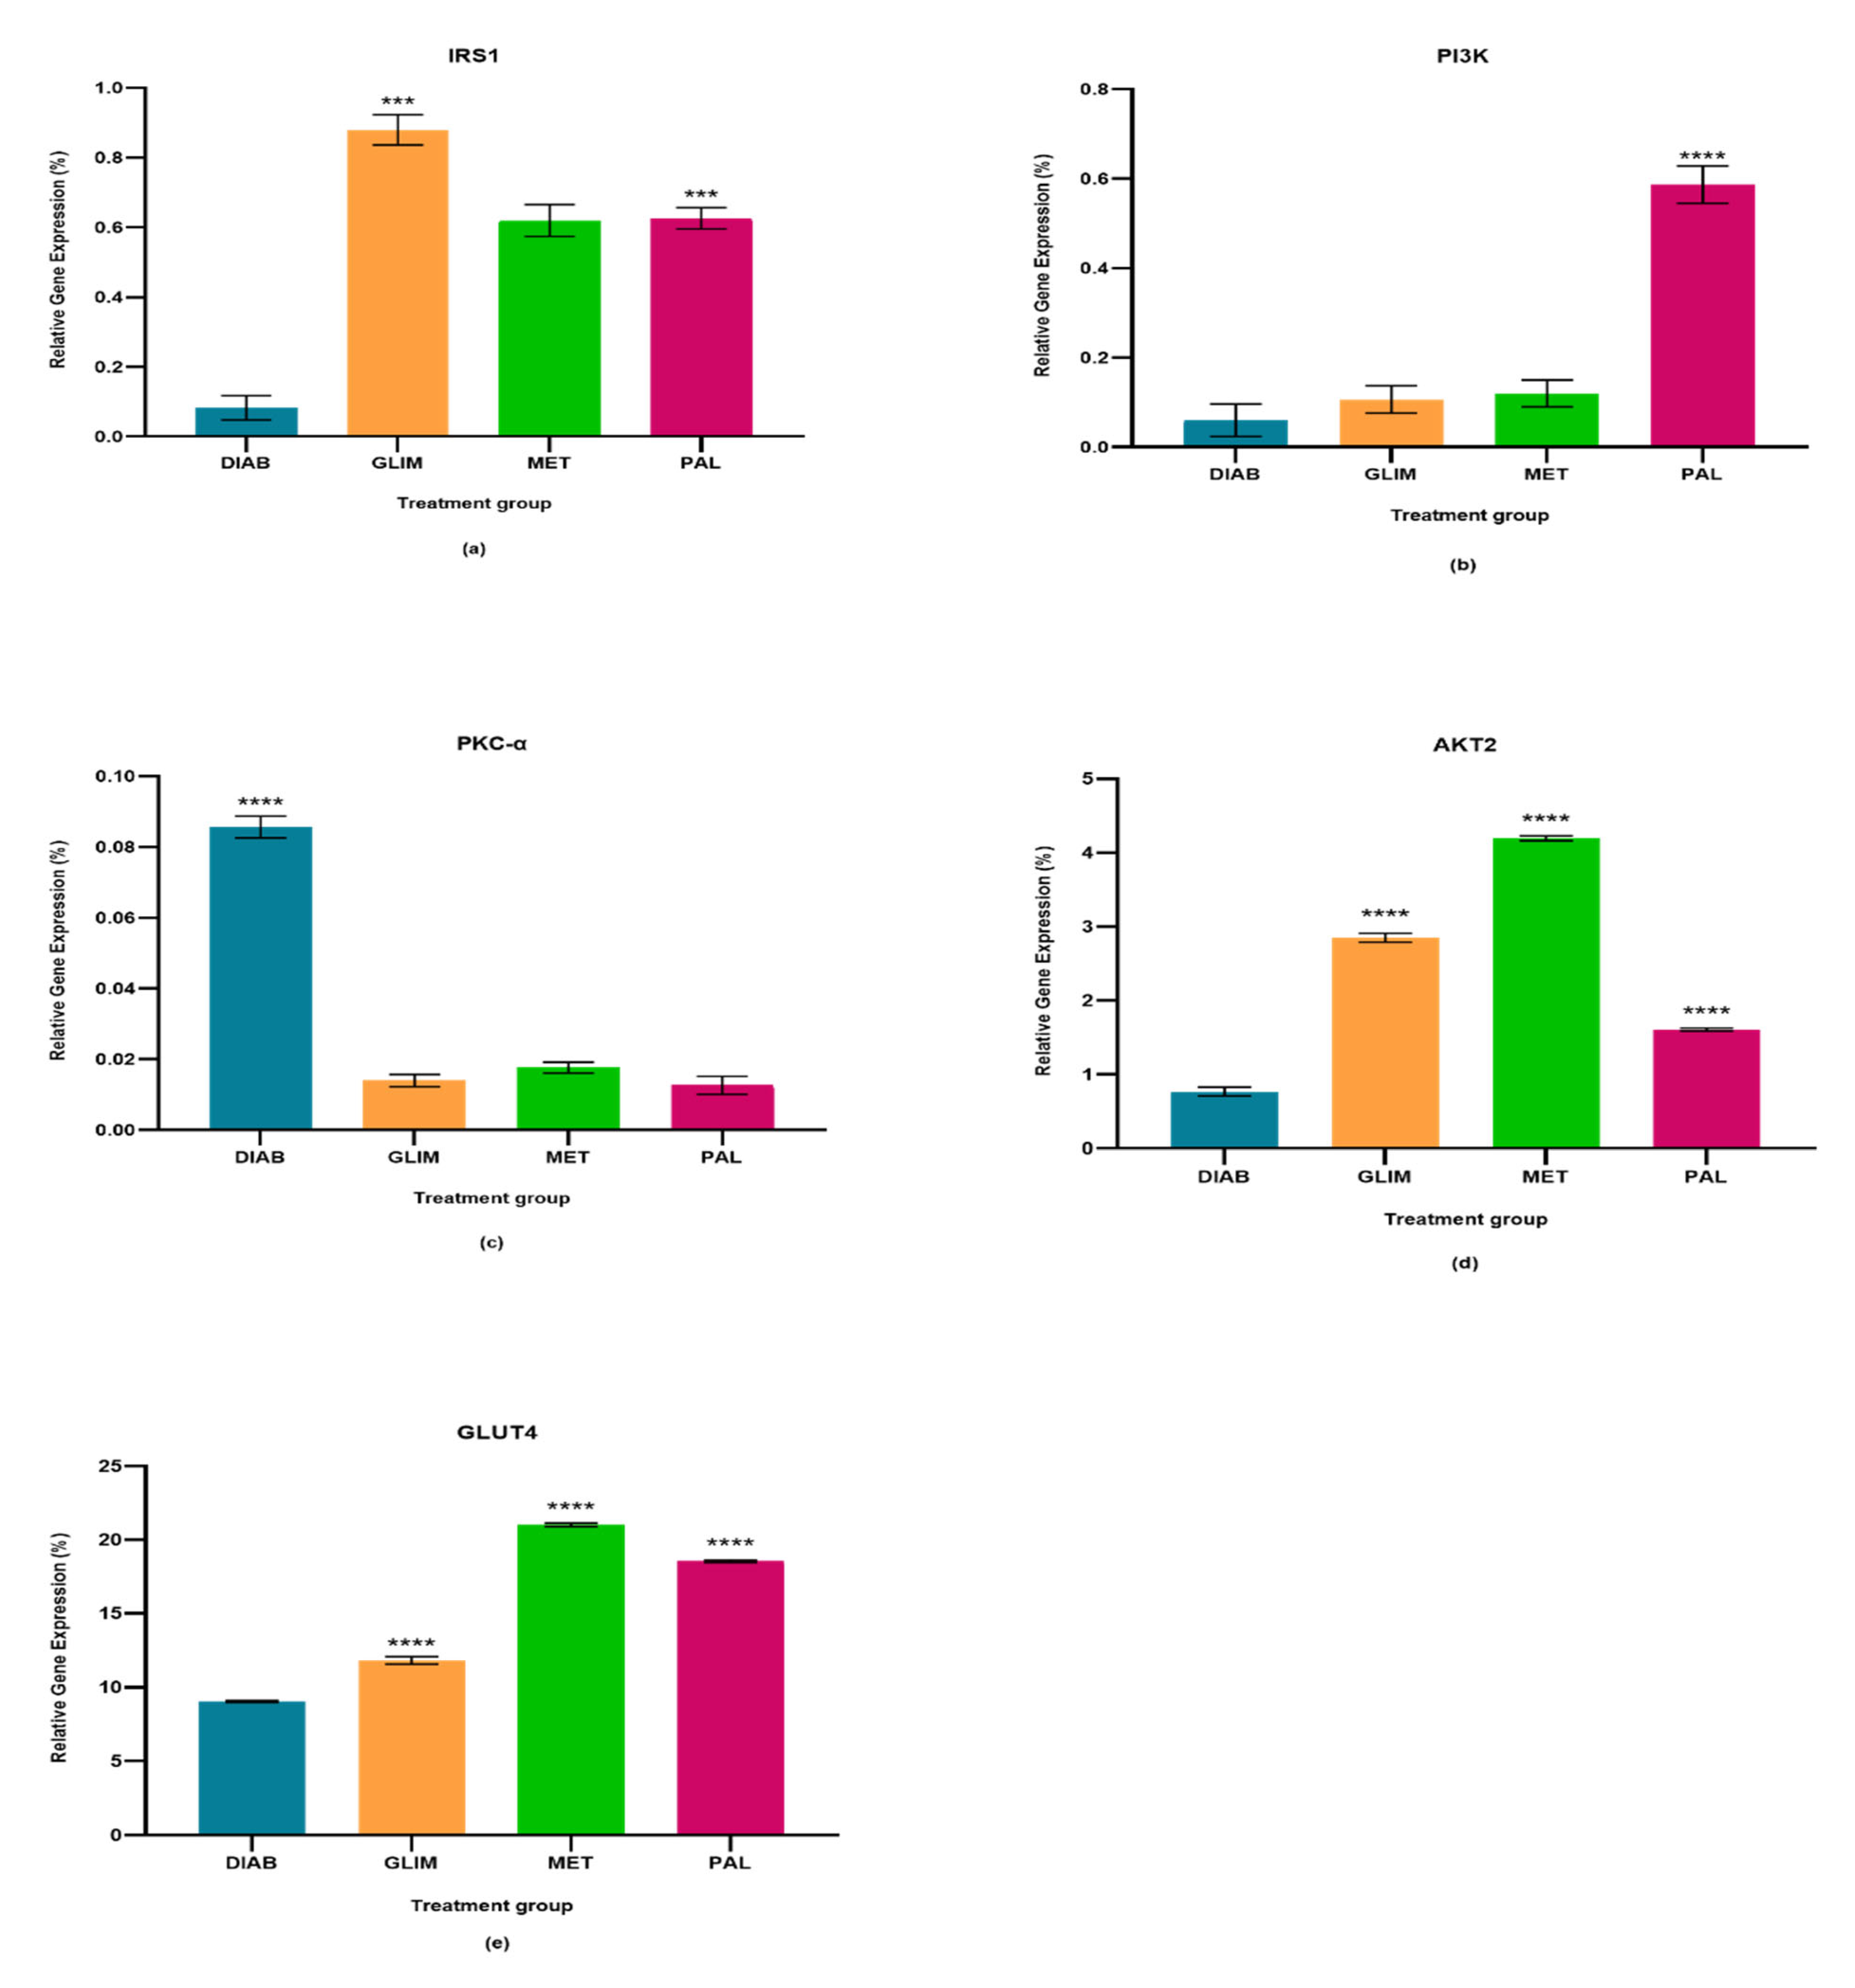
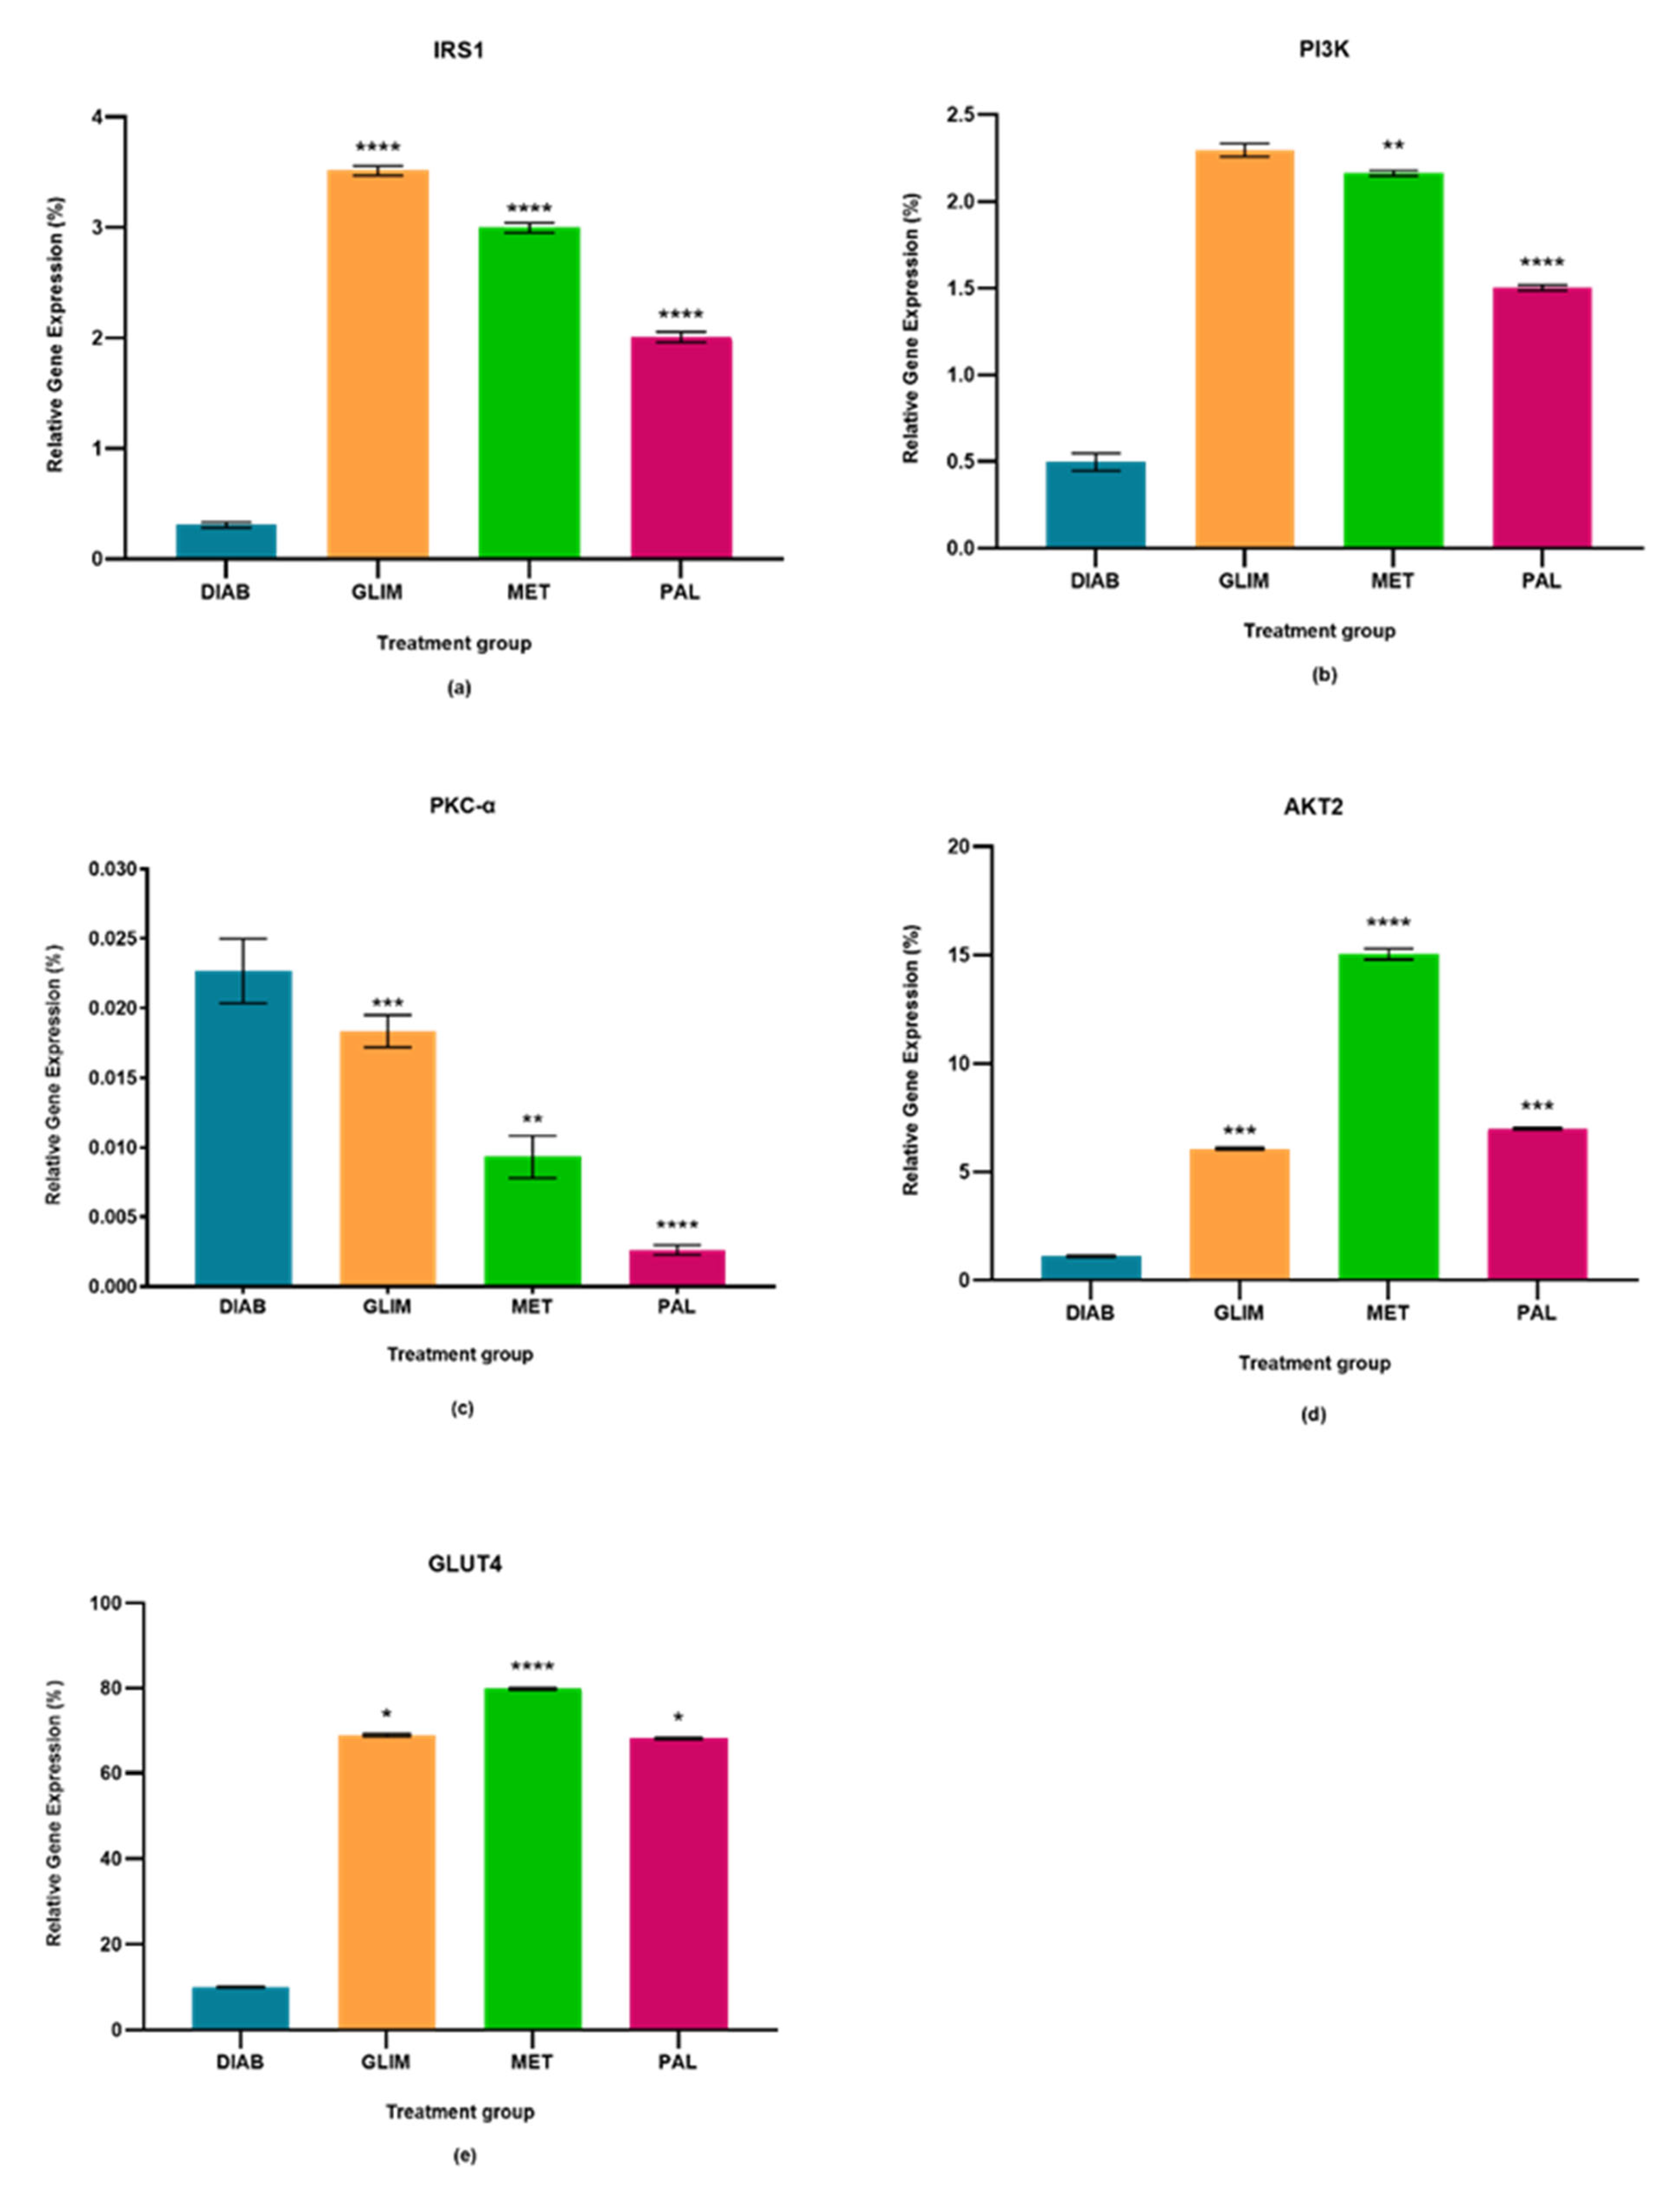
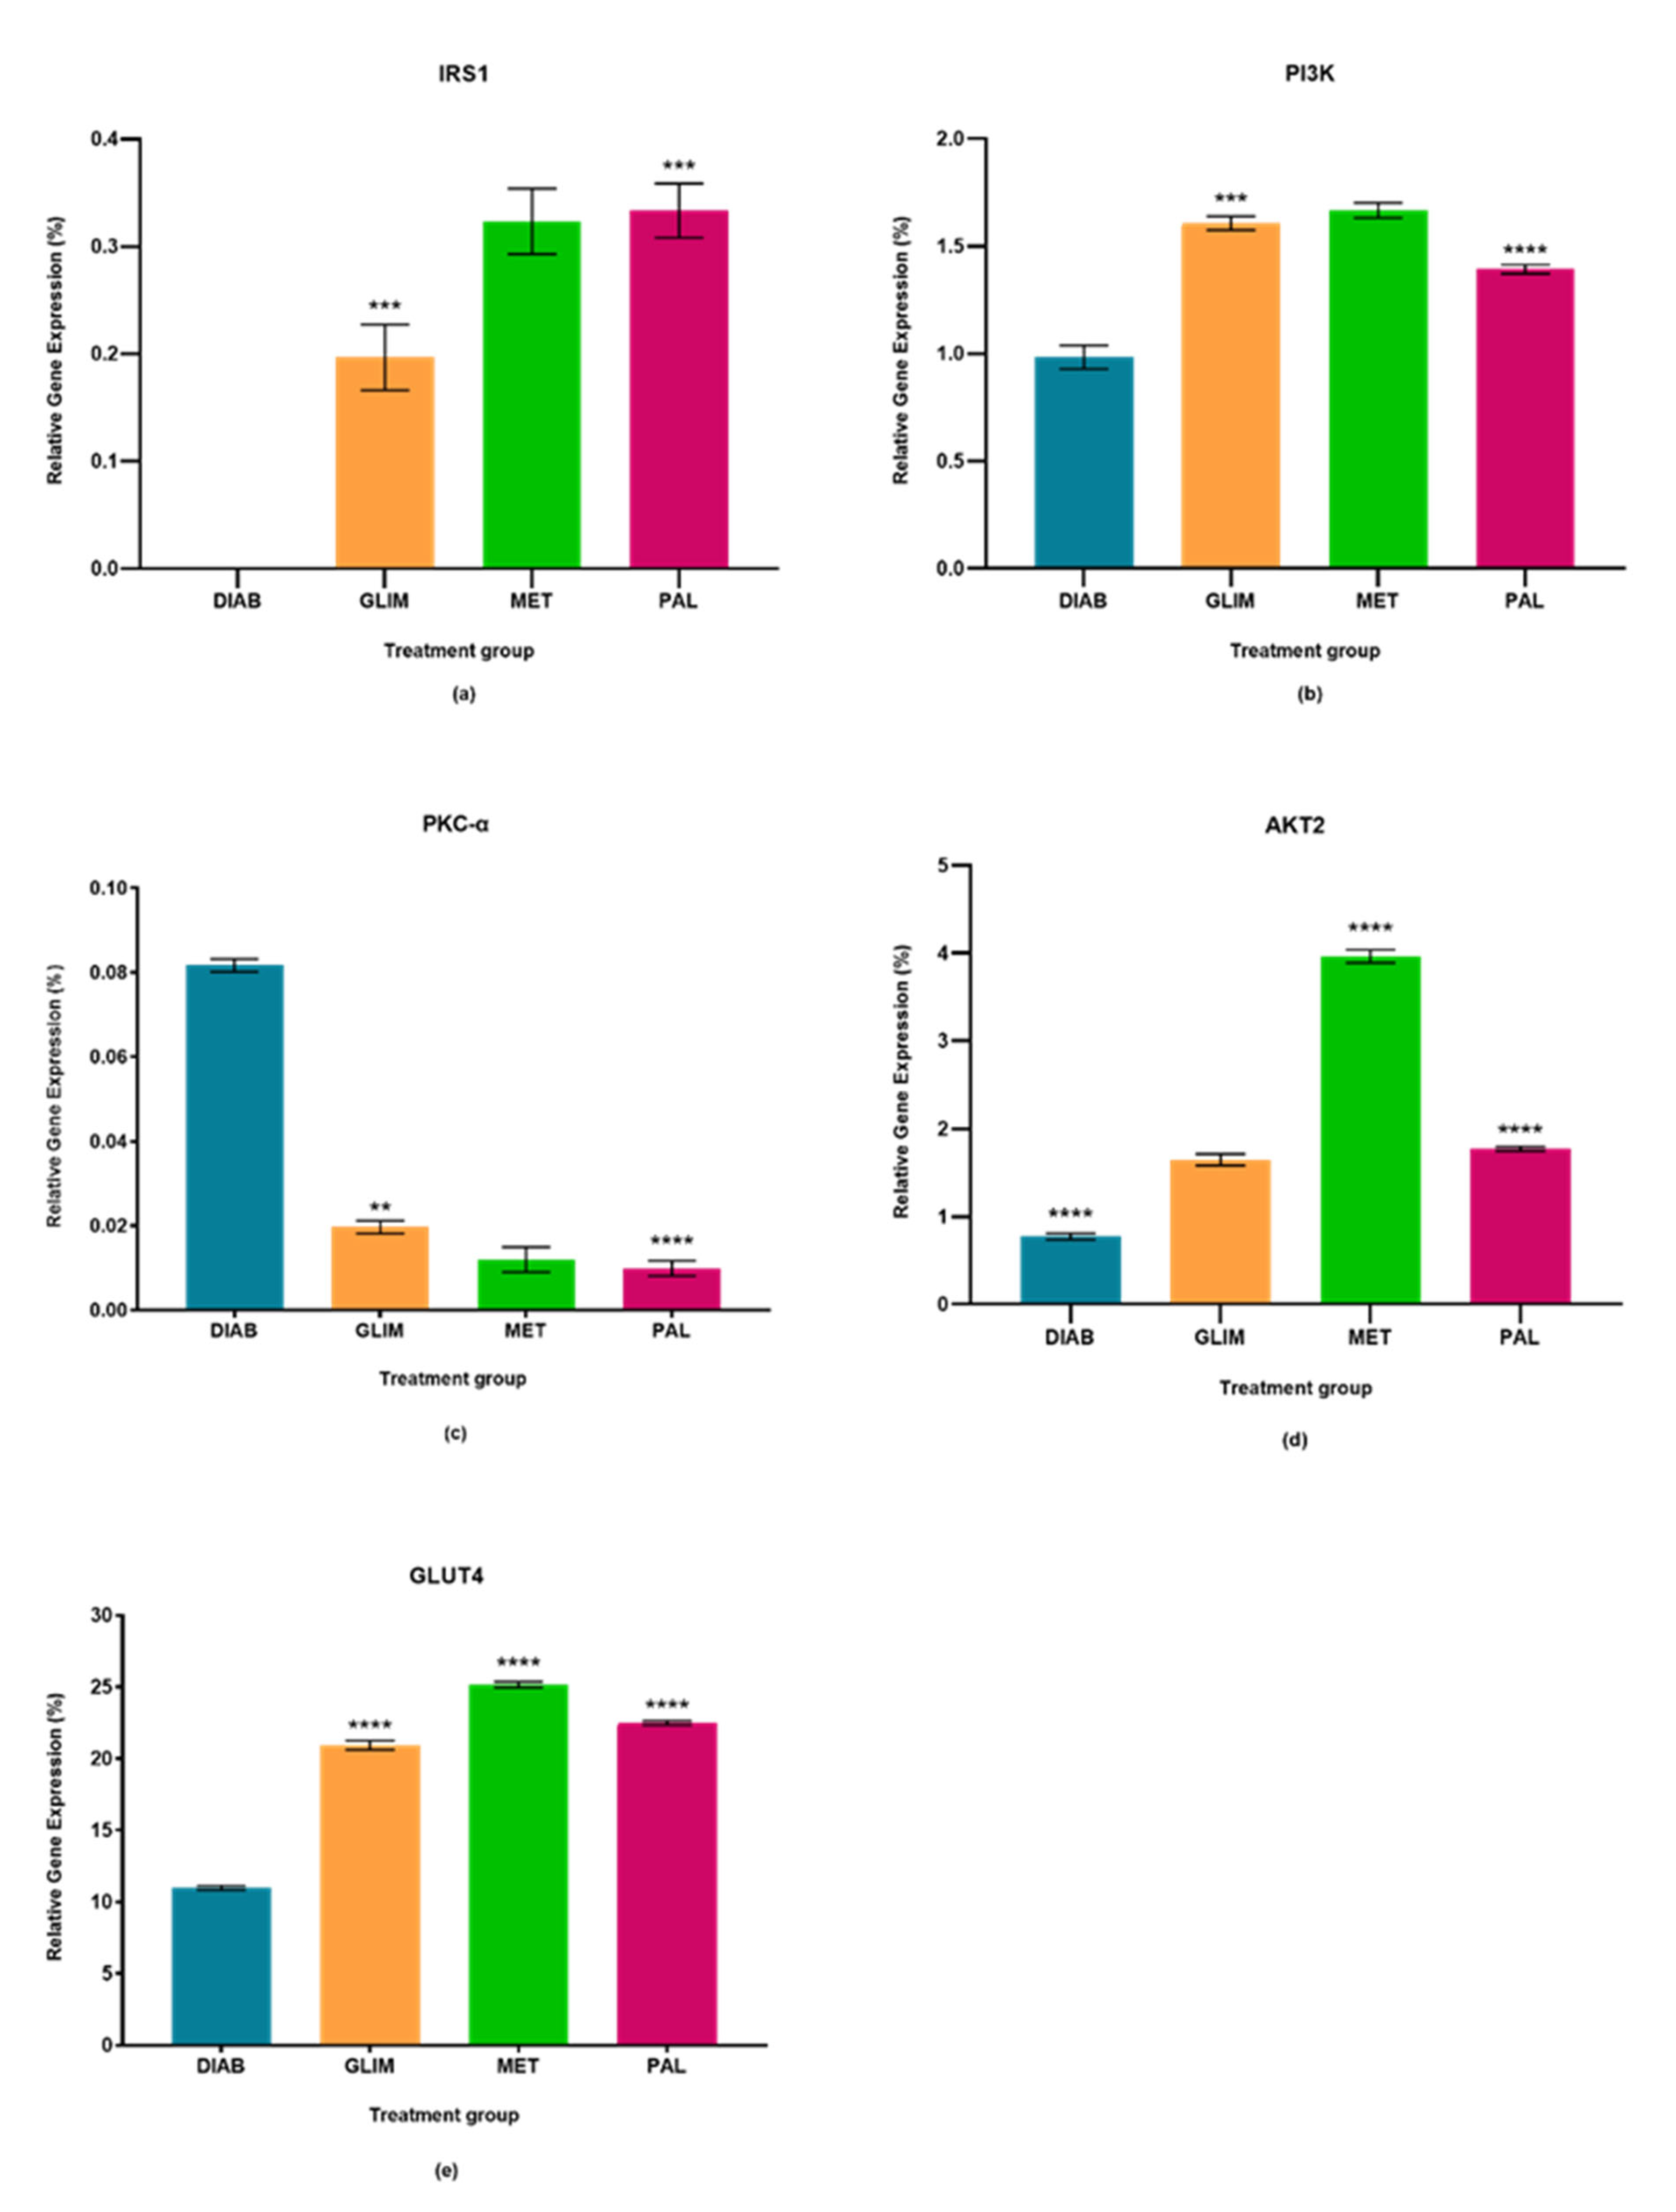
2.1. Effect of Palmatine on the Expression of IRS1
2.2. Effect of Palmatine on the Expression of PI3K
2.3. Effect of Palmatine on the Expression of PKC-α
2.4. Effect of Palmatine on the Expression of AKT2
2.5. Effect of Palmatine on the Expression of GLUT4
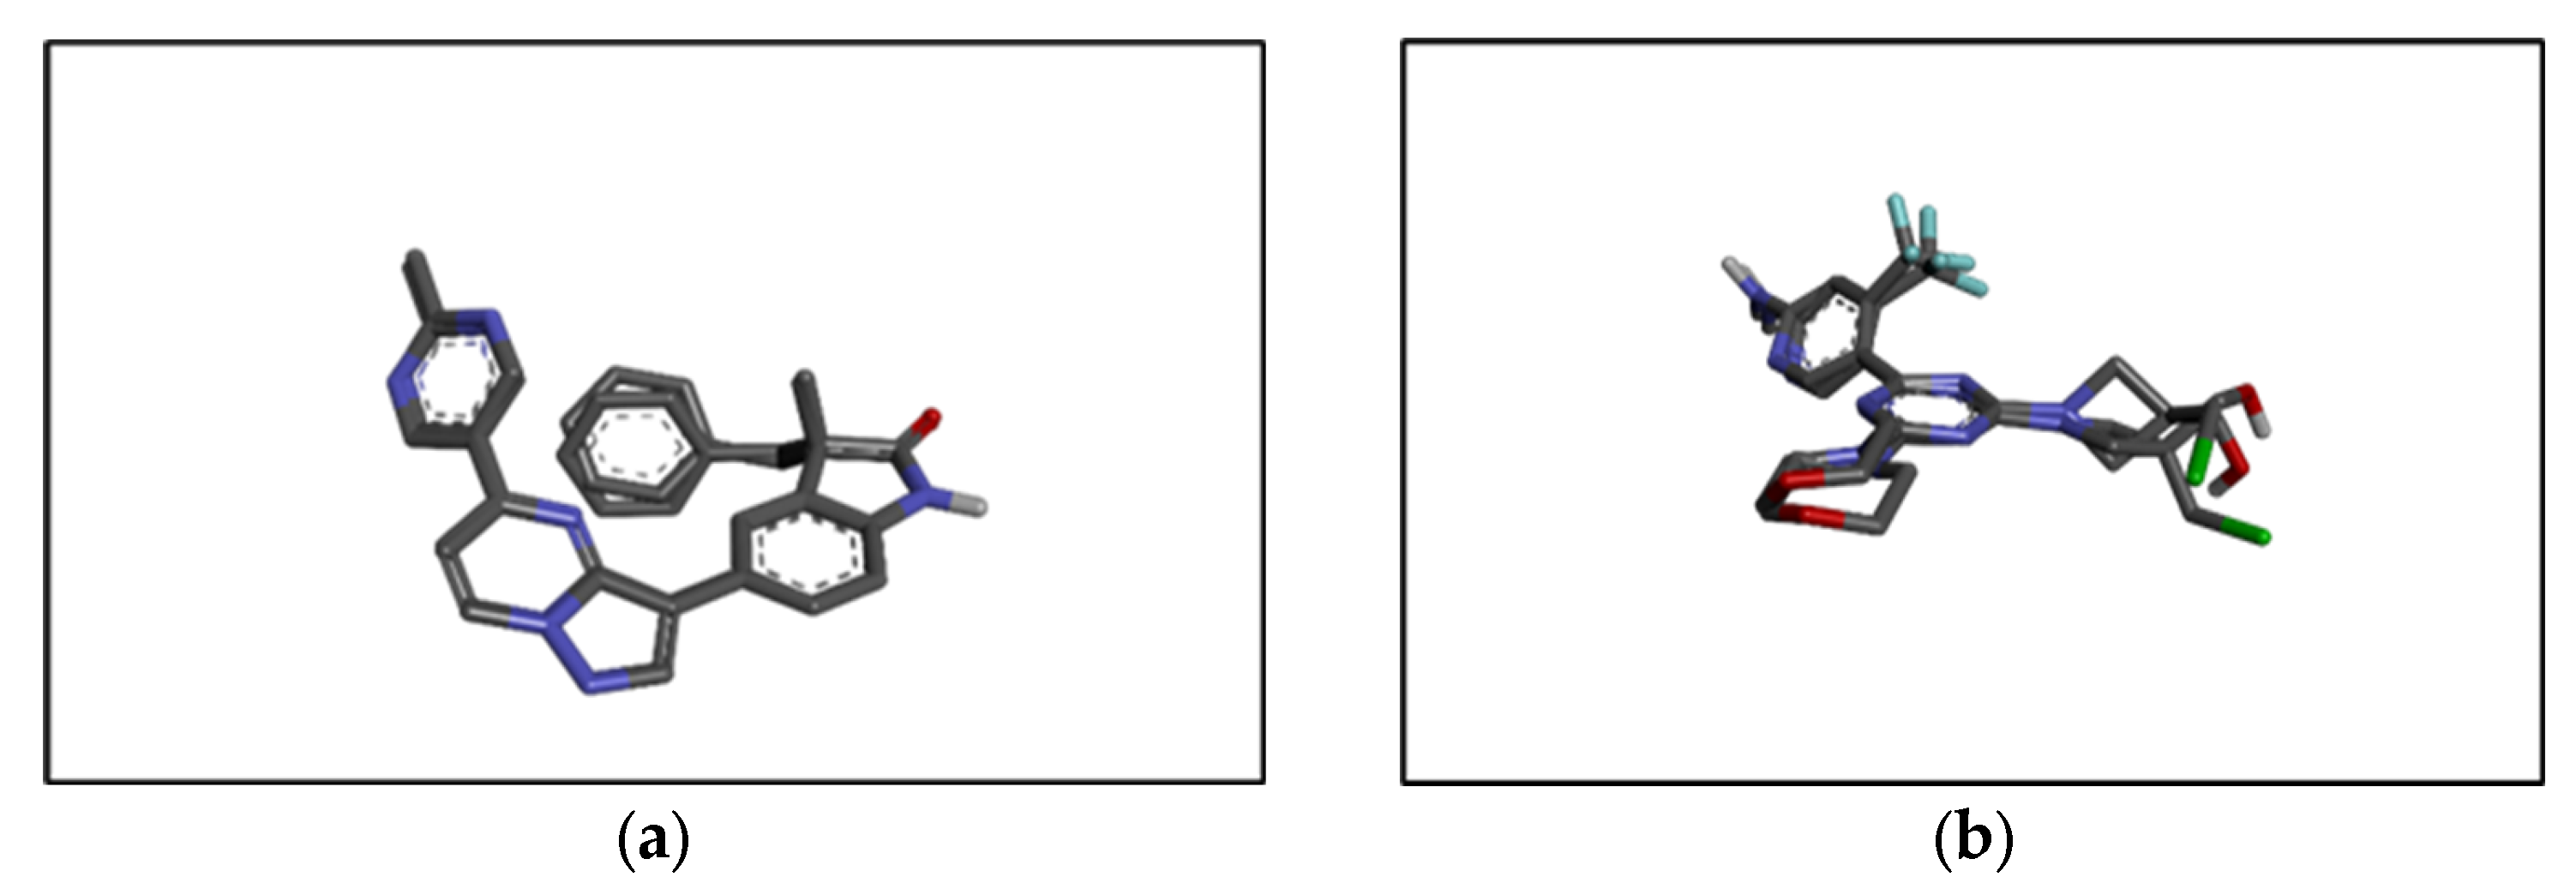
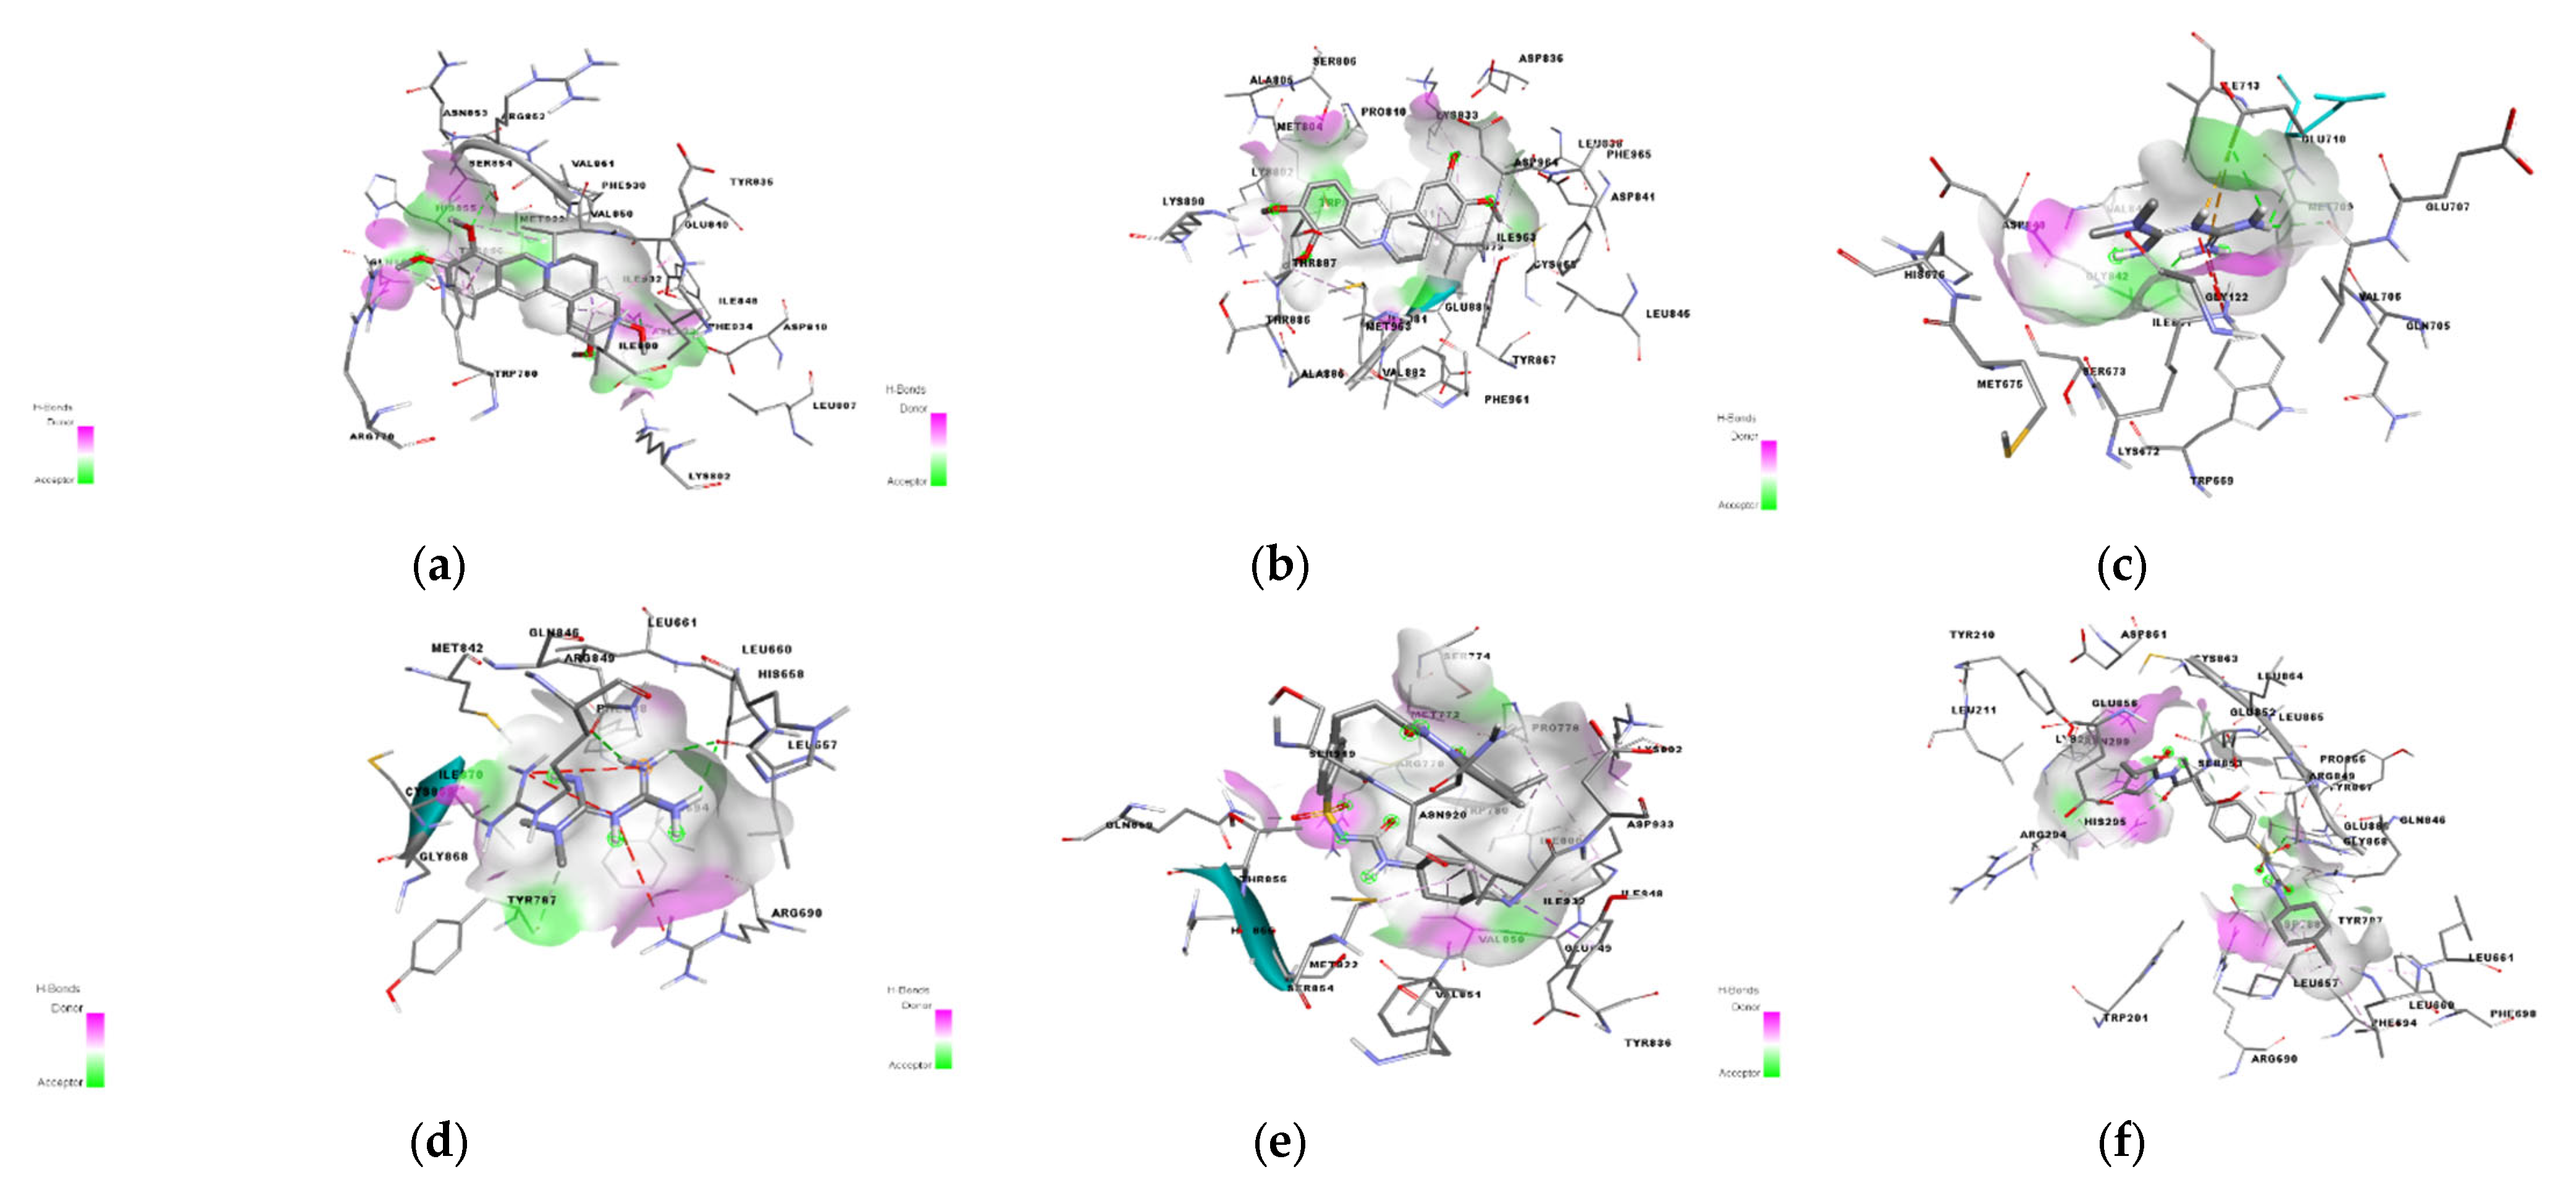
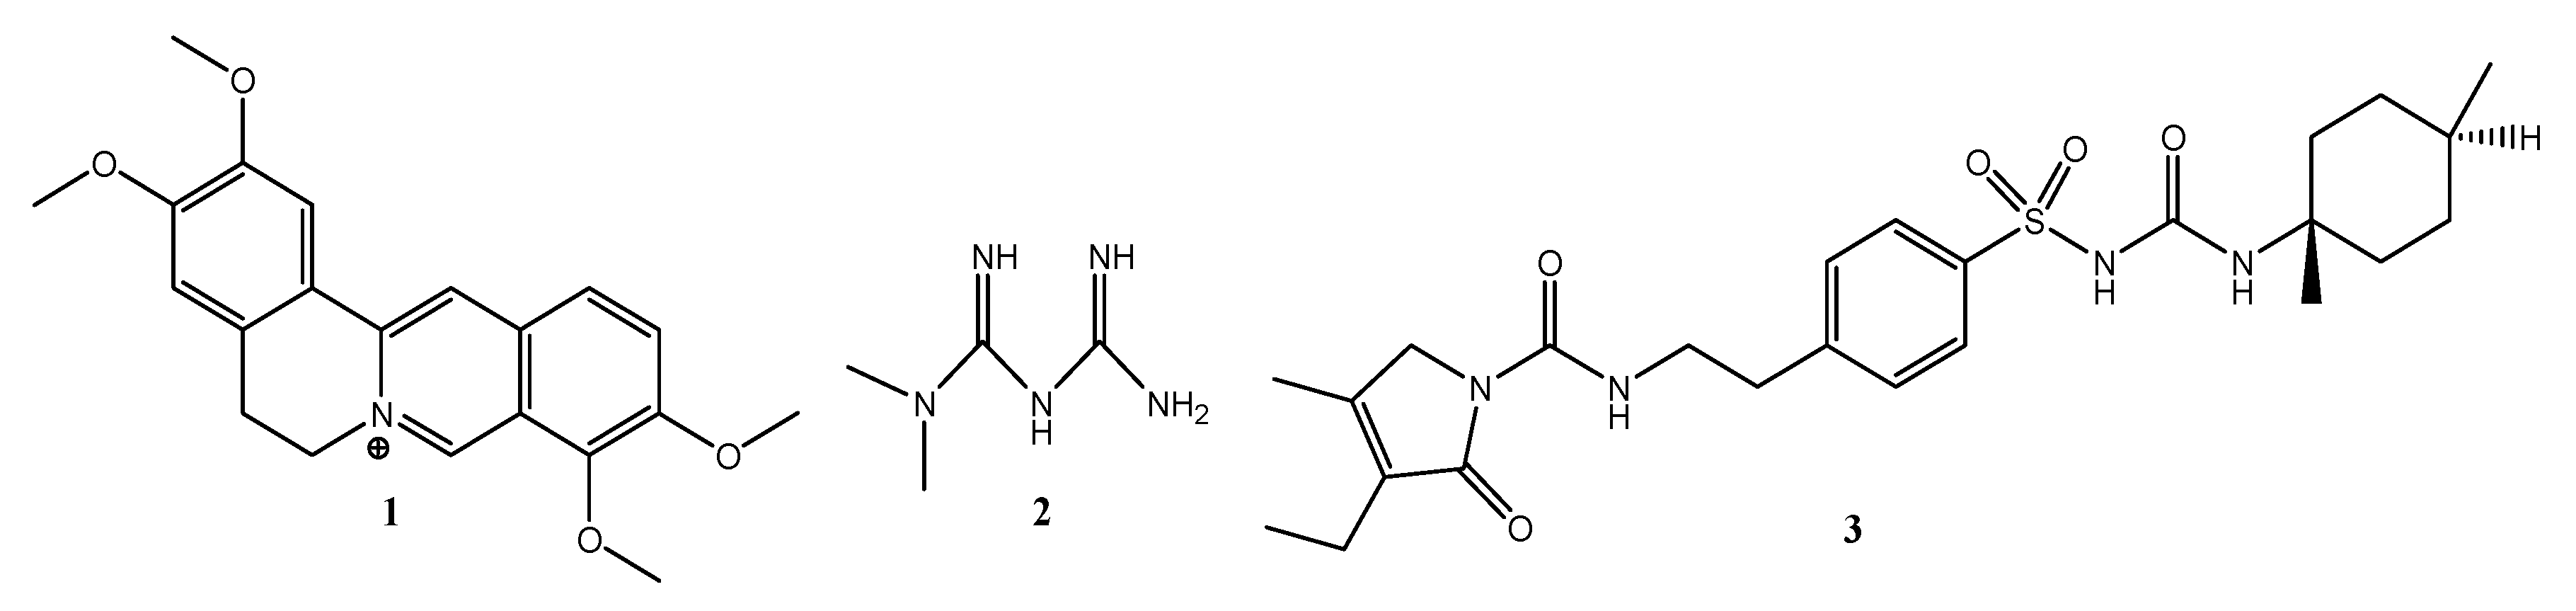
2.6. In Silico Results
2.7. ADME Analysis
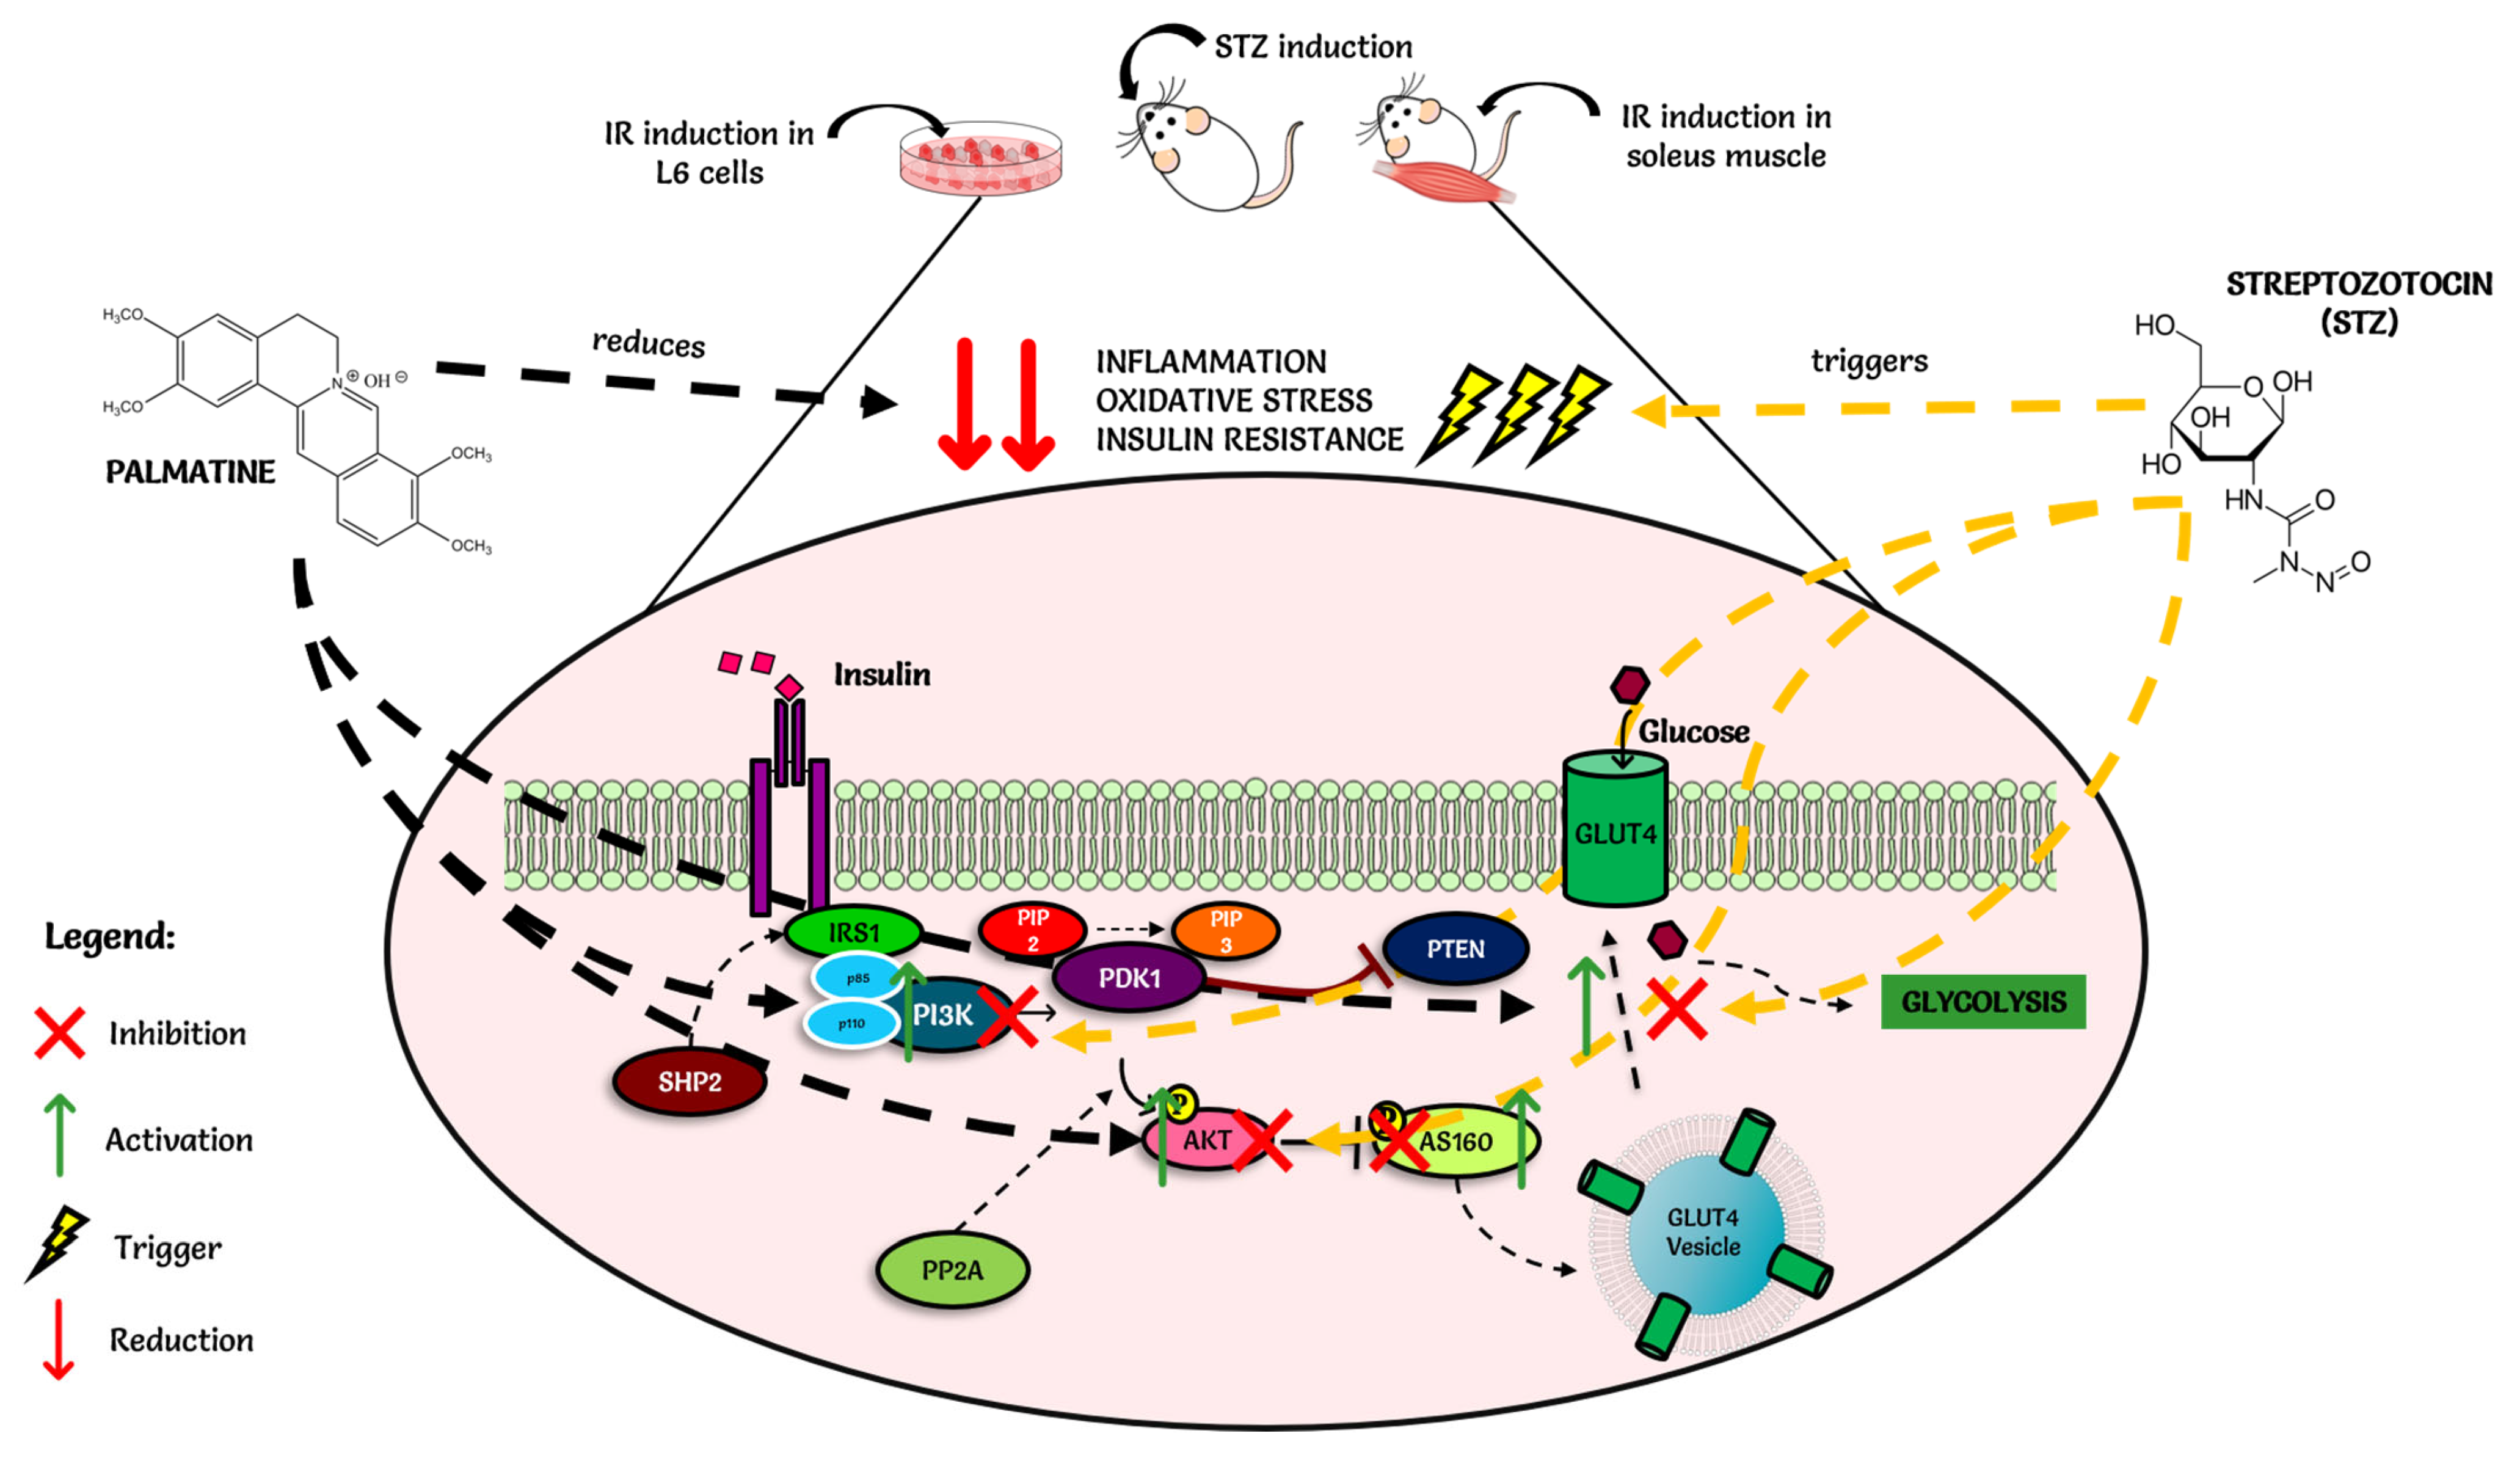
3. Discussion
4. Materials and Methods
4.1. Cell Culture
4.2. Cell Differentiation and Induction of Insulin Resistance
4.3. Animal Preparation
4.4. Induction of Diabetes
4.5. Experimental Design (Grouping and Dosing of Animals)
4.6. Ex Vivo Model Preparation
4.7. Induction of Insulin Resistance into Soleus Muscle Tissue
4.8. Total RNA Isolation and Real-Time PCR
4.9. In Silico Docking of Palmatine with PI3K
4.9.1. Protein Preparation
4.9.2. Ligand Preparation
4.9.3. Redocking of the Co-Crystallized Ligand
4.9.4. Molecular Docking
4.9.5. ADME Method
4.10. Statistical Analysis
5. Conclusions
Author Contributions
Funding
Institutional Review Board Statement
Informed Consent Statement
Data Availability Statement
Acknowledgments
Conflicts of Interest
References
- Olokoba, A.B.; Obateru, O.A.; Olokoba, L.B. Type 2 Diabetes Mellitus: A Review of Current Trends. Oman Med. J. 2012, 27, 269–273. [Google Scholar] [CrossRef] [PubMed]
- Gulati, V.; Gulati, P.; Harding, I.H.; Palombo, E.A. Exploring the anti-diabetic potential of Australian Aboriginal and Indian Ayurvedic plant extracts using cell-based assays. BMC Complement. Altern. Med. 2015, 15, 8. [Google Scholar] [CrossRef] [PubMed]
- Saeedi, P.; Petersohn, I.; Salpea, P.; Malanda, B.; Karuranga, S.; Unwin, N.; Colagiuri, S.; Guariguata, L.; Motala, A.A.; Ogurtsova, K.; et al. Global and regional diabetes prevalence estimates for 2019 and projections for 2030 and 2045: Results from the International Diabetes Federation Diabetes Atlas, 9th edition. Diabetes Res. Clin. Pract. 2019, 157, e107843. [Google Scholar] [CrossRef] [PubMed]
- Wilcox, G. Insulin and insulin resistance. Clin. Biochem. Rev. 2005, 26, 19–39. [Google Scholar] [PubMed]
- Rotella, C.M.; Pala, L.; Mannucci, E. Role of Insulin in the Type 2 Diabetes Therapy: Past, Present and Future. Int. J. Endocrinol. Metab. 2013, 11, 137. [Google Scholar] [CrossRef]
- Boucher, J.; Kleinridders, A.; Kahn, C.R. Insulin Receptor Signaling in Normal and Insulin-Resistant States. Cold Spring Harb. Perspect. Biol. 2014, 6, a009191. [Google Scholar] [CrossRef]
- Mackenzie, R.; Elliott, B. Akt/PKB activation and insulin signaling: A novel insulin signaling pathway in the treatment of type 2 diabetes. Diabetes Metab. Syndr. Obes. 2014, 7, 55–64. [Google Scholar] [CrossRef]
- Bae, U.J.; Choi, E.K.; Oh, M.R.; Jung, S.J.; Park, J.; Jung, T.S.; Park, T.S.; Chae, S.W.; Park, B.H. Angelica gigas Ameliorates Hyperglycemia and Hepatic Steatosis in C57BL/KsJ- db/db Mice via Activation of AMP-Activated Protein Kinase Signaling Pathway. Am. J. Chin. Med. 2016, 44, 1627–1638. [Google Scholar] [CrossRef]
- Selvaraja, M.; Ndyeabura, A.W.; Akowuah, G.A.; Okechukwu, P.N. Antidiabetic Activity of Crude Stem Extracts of Coscinium Fenestratum on Streptozotocin-Induced Type-2 Diabetic Rats. Asian J. Pharm Clin. Res. 2011, 4, 47–51. [Google Scholar]
- Okechukwu, P.N.; Ndyeabura, A.W.; Chiang, C.N. Effect of standardized extract of Cosinium fenestratum stem bark on liver and kidney function parameters in streptozotocin-induced diabetic rats. J. Acute Dis. 2013, 2, 201–206. [Google Scholar] [CrossRef]
- Okechukwu, P.; Sharma, M.; Tan, W.H.; Chan, H.K.; Chirara, K.; Gaurav, A.; Al-Nema, M. In-vitro anti-diabetic activity and in-silico studies of binding energies of palmatine with alpha-amylase, alpha-glucosidase and DPP-IV enzymes. Pharmacia 2020, 67, 363–371. [Google Scholar] [CrossRef]
- Ekeuku, S.O.; Okechukwu, P.N.; Akowoah, G.A.; Teo, S.S.; Siyumbwa, S.N.; Froemming, G.R.A. Plasma Glucose Lowering Activity of Palmatine and its Effect on Liver, Kidney and Antioxidant Enzymes Parameters in STZ Induced Diabetic Rat Model. Curr. Bioact. Compd. 2015, 11, 256–263. [Google Scholar] [CrossRef]
- Okechukwu, P.N.; Ekeuku, S.O.; Chan, H.K.; Eluri, K.; Froemming, G.R.A. Palmatine Inhibits Up-Regulation of GRP78 and CALR Protein in an STZ-Induced Diabetic Rat Model. Curr. Pharm. Biotech. 2021, 22, 288–298. [Google Scholar] [CrossRef] [PubMed]
- Jiang, K.; Liu, Y.; Fan, J.; Epperly, G.; Gao, T.; Jiang, J.; Jia, J. Hedgehog-regulated atypical PKC promotes phosphorylation and activation of Smoothened and Cubitus interruptus in Drosophila. Proc. Natl. Acad. Sci. USA 2014, 111, E4842–E4850. [Google Scholar] [CrossRef] [PubMed]
- Xing, M.; Akowuah, G.A.; Gautam, V.; Gaurav, A. Structure-based design of selective phosphodiesterase 4B inhibitors based on ginger phenolic compounds. J. Biomol. Struct. Dyn. 2017, 35, 2910–2924. [Google Scholar] [CrossRef] [PubMed]
- Kufareva, I.; Abagyan, R. Methods of protein structure comparison. Methods Mol. Biol. 2012, 857, 231–257. [Google Scholar] [CrossRef] [PubMed]
- Vinh, N.B.; Simpson, J.S.; Scammells, P.J.; Chalmers, D.K. Virtual screening using a conformationally flexible target protein: Models for ligand binding to p38α MAPK. J. Comput. Aided Mol. Des. 2012, 26, 409–423. [Google Scholar] [CrossRef] [PubMed]
- Zhang, H.; Wang, Y.; Xu, F. Impact of the subtle differences in MMP-12 structure on Glide-based molecular docking for pose prediction of inhibitors. J. Mol. Struct. 2014, 1076, 153–159. [Google Scholar] [CrossRef]
- Beale, E.G. Insulin Signaling and Insulin Resistance. J. Investig. Med. 2013, 61, 11–14. [Google Scholar] [CrossRef]
- Zhang, Z.Y.; Miao, L.F.; Qian, L.L.; Wang, N.; Qi, M.M.; Zhang, Y.M.; Dang, S.P.; Wu, Y.; Wang, R.X. Molecular Mechanisms of Glucose Fluctuations on Diabetic Complications. Front. Endocrinol. 2019, 10, 640. [Google Scholar] [CrossRef]
- Kong, L.; Wang, Q.; Jin, J.; Xiang, Z.; Chen, T.; Shen, S.; Wang, H.; Gao, Q.; Wang, Y. Correction: Insulin resistance enhances the mitogen-activated protein kinase signaling pathway in ovarian granulosa cells. PLoS ONE 2021, 12, e0249806. [Google Scholar] [CrossRef]
- Akhtar, A.; Sah, S.P. Insulin signaling pathway and related molecules: Role in neurodegeneration and Alzheimer’s disease. Neurochem. Int. 2020, 135, 104707. [Google Scholar] [CrossRef]
- Katsoulieris, E.N.; Drossopoulou, G.I.; Kotsopoulou, E.S.; Vlahakos, D.V.; Lianos, E.A.; Tsilibary, E.C. High Glucose Impairs Insulin Signaling in the Glomerulus: An In Vitro and Ex Vivo Approach. PLoS ONE 2016, 11, e0158873. [Google Scholar] [CrossRef]
- Świderska, E.; Strycharz, J.; Wróblewski, A.; Szemraj, J.; Drzewoski, J.; Śliwińska, A. Role of PI3K/AKT Pathway in Insulin-Mediated Glucose Uptake. In Blood Glucose Levels; Szablewski, L., Ed.; IntechOpen: London, UK, 2018. [Google Scholar] [CrossRef]
- Smith, A.G.; Muscat, G.E.O. Skeletal muscle and nuclear hormone receptors: Implications for cardiovascular and metabolic disease. Int. J. Biochem. Cell Biol. 2005, 37, 2047–2063. [Google Scholar] [CrossRef]
- Gupta, R.N.; Pareek, A.; Suthar, M.; Rathore, G.S.; Basniwal, P.K.; Jain, D. Study of glucose uptake activity of Helicteres isora Linn. fruits in L-6 cell lines. Int. J. Diabetes Dev. Ctries. 2009, 29, 170–173. [Google Scholar] [CrossRef]
- Li, Z.; Meng, H.; Zhang, W. Effect of Coscinium Fenestratum stem extracts on hypertension in animal model. Prog. Biosci. Bioeng. 2017, 1, 1–12. [Google Scholar] [CrossRef]
- Guo, S. Insulin signaling, resistance, and metabolic syndrome: Insights from mouse models into disease mechanisms. J. Endocrinol. 2014, 220, T1–T23. [Google Scholar] [CrossRef] [PubMed]
- Tian, C.; Chang, H.; La, X.; Li, J. Wushenziye Formula Improves Skeletal Muscle Insulin Resistance in Type 2 Diabetes Mellitus via PTP1B-IRS1-Akt-GLUT4 Signaling Pathway. Evid. Based Complement. Altern. Med. 2017, 2017, 4393529. [Google Scholar] [CrossRef] [PubMed]
- Fruman, D.A.; Chiu, H.; Hopkins, B.D.; Bagrodia, S.; Cantley, L.C.; Abraham, R.T. The PI3K Pathway in Human Disease. Cell 2017, 170, 605–635. [Google Scholar] [CrossRef] [PubMed]
- Huang, X.; Liu, G.; Guo, J.; Su, Z. The PI3K/AKT pathway in obesity and type 2 diabetes. Int. J. Biol. Sci. 2018, 14, 1483–1496. [Google Scholar] [CrossRef] [PubMed]
- Al-Ishaq, R.K.; Abotaleb, M.; Kubatka, P.; Kajo, K.; Büsselberg, D. Flavonoids and Their Anti-Diabetic Effects: Cellular Mechanisms and Effects to Improve Blood Sugar Levels. Biomolecules 2019, 9, 430. [Google Scholar] [CrossRef] [PubMed]
- Sharma, M.; Masroor, W.S.; Xavier, M.; Hui, T.W.; Chan, H.K.; Chirara, K.; Okechukwu, P.N. Antioxidant and anti-advanced glycation end products formation properties of palmatine. J. Pharm. Pharm. Res. 2021, 9, 366–378. [Google Scholar]
- Shaban, S.; El-Husseny, M.W.A.; Abushouk, A.I.; Salem, A.M.A.; Mamdouh, M.; Abdel-Daim, M.M. Effects of Antioxidant Supplements on the Survival and Differentiation of Stem Cells. Oxidative Med. Cell. Longev. 2017, 2017, 5032102. [Google Scholar] [CrossRef] [PubMed]
- Shafi, S.; Ansari, H.R.; Bahitham, W.; Aouabdi, S. The Impact of Natural Antioxidants on the Regenerative Potential of Vascular Cells. Front. Cardiovasc. Med. 2019, 6, 28. [Google Scholar] [CrossRef] [PubMed]
- Barlovic, D.; Thomas, M.; Jandeleit-Dahm, K. Cardiovascular Disease: What’s All the AGE/RAGE About? Cardiovasc. Hematol. Disord. Drug Targets 2010, 10, 7–15. [Google Scholar] [CrossRef]
- Vlassara, H.; Striker, G.E. Advanced glycation endproducts in diabetes and diabetic complications. Endocrinol. Metab. Clin. N. Am. 2013, 42, 697–719. [Google Scholar] [CrossRef] [PubMed]
- Monnier, V.M.; Sun, W.; Sell, D.R.; Fan, X.; Nemet, I.; Genuth, S. Glucosepane: A poorly understood advanced glycation end product of growing importance for diabetes and its complications. Clin. Chem. Lab Med. 2014, 52, 21–32. [Google Scholar] [CrossRef]
- Vlassara, H.; Uribarri, J. Advanced Glycation End Products (AGE) and Diabetes: Cause, Effect, or Both? Curr. Diab. Rep. 2014, 14, 453. [Google Scholar] [CrossRef]
- Alikhani, M.; MacLellan, C.M.; Raptis, M.; Vora, S.; Trackman, P.C.; Graves, D.T. Advanced glycation end products induce apoptosis in fibroblasts through activation of ROS, MAP kinases, and the FOXO1 transcription factor. Am. J. Physiol. Cell Physiol. 2007, 292, C850–C856. [Google Scholar] [CrossRef]
- Hsu, W.H.; Hsieh, Y.S.; Kuo, H.C.; Teng, C.Y.; Huang, H.I.; Wang, C.J.; Yang, S.F.; Liou, Y.S.; Kuo, W.H. Berberine induces apoptosis in SW620 human colonic carcinoma cells through generation of reactive oxygen species and activation of JNK/p38 MAPK and FasL. Arch. Toxicol. 2007, 81, 719–728. [Google Scholar] [CrossRef]
- Gangoiti, M.V.; Cortizo, A.M.; Arnol, V.; Felice, J.I.; McCarthy, A.D. Opposing effects of bisphosphonates and advanced glycation end-products on osteoblastic cells. Eur. J. Pharmacol. 2008, 600, 140–147. [Google Scholar] [CrossRef]
- Lien, S.C.; Chang, S.F.; Lee, P.L.; Wei, S.Y.; Chang, M.D.T.; Chang, J.Y.; Chiu, J.J. Mechanical regulation of cancer cell apoptosis and autophagy: Roles of bone morphogenetic protein receptor, Smad1/5, and p38 MAPK. Biochim. Biophys. Acta 2013, 1833, 3124–3133. [Google Scholar] [CrossRef]
- Shi, L.; Yu, X.; Yang, H.; Wu, X. Advanced Glycation End Products Induce Human Corneal Epithelial Cells Apoptosis through Generation of Reactive Oxygen Species and Activation of JNK and p38 MAPK Pathways. PLoS ONE 2013, 8, e66781. [Google Scholar] [CrossRef] [PubMed]
- Yin, Y.; Liu, W.; Ji, G.; Dai, Y. The essential role of p38 MAPK in mediating the interplay of oxLDL and IL-10 in regulating endothelial cell apoptosis. Eur. J. Cell Biol. 2013, 92, 150–159. [Google Scholar] [CrossRef] [PubMed]
- Zhang, W.; Lan, Y.; Huang, Q.; Hua, Z. Galangin induces B16F10 melanoma cell apoptosis via mitochondrial pathway and sustained activation of p38 MAPK. Cytotechnology 2013, 65, 447–455. [Google Scholar] [CrossRef] [PubMed]
- Pan, Y.; Liang, H.; Liu, H.; Li, D.; Chen, X.; Li, L.; Zhang, C.Y.; Zen, K. Platelet-Secreted MicroRNA-223 Promotes Endothelial Cell Apoptosis Induced by Advanced Glycation End Products via Targeting the Insulin-like Growth Factor 1 Receptor. J. Immunol. 2014, 192, 437–446. [Google Scholar] [CrossRef] [PubMed]
- Zheng, F.; Tang, Q.; Wu, J.; Zhao, S.; Liang, Z.; Li, L.; Wu, W.; Hann, S. p38α MAPK-mediated induction and interaction of FOXO3a and p53 contribute to the inhibited-growth and induced-apoptosis of human lung adenocarcinoma cells by berberine. J. Exp. Clin. Cancer Res. 2014, 33, 33–36. [Google Scholar] [CrossRef] [PubMed]
- Kim, S.; Kwon, J. COMP-Ang1 inhibits apoptosis as well as improves the attenuated osteogenic differentiation of mesenchymal stem cells induced by advanced glycation end products. Biochim. Biophys. Acta 2013, 1830, 4928–4934. [Google Scholar] [CrossRef]
- Sun, C.; Liang, C.; Ren, Y.; Zhen, Y.; He, Z.; Wang, H.; Tan, H.; Pan, X.; Wu, Z. Advanced glycation end products depress function of endothelial progenitor cells via p38 and ERK 1/2 mitogen-activated protein kinase pathways. Basic Res. Cardiol. 2009, 104, 42–49. [Google Scholar] [CrossRef]
- Zhou, Q.; Yang, X.; Xiong, M.; Xu, X.; Zhen, L.; Chen, W.; Wang, Y.; Shen, J.; Zhao, P.; Liu, Q.H. Chloroquine Increases Glucose Uptake via Enhancing GLUT4 Translocation and Fusion with the Plasma Membrane in L6 Cells. Cell. Physiol. Biochem. 2016, 38, 2030–2040. [Google Scholar] [CrossRef]
- Morris, G.M.; Huey, R.; Lindstrom, W.; Sanner, M.F.; Belew, R.K.; Goodsell, D.S.; Olson, A.J. AutoDock4 and AutoDockTools4: Automated docking with selective receptor flexibility. J. Comput. Chem. 2009, 30, 2785–2791. [Google Scholar] [CrossRef] [PubMed]
- Trott, O.; Olson, A.J. AutoDock Vina: Improving the speed and accuracy of docking with a new scoring function, efficient optimization, and multithreading. J. Comput. Chem. 2010, 31, 455–461. [Google Scholar] [CrossRef] [PubMed]


| Protein-Ligand | RMSD Value (Å) |
|---|---|
| PI3K alpha–P5J | 0.292 |
| P13K gamma–6K5 | 1.274 |
| Item | Binding Energy (kcal/mol) | |
|---|---|---|
| PI3K Gamma | PI3K Alpha | |
| Glimepiride | −8.3 | −10 |
| Metformin | −5.0 | −4.9 |
| Palmatine | −8.2 | −9.2 |
| No | Molecular Mass (M) | H-Bond Acceptors | H-Bond Donors | Rotatable Bonds | TPSA | LogP Consensus | Lipinski’s Rules | Ghose’s Rules | Veber’s Rules | Muegge’s Rules |
|---|---|---|---|---|---|---|---|---|---|---|
| 1 | 352 | 4 | 0 | 4 | 40.80 | 2.64 | + | + | + | + |
| 2 | 129 | 3 | 2 | 4 | 36.93 | 0.75 | + | - | + | - |
| 3 | 490 | 11 | 5 | 3 | 133 | 2.76 | + | - | - | + |
Publisher’s Note: MDPI stays neutral with regard to jurisdictional claims in published maps and institutional affiliations. |
© 2022 by the authors. Licensee MDPI, Basel, Switzerland. This article is an open access article distributed under the terms and conditions of the Creative Commons Attribution (CC BY) license (https://creativecommons.org/licenses/by/4.0/).
Share and Cite
Nwabueze, O.P.; Sharma, M.; Balachandran, A.; Gaurav, A.; Abdul Rani, A.N.; Małgorzata, J.; Beata, M.-M.; Lavilla, C.A., Jr.; Billacura, M.P. Comparative Studies of Palmatine with Metformin and Glimepiride on the Modulation of Insulin Dependent Signaling Pathway In Vitro, In Vivo & Ex Vivo. Pharmaceuticals 2022, 15, 1317. https://doi.org/10.3390/ph15111317
Nwabueze OP, Sharma M, Balachandran A, Gaurav A, Abdul Rani AN, Małgorzata J, Beata M-M, Lavilla CA Jr., Billacura MP. Comparative Studies of Palmatine with Metformin and Glimepiride on the Modulation of Insulin Dependent Signaling Pathway In Vitro, In Vivo & Ex Vivo. Pharmaceuticals. 2022; 15(11):1317. https://doi.org/10.3390/ph15111317
Chicago/Turabian StyleNwabueze, Okechukwu Patrick, Mridula Sharma, Abbirami Balachandran, Anand Gaurav, Anis Najwa Abdul Rani, Jeleń Małgorzata, Morak-Młodawska Beata, Charlie A. Lavilla, Jr., and Merell P. Billacura. 2022. "Comparative Studies of Palmatine with Metformin and Glimepiride on the Modulation of Insulin Dependent Signaling Pathway In Vitro, In Vivo & Ex Vivo" Pharmaceuticals 15, no. 11: 1317. https://doi.org/10.3390/ph15111317
APA StyleNwabueze, O. P., Sharma, M., Balachandran, A., Gaurav, A., Abdul Rani, A. N., Małgorzata, J., Beata, M.-M., Lavilla, C. A., Jr., & Billacura, M. P. (2022). Comparative Studies of Palmatine with Metformin and Glimepiride on the Modulation of Insulin Dependent Signaling Pathway In Vitro, In Vivo & Ex Vivo. Pharmaceuticals, 15(11), 1317. https://doi.org/10.3390/ph15111317