
Non-Cryoprecipitation Separation of Coagulation FVIII and Prothrombin Complex Proteins by Pseudoaffinity Calcium Elution Chromatography Using Anion Exchange Resin

 and
and
Abstract
: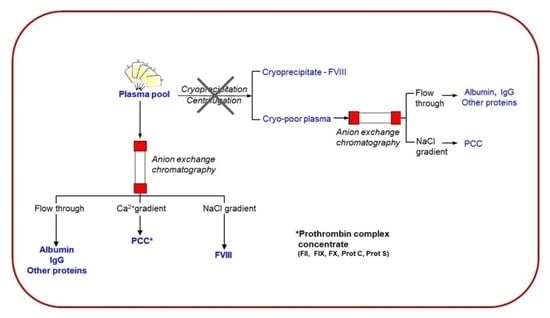
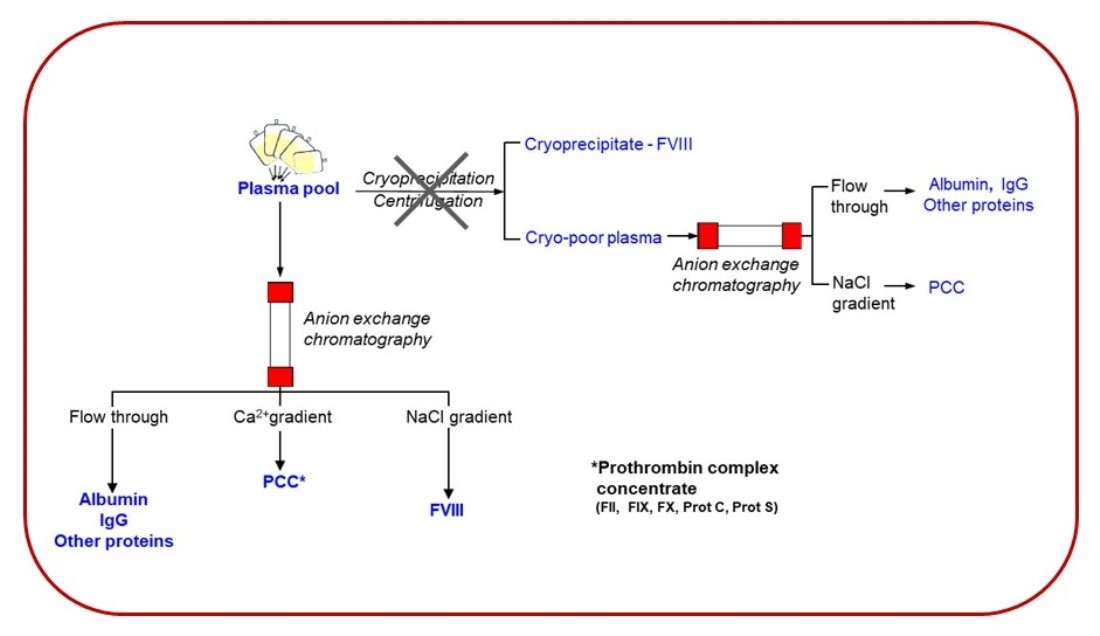
1. Introduction
2. Results
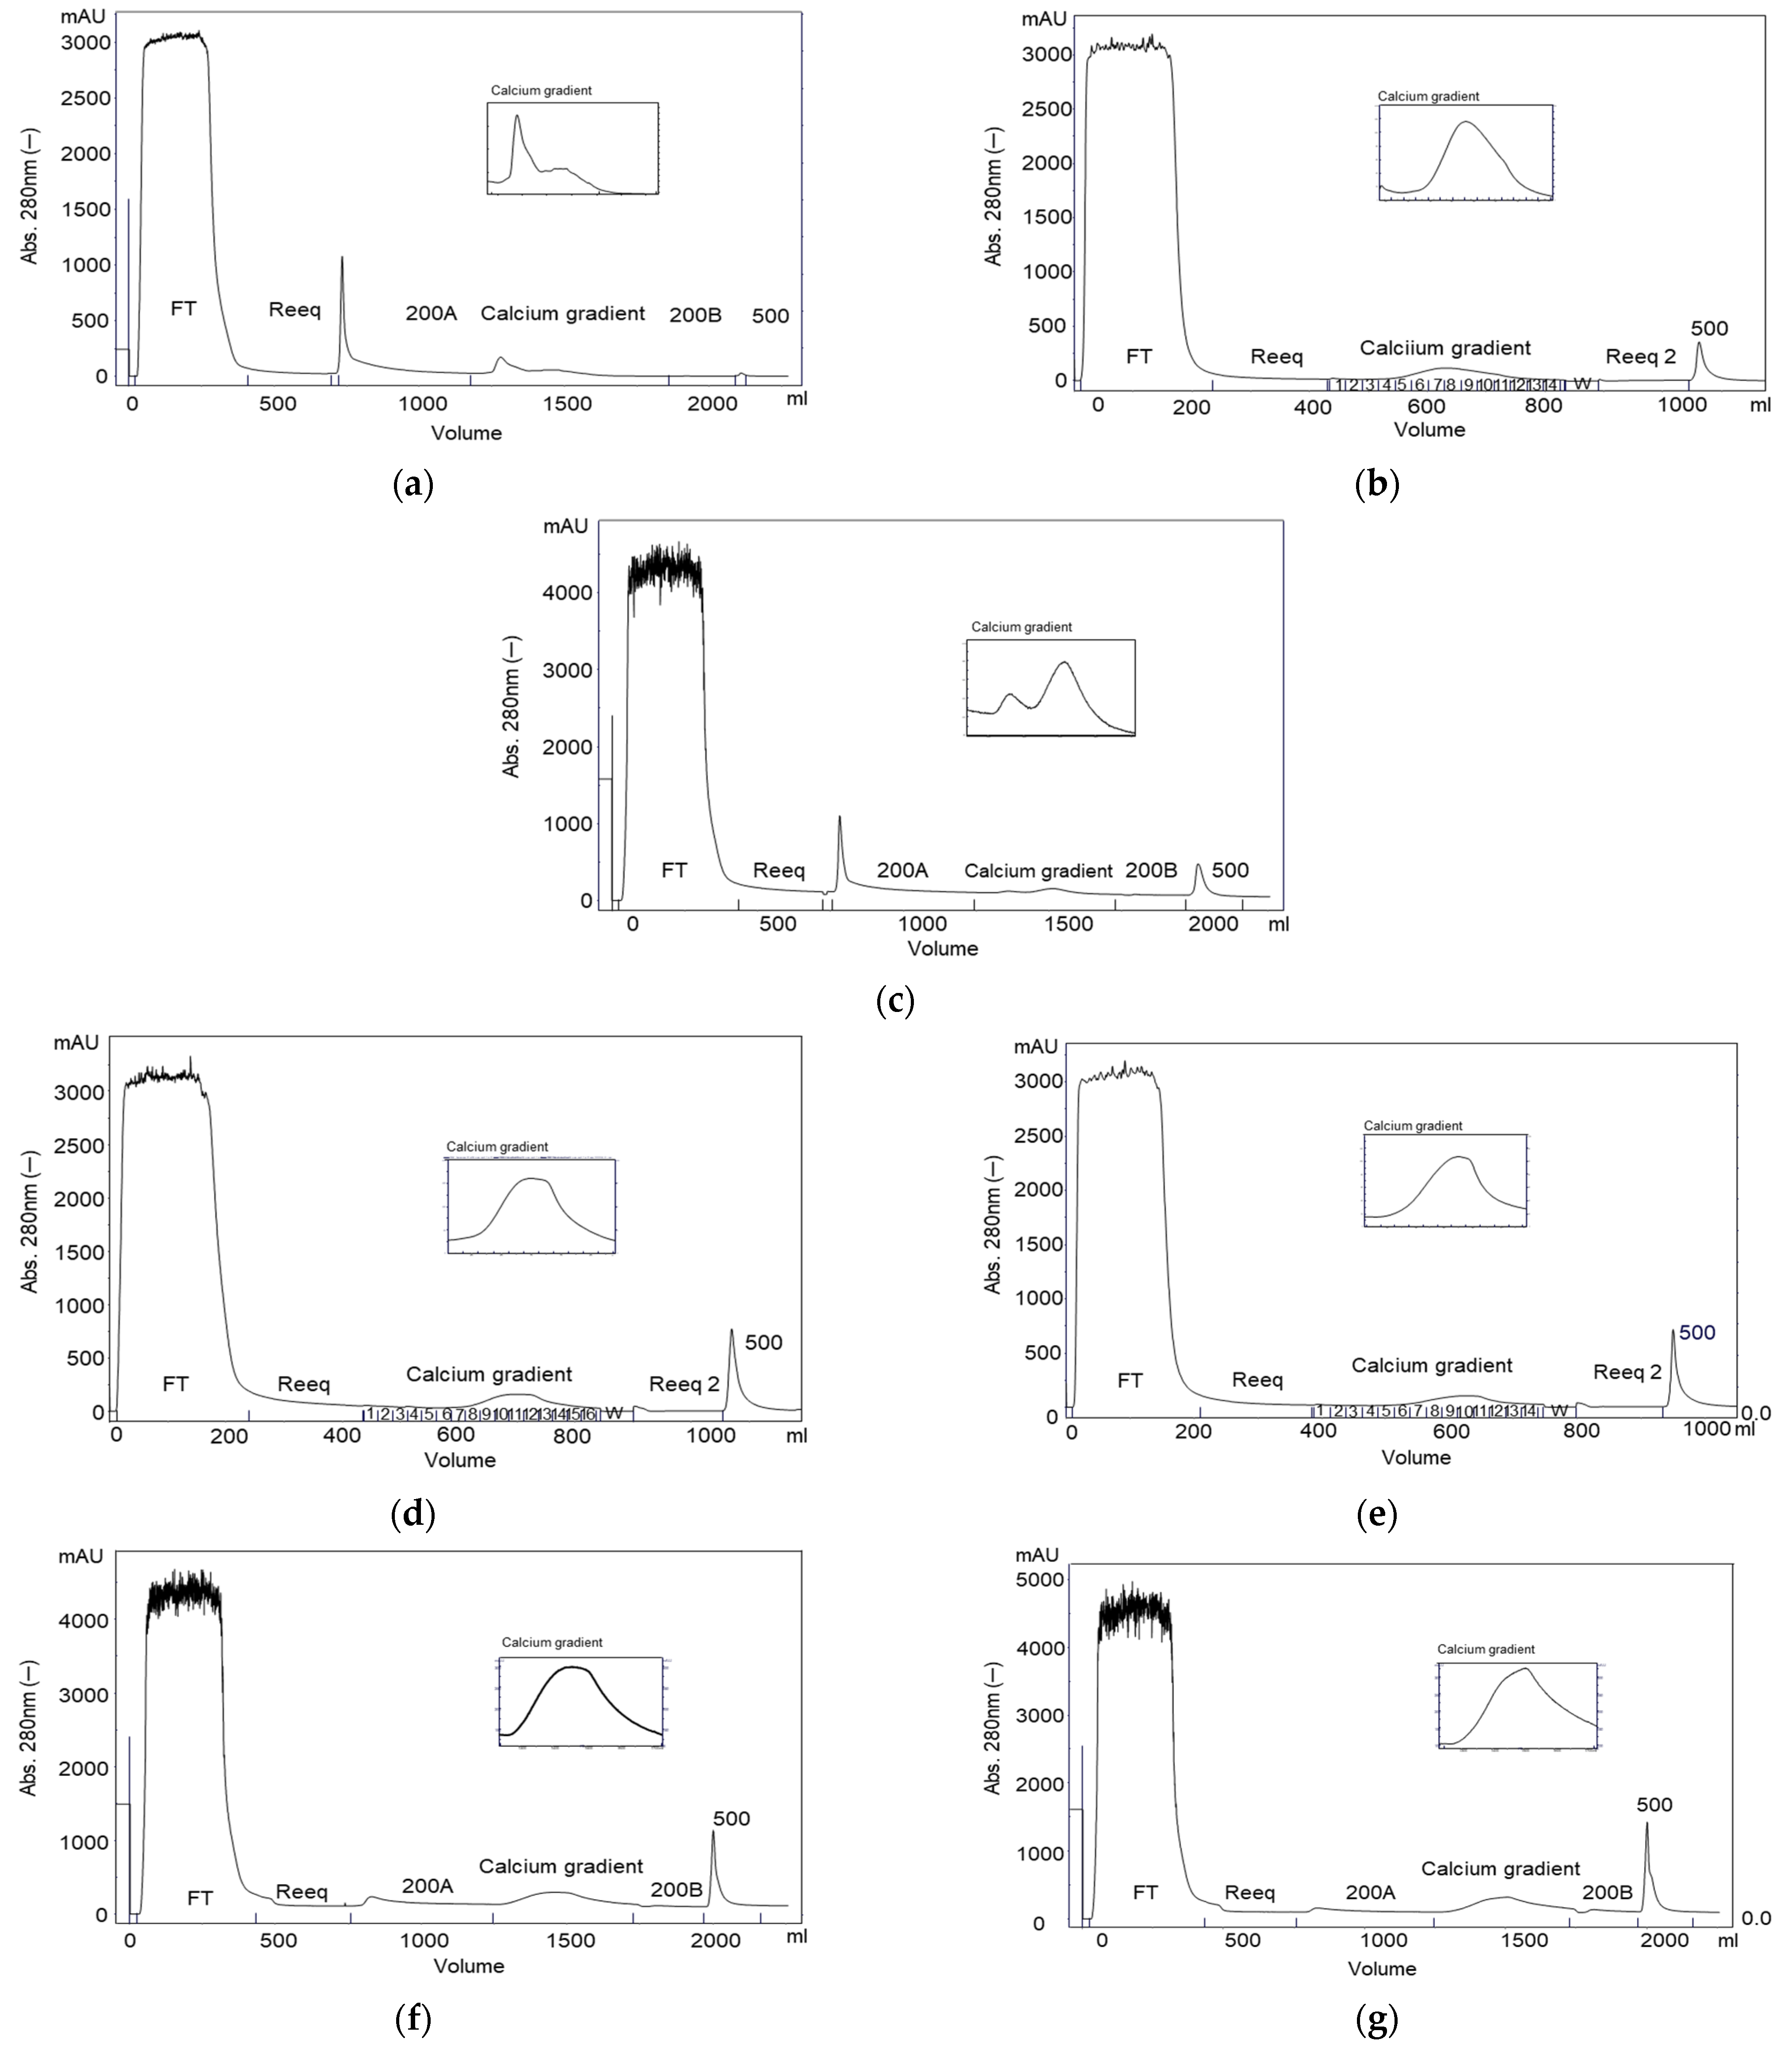
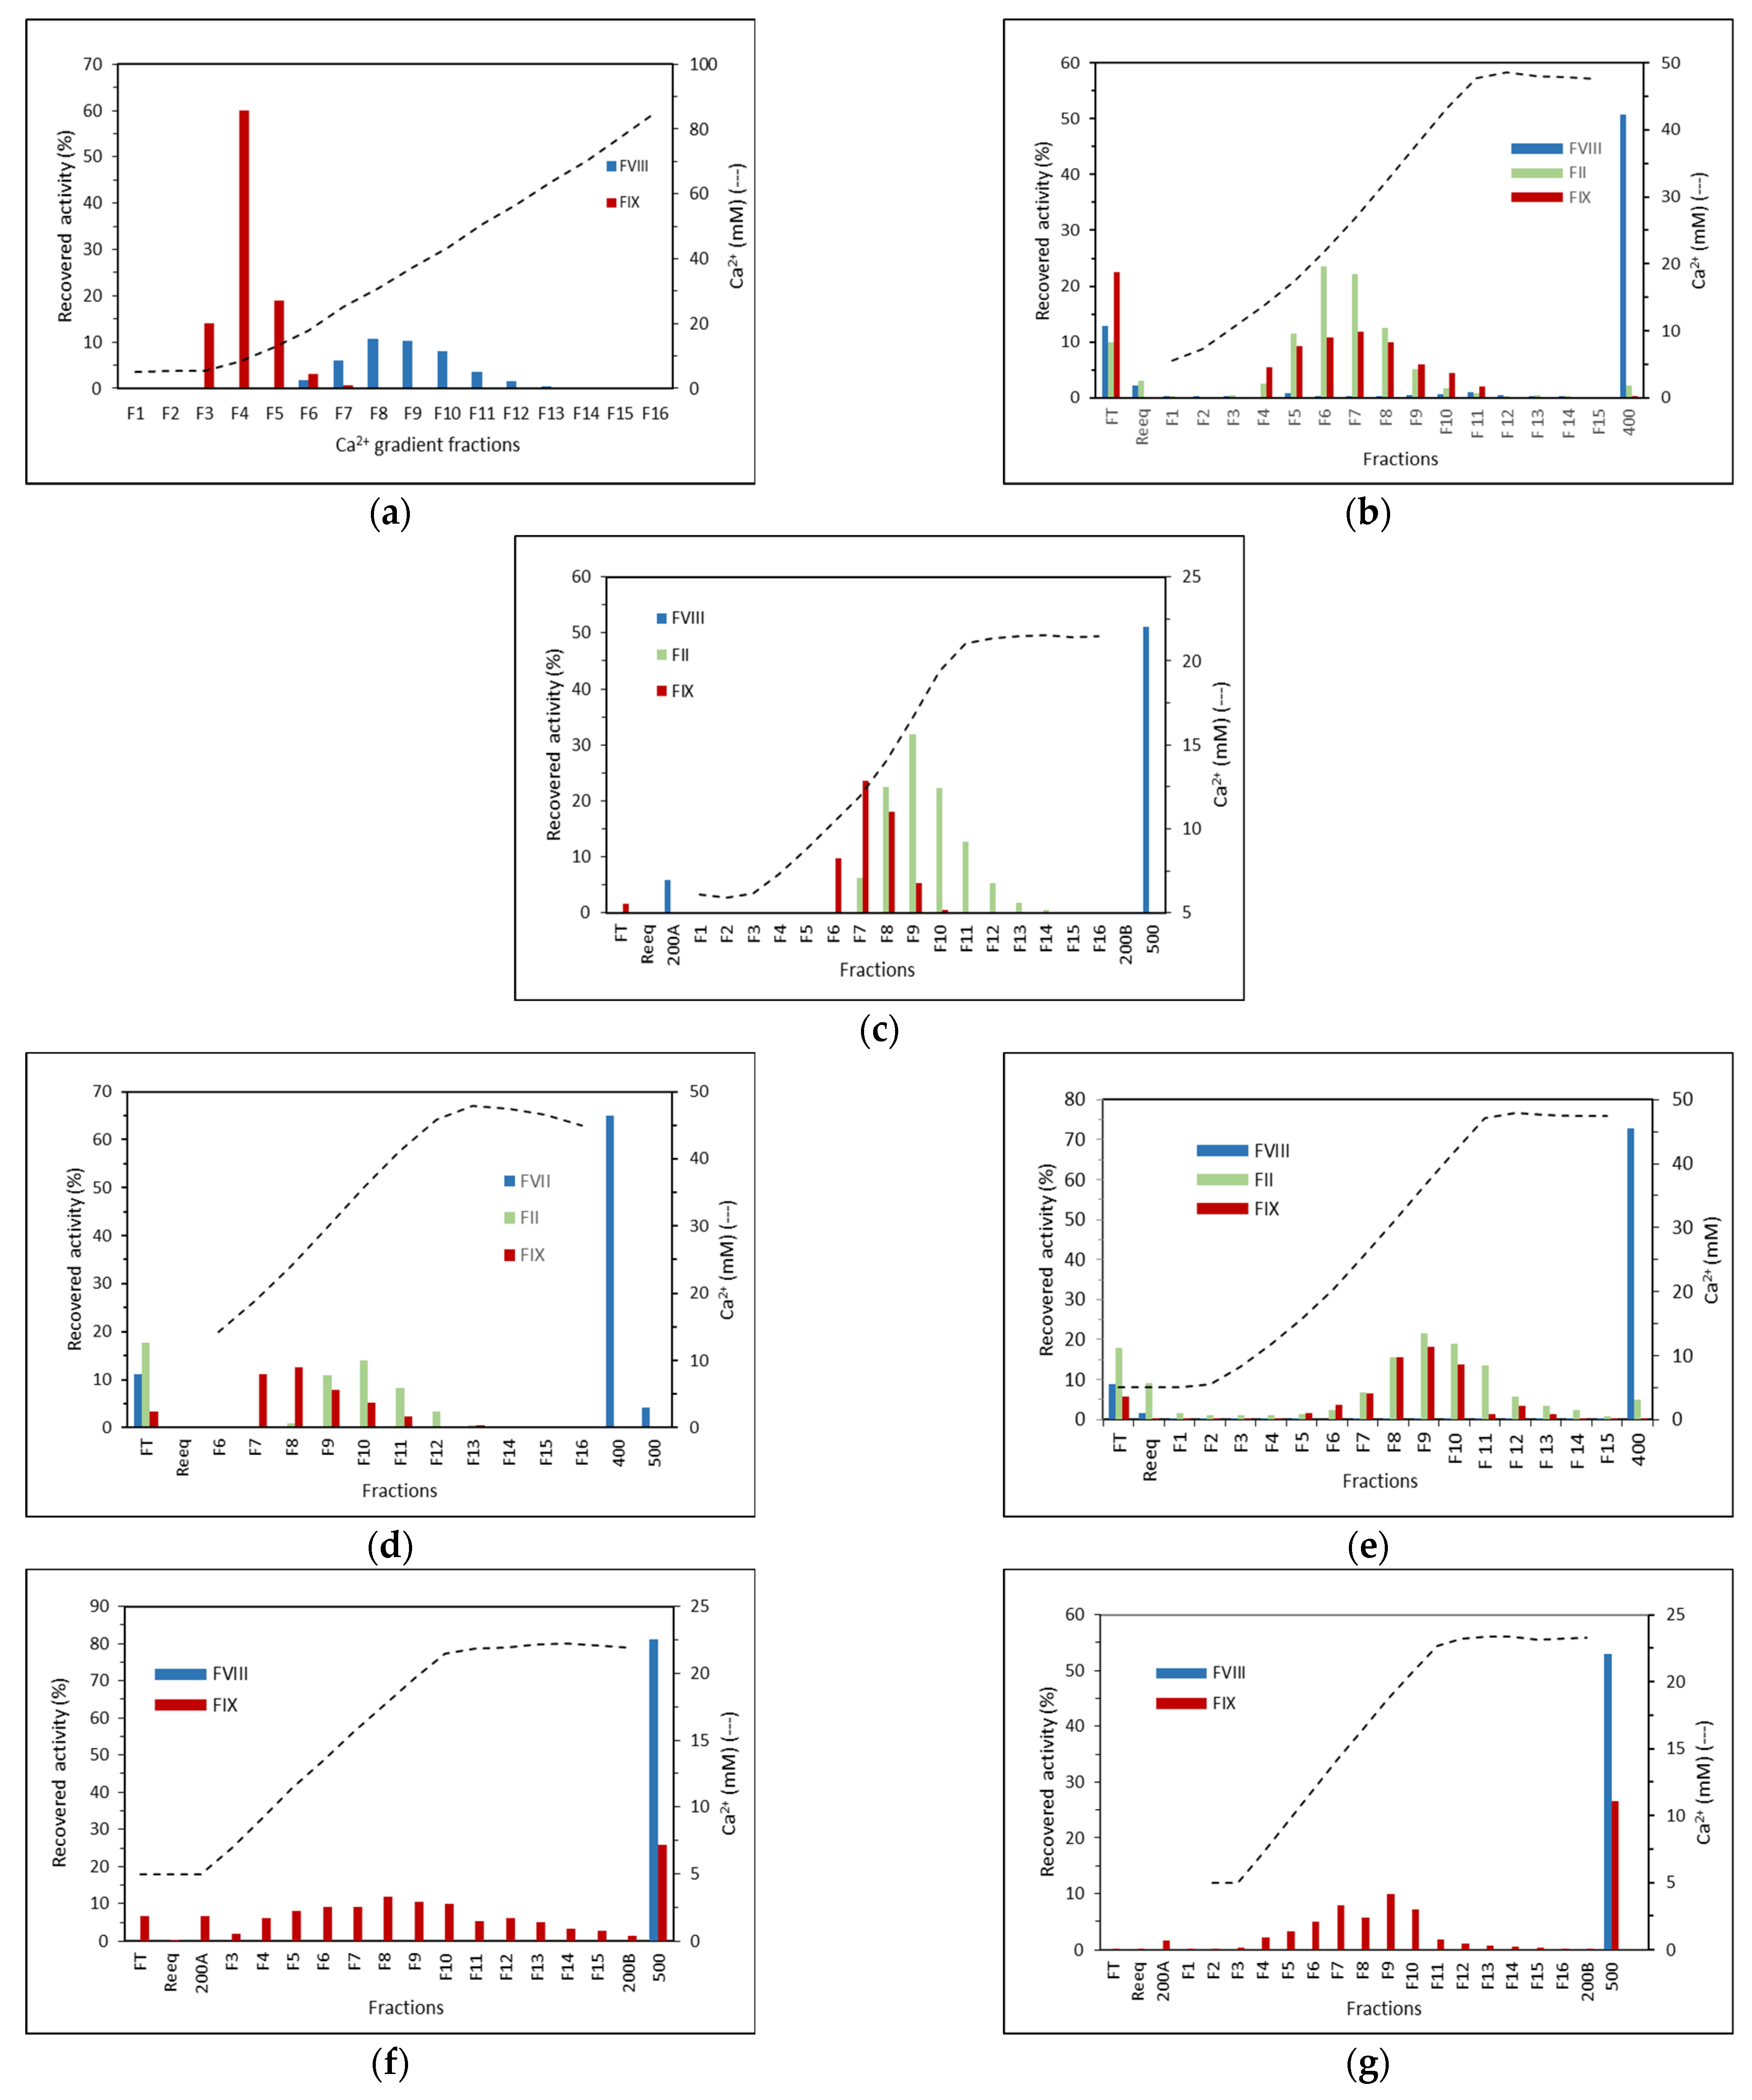
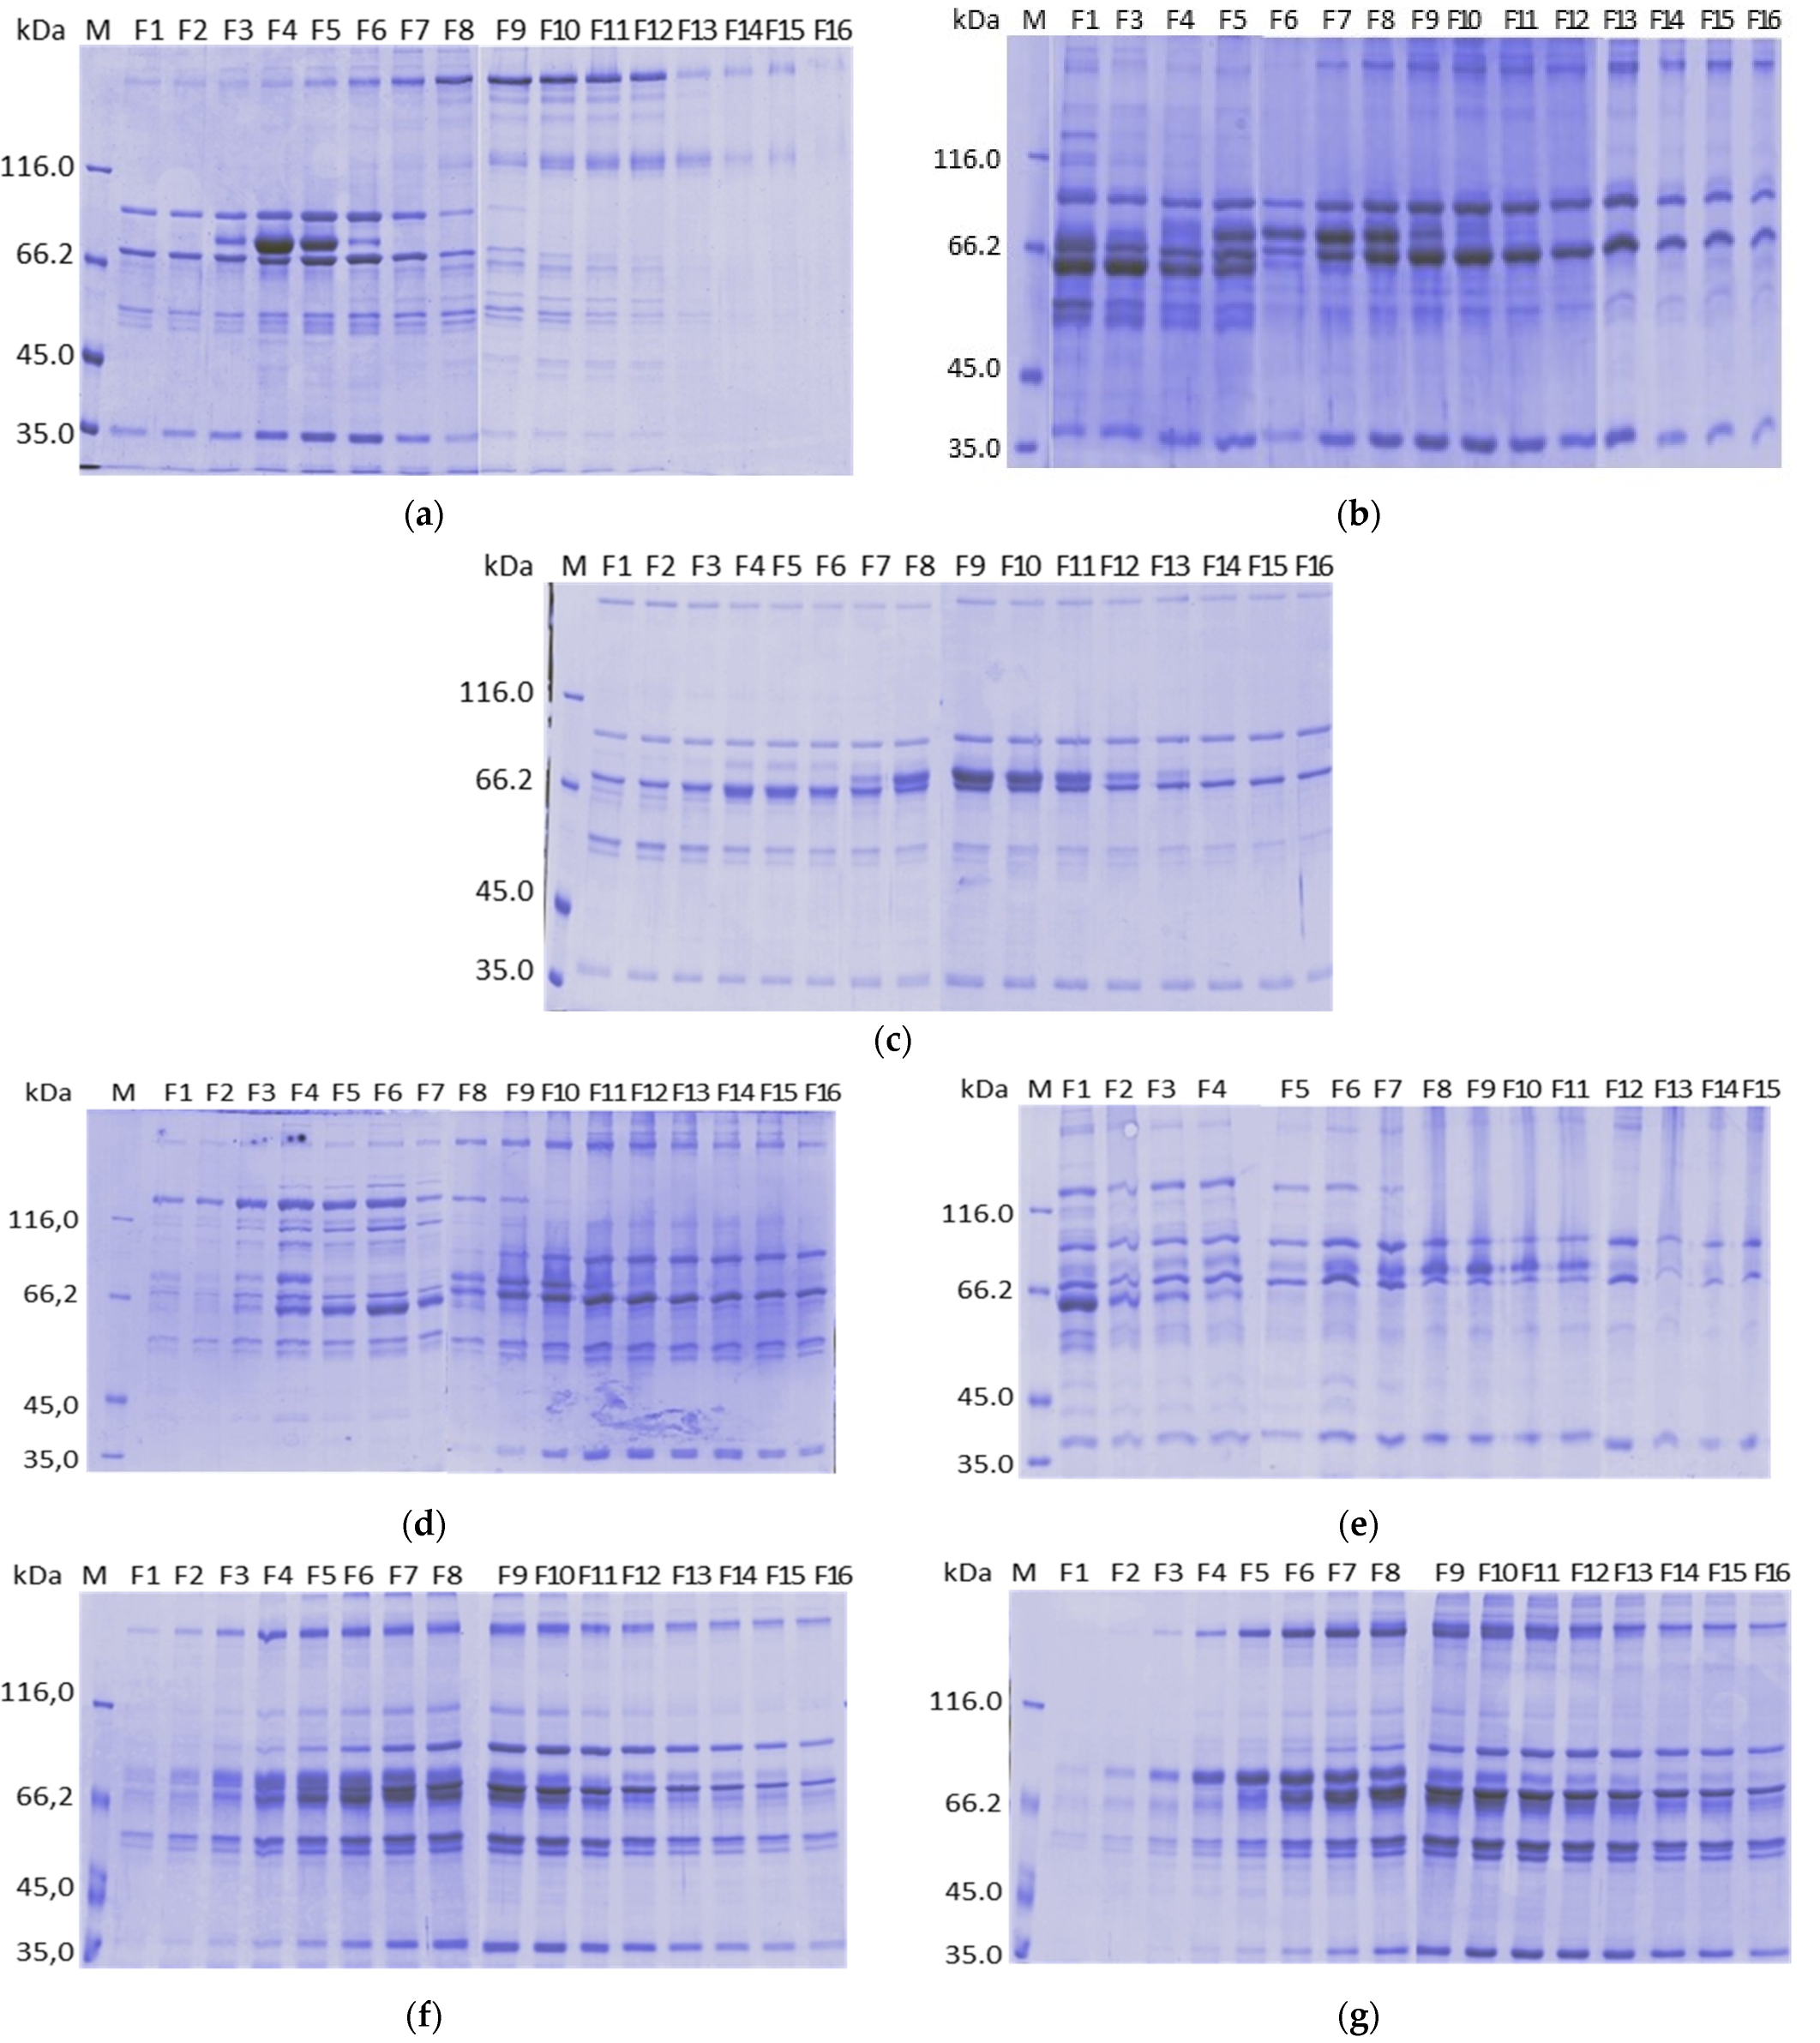
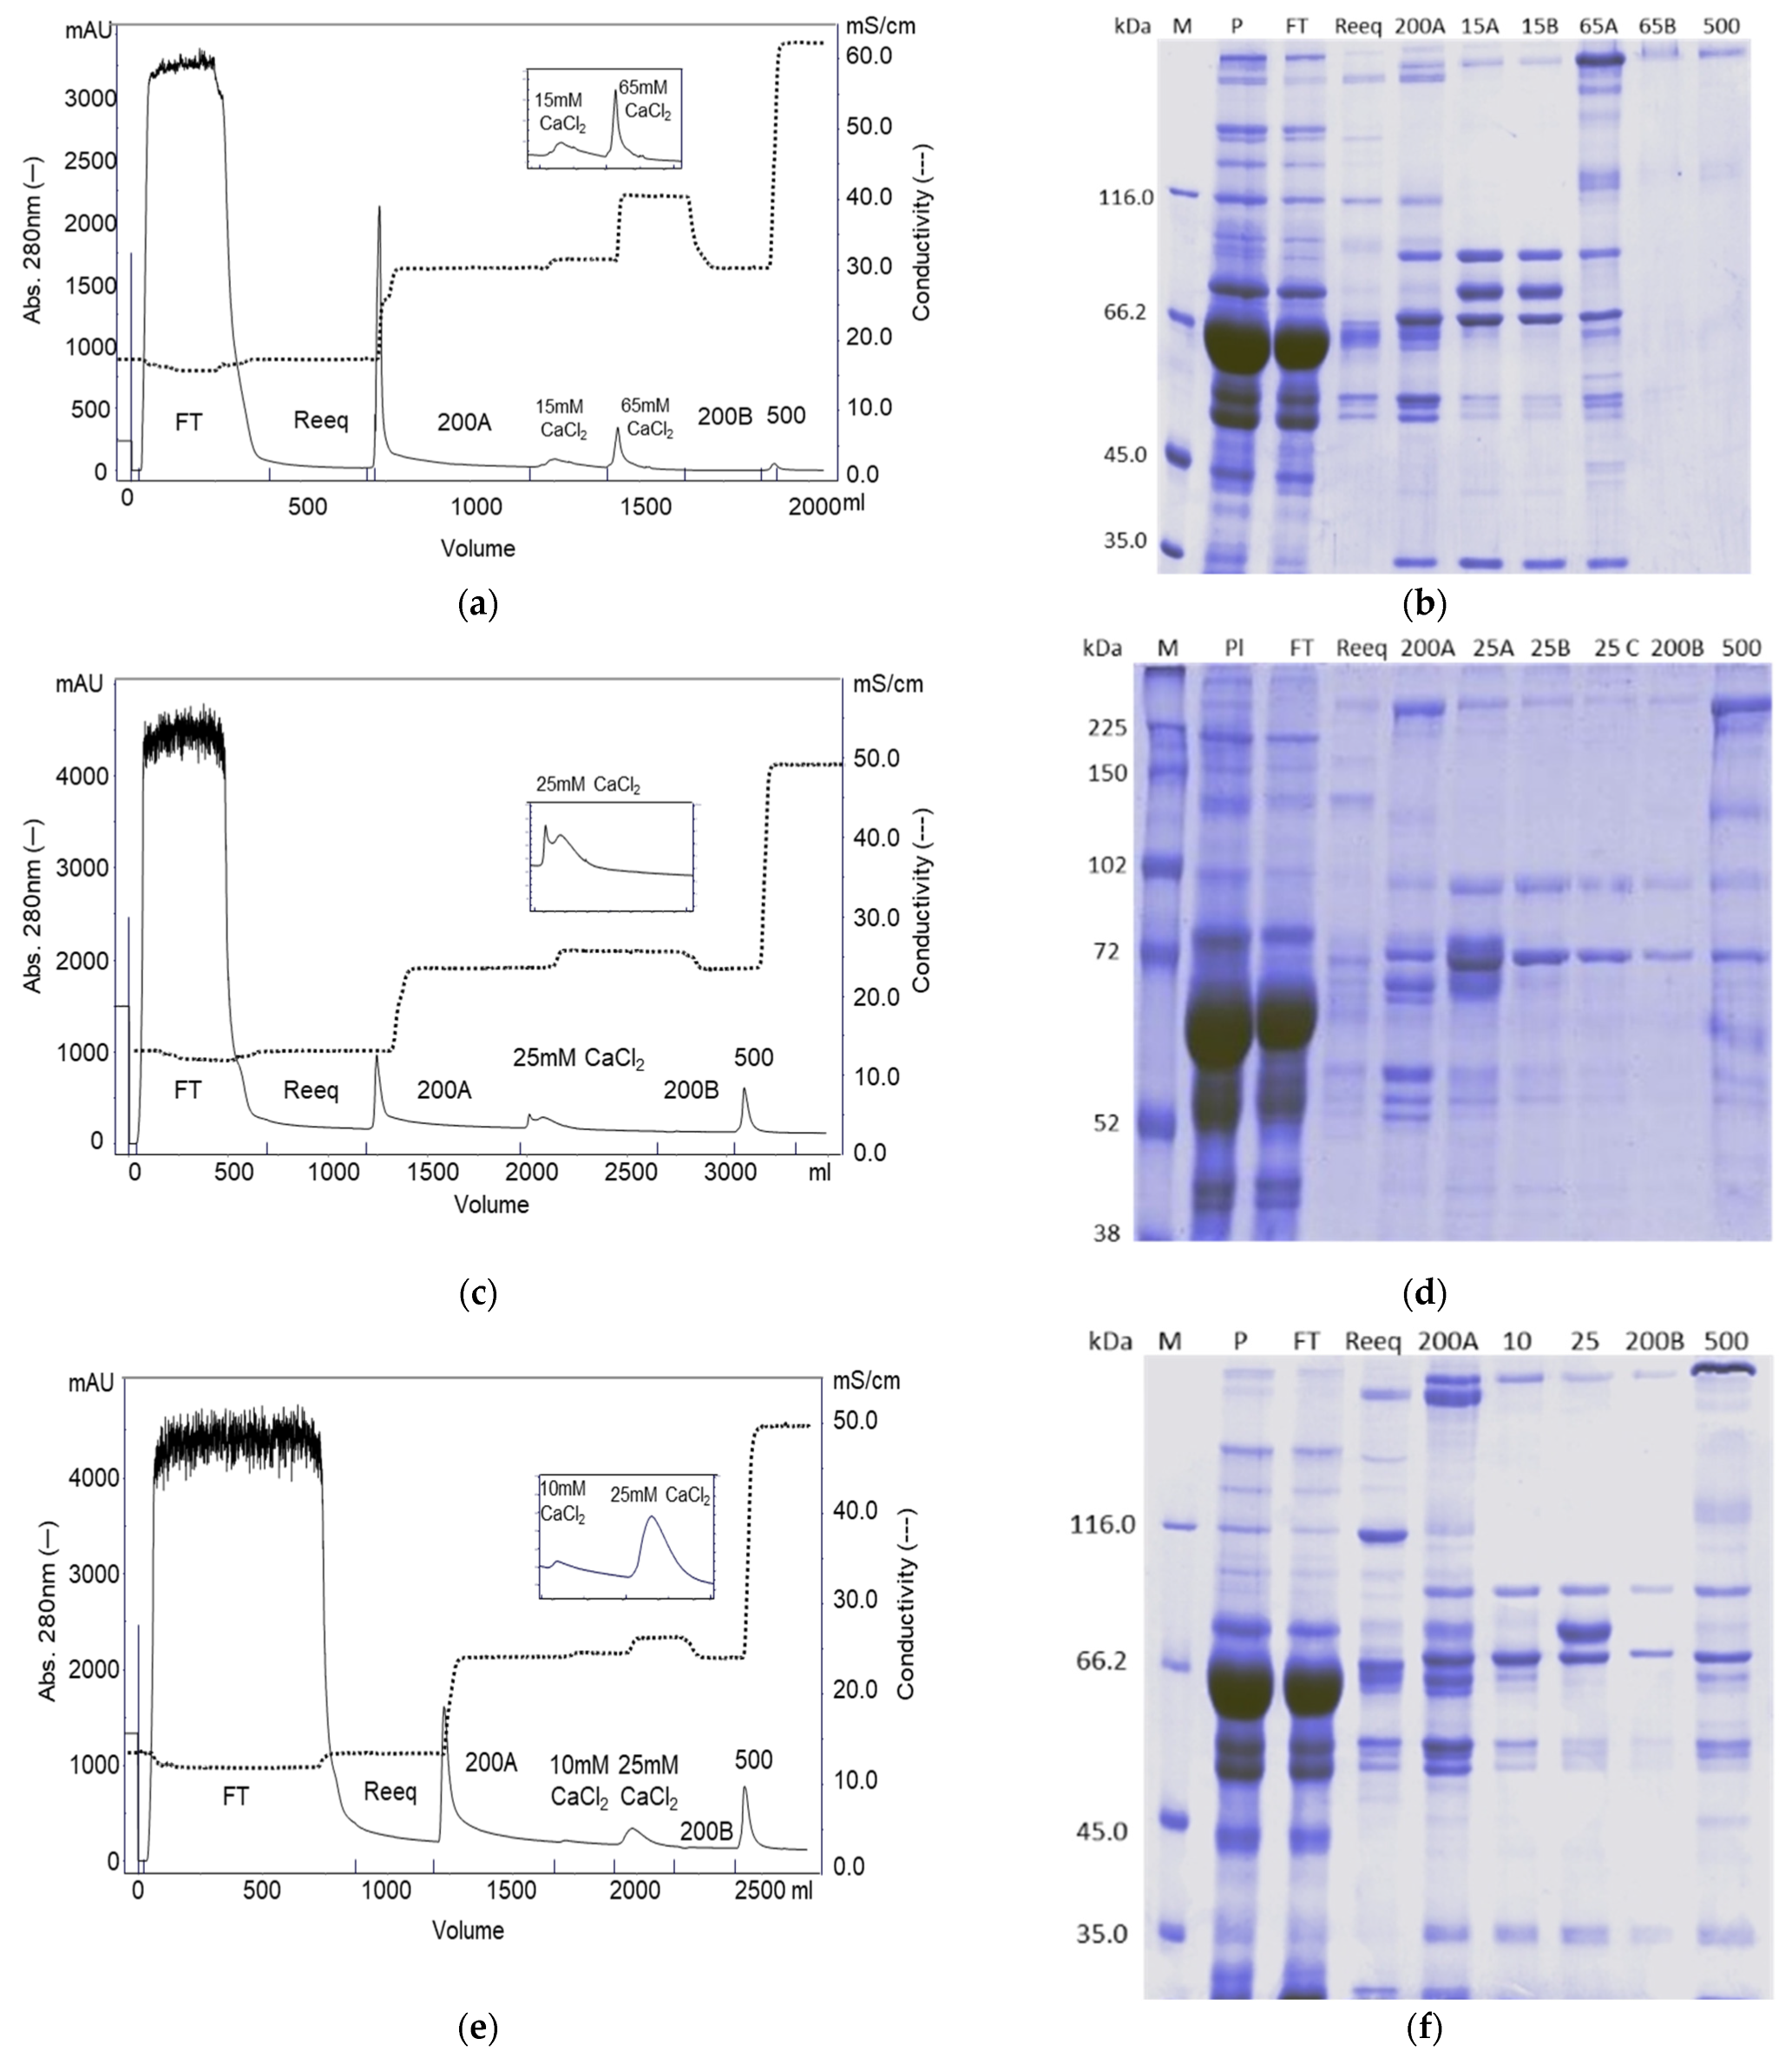
2.1. Purification on Q Sepharose FF–Ca2+ 5 mM to 100 mM Linear Gradient and 15 mM CaCl2 and 65 mM CaCl2 Stepwise Gradient
2.2. Purification on ANX Sepharose FF–Ca2+ 5 mM to 25 mM Linear Gradient and Citrate Buffer
2.3. Purification on DEAE Sepharose FF–Ca2+ 5 mM to 50 mM Linear Gradient
2.4. Purification on Fractogel EMD TMAE–Ca2+ 5 mM to 50 mM Linear Gradient
2.5. Purification on Fractogel EMD DEAE–Ca2+ 5 mM to 50 mM Linear Gradient
2.6. Purification on ANX Sepharose FF–Calcium 5 mM to 25 mM Linear Gradient and Bis-tris Buffer
2.7. Purification on ANX Sepharose FF–Ca2+ 5 mM to 25 mM Linear Gradient and MES Buffer
2.8. Stepwise CaCl2 Gradient in the Purification on ANX Sepharose
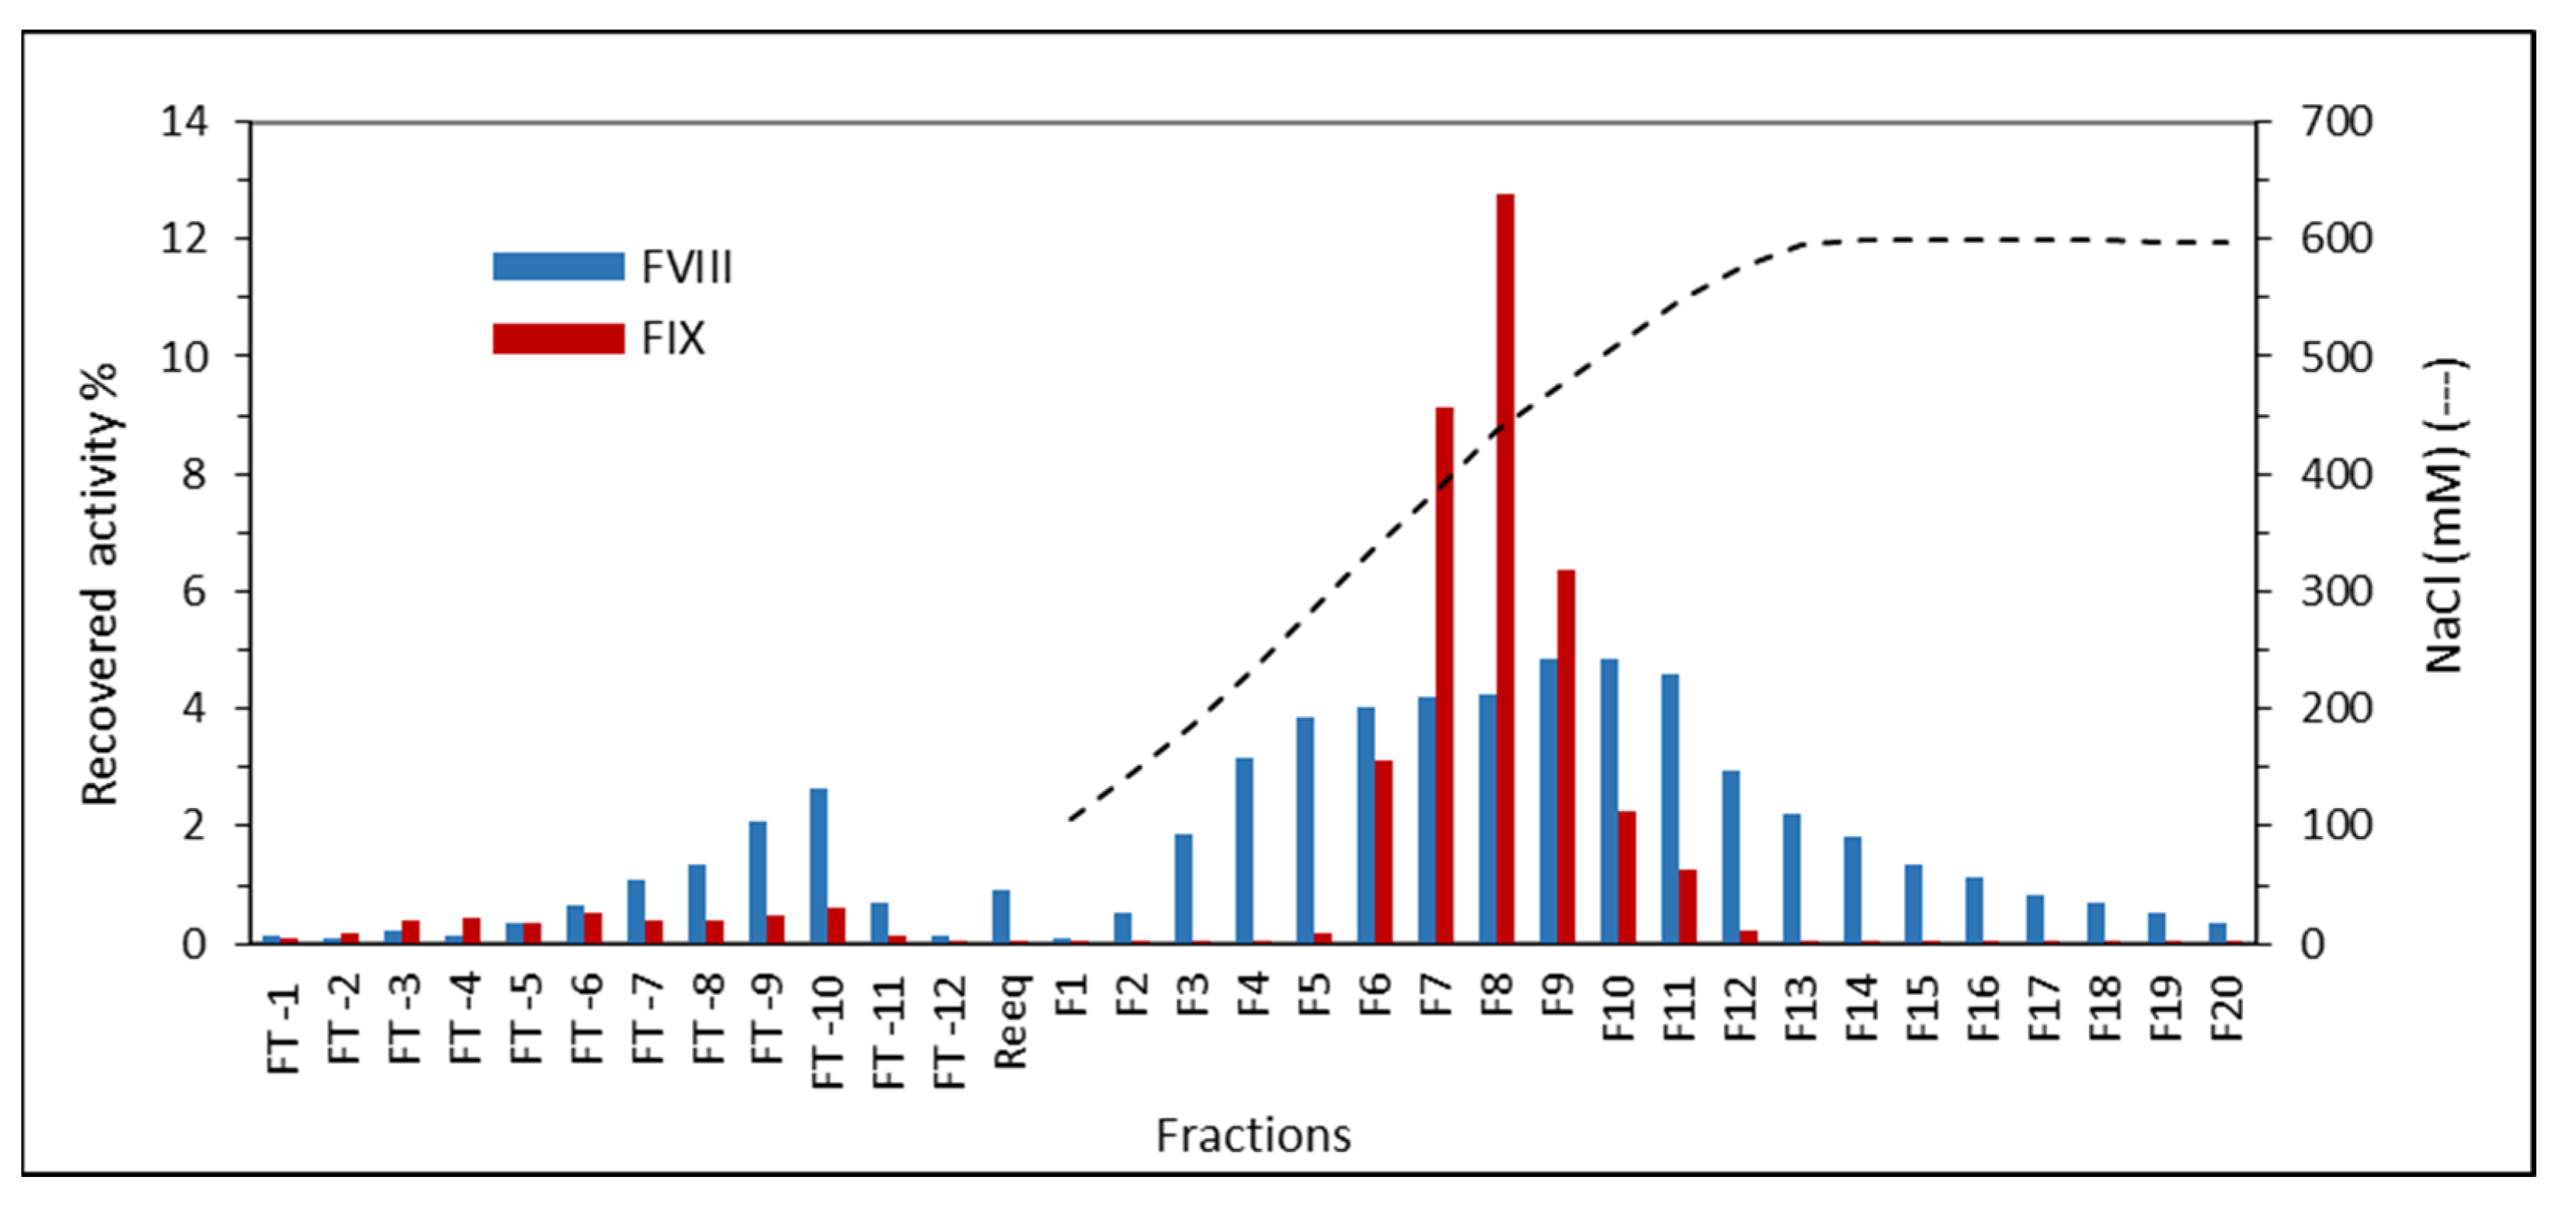
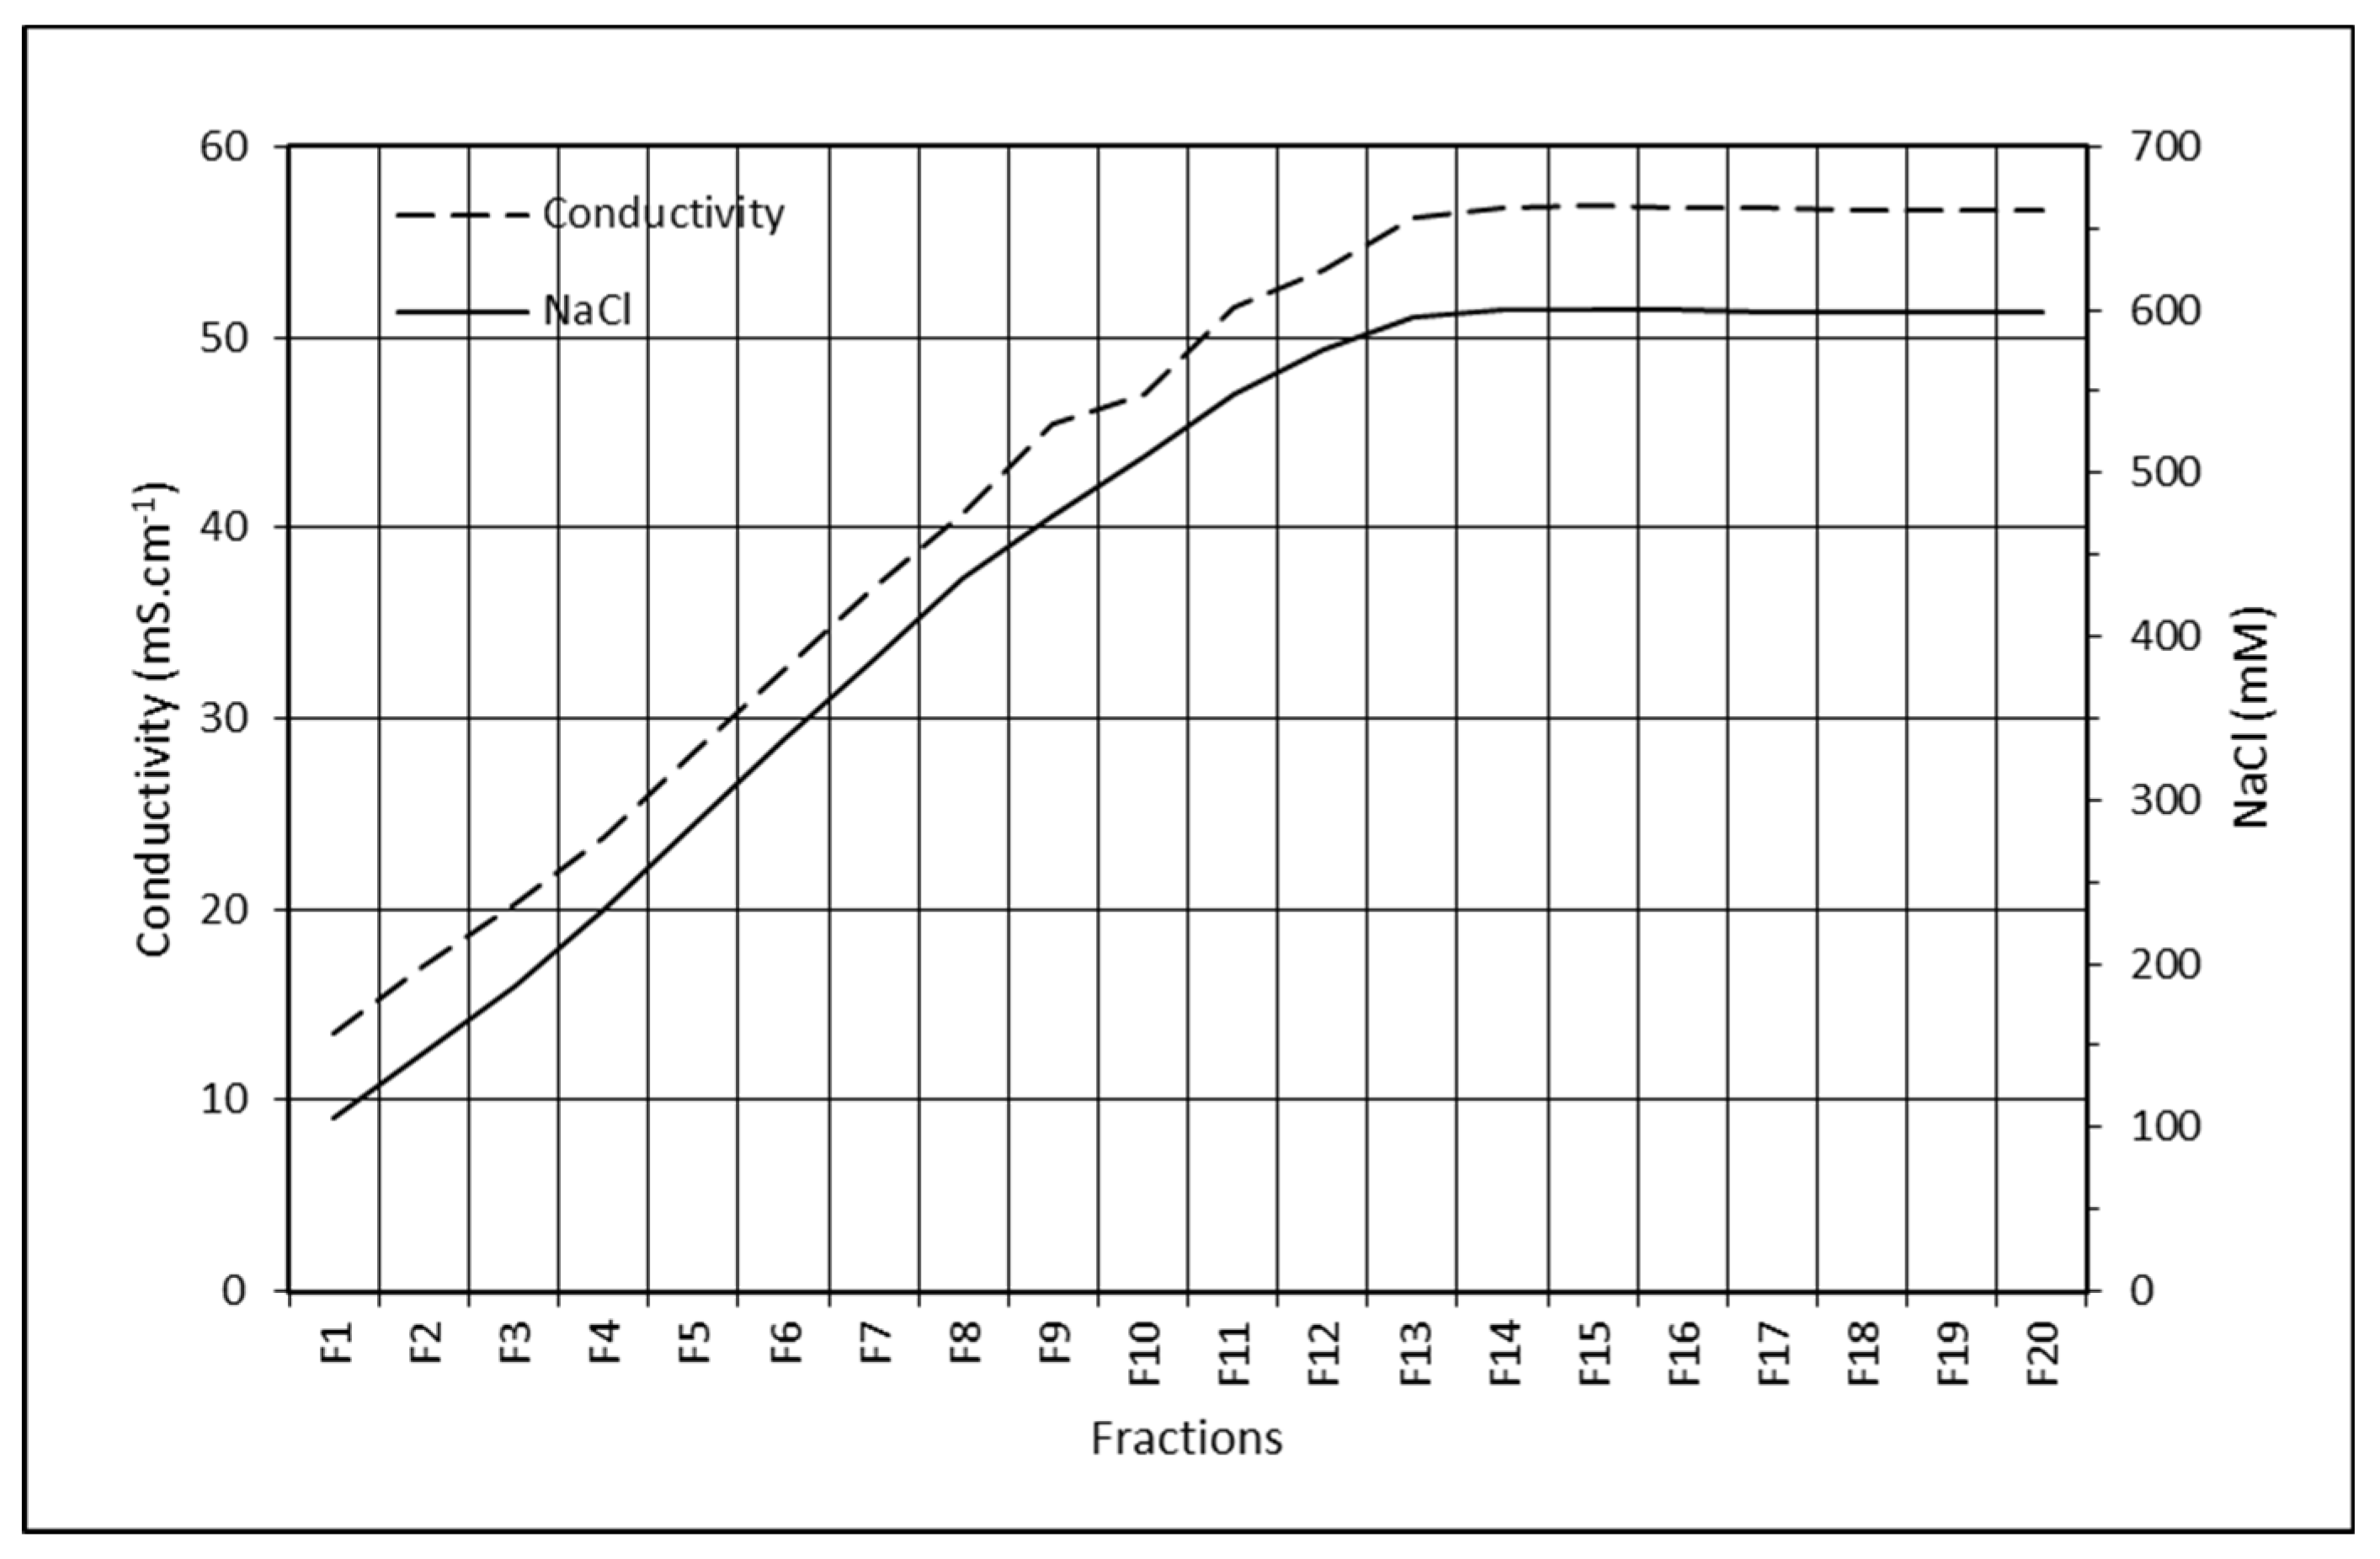
2.9. FVIII and FIX Dynamic Binding Capacity and NaCl Elution in Plasma Purification on ANX Sepharose FF
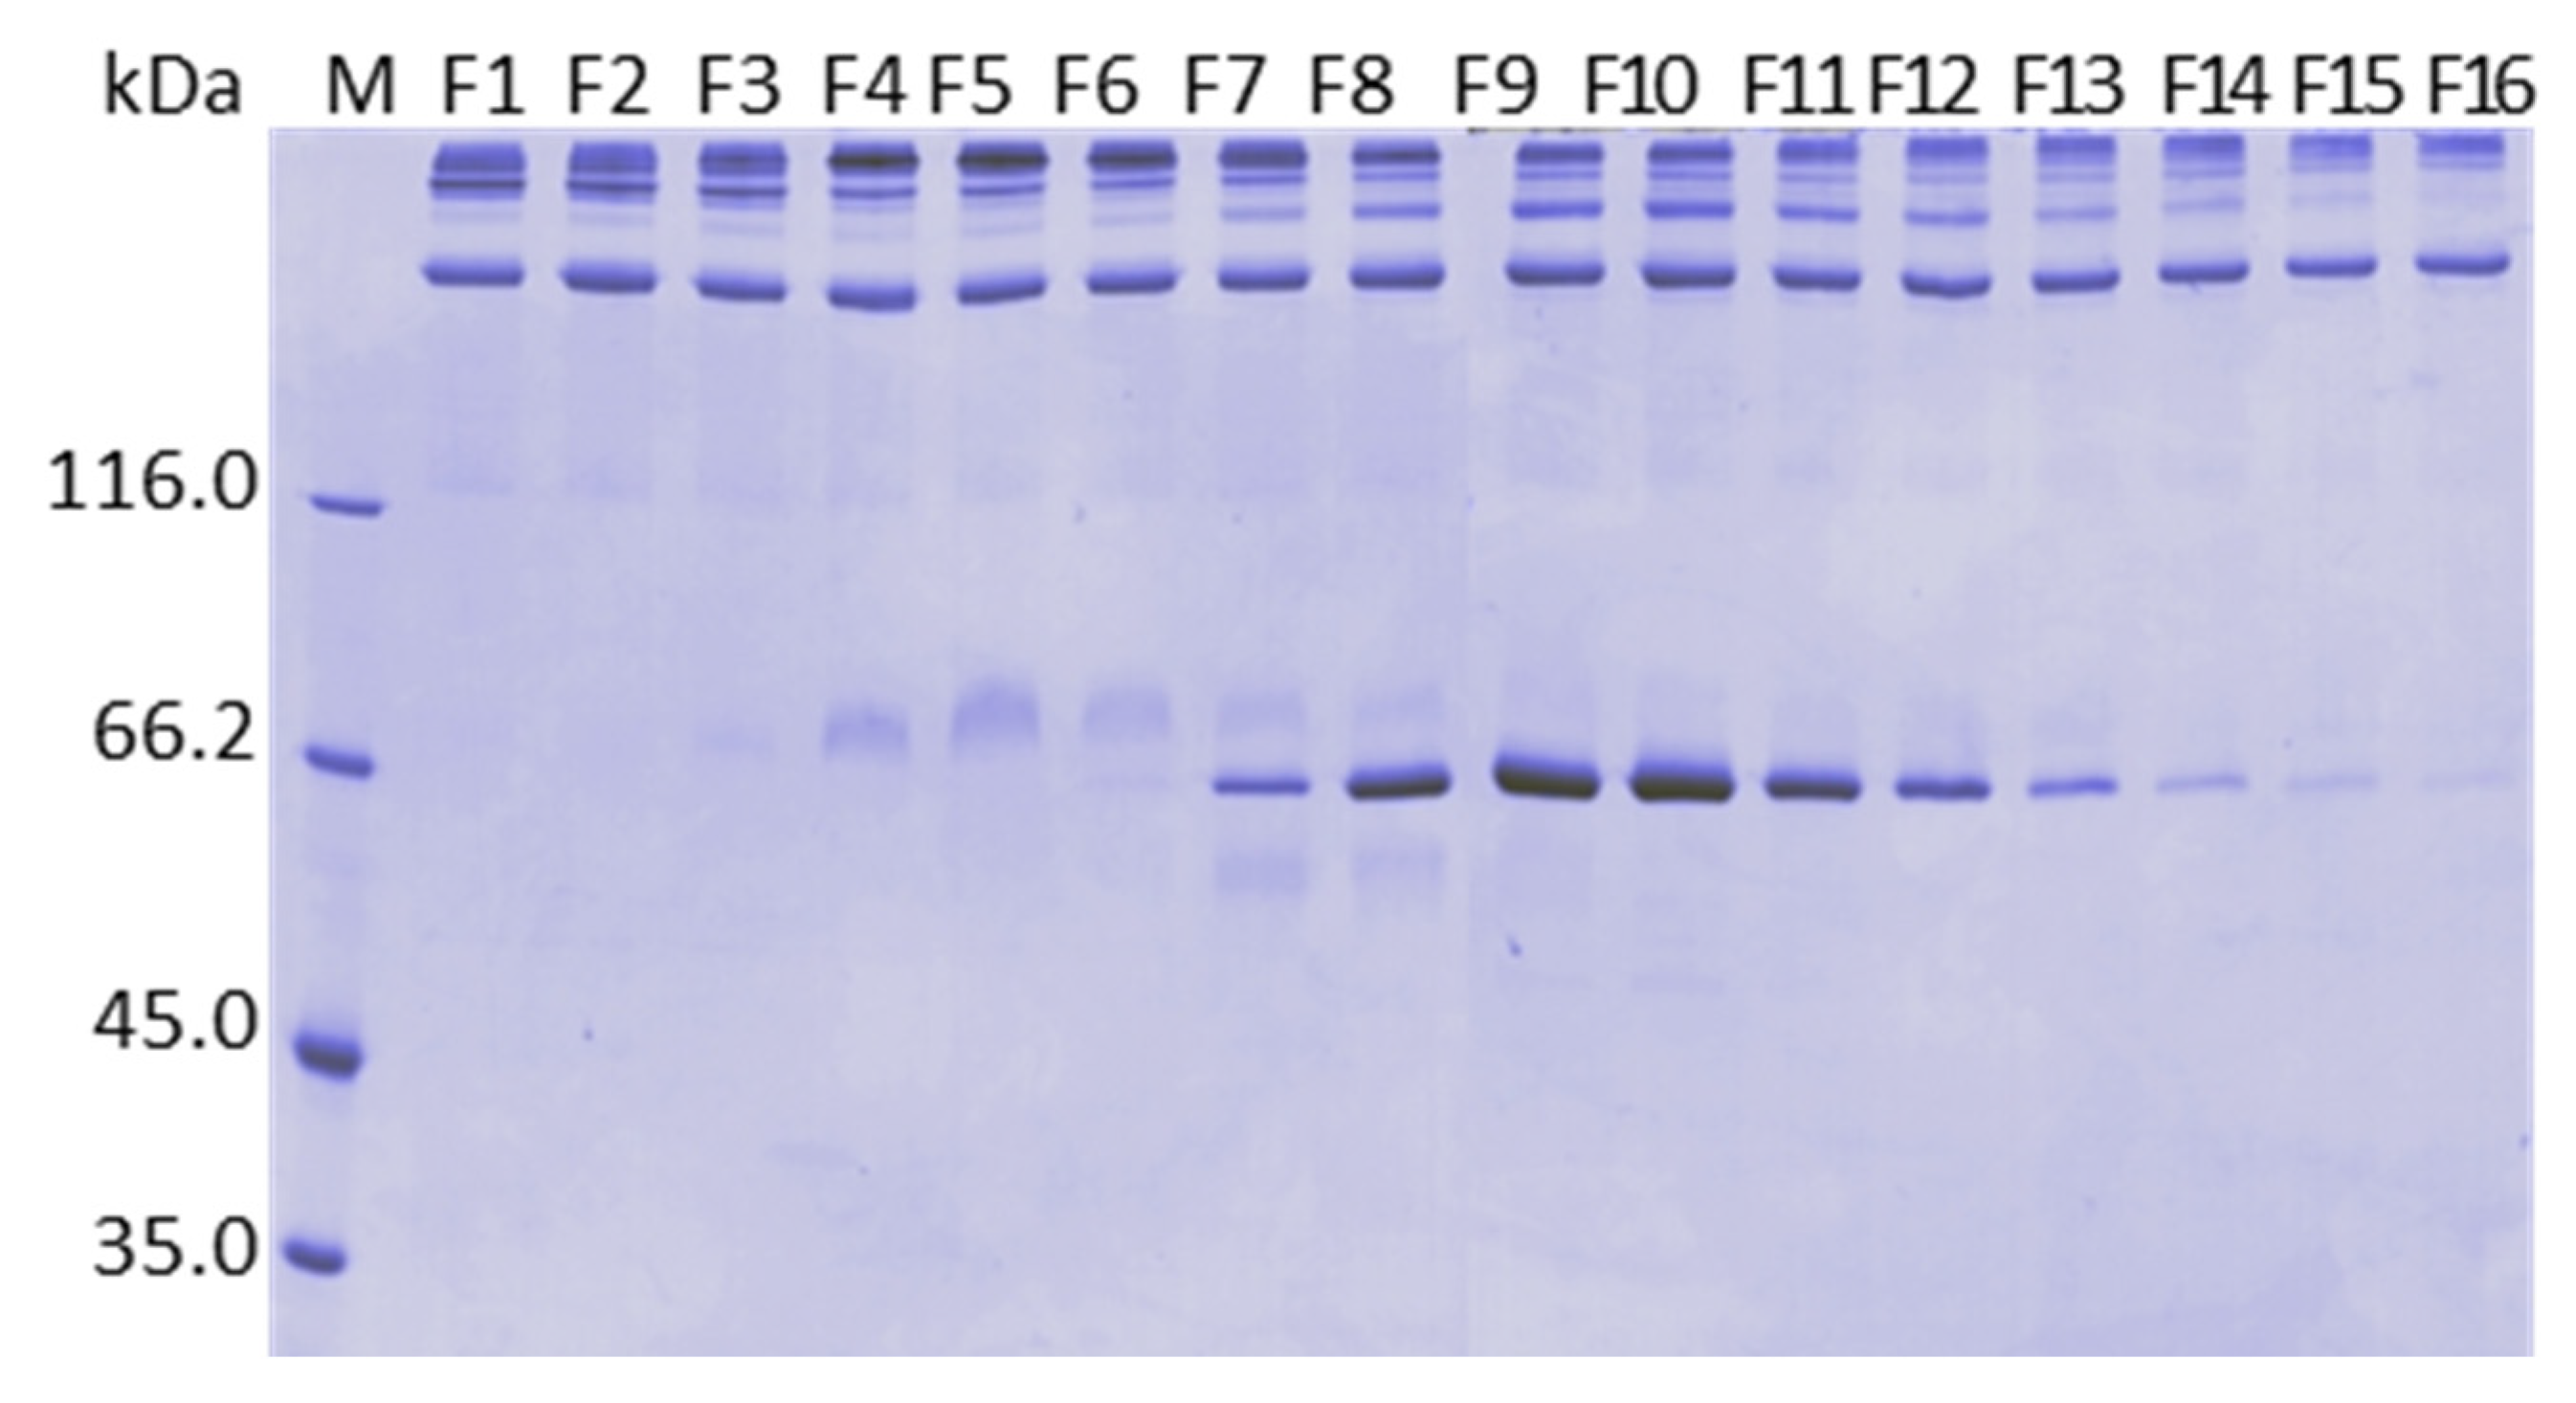
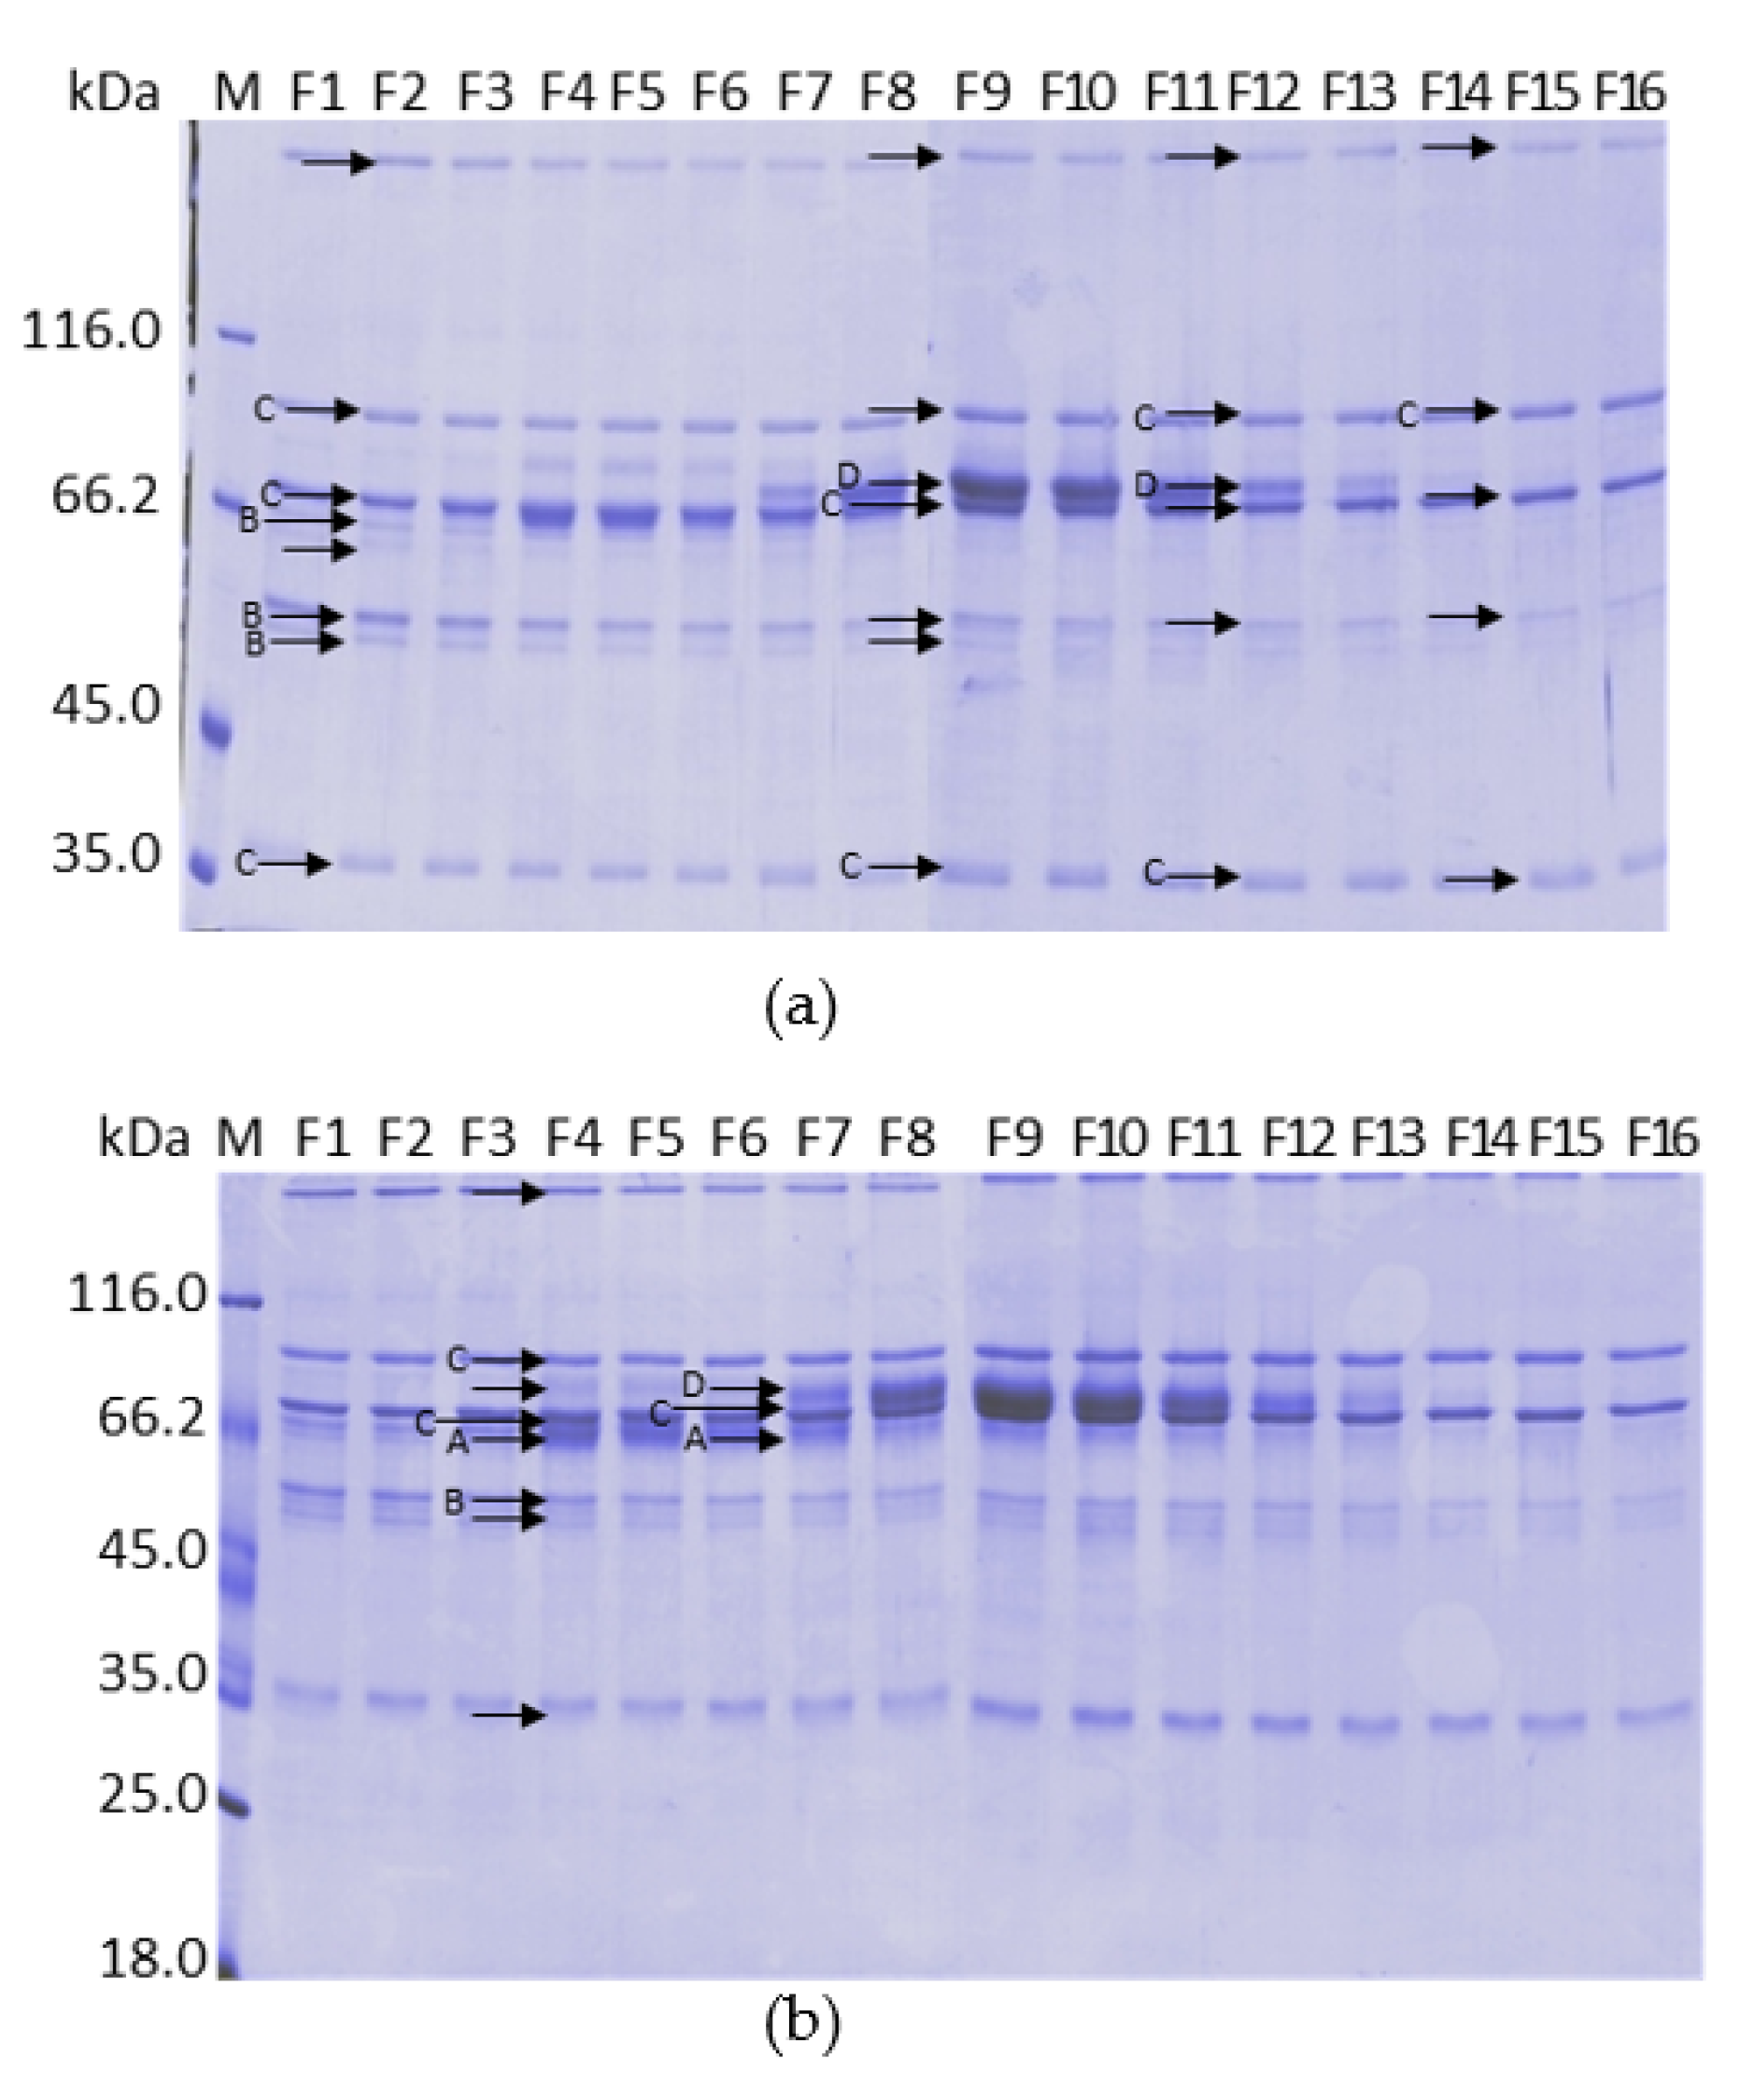
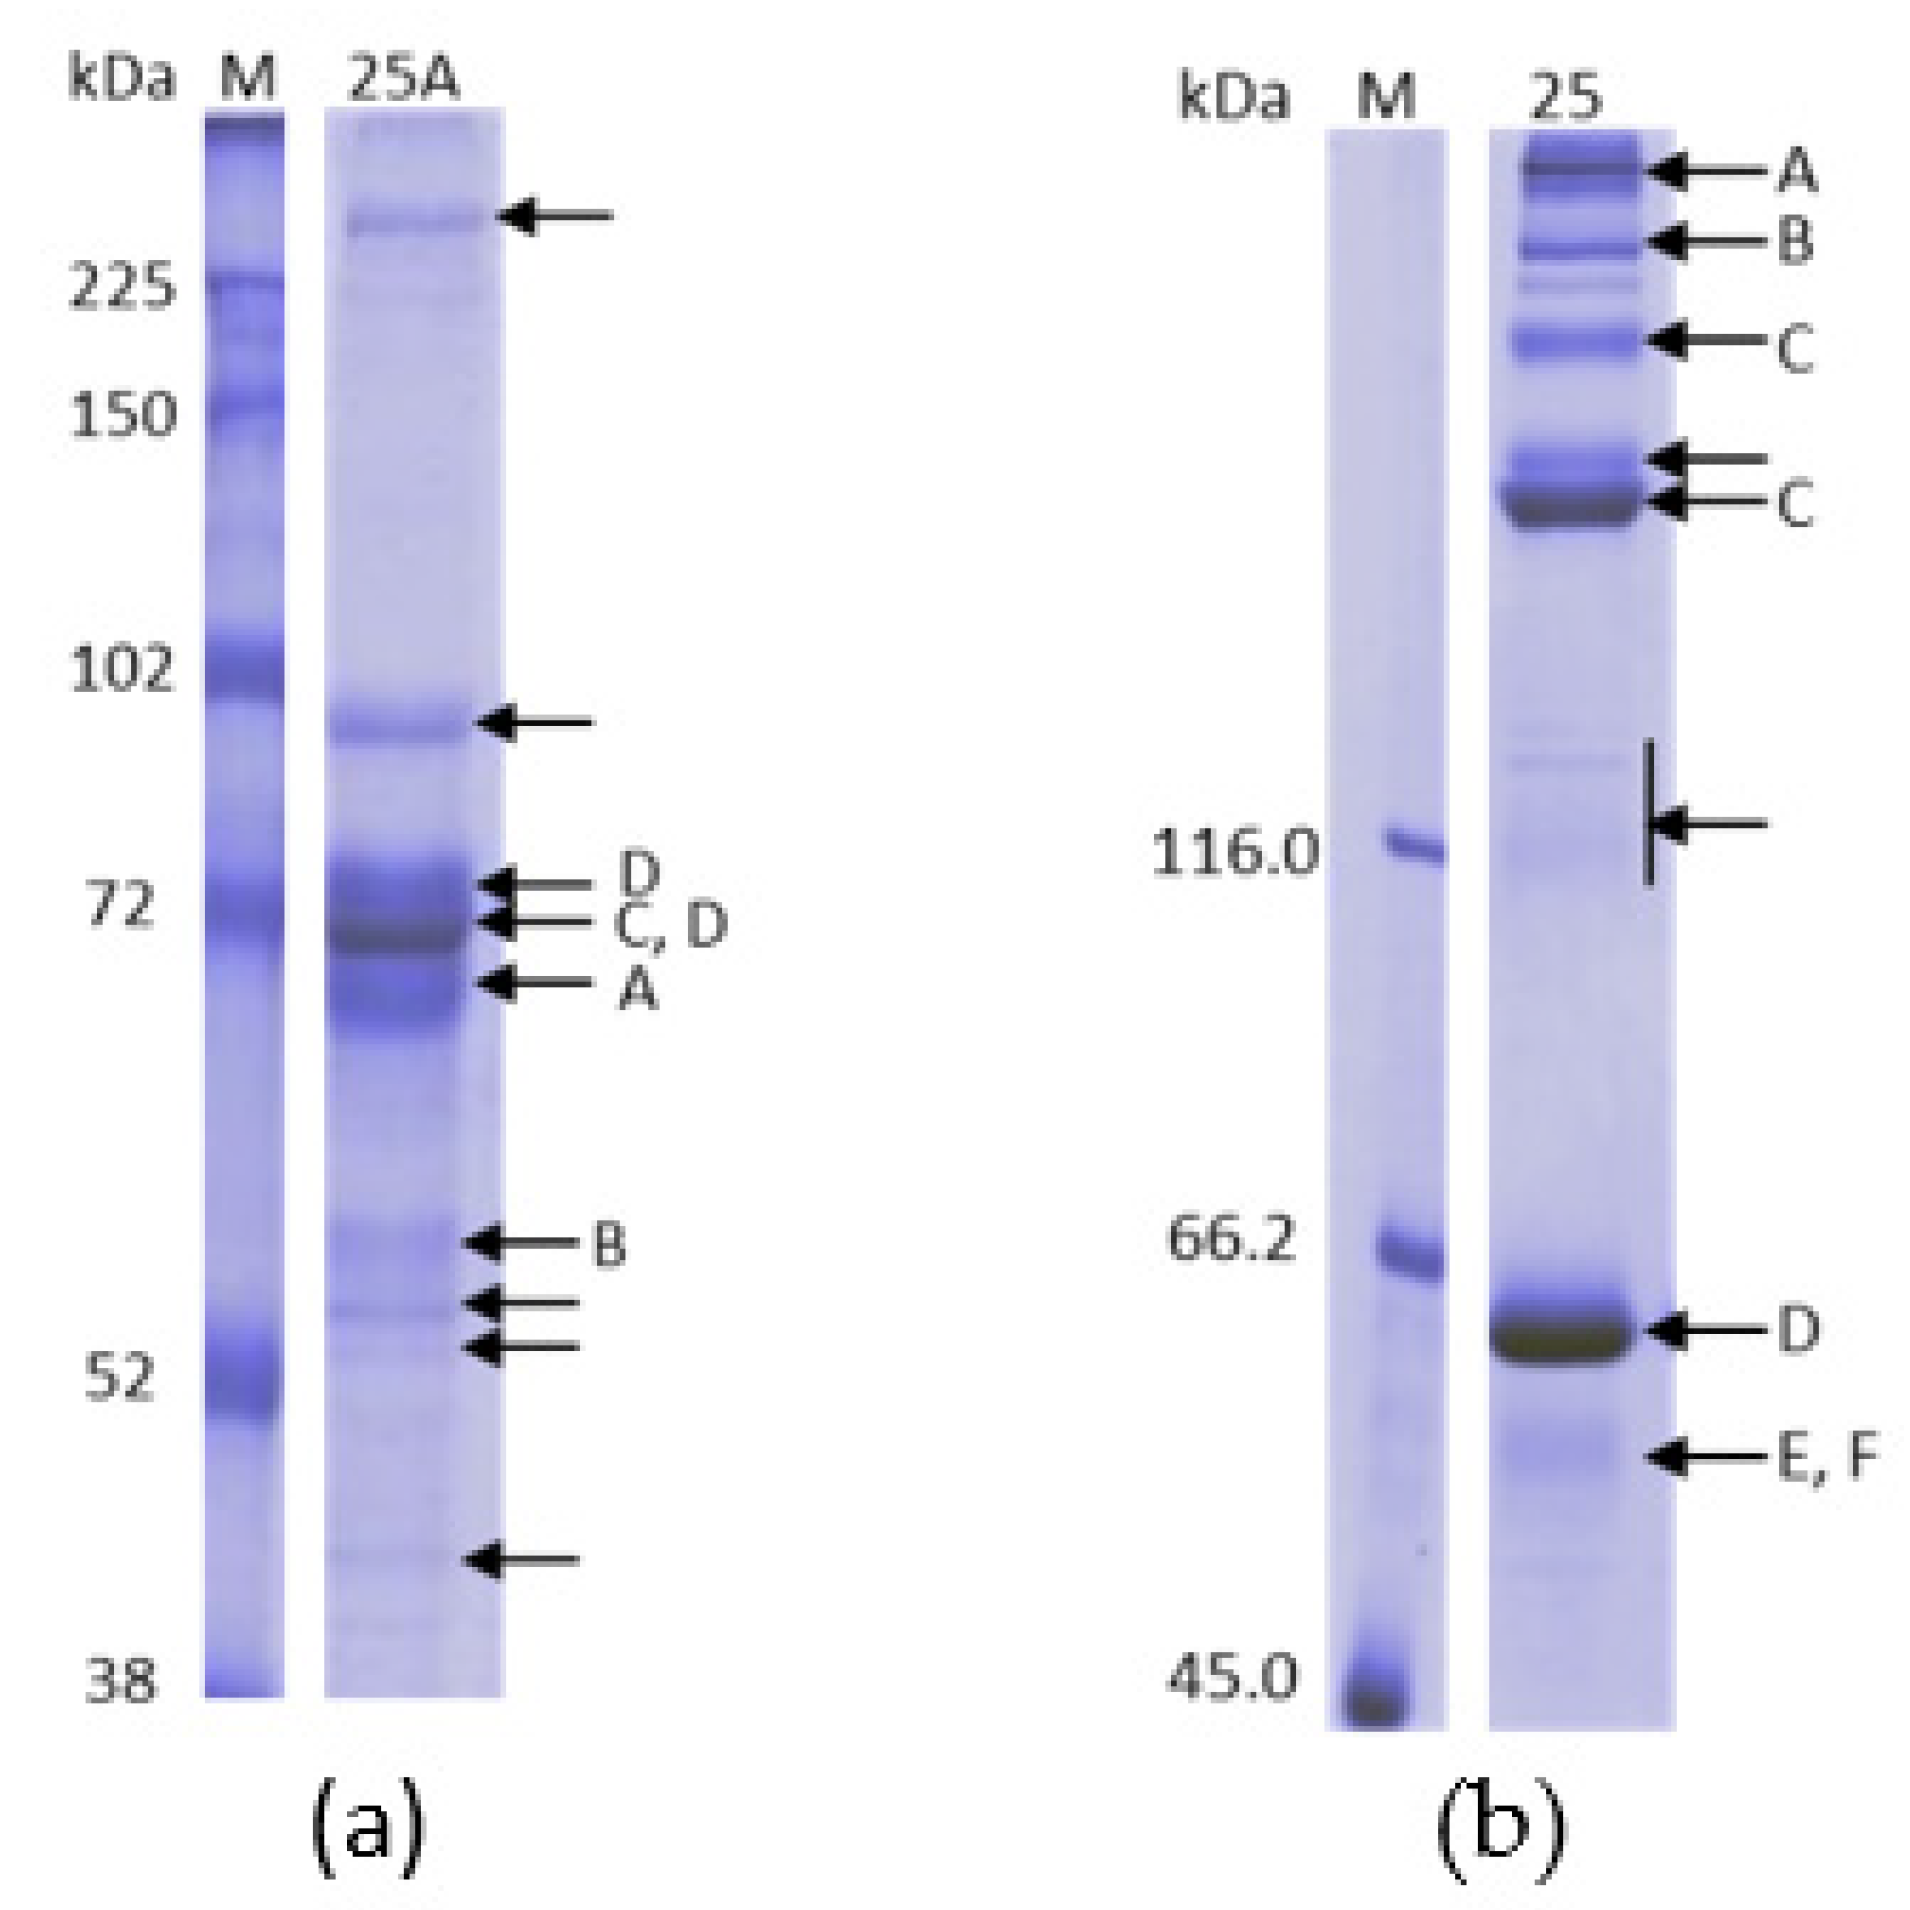
2.10. Analysis by Mass Spectrometry of the Fractions Collected in the Calcium Gradient of the Purifications on ANX Sepharose FF
3. Discussion
4. Materials and Methods
4.1. Chromatography General Procedure
4.2. Chromatography of Plasma on Q Sepharose FF
4.2.1. Q Sepharose FF Chromatography with Ca2+ 5 mM to 100 mM Linear Gradient
4.2.2. Q Sepharose FF Chromatography with Ca2+ 15 mM and 65 mM Stepwise Gradient
4.3. Chromatography of Plasma on ANX Sepharose FF
4.3.1. ANX Sepharose FF Chromatography with Ca2+ 5 mM to 25 mM Linear Gradient with Citrate Buffer
4.3.2. ANX Sepharose FF Chromatography with Ca2+ 5 mM to 25 mM Linear Gradient with Bis-tris or MES Buffers
4.3.3. ANX Sepharose FF Chromatography with Ca2+ Stepwise Elution
4.3.4. FVIII and FIX Dynamic Binding Capacity and NaCl Elution on ANX Sepharose FF
4.4. Chromatography of Plasma on DEAE Sepharose FF
4.4.1. DEAE Sepharose FF Chromatography without Ca2+ Gradient
4.4.2. DEAE Sepharose FF Chromatography with Ca2+ 5 mM to 50 mM Linear Gradient
4.5. Chromatography of Plasma on Fractogel EMD TMAE
4.5.1. Fractogel EMD TMAE Chromatography without Ca2+ Gradient
4.5.2. Fractogel EMD TMAE Chromatography with Ca2+ 5 mM to 50 mM Linear Gradient
4.6. Chromatography of Plasma on Fractogel EMD DEAE- Ca2+ 5 mM to 50 mM Linear Gradient
4.7. Analytical Methods
4.7.1. Protein Quantification
4.7.2. SDS-PAGE Analysis
4.7.3. Determination of FVIII, Protein C, FIX and Prothrombin
4.7.4. Identification of the Proteins Eluted with CaCl2 by Mass Spectrometry
Mass Spectra Acquisition and Peptide Sequencing
Author Contributions
Funding
Institutional Review Board Statement
Informed Consent Statement
Data Availability Statement
Acknowledgments
Conflicts of Interest
References
- Fassel, H.; McGuinn, C. Haemophilia: Factoring in new therapies. Br. J. Haematol. 2021, 194, 835–850. [Google Scholar] [CrossRef] [PubMed]
- Samuelson Bannow, B.; Recht, M.; Négrier, C.; Hermans, C.; Berntorp, E.; Eichler, H.; Mancuso, M.E.; Klamroth, R.; O’Hara, J.; Santagostino, E.; et al. Factor VIII: Long-established role in haemophilia A and emerging evidence beyond haemostasis. Blood Rev. 2019, 35, 43–50. [Google Scholar] [CrossRef] [PubMed]
- Mori, F.; Nardini, I.; Rossi, P.; Nardini, C.; Farina, C. Progress in large-scale purification of factor VIII/von Willebrand factor concentrates using ion-exchange chromatography. Vox Sang. 2008, 95, 298–307. [Google Scholar] [CrossRef] [PubMed]
- Takeyama, M.; Nogami, K.; Okuda, M.; Shima, M. von Willebrand factor protects the Ca2+-dependent structure of the factor VIII light chain. Br. J. Haematol. 2009, 146, 531–537. [Google Scholar] [CrossRef] [PubMed]
- Nair, P.S.; Shetty, S.; Ghosh, K. Factor VIII Antigen, Activity, and Mutations in Hemophilia A. Clin. Appl. Thromb. Hemost. 2016, 22, 381–385. [Google Scholar] [CrossRef]
- Hansson, K.; Stenflo, J. Post-translational modifications in proteins involved in blood coagulation. J. Thromb. Haemost. 2005, 3, 2633–2648. [Google Scholar] [CrossRef]
- Josic, D.; Hoffer, L.; Buchacher, A. Preparation of vitamin K-dependent proteins, such as clotting factors II, VII, IX and X and clotting inhibitor protein C. J. Chromatogr. B Anal. Technol. Biomed. Life Sci. 2003, 790, 183–197. [Google Scholar] [CrossRef]
- Burnouf, T.; Seghatchian, J. “Go no Go” in plasma fractionation in the world’s emerging economies: Still a question asked 70 years after the COHN process was developed! Transfus. Apher. Sci. 2014, 51, 113–119. [Google Scholar] [CrossRef] [PubMed]
- Burnouf, T. Modern plasma fractionation. Transfus. Med. Rev. 2007, 21, 101–117. [Google Scholar] [CrossRef] [PubMed]
- Franchini, M.; Lippi, G. Prothrombin complex concentrates: An update. Blood Transfus. 2010, 8, 149–154. [Google Scholar] [CrossRef] [PubMed]
- Yin, R.; Liu, C. Human coagulation factor IX: A systematic review of its characteristics. Blood Coagul. Fibrinolysis 2022, 33, 1–7. [Google Scholar] [CrossRef]
- Hoffer, L.; Schwinn, H.; Josić, D. Production of highly purified clotting factor IX by a combination of different chromatographic methods. J. Chromatogr. A 1999, 844, 119–128. [Google Scholar] [CrossRef]
- Josic, D.; Schwinn, H.; Stadler, M.; Strancar, A. Purification of factor VIII and von Willebrand factor from human plasma by anion-exchange chromatography. J. Chromatogr. B Biomed. Appl. 1994, 662, 181–190. [Google Scholar] [CrossRef]
- Burnouf, T.; Burnouf-Radosevich, M.; Huart, J.J.; Goudemand, M. A highly purified factor VIII:c concentrate prepared from cryoprecipitate by ion-exchange chromatography. Vox Sang. 1991, 60, 8–15. [Google Scholar] [CrossRef] [PubMed]
- Michalski, C.; Bal, F.; Burnouf, T.; Goudemand, M. Large-scale production and properties of a solvent-detergent-treated factor IX concentrate from human plasma. Vox Sang. 1988, 55, 202–210. [Google Scholar] [CrossRef] [PubMed]
- Verinaud, C.I.; Feliciano, G.P.; de Carvalho, R.R.; Lopes, A.P.Y.; Raw, I.; Martins, E.A.L.; Cheng, E. Purification of Plasma-Derived Coagulation Factor VIII by Immobilized-Zn2+ and -Co2+ Affinity Chromatography. Chromatographia 2017, 80, 1319–1327. [Google Scholar] [CrossRef]
- Cheng, E.; Jinzenji, D.; Lorthiois, A.P.; de Carvalho, R.R.; Tanaka-Azevedo, A.M.; Raw, I.; Martins, E.A. Purification of coagulation factor VIII using chromatographic methods. Direct chromatography of plasma in anion exchange resins. Biotechnol. Lett. 2010, 32, 1207–1214. [Google Scholar] [CrossRef] [PubMed]
- Rodrigues, E.S.; Verinaud, C.I.; Oliveira, D.S.; Raw, I.; Lopes, A.P.; Martins, E.A.; Cheng, E. Purification of coagulation factor VIII by immobilized metal affinity chromatography. Biotechnol. Appl. Biochem. 2015, 62, 343–348. [Google Scholar] [CrossRef] [PubMed]
- Yan, S.B. Review of conformation-specific affinity purification methods for plasma vitamin K-dependent proteins. J. Mol. Recognit. 1996, 9, 211–218. [Google Scholar] [CrossRef]
- Fischer, B.; Mitterer, A.; Dorner, F. Purification of recombinant human coagulation factors II and IX and protein S expressed in recombinant Vaccinia virus-infected Vero cells. J. Biotechnol. 1995, 38, 129–136. [Google Scholar] [CrossRef]
- Ribeiro, D.A.; Passos, D.F.; Ferraz, H.C.; Castilho, L.R. Anion-exchange purification of recombinant factor IX from cell culture supernatant using different chromatography supports. J. Chromatogr. B Analyt. Technol. Biomed. Life Sci. 2013, 938, 111–118. [Google Scholar] [CrossRef] [PubMed]
- Schaller, J.; Gerber, S.; Kaempfer, U.; Lejon, S.; Trachsel, C. Human Blood Plasma Proteins: Structure and Function; Marshall: Milton Keynes, UK; John Wiley & Sons: Hoboken, NJ, USA, 2008; 526p. [Google Scholar]
- Yan, S.C.; Razzano, P.; Chao, Y.B.; Walls, J.D.; Berg, D.T.; McClure, D.B.; Grinnell, B.W. Characterization and novel purification of recombinant human protein C from three mammalian cell lines. Biotechnology 1990, 8, 655–661. [Google Scholar] [CrossRef] [PubMed]
- Burnouf, T.; Michalski, C.; Goudemand, M.; Huart, J.J. Properties of a highly purified human plasma factor IX:c therapeutic concentrate prepared by conventional chromatography. Vox Sang. 1989, 57, 225–232. [Google Scholar] [CrossRef] [PubMed]
- Teh, L.C.; Froger, M. Direct capture of plasma factor VIII:C by ion exchange chromatography. Vox Sang. 1994, 67, 8–13. [Google Scholar] [CrossRef]
- Baikar, V.M.; Kamath, M.V.; Vishwanathan, C.; Varadkar, A.M.; Bharmal, S.E. Separation of antihemophilic factor VII from human plasma by column chromatography. Indian J. Clin. Biochem. 2003, 18, 80–86. [Google Scholar] [CrossRef]
- Radosevich, M.; Zhou, F.L.; Huart, J.J.; Burnouf, T. Chromatographic purification and properties of a therapeutic human protein C concentrate. J. Chromatogr. B Anal. Technol. Biomed. Life Sci. 2003, 790, 199–207. [Google Scholar] [CrossRef]
- Bradford, M.M. A rapid and sensitive method for the quantitation of microgram quantities of protein utilizing the principle of protein-dye binding. Anal. Biochem. 1976, 72, 248–254. [Google Scholar] [CrossRef]
- Laemmli, U.K. Cleavage of structural proteins during the assembly of the head of bacteriophage T4. Nature 1970, 227, 680–685. [Google Scholar] [CrossRef]
- Suckau, D.; Resemann, A.; Schuerenberg, M.; Hufnagel, P.; Franzen, J.; Holle, A. A novel MALDI LIFT-TOF/TOF mass spectrometer for proteomics. Anal. Bioanal. Chem. 2003, 376, 952–965. [Google Scholar] [CrossRef]
- Paizs, B.; Suhai, S. Fragmentation pathways of protonated peptides. Mass Spectrom. Rev. 2005, 24, 508–548. [Google Scholar] [CrossRef]


| Experiment | Specific Activity in Plasma (U mg−1) # | FVIII Recovered Activity from Plasma (%) | Specific Activity in the Eluate (U mg−1) | Purification Factor | |
|---|---|---|---|---|---|
| Resin Ca2+ Gradient (mM) | Buffer | ||||
| Q Sepharose FF 15 and 65 * | citrate | 1.8 | 60 | 360 | 201 |
| ANX Sepharose FF 5–25 | citrate | 1.7 | 51 | 271 | 157 |
| DEAE Sepharose FF 5–50 | citrate | 1.2 | 65 | 162 | 130 |
| Fractogel EMD TMAE 5–50 | citrate | 2.3 | 51 | 327 | 143 |
| Fractogel EMD DEAE 5–50 | citrate | 2.5 | 73 | 368 | 147 |
| ANX Sepharose FF 5–25 | Bis-tris | 1.5 | 67 | 309 | 211 |
| ANX Sepharose FF 5–25 | MES | 1.4 | 53 | 178 | 125 |
| ANX Sepharose FF 25 | citrate | 1.7 | 68 | 433 | 250 |
| ANX Sepharose FF 10 and 25 | citrate | 1.0 | 59 | 228 | 220 |
| Protein | Fragment | Obtained Mass (m/z) | Calculated Mass (m/z) | Protein Mass (kDa) | Identification on Gels |
|---|---|---|---|---|---|
| C4bBP | (K)LSLEIEQLELQR | 1470.9 | 1470.8 | 570 | [A] |
| Fibrinogen | (K)GLIDEVNQDFTNR | 1520.7 | 1520.7 | 340 | [B] |
| (K)IHLISTQSAIPYALR | 1683.1 | 1683.0 | |||
| (K)HQLYIDETVNSNIPTNLR | 2127.1 | 2127.1 | |||
| Complement C4 | (R)SFFPENWLWR | 1381.7 | 1381.7 | 202 | [C] |
| (R)TTNIQGINLLFSSR | 1563.8 | 1563.8 | |||
| (R)YIYGKPVQGVAYVR | 1612.8 | 1612.9 | |||
| (K)VGLSGmAIADVTLLSGFHALR | 2144.4 | 2144.2 | |||
| (R)ALEILQEEDLIDEDDIPVR | 2225.0 | 2225.1 | |||
| (R)VTASDPLDTLGSEGALSPGGVASLLR | 2483.2 | 2483.3 | |||
| (R)LTVAAPPSGGPGFLSIERPDSRPPR | 2574.3 | 2574.4 | |||
| (R)YVSHFETEGPHVLLYFDSVPTSR | 2680.4 | 2680.3 | |||
| (R)STQDTVIALDALSAYWIASHTTEER | 2778.2 | 2778.4 | |||
| (R)EC(Propionamide)VGFEAVQEVPVGLVQPASATLYDYYNPER | 3514.8 | 3514.7 | |||
| Prothrombin (FII) | (K)YGFYTHVFR | 1189.6 | 1189.6 | 70 | [D] |
| (R)TATSEYQTFFNPR | 1561.8 | 1561.7 |
| Protein | Fragment | Obtained Mass (m/z) | Calculated Mass (m/z) | Protein Mass (kDa) | Identification on Gels |
|---|---|---|---|---|---|
| C4bBP | (K)EDVYVVGTVLR | 1249.7 | 1249.7 | 570 | [A] |
| (K)LSLEIEQLELQR | 1470.9 | 1470.8 | |||
| (R)KPDVSHGEMVSGFGPIYNYK | 2241.1 | 2241.1 | |||
| Fibrinogen | (R)HQLYIDETVNSNIPTNLR | 2127.3 | 2127.1 | 340 | [B] |
| Complement C4 | (K)FACYYPR | 990.5 | 990.4 | 202 | [C] |
| (R)GLQDEDGYR | 1052.6 | 1052.5 | |||
| (A)SATLYDYYNPER | 1491.8 | 1491.7 | |||
| (R)YIYGKPVQGVAYVR | 1613.0 | 1612.9 | |||
| (R)GHLFLQTDQPIYNPGQR | 1984.6 | 1984.0 | |||
| (R)LTVAAPPSGGPGFLSIERPDSRPPR | 2574.6 | 2574.4 | |||
| (R)YVSHFETEGPHVLLYFDSVPTSR | 2680.5 | 2680.3 | |||
| Prothrombin (FII) | (K)YGFYTHVFR | 1189.7 | 1189.6 | 70 | [D] |
| (R)TATSEYQTFFNPR | 1561.9 | 1561.7 | |||
| (K)LAACLEGNCAEGLGTNYR | 1854.8 | 1854.8 |
| Protein | Fragment | Obtained Mass (m/z) | Calculated Mass (m/z) | Protein Mass (kDa) | Identification on Gels |
|---|---|---|---|---|---|
| C4bBP | (R)FSAIC(CAM)QGDGTWSPR | 1581.8 | 1581.7 | 570 | [A] |
| (R)GVGWSHPLPQC(CAM)EIVK | 1707.0 | 1706.9 | |||
| Fibrinogen | (K)VQHIQLLQK | 1106.9 | 1106.6 | 340 | [B] |
| (K)YEASLITHDSSIR | 1492.0 | 1491.7 | |||
| (T)ADSGEGDFLAEGGGVR | 1536.0 | 1536.7 | |||
| Complement C4 | (R)SFFPENWLWR | 1381.7 | 1381.7 | 202 | [C] |
| (R)YIYGKPVQGVAYVR | 1612.9 | 1612.9 | |||
| (R)ALEILQEEDLIDEDDIPVR | 2225.2 | 2225.1 | |||
| Prothrombin (FII) | (K)YGFYTHVFR | 1189.6 | 1189.6 | 70 | [D] |
| (R)TATSEYQTFFNPR | 1561.8 | 1561.7 | |||
| (K)GQPSVLQVVNLPIVERPVC(CAM)K | 2232.3 | 2232.2 | |||
| (K)HQDFNSAVQLVENFC(CAM)R | 1963.9 | 1963.9 | |||
| (R)SEGSSVNLSPPLEQC(CAM)VPDR | 2071.0 | 2071.0 | |||
| (R)ITDNmFC(CAM)AGYKPDEGKR | 2018.0 | 2017.9 | |||
| Factor IX | (K)FGSGYVSGWGR | 1172.7 | 1172.5 | 56 | [E] |
| (K)SCEPAVPFPC(CAM)GR | 1376.8 | 1376.6 | |||
| Protein Z | (K)DFAEHLLIPR | 1210.9 | 1210.7 | 62 | [F] |
Publisher’s Note: MDPI stays neutral with regard to jurisdictional claims in published maps and institutional affiliations. |
© 2022 by the authors. Licensee MDPI, Basel, Switzerland. This article is an open access article distributed under the terms and conditions of the Creative Commons Attribution (CC BY) license (https://creativecommons.org/licenses/by/4.0/).
Share and Cite
Feliciano, G.P.; Arimori, S.H.; Nakao, V.W.; Dos Santos, J.R.; Martins, E.A.L.; Bemquerer, M.P.; Cheng, E. Non-Cryoprecipitation Separation of Coagulation FVIII and Prothrombin Complex Proteins by Pseudoaffinity Calcium Elution Chromatography Using Anion Exchange Resin. Pharmaceuticals 2022, 15, 1192. https://doi.org/10.3390/ph15101192
Feliciano GP, Arimori SH, Nakao VW, Dos Santos JR, Martins EAL, Bemquerer MP, Cheng E. Non-Cryoprecipitation Separation of Coagulation FVIII and Prothrombin Complex Proteins by Pseudoaffinity Calcium Elution Chromatography Using Anion Exchange Resin. Pharmaceuticals. 2022; 15(10):1192. https://doi.org/10.3390/ph15101192
Chicago/Turabian StyleFeliciano, Gabriel Pinna, Sara Hayama Arimori, Vinicius Watanabe Nakao, Joice Rodrigues Dos Santos, Elizabeth A. L. Martins, Marcelo Porto Bemquerer, and Elisabeth Cheng. 2022. "Non-Cryoprecipitation Separation of Coagulation FVIII and Prothrombin Complex Proteins by Pseudoaffinity Calcium Elution Chromatography Using Anion Exchange Resin" Pharmaceuticals 15, no. 10: 1192. https://doi.org/10.3390/ph15101192
APA StyleFeliciano, G. P., Arimori, S. H., Nakao, V. W., Dos Santos, J. R., Martins, E. A. L., Bemquerer, M. P., & Cheng, E. (2022). Non-Cryoprecipitation Separation of Coagulation FVIII and Prothrombin Complex Proteins by Pseudoaffinity Calcium Elution Chromatography Using Anion Exchange Resin. Pharmaceuticals, 15(10), 1192. https://doi.org/10.3390/ph15101192