Monosubstituted Acetophenone Thiosemicarbazones as Potent Inhibitors of Tyrosinase: Synthesis, Inhibitory Studies, and Molecular Docking

 , ,
, ,
Abstract
1. Introduction
2. Results
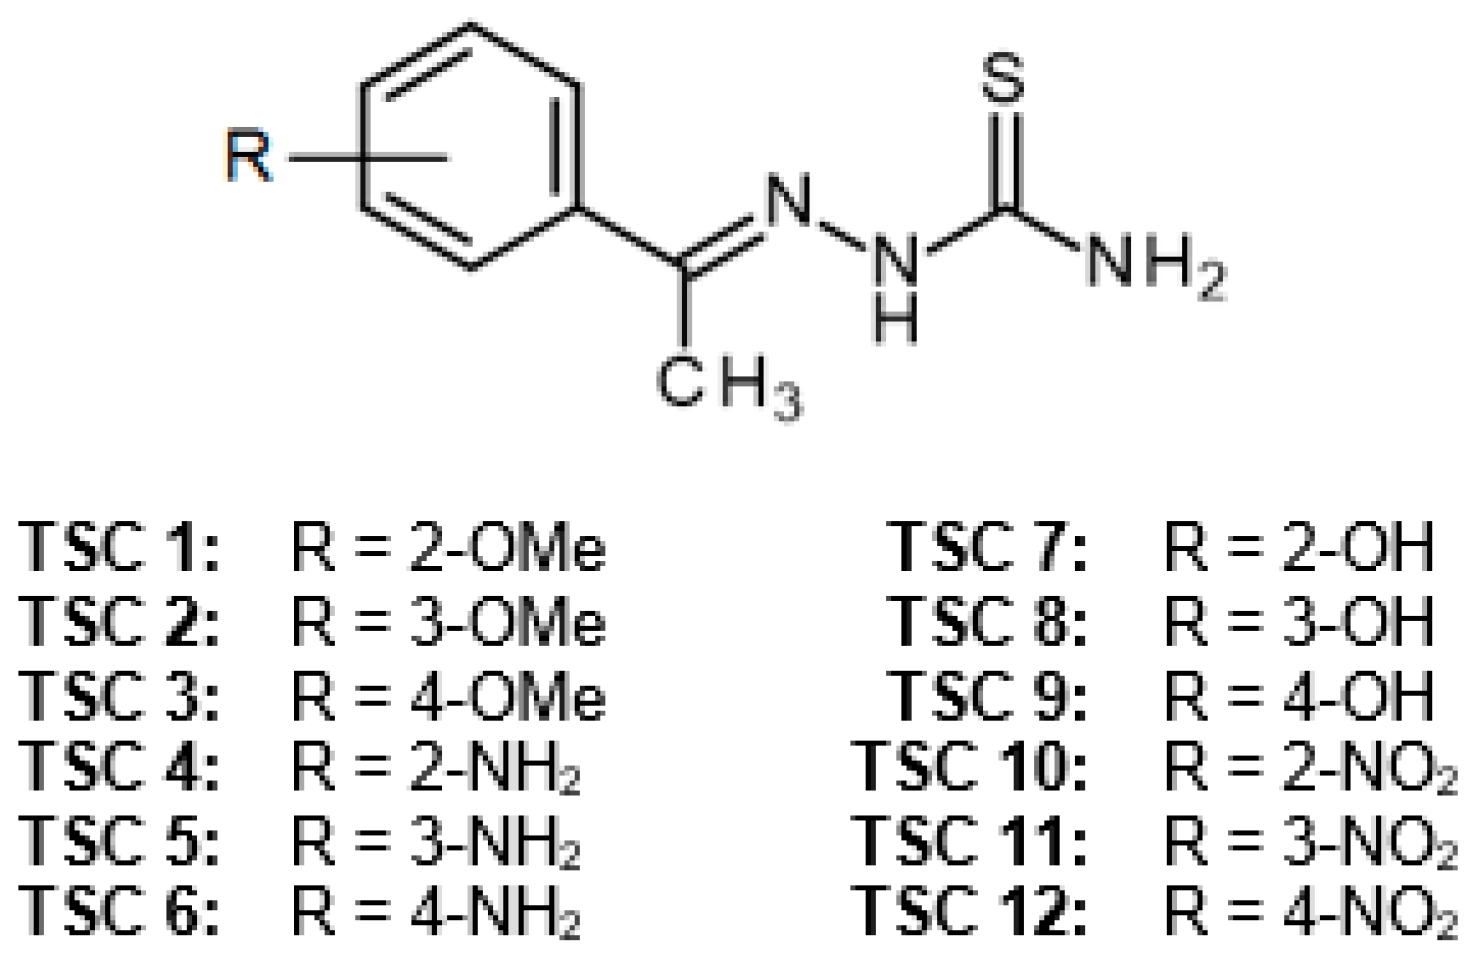
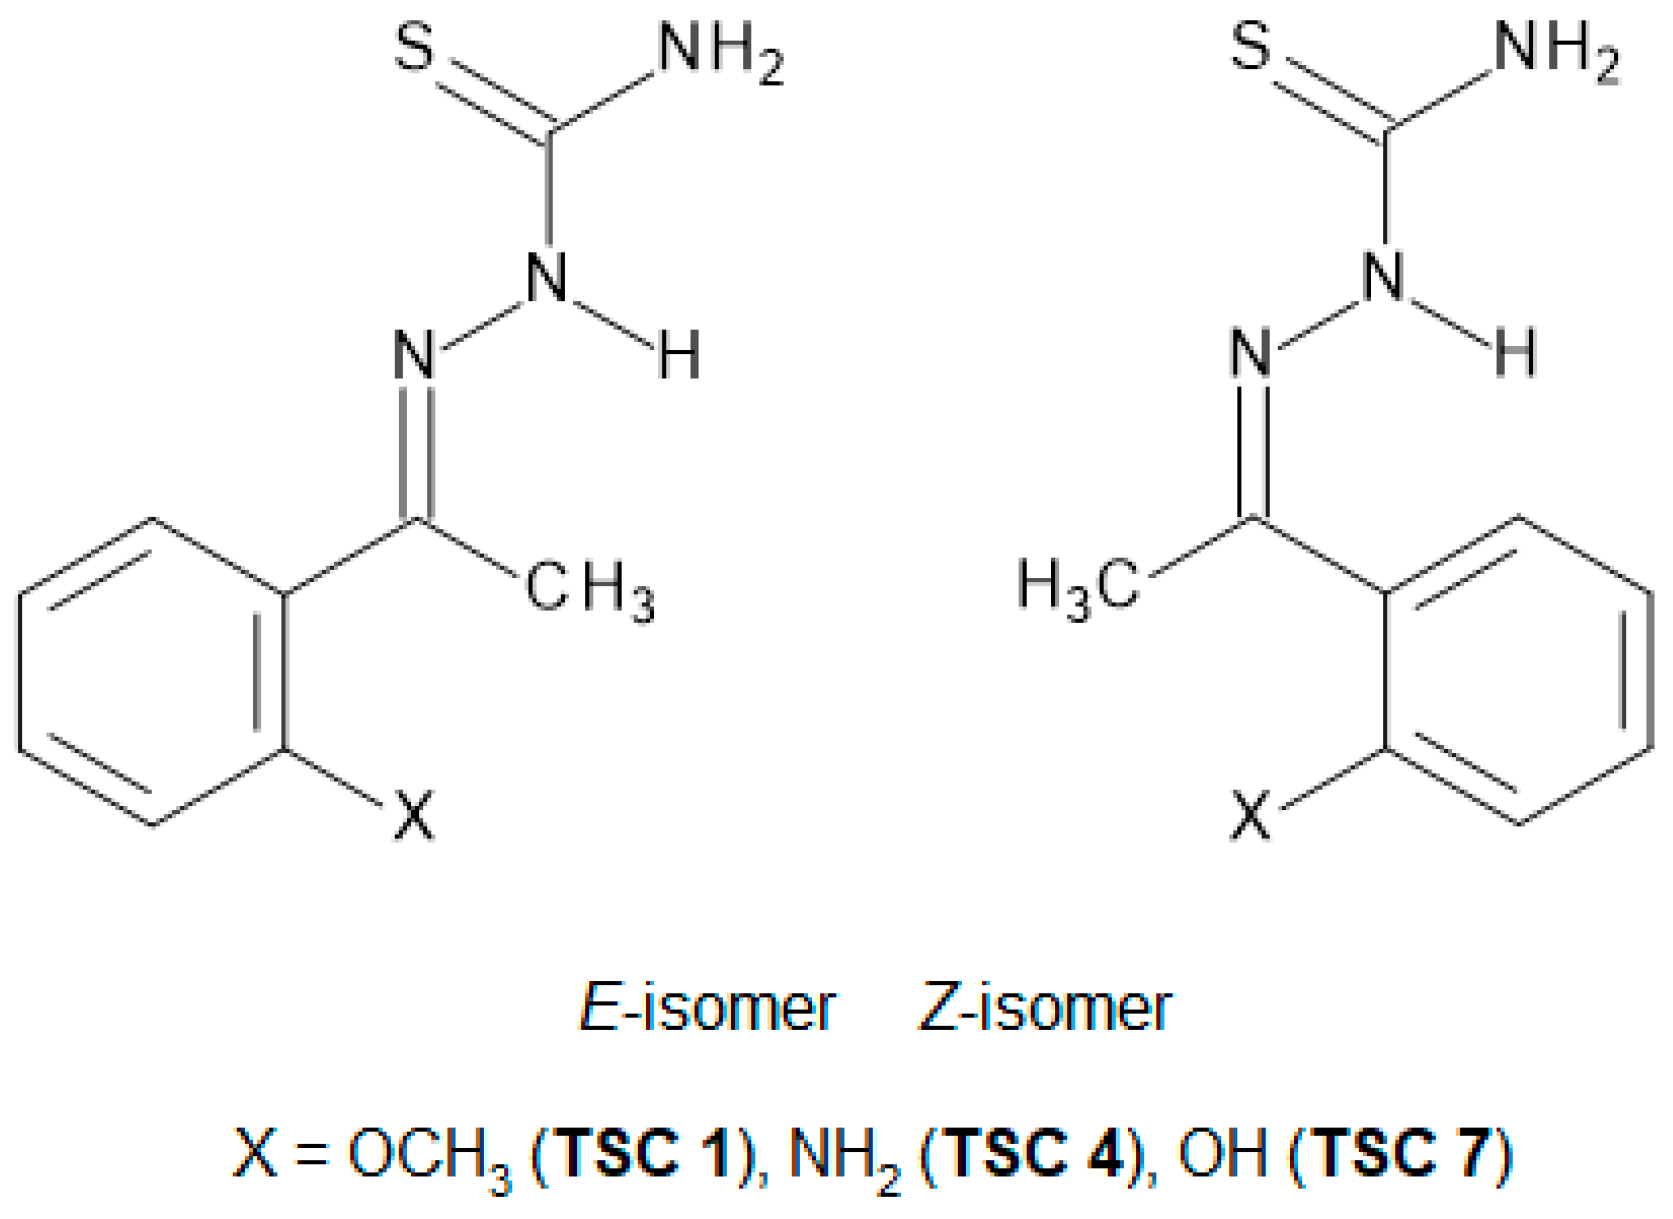
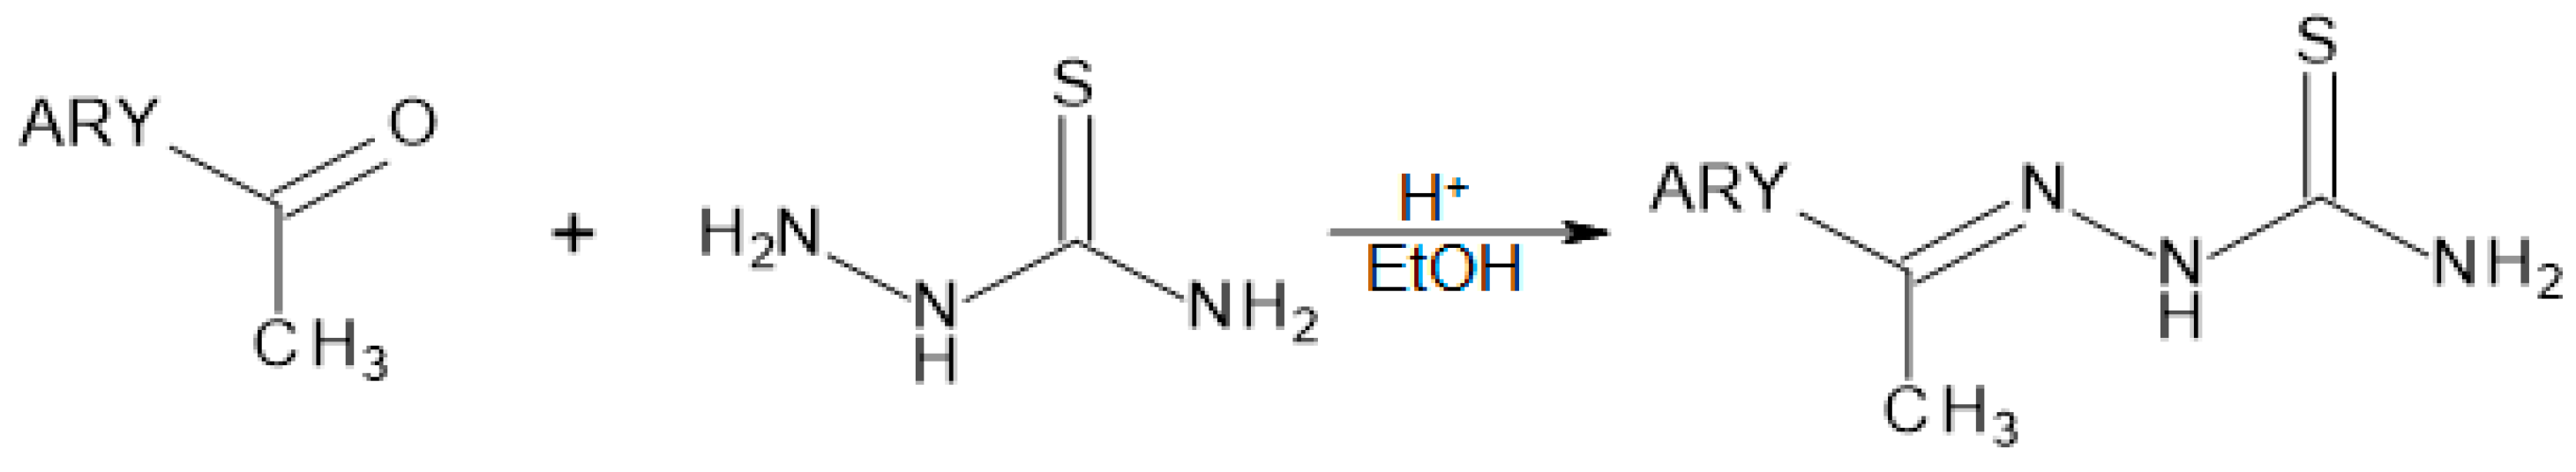
2.1. Chemistry
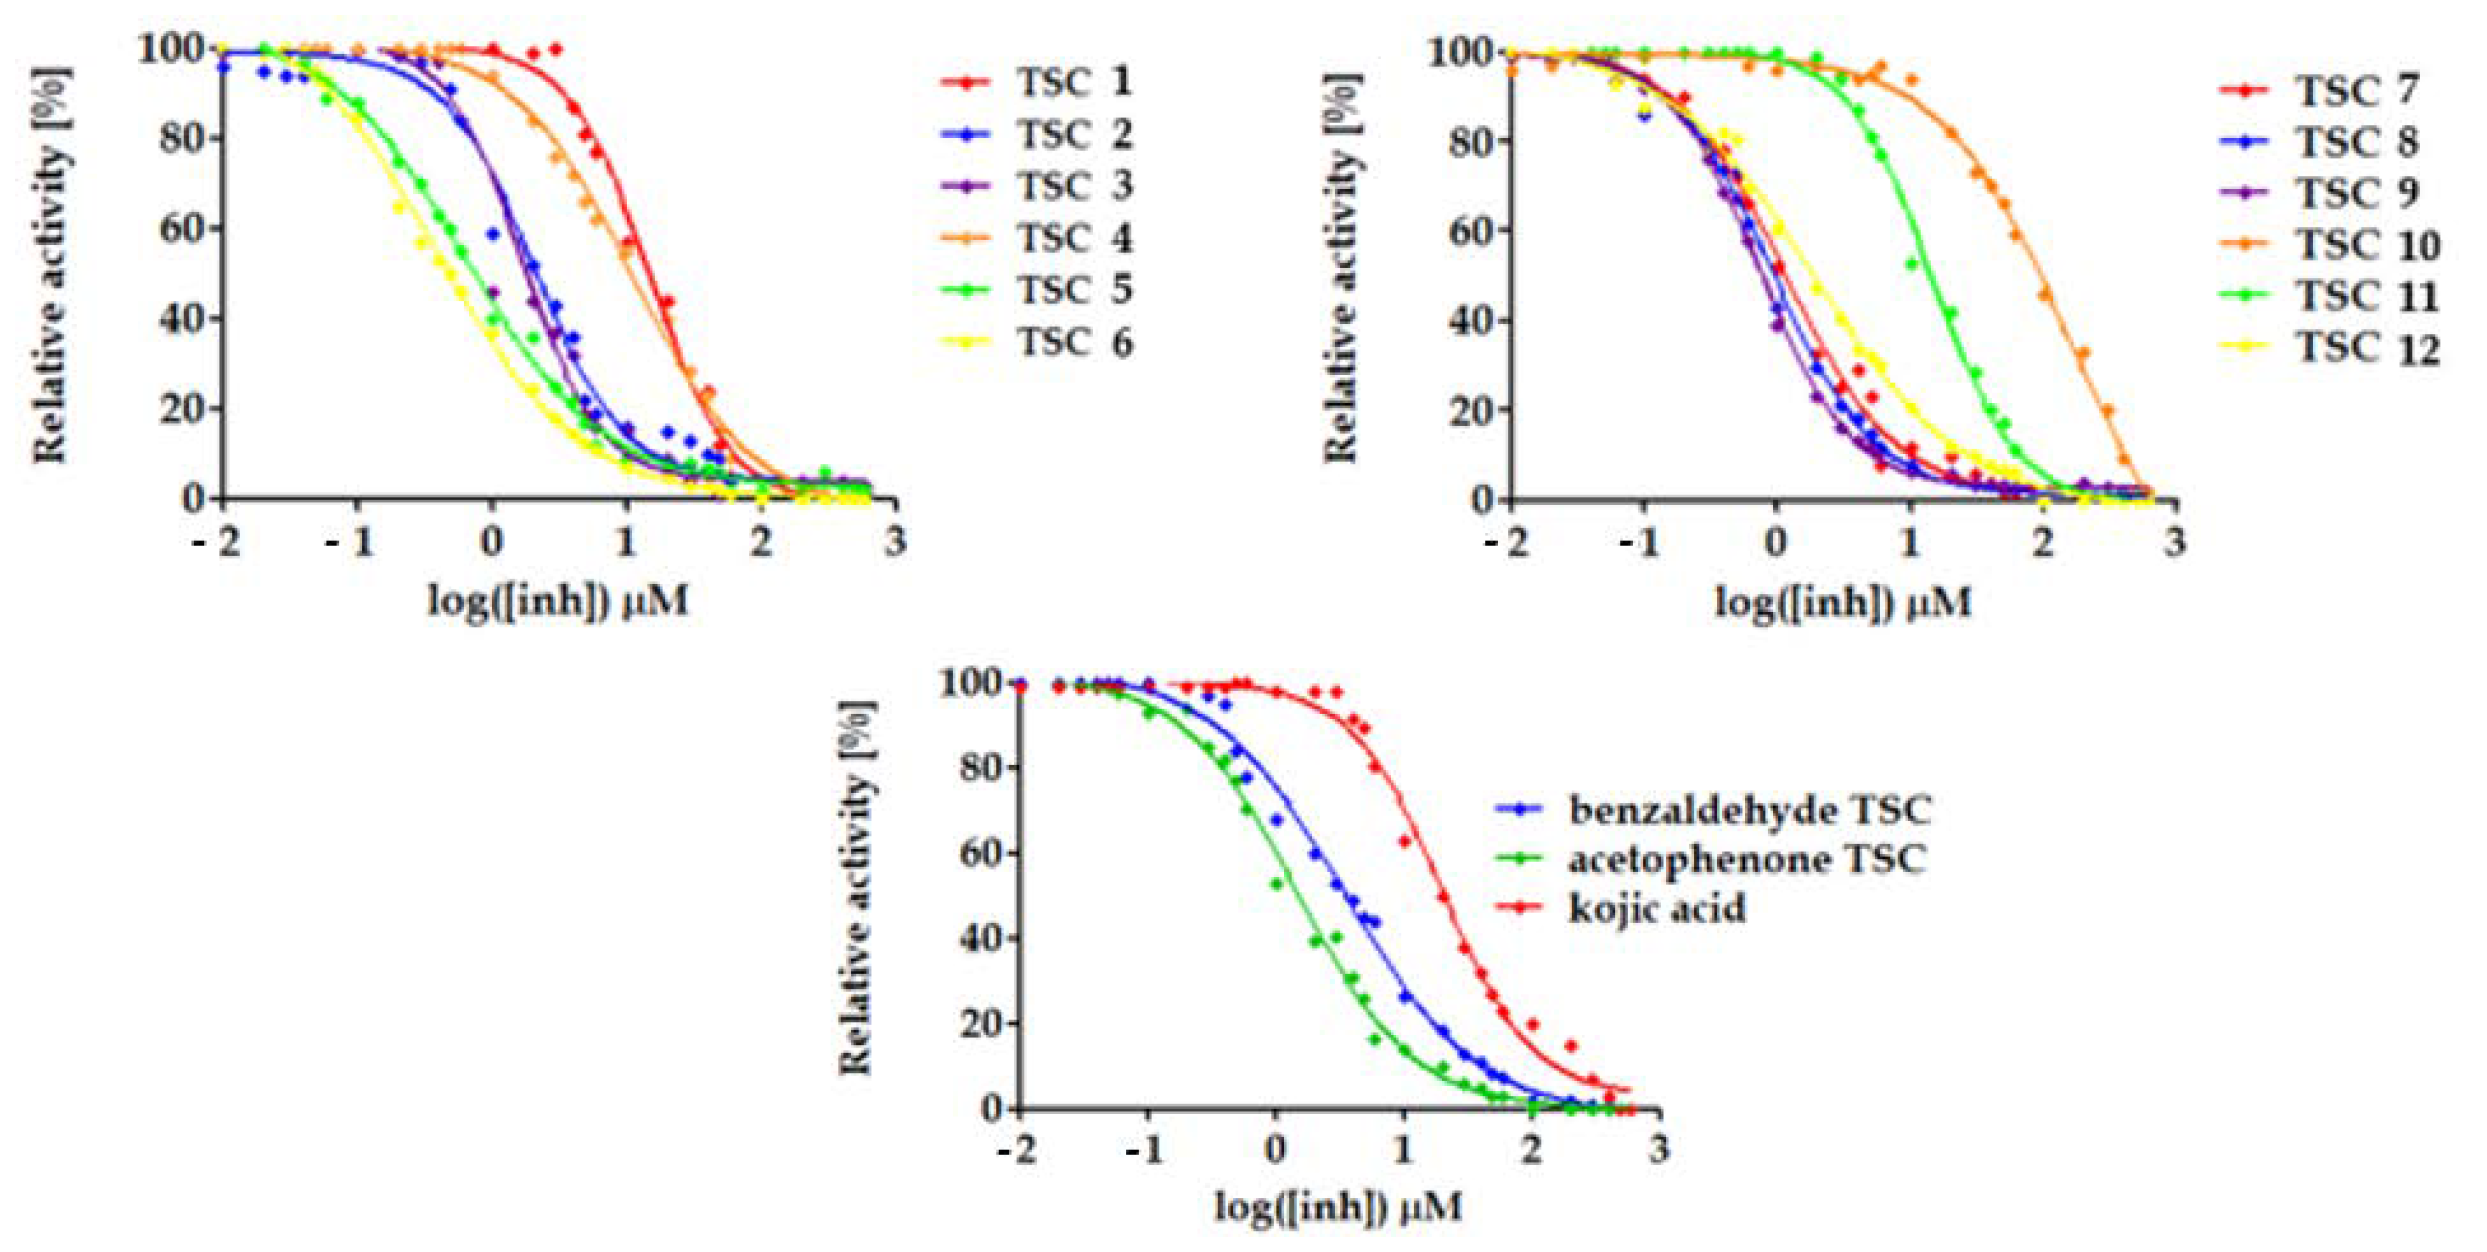
2.2. Effect of TSCs 1–12 on the Activity of Mushroom Tyrosinase
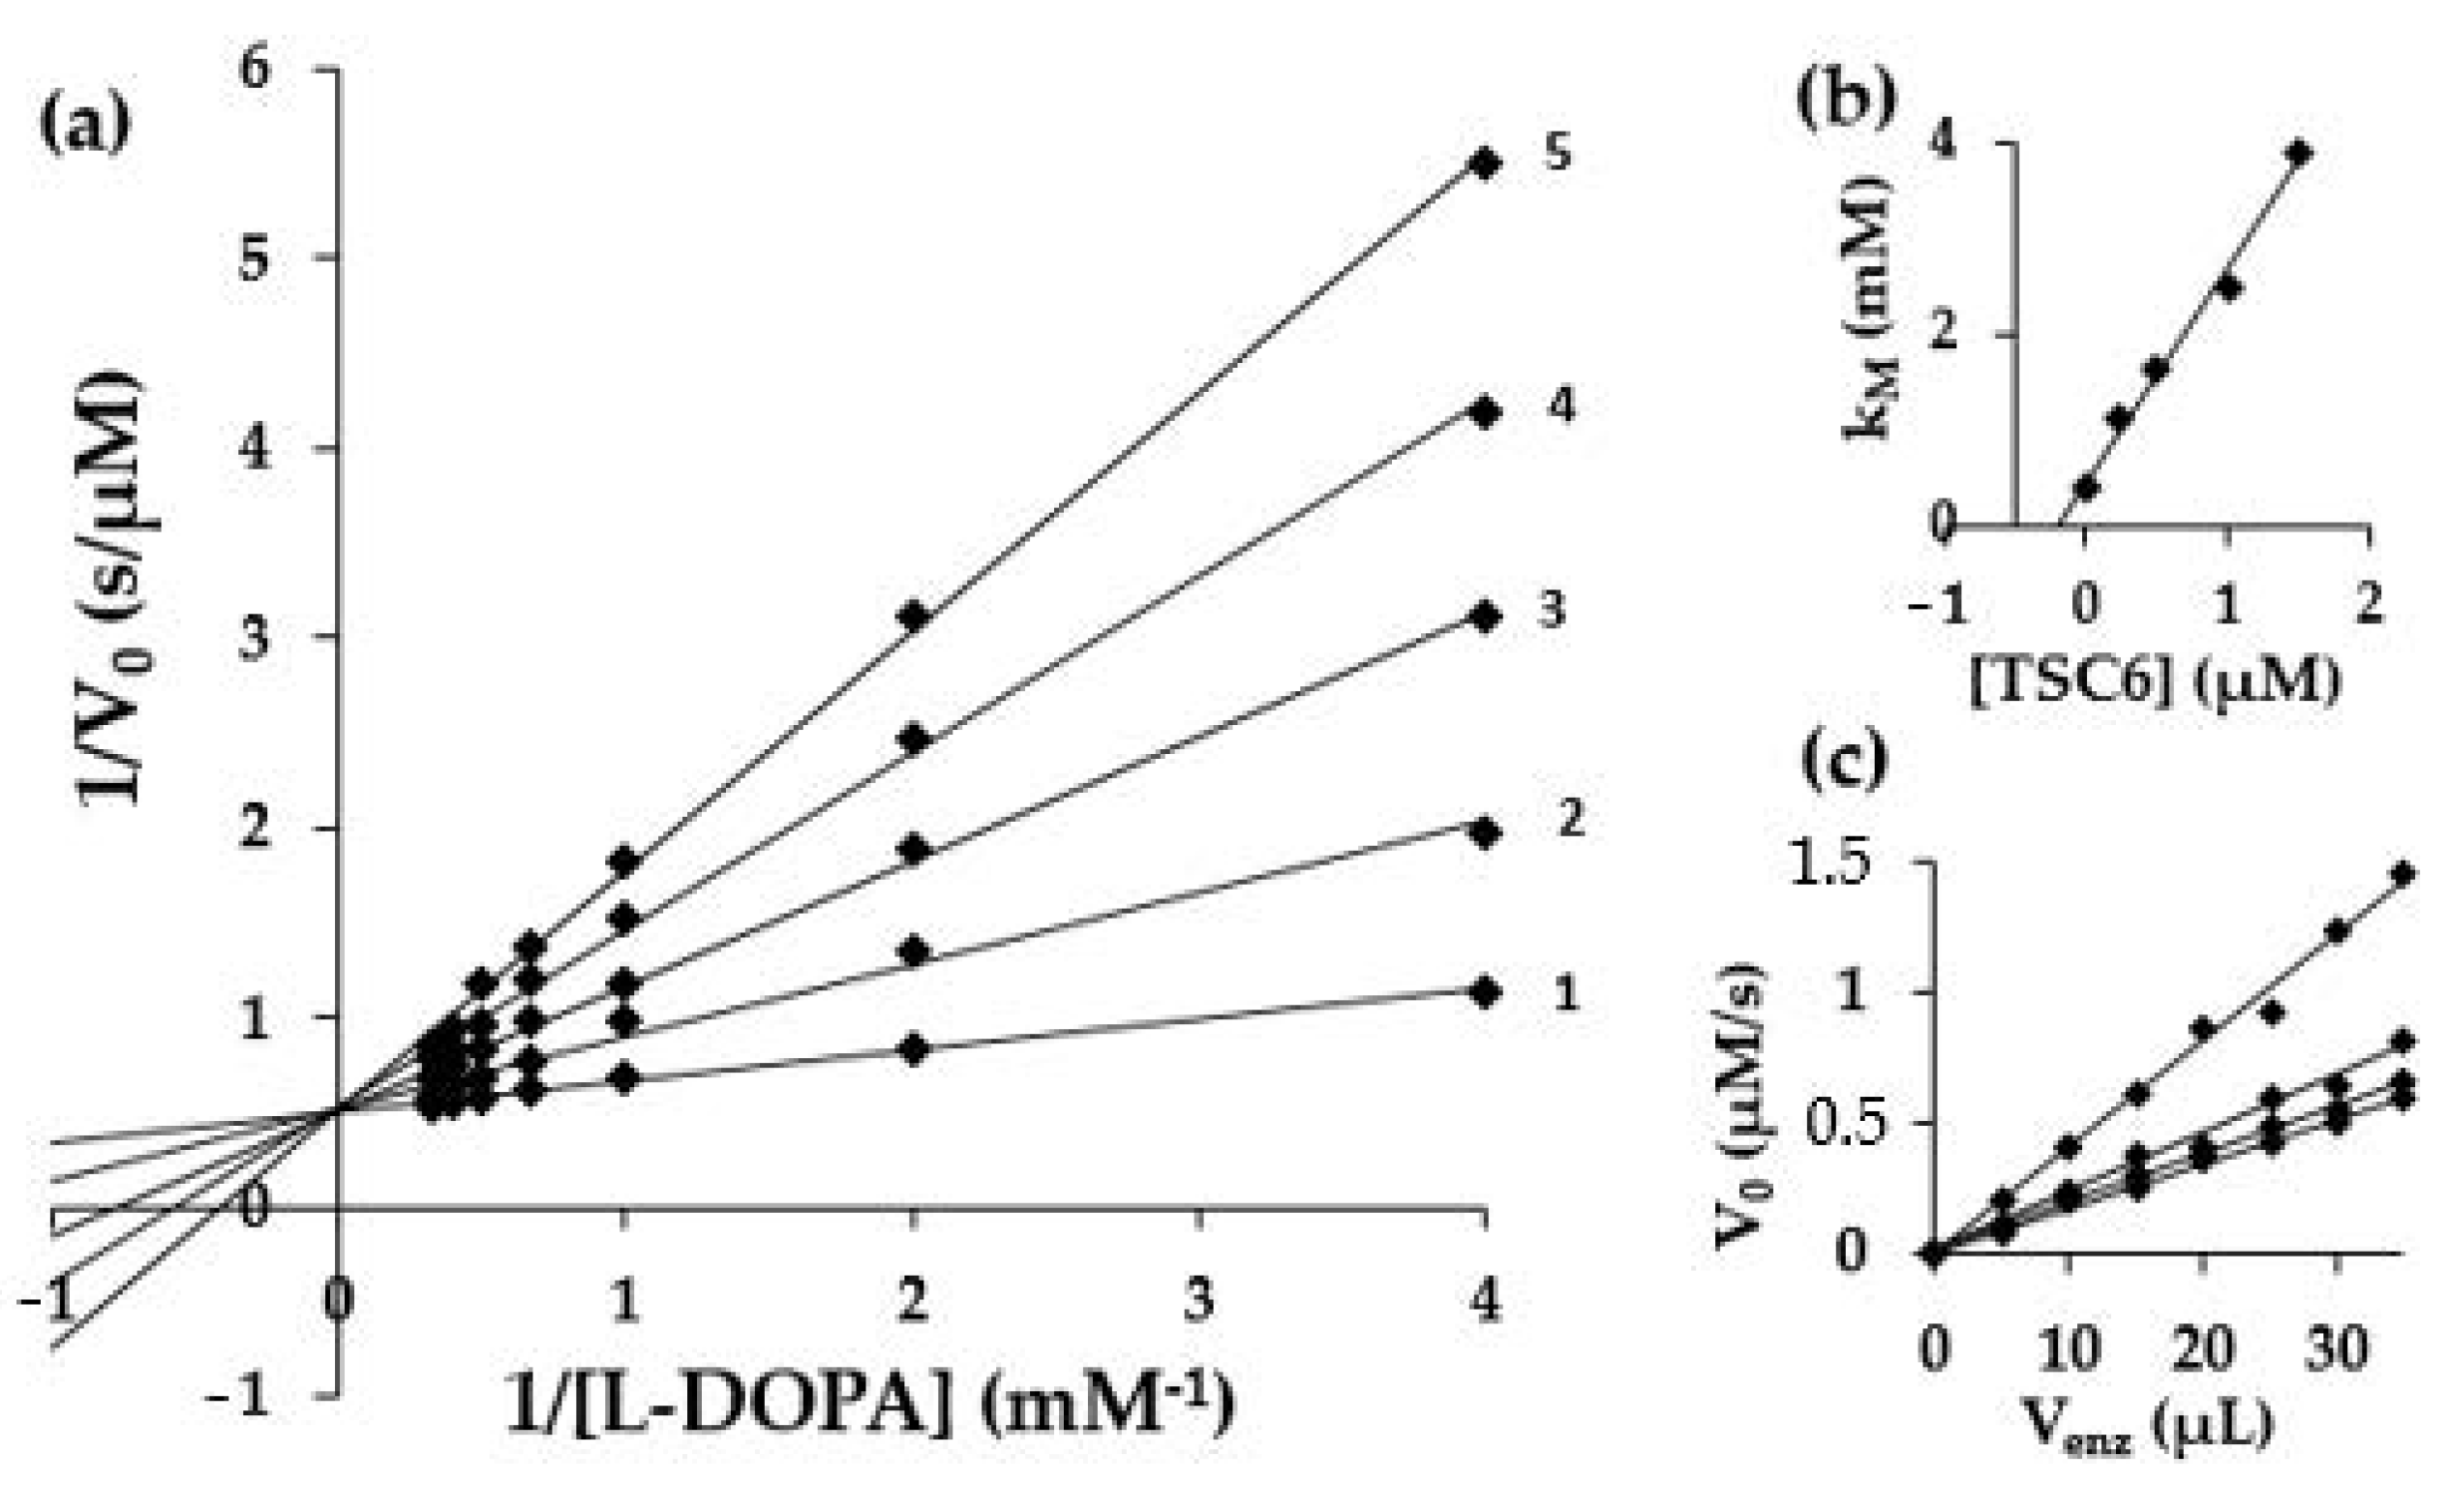
2.3. Kinetic Studies
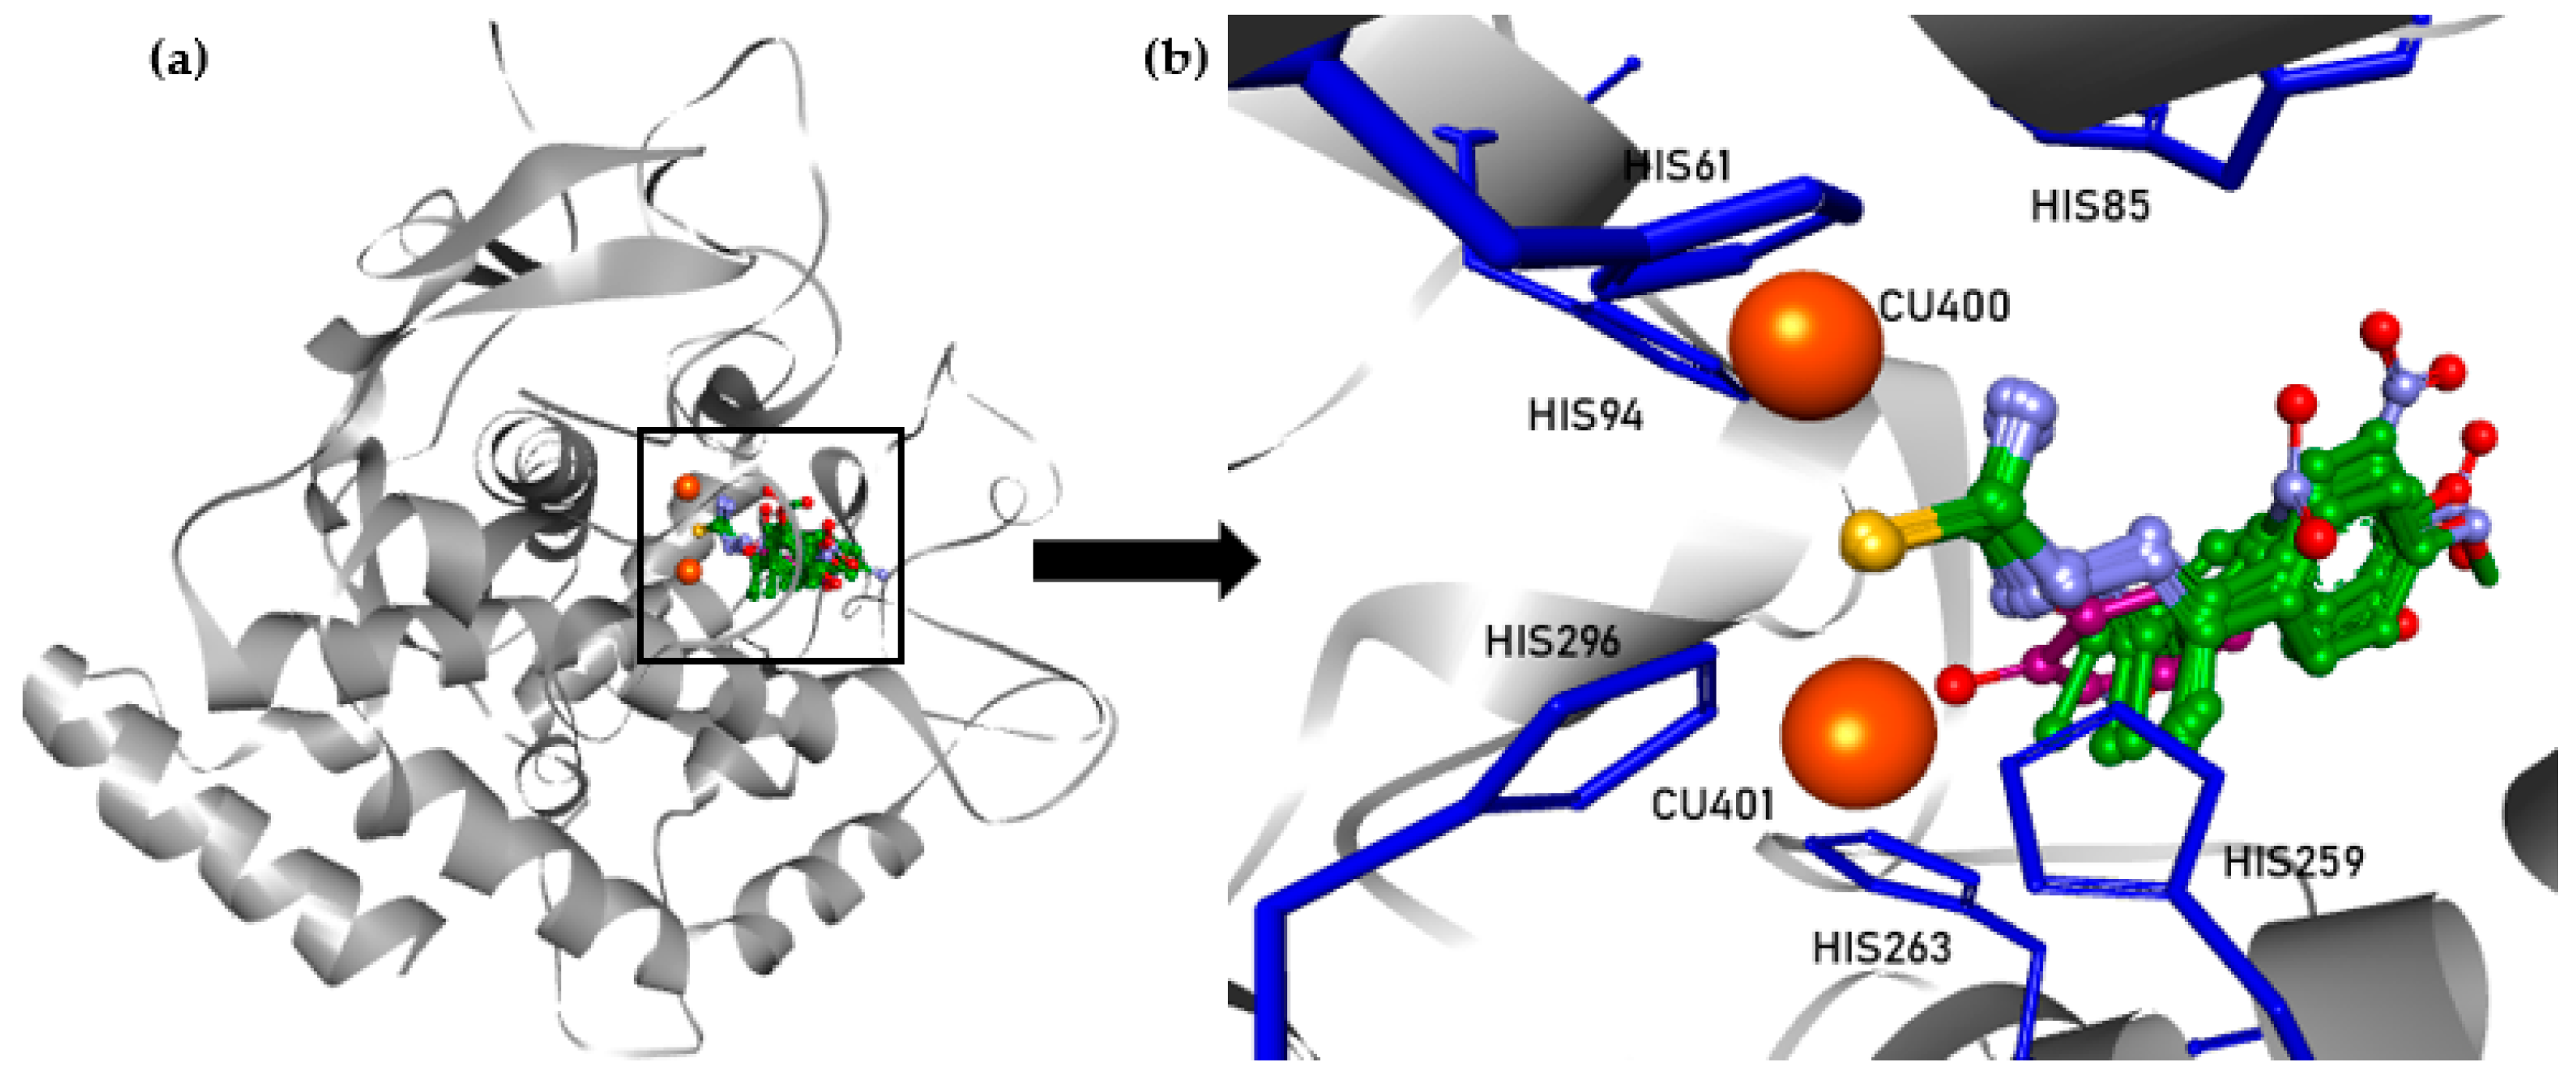
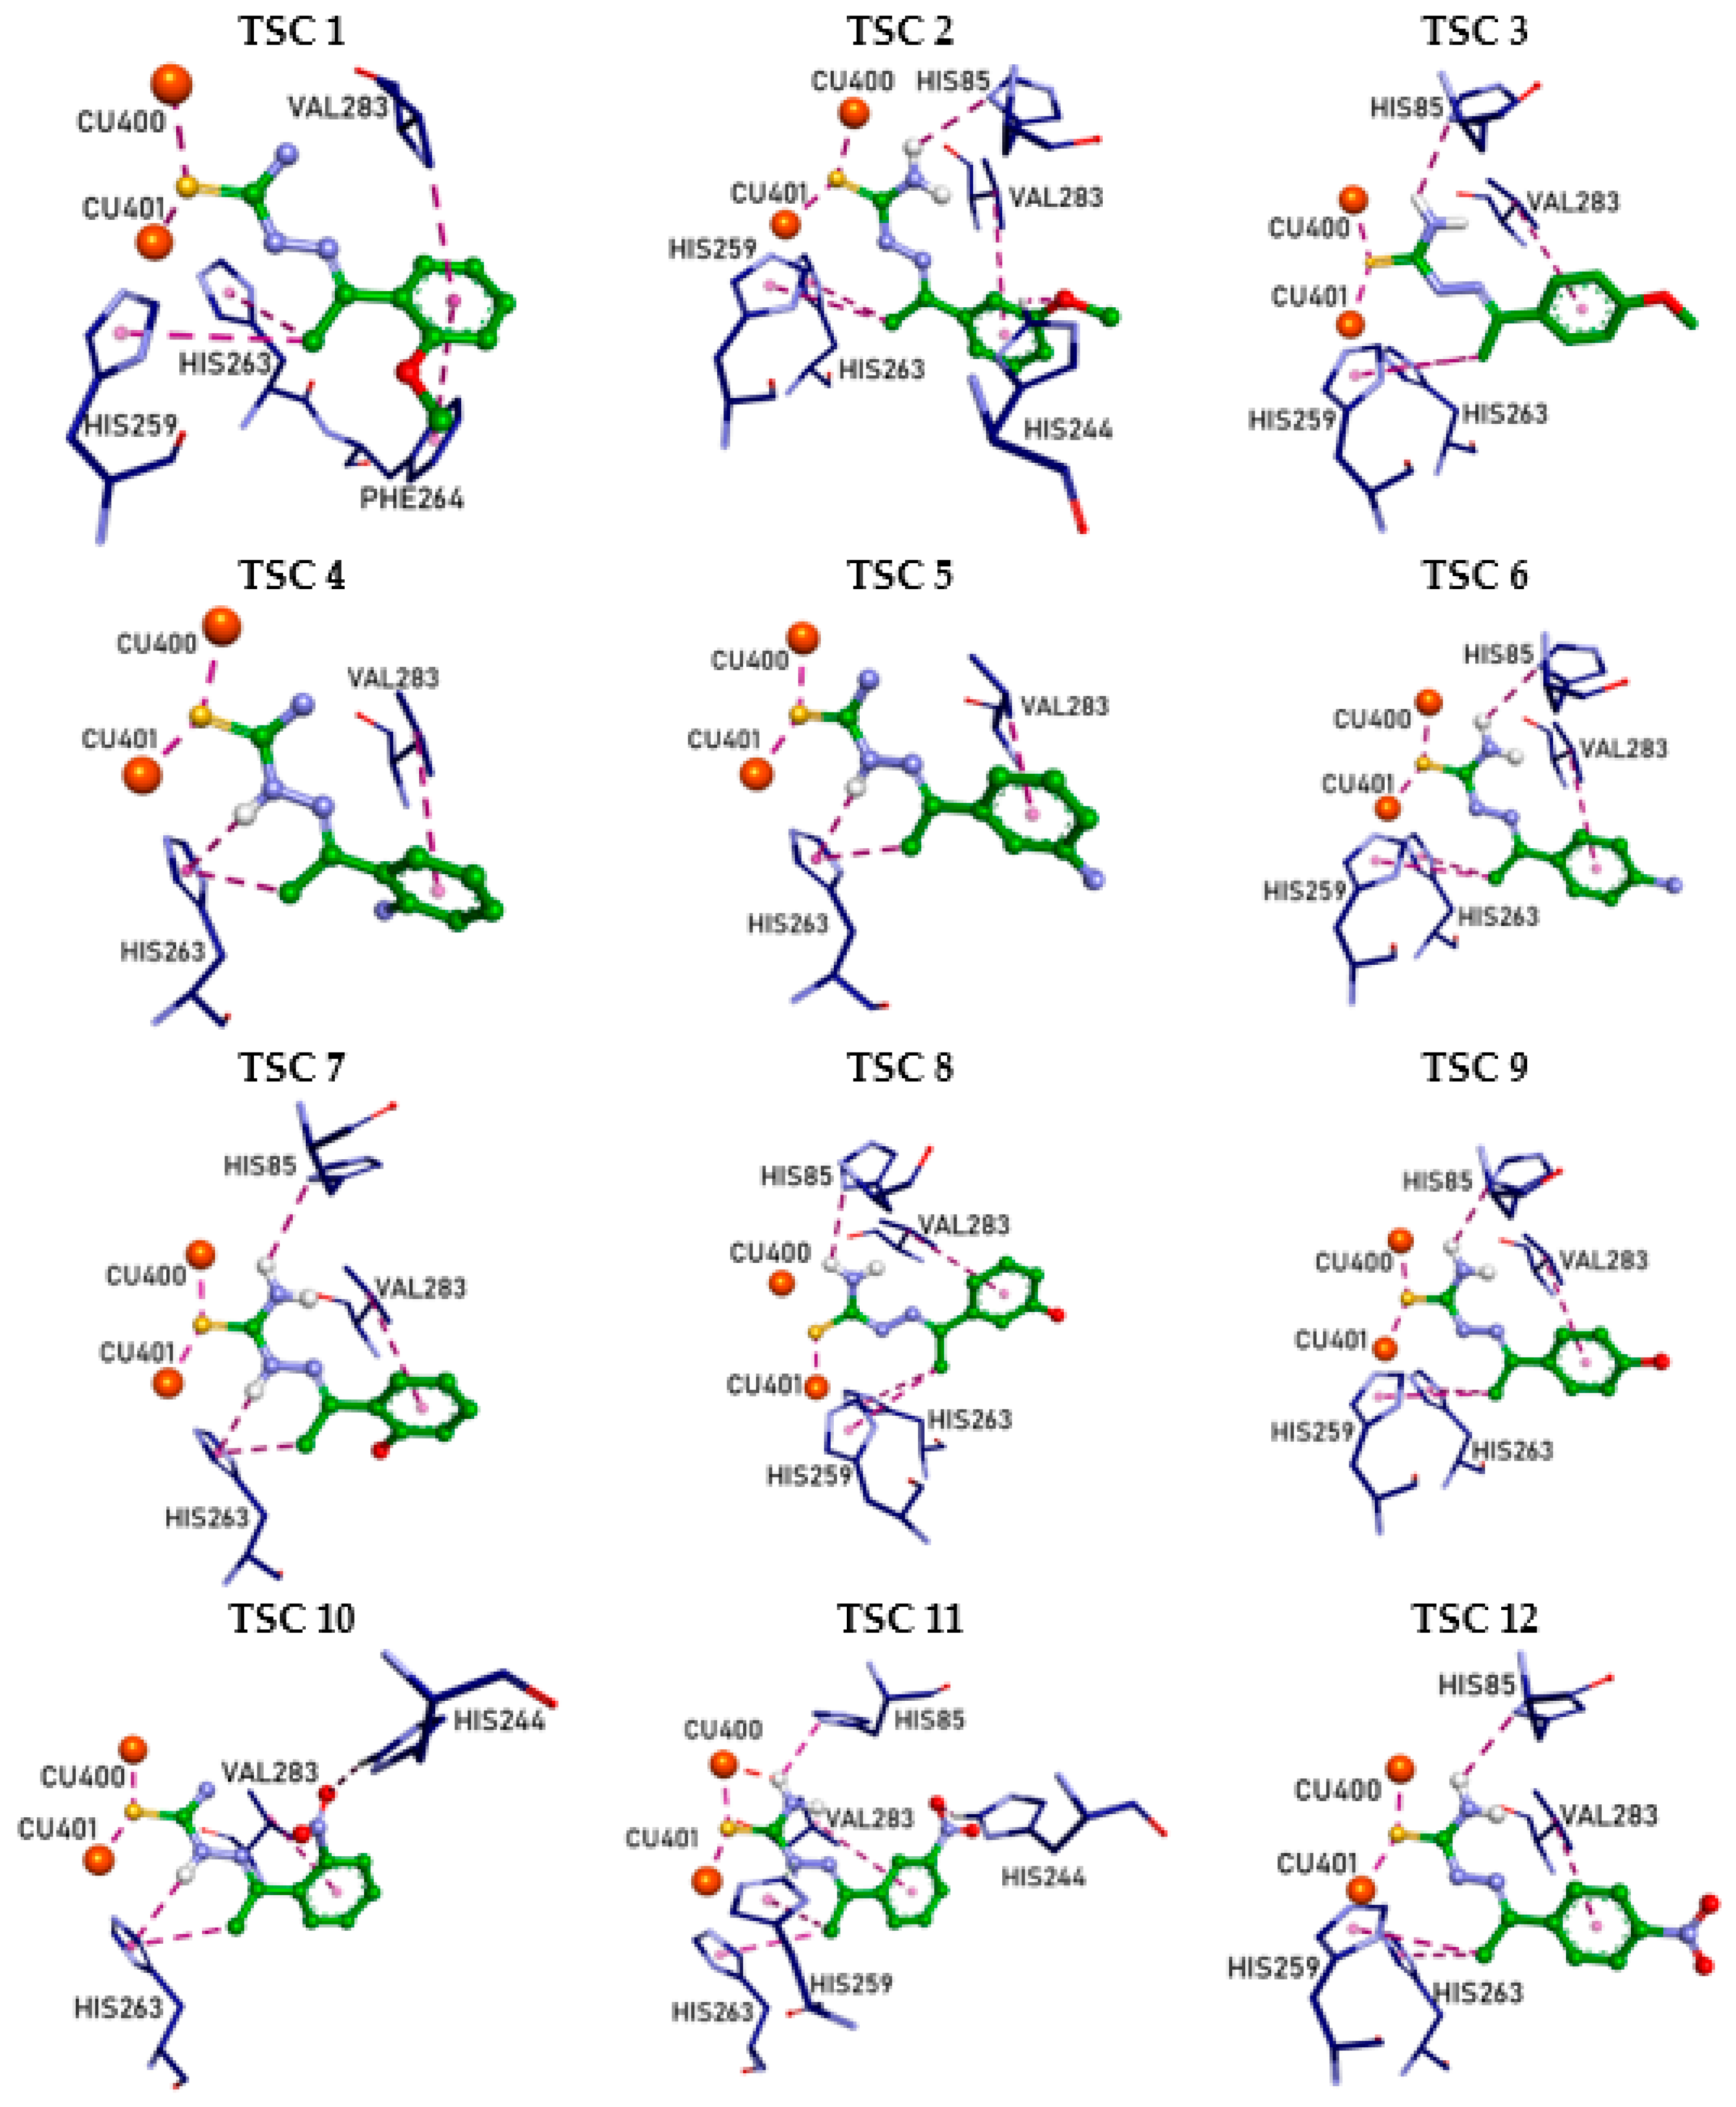
2.4. Molecular Docking
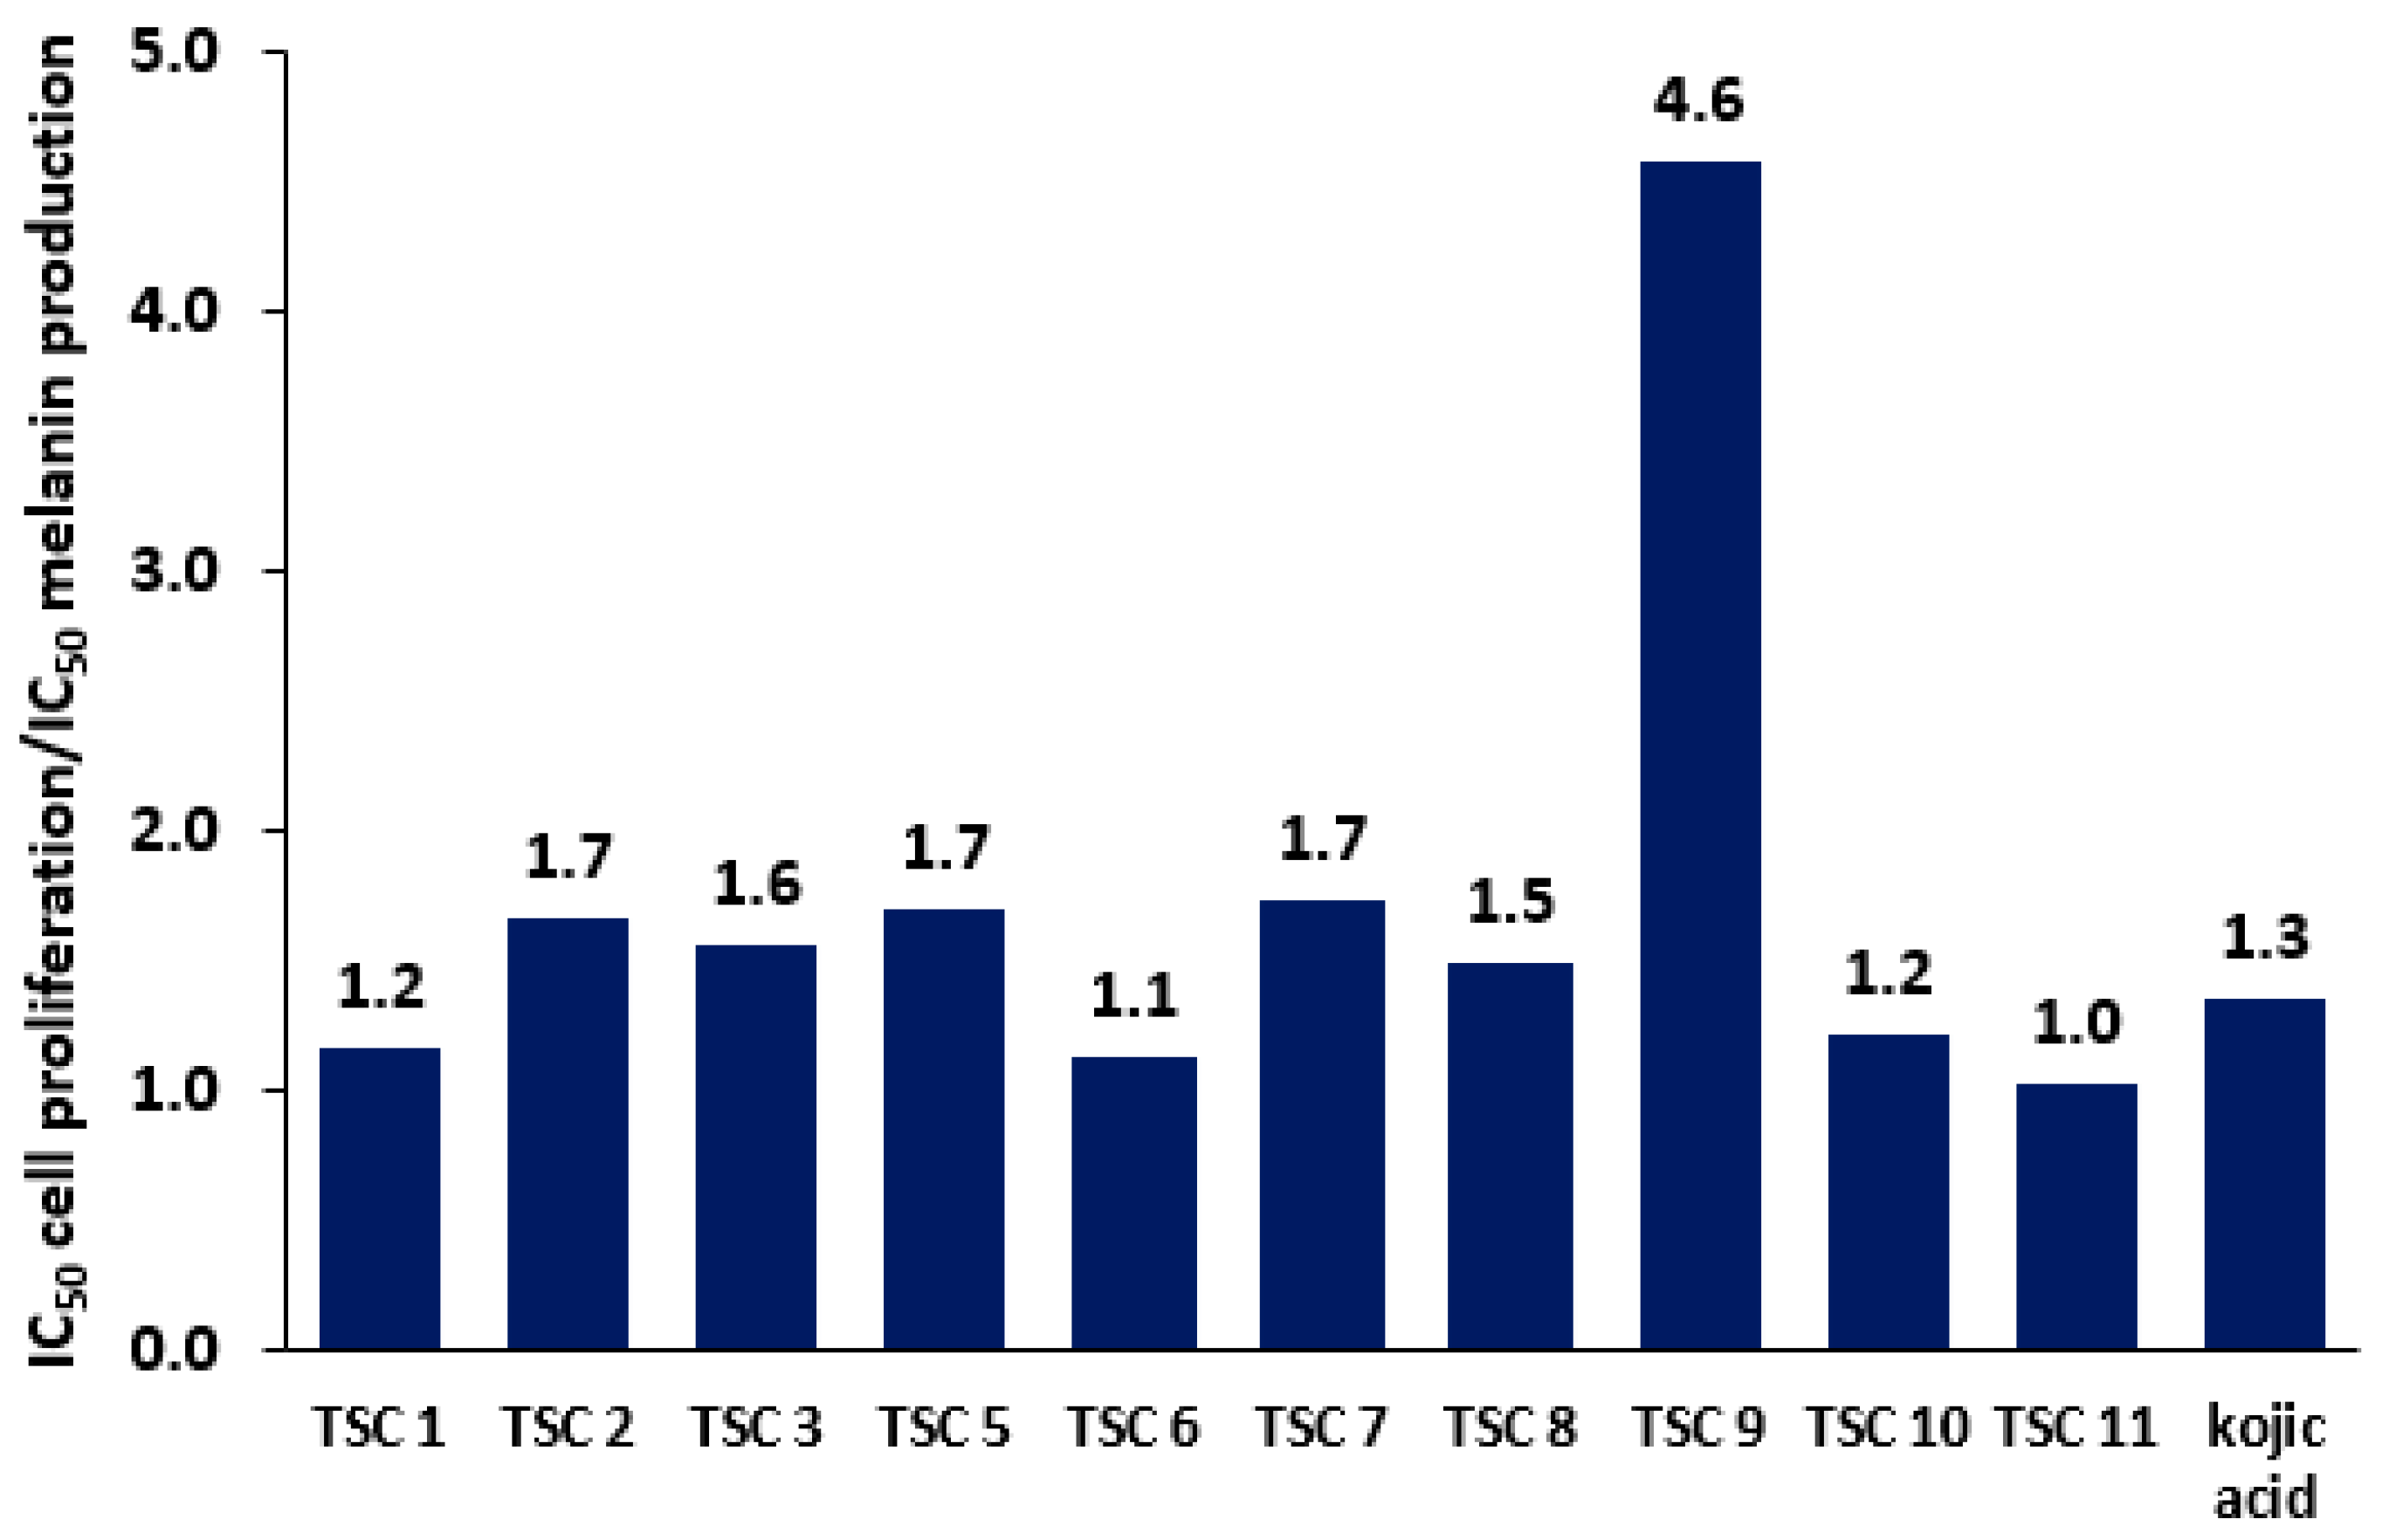
2.5. Effectiveness of TSCs in Melanogenesis Inhibition
3. Discussion
4. Materials and Methods
4.1. Chemistry
General Procedure for the Synthesis of TSCs 1–12
4.2. Enzyme Preparation
4.3. Tyrosinase Enzymatic Assay
4.4. Molecular Docking
4.5. Cell Proliferation Assay
4.6. Measurement of Melanin Production
Supplementary Materials
Author Contributions
Funding
Data Availability Statement
Acknowledgments
Conflicts of Interest
References
- Siegbahn, P.E.R. The catalytic cycle of tyrosinase: Peroxide attack on the phenolate ring followed by O[bond]O cleavage. J. Biol. Inorg. Chem. 2003, 8, 567–576. [Google Scholar] [CrossRef] [PubMed]
- Claus, H.; Decker, H. Bacterial tyrosinases. Syst. Appl. Microbiol. 2006, 29, 3–14. [Google Scholar] [CrossRef]
- D’Ischia, M.; Wakamatsu, K.; Cicoira, F.; Di Mauro, E.; Garcia-Borron, J.C.; Commo, S.; Galvan, I.; Ghanem, G.; Kenzo, K.; Meredith, P.; et al. Melanins and melanogenesis: From pigment cells to human health and technological applications. Pigm. Cell Melanoma R 2015, 28, 520–544. [Google Scholar] [CrossRef] [PubMed]
- Hridya, H.; Amrita, A.; Mohan, S.; Gopalakrishnan, M.; Dakshinamurthy, T.K.; Doss, G.P.; Siva, R. Functionality study of santalin as tyrosinase inhibitor: A potential depigmentation agent. Int. J. Biol. Macromol. 2016, 86, 383–389. [Google Scholar] [CrossRef] [PubMed]
- Xu, H.; Zhang, X.; Karangwa, E.; Xia, S. Correlating enzymatic browning inhibition and antioxidant ability of Maillard reaction products derived from different amino acids. J. Sci. Food Agric. 2017, 97, 4210–4218. [Google Scholar] [CrossRef]
- Pillaiyar, T.; Manickam, M.; Namasivayam, V. Skin whitening agents: Medicinal chemistry perspective of tyrosinase inhibitors. Enzym. Inhib. Med. Chem. 2017, 32, 403–425. [Google Scholar] [CrossRef]
- Pillaiyar, T.; Manickam, M.; Jung, S.H. Inhibitors of Melanogenesis: An Updated Review. J. Med. Chem. 2018, 61, 7395–7418. [Google Scholar] [CrossRef]
- Lee, S.Y.; Baek, N.; Nam, T.G. Natural, semisynthetic and synthetic tyrosinase inhibitors. J. Enzym. Inhib. Med. Chem. 2016, 31, 1–13. [Google Scholar] [CrossRef]
- Burnett, C.L.; Bergfeld, W.F.; Belsito, D.V.; Hill, R.A.; Klaassen, C.D.; Liebler, D.C.; Marks, J.G., Jr.; Shank, R.C.; Slaga, T.J.; Snyder, P.W.; et al. Final report of the safety assessment of Kojic acid as used in cosmetics. Int. J. Toxicol. 2010, 29, 244S–273S. [Google Scholar] [CrossRef]
- Andersen, F.A.; Bergfeld, W.F.; Belsito, D.V.; Hill, R.A.; Klaassen, C.C.D.; Liebler, D.C.; Marks, J.G., Jr.; Shank, R.C.; Slaga, T.J.; Snyder, P.W. Final amended safety assessment of hydroquinone as used in cosmetics. Int. J. Toxicol. 2010, 29 (Suppl. 6), 274S–287S. [Google Scholar] [CrossRef]
- Yusuf, M.; Jain, P. Synthesis and biological significances of 1,3,4-thiadiazolines and related heterocyclic compounds. Arab. J. Chem. 2014, 7, 525–552. [Google Scholar] [CrossRef]
- Chellan, P.; Nasser, S.; Vivas, L.; Chibale, K.; Smith, G.S. Cyclopalladated complexes containing tridentate thiosemicarbazone ligands of biological significance: Synthesis, structure and antimalarial activity. J. Organomet. Chem. 2010, 695, 2225–2232. [Google Scholar] [CrossRef]
- Yu, Y.; Suryo Rahmanto, Y.; Richardson, D.R. Bp44mT: An orally active iron chelator of the thiosemicarbazone class with potent anti-tumour efficacy. Br. J. Pharmacol. 2012, 165, 148–166. [Google Scholar] [CrossRef] [PubMed]
- Arslan, H.; Duran, N.; Borekci, G.; Ozer, C.K.; Akbay, C. Antimicrobial Activity of Some Thiourea Derivatives and Their Nickel and Copper Complexes. Molecules 2009, 14, 519–527. [Google Scholar] [CrossRef]
- Song, S.; You, A.; Chen, Z.; Zhu, G.; Wen, H.; Song, H.; Yi, W. Study on the design, synthesis and structure-activity relationships of new thiosemicarbazone compounds as tyrosinase inhibitors. Eur. J. Med. Chem. 2017, 139, 815–825. [Google Scholar] [CrossRef]
- You, A.; Zhou, J.; Song, S.; Zhu, G.; Song, H.; Yi, W. Structure-based modification of 3-/4-aminoacetophenones giving a profound change of activity on tyrosinase: From potent activators to highly efficient inhibitors. Eur. J. Med. Chem. 2015, 93, 255–262. [Google Scholar] [CrossRef]
- Buitrago, E.; Vuillamy, A.; Boumendjel, A.; Yi, W.; Gellon, G.; Hardré, R.; Philouze, C.; Serratrice, G.; Jamet, H.; Regliér, M.; et al. Exploring the Interaction of N/S Compounds with a Dicopper Center: Tyrosinase Inhibition and Model Studies. Inorg. Chem. 2014, 53, 12848–12858. [Google Scholar] [CrossRef]
- You, A.; Zhou, J.; Song, S.; Zhu, G.; Song, H.; Yi, W. Rational design, synthesis and structure—Activity relationships of 4-alkoxy- and 4-acyloxy-phenylethylenethiosemicarbazone analogues as novel tyrosinase inhibitors. Bioorg. Med. Chem. 2015, 23, 924–931. [Google Scholar] [CrossRef]
- Yang, M.H.; Chen, C.M.; Hu, Y.H.; Zheng, C.Y.; Li, Z.C.; Ni, L.L.; Sun, L.; Chen, Q.X. Inhibitory kinetics of DABT and DABPT as novel tyrosinase inhibitors. J. Biosci. Bioeng. 2013, 115, 514–517. [Google Scholar] [CrossRef]
- Hałdys, K.; Goldeman, W.; Jewgiński, M.; Wolińska, E.; Anger, N.; Rossowska, J.; Latajka, R. Inhibitory properties of aromatic thiosemicarbazones on mushroom tyrosinase: Synthesis, kinetic studies, molecular docking and effectiveness in melanogenesis inhibition. Bioorg. Chem. 2018, 81, 577–586. [Google Scholar] [CrossRef]
- Hałdys, K.; Goldeman, W.; Jewgiński, M.; Wolińska, E.; Anger, N.; Rossowska, J.; Latajka, R. Halogenated aromatic thiosemicarbazones as potent inhibitors of tyrosinase and melanogenesis. Bioorg. Chem. 2020, 94, 10341. [Google Scholar] [CrossRef] [PubMed]
- Xie, J.; Dong, H.; Yu, Y.; Cao, S. Inhibitory effect of synthetic aromatic heterocycle thiosemicarbazone derivatives on mushroom tyrosinase: Insights from fluorescence, 1H NMR titration and molecular docking studies. Food Chem. 2016, 190, 709–716. [Google Scholar] [CrossRef] [PubMed]
- Dong, H.; Liu, J.; Liu, X.; Yu, Y.; Cao, S. Combining molecular docking and QSAR studies for modeling the anti-tyrosinase activity of aromatic heterocycle thiosemicarbazone analogues. J. Mol. Struct. 2018, 1151, 353–365. [Google Scholar] [CrossRef]
- Makam, P.; Kankanala, R.; Prakash, A.; Kannan, T. 2-(2-Hydrazinyl)thiazole derivatives: Design, synthesis and in vitro antimycobacterial studies. Eur. J. Med. Chem. 2013, 69, 564–576. [Google Scholar] [CrossRef] [PubMed]
- Opletalová, V.; Kalinowski, D.S.; Vejsová, M.; Kuneš, J.; Pour, M.; Jampílek, J.; Buchta, V.; Richardson, D.S. Identification and Characterization of Thiosemicarbazones with Antifungal and Antitumor Effects: Cellular Iron Chelation Mediating Cytotoxic Activity. Chem. Res. Toxicol. 2008, 21, 878–1889. [Google Scholar] [CrossRef]
- Ali, A.A.; Nimir, H.; Aktas, C.; Huch, V.; Rauch, U.; Schäfer, K.H.; Veith, M. Organoplatinum(II) Complexes with 2-Acetylthiophene Thiosemicarbazone: Synthesis, Characterization, Crystal Structures, and in Vitro Antitumor Activity. Organometallics 2012, 31, 2256–2262. [Google Scholar] [CrossRef]
- Fatondji, H.R.; Kpoviessi, S.; Gbaguidi, F.; Bero, J.; Hannaert, V.; Quetin-Leclercq, J.; Poupaert, J.; Moudachirou, M.; Accrombessi, G.C. Structure–activity relationship study of thiosemicarbazones on an African trypanosome: Trypanosoma brucei brucei. Med. Chem. Res. 2013, 22, 2151–2162. [Google Scholar] [CrossRef]
- Thanigaimalai, P.; Lee, K.C.; Sharma, V.K.; Roh, E.; Kim, Y.; Jung, S.H. Ketonethiosemicarbazones: Structure–activity relationships for their melanogenesis inhibition. Bioorg. Med. Chem. Lett. 2011, 21, 3527–3530. [Google Scholar] [CrossRef]
- Chang, T.S. An Updated Review of Tyrosinase Inhibitors. Int. J. Mol. Sci. 2009, 10, 2440–2475. [Google Scholar] [CrossRef]
- Chen, J.S.; Wei, C.I.; Marshall, M.R. Inhibition mechanism of kojic acid on polyphenol oxidase. J. Agric. Food Chem. 1991, 39, 1897–1901. [Google Scholar] [CrossRef]
- Copeland, R.A. Enzymes: A Practical Introduction to Structure, Mechanism, and Data Analysis, 2nd ed.; Viley-VCH: New York, NY, USA, 2000. [Google Scholar]
- Ismaya, W.T.; Rozeboom, H.J.; Weijn, A.; Fusetti, F.; Wichers, H.J.; Dijkstra, B.W. Crystal structure of Agaricus bisporus mushroom tyrosinase: Identity of the tetramer subunits and interaction with tropolone. Biochemistry 2011, 50, 5477–5486. [Google Scholar] [CrossRef] [PubMed]
- Jones, G.; Willett, P.; Glen, R.C.; Leach, A.R.; Taylor, R. Development and validation of a genetic algorithm for flexible docking. J. Mol. Biol. 1997, 267, 727–748. [Google Scholar] [CrossRef] [PubMed]
- BIOVIA Discovery Studio Visualizer 5; Dassault Systèmes: San Diego, CA, USA, 2018.
- Zhu, T.H.; Cao, S.W.; Yu, Y.Y. Synthesis, characterization and biological evaluation of paeonol thiosemicarbazone analogues as mushroom tyrosinase inhibitors. Int. J. Biol. Macromol. 2013, 62, 589–595. [Google Scholar] [CrossRef] [PubMed]
- Parvez, S.; Kang, M.; Chung, H.S.; Bae, H. Naturally occurring tyrosinase inhibitors: Mechanism and applications in skin health, cosmetics and agriculture industries. Phythoter. Res. 2007, 21, 805–816. [Google Scholar] [CrossRef] [PubMed]
- Bagherzadeh, K.; Talari, F.S.; Sharifi, A.; Ganjali, M.R.; Saboury, A.A.; Amanlou, M. A new insight into mushroom tyrosinase inhibitors: Docking, pharmacophore-based virtual screening, and molecular modeling studies. J. Biomol. Struct. Dyn. 2015, 33, 487–501. [Google Scholar] [CrossRef] [PubMed]
- Briganti, S.; Camera, E.; Picardo, M. Chemical and instrumental approaches to treat hyperpigmentation. Pigm. Cell Res. 2003, 16, 101–110. [Google Scholar] [CrossRef]
- Solano, F.; Briganti, S.; Picardo, M.; Ghanem, G. Hypopigmenting agents: An updated review on biological, chemical and clinical aspects. Pigm. Cell Res. 2006, 19, 550–571. [Google Scholar] [CrossRef]
- Du, X.H.; Guo, C.; Hansell, E.; Doyle, P.S.; Caffrey, C.R.; Holler, T.P.; McKerrow, J.H.; Cohen, F.E. Synthesis and structure-activity relationship study of potent trypanocidal thiosemicarbazone inhibitors of the trypanosomal cysteine protease cruzain. J. Med. Chem. 2002, 45, 2695–2707. [Google Scholar] [CrossRef]
- Saravanan, R.R.; Seshadri, S.; Gunasekaran, S.; Mendoza-Merońo, R.; Garcia-Granda, S. Conformational analysis, X-ray crystallographic, FT-IR, FT-Raman, DFT, MEP and molecular docking studies on 1-(1-(3-methoxyphenyl) ethylidene) thiosemicarbazide. Spectrochim. Acta A Mol. Biomol. Spectrosc. 2015, 139, 321–328. [Google Scholar] [CrossRef]
- Greenbaum, D.C.; Mackey, Z.; Hansell, E.; Doyle, P.; Gut, J.; Caffrey, C.R.; Lehrman, J.; Rosenthal, P.J.; McKerrow, J.H.; Chibale, K. Synthesis and Structure-Activity Relationships of Parasiticidal Thiosemicarbazone Cysteine Protease Inhibitors against Plasmodium falciparum, Trypanosoma brucei, and Trypanosoma cruzi. J. Med. Chem. 2004, 47, 3212–3219. [Google Scholar] [CrossRef]
- Blau, L.; Menegon, R.F.; Trossini, G.H.G.; Molino, J.V.D.; Vital, D.G.; Cicarelli, R.M.B.; Passerini, G.D.; Bosquesi, P.L.; Chin, C.M. Design, synthesis and biological evaluation of new aryl thiosemicarbazone as antichagasic candidates. Eur. J. Med. Chem. 2013, 67, 142–151. [Google Scholar] [CrossRef] [PubMed]
- Singh, V.P.; Singh, R.V.; Tandon, J.P. Synthetic and structural studies of some tetracoordinated boron complexes of bifunctional tridentate Schiff bases. J. Prakt. Chem. 1989, 331, 690–696. [Google Scholar] [CrossRef]
- Liu, J.; Yi, W.; Wan, Y.; Ma, L.; Song, H. 1-(1-Arylethylidene)thiosemicarbazide derivatives: A new class of tyrosinase inhibitors. Bioorg. Med. Chem. 2008, 16, 1096–1102. [Google Scholar] [CrossRef] [PubMed]
- Murakata, C.; Yamashita, Y.; Nakai, R.; Akasaka, K.; Ino, Y.; Kato, K.; Kitamura, Y. M-Stage Kinesin inhibitor. European Patent Application EP1616866, 18 January 2006. [Google Scholar]
- Prabhu, R.N.; Pandiarajan, D.; Ramesh, R. Ruthenium(II) mediated C–H activation of substituted acetophenone thiosemicarbazones: Synthesis, structural characterization, luminescence and electrochemical properties. J. Organomet. Chem. 2009, 694, 4170–4177. [Google Scholar] [CrossRef]
- Gąsowska, B.; Kafarski, P.; Wojtasek, H. Interaction of mushroom tyrosinase with aromatic amines, o-diamines and o-aminophenols. BBA Gen. Subj. 2004, 1673, 170–177. [Google Scholar] [CrossRef]
- Labus, K. Biotransformacje z Wykorzystaniem Tyrozynazy z Agaricus Bisporus w Formie Natywnej i Immobilizowanej. Ph.D. Thesis, Wrocław University of Science and Technology, Wrocław, Poland, 2011. [Google Scholar]
- Zynek, K.; Bryjak, J. Isolation and purification of tyrosinase from Agaricus bisporus. Inz. Aparat. Chem. 2009, 3, 125–126. [Google Scholar]
- Frisch, M.J.; Trucks, G.W.; Schlegel, H.B.; Scuseria, G.E.; Robb, M.A.; Cheeseman, J.R.; Scalmani, G.; Barone, V.; Mennucci, B.; Petersson, G.A.; et al. Gaussian 09, Revision, D.01; Fox, Gaussian, Inc.: Wallingford, CT, USA, 2013. [Google Scholar]
- Tomasi, J.; Mennucci, B.; Cammi, R. Quantum mechanical continuum solvation models. Chem. Rev. 2005, 105, 2999–3093. [Google Scholar] [CrossRef] [PubMed]
- H++. Available online: http://biophysics.cs.vt.edu/index.php (accessed on 12 May 2019).
- Anandakrishnan, R.; Aguilar, B.; Onufriev, A.V. H++ 3.0: Automating pK prediction and the preparation of biomolecular structures for atomistic molecular modeling and simulation. Nucleic Acids Res. 2012, 40, 537–541. [Google Scholar] [CrossRef]
- Myers, J.; Grothaus, G.; Narayanan, S.; Onufriev, A. A simple clustering algorithm can be accurate enough for use in calculations of pKs in macromolecules. Proteins 2006, 63, 928–938. [Google Scholar] [CrossRef]
- Gordon, J.C.; Myers, J.B.; Folta, T.; Shoja, V.; Heath, L.S.; Onufriev, A. H++: A server for estimating pKas and adding missing hydrogens to macromolecules. Nucleic Acids Res. 2005, 33, W368–W371. [Google Scholar] [CrossRef]
- GOLD; 5.5 Version; CCDC: Cambridge, UK.
- Azam, S.S.; Uddin, R.; Syed, A.A.S.; Ul-Haq, Z. Molecular docking studies of potent inhibitors of tyrosinase and α-glucosidase. Med. Chem. Res. 2012, 21, 1677–1683. [Google Scholar] [CrossRef]
- Bellei, B.; Pitisci, A.; Izzo, E.; Picardo, M. Inhibition of Melanogenesis by the Pyridinyl Imidazole Class of Compounds: Possible Involvement of the Wnt/β-Catenin Signaling Pathway. PLoS ONE 2012, 7, e33021. [Google Scholar] [CrossRef] [PubMed]


| Compound | IC50 1 (µM) | 95% CI 2 IC50 (µM) (n = 3) | Ratio of IC50 of Kojic Acid to IC50 of TSC |
|---|---|---|---|
| TSC 1 | 12.2 | 10.3–14.8 | 1.6 |
| TSC 2 | 1.9 | 1.7–2.5 | 10.5 |
| TSC 3 | 1.8 | 1.3–2.1 | 11.1 |
| TSC 4 | 11.3 | 9.9–12.7 | 1.8 |
| TSC 5 | 0.65 | 0.5–0.7 | 30.6 |
| TSC 6 | 0.34 | 0.3–0.4 | 58.5 |
| TSC 7 | 1.2 | 1.0–1.2 | 16.5 |
| TSC 8 | 0.95 | 0.8–1.0 | 20.9 |
| TSC 9 | 0.80 | 0.7–0.9 | 24.9 |
| TSC 10 | 154,5 | 106.4–224.3 | 0.1 |
| TSC 11 | 14.2 | 12.91–15.79 | 1.4 |
| TSC 12 | 1.6 | 1.622–2.115 | 12.4 |
| Benzaldehyde TSC | 3.4 | 2.9–4.0 | 5.6 |
| Acetophenone TSC | 1.5 | 1.3–1.7 | 13.2 |
| Kojic acid | 19.9 | 17.2–23.9 | 1.0 |
| Compound | Inhibition Mechanism | Inhibition Type | Ki 1 ± Standard Error (µM) (n = 3) | Kis 2 ± Standard Error (µM) (n = 3) |
|---|---|---|---|---|
| TSC 1 | reversible | mixed | 5.0 ± 1.4 | 27.5 ± 3.5 |
| TSC 2 | reversible | mixed | 1.0 ± 0.1 | 9.7 ± 3.1 |
| TSC 3 | reversible | competitive | 0.6 ± 0.01 | - |
| TSC 4 | reversible | mixed | 8.0 ± 0.9 | 30.4 ± 0.5 |
| TSC 5 | reversible | mixed | 0.6 ± 0.1 | 3.05 ± 1.1 |
| TSC 6 | reversible | competitive | 0.2 ± 0.06 | 3.5 ± 0.8 |
| TSC 7 | reversible | mixed | 0.7 ± 0.1 | 5.3 ± 2.1 |
| TSC 8 | reversible | mixed | 0.6 ± 0.08 | 5.4 ± 0.1 |
| TSC 9 | reversible | competitive | 0.6 ± 0.06 | - |
| TSC 10 | reversible | mixed | 8.6 ± 0.5 | 43.3 ± 3.0 |
| TSC 11 | reversible | competitive | 0.4 ± 0.02 | - |
| TSC 12 | reversible | mixed | 5.0 ± 1.4 | 27.5 ± 3.5 |
| Kojic acid | reversible | mixed | 26 ± 1 | 72 ± 3 |
| Compound | Inhibition of Melanin Production | 95% CI 2 IC50 (µM) | Inhibition of Cell Proliferation | 95% CI 2 IC50 (µM) |
|---|---|---|---|---|
| IC50 1 (µM) | IC50 1 (µM) | |||
| TSC 1 | 39.2 | 36.57–42.03 | 45.2 | 36.43–56.19 |
| TSC 2 | 13.5 | 12.45–14.68 | 22.4 | 17.15–29.35 |
| TSC 3 | 13.1 | 11.68–14.65 | 20.3 | 15.03–27.35 |
| TSC 4 | 207.8 | 135.2–319.6 | 3113.4 3 | 499.3–19414 |
| TSC 5 | 88.9 | 81.41–97.12 | 149.6 | 124.8–179.4 |
| TSC 6 | 139.4 | 126.3–153.9 | 154.9 | 141.9–169.0 |
| TSC 7 | 21.7 | 18.50–25.49 | 37.3 | 31.31–44.38 |
| TSC 8 | 69.5 | 60.05–80.48 | 103.2 | 87.83–121.3 |
| TSC 9 | 25.2 | 19.39–32.75 | 115.3 | 99.15–134.1 |
| TSC 10 | 77.8 | 74.16–81.57 | 93.2 | 83.85–103.6 |
| TSC 11 | 44.0 | 38.48–50.43 | 44.8 | 40.04–50.22 |
| TSC 12 | 1160.3 4 | 219.7–6129 | 136.6 | 109.7–170.0 |
| Kojic acid | 114.1 | 105.9–123.0 | 152.7 | 138.4–168.6 |
| DMSO | 8019.8 | 140.5–457,651 | 166.4 | 153.4–180.6 |
Publisher’s Note: MDPI stays neutral with regard to jurisdictional claims in published maps and institutional affiliations. |
© 2021 by the authors. Licensee MDPI, Basel, Switzerland. This article is an open access article distributed under the terms and conditions of the Creative Commons Attribution (CC BY) license (http://creativecommons.org/licenses/by/4.0/).
Share and Cite
Hałdys, K.; Goldeman, W.; Anger-Góra, N.; Rossowska, J.; Latajka, R. Monosubstituted Acetophenone Thiosemicarbazones as Potent Inhibitors of Tyrosinase: Synthesis, Inhibitory Studies, and Molecular Docking. Pharmaceuticals 2021, 14, 74. https://doi.org/10.3390/ph14010074
Hałdys K, Goldeman W, Anger-Góra N, Rossowska J, Latajka R. Monosubstituted Acetophenone Thiosemicarbazones as Potent Inhibitors of Tyrosinase: Synthesis, Inhibitory Studies, and Molecular Docking. Pharmaceuticals. 2021; 14(1):74. https://doi.org/10.3390/ph14010074
Chicago/Turabian StyleHałdys, Katarzyna, Waldemar Goldeman, Natalia Anger-Góra, Joanna Rossowska, and Rafał Latajka. 2021. "Monosubstituted Acetophenone Thiosemicarbazones as Potent Inhibitors of Tyrosinase: Synthesis, Inhibitory Studies, and Molecular Docking" Pharmaceuticals 14, no. 1: 74. https://doi.org/10.3390/ph14010074
APA StyleHałdys, K., Goldeman, W., Anger-Góra, N., Rossowska, J., & Latajka, R. (2021). Monosubstituted Acetophenone Thiosemicarbazones as Potent Inhibitors of Tyrosinase: Synthesis, Inhibitory Studies, and Molecular Docking. Pharmaceuticals, 14(1), 74. https://doi.org/10.3390/ph14010074