The Graphical Cadastre Problem in Turkey: The Case of Trabzon Province

Abstract
:1. Introduction
- Reconstituting the cadastre bases produced so far by applying required transformation and adaptation steps to the national coordinate system in digital format.
- Producing new cadastral maps in the national coordinate system with required accuracies.
- Setting up a suitable geodetic network to produce these bases.
2. The Turkish Cadastre Process
2.1 The Legal Process
2.2 Technical Process
2.2.1. Written Cadastre Period
2.2.2 Linear Cadastre Period
- a)
- Graphical Method: In Turkey, this was the first type of cadastral work; parcel corner coordinates were surveyed with chain surveys based on the polygons which exist on the ground but having no coordinate values (Figure 1). Thus, the parcel surveying values derived from this method generally have no control procedures and the bases produced by graphical method do not have sufficient quality for today's requirements. In other words, most of these bases have ground-sheet inconsistencies. The bases produced by graphical method constitute 20% of the whole cadastral bases in Turkey.
- b)
- Classical Methods: These are generally orthogonal and tachometric methods. Those works carried out before 1968 were based on polygons, later they were based on localized land surveying triangulations. While, the orthogonal method was used in urban areas under Law No. 2613, the tachometric method was used in rural areas under Law No. 766. After 1974, based on national land surveying triangulation network these surveys became widespread. The obligation to produce cadastral bases in national coordinate system was put into practice after 1993.
- c)
- Photogrammetric Method: After 1950, this method was frequently used in order to accelerate cadastral work. The photogrammetric method was used in the areas where land cover and topography is suitable. Therefore, intensive land titling work was carried out in the interior parts of the country. As a result, generally 1/5,000 scaled cadastral maps were produced. These bases have lost their validity especially in the areas transformed from rural to urban use because of the low accuracy of the positions.
- d)
- Electronic Tachometry Method: Because of its speed and sensitivity, this method was used in cadastre as a ground surveying method after 1985. After the integration with computer technology, electronic tachometry has become very effective tool in cadastral works especially in the rough, plant covered and urban areas where using photogrammetric techniques are inappropriate. Digital cadastral works using this technique still are being used [6].
2.3. Institutional process
2.4. Realization Ratio of Turkish Cadastral Works
2.5 The Turkish Cadastre Problems
3. The method for graphical cadastre measurement
- There was no land surveying triangulation in the country.
- Closed control points were created. Closing errors in these polygons were distributed to the points in the whole graphics.
- Detailed measurements were carried out with a tachymeter. The angles on the other hand were formed as a complete series.
- The villages were done with the prismatic method.
- Drawing both polygon points and detail points were realized with the polar method.
- Since some bases used were aluminum, some on good quality of cardboard, and some others on bad quality of cardboard, the overall accuracy of these graphic sheets are extremely low.
- It is no longer possible to find in the field most of the control points of the maps.
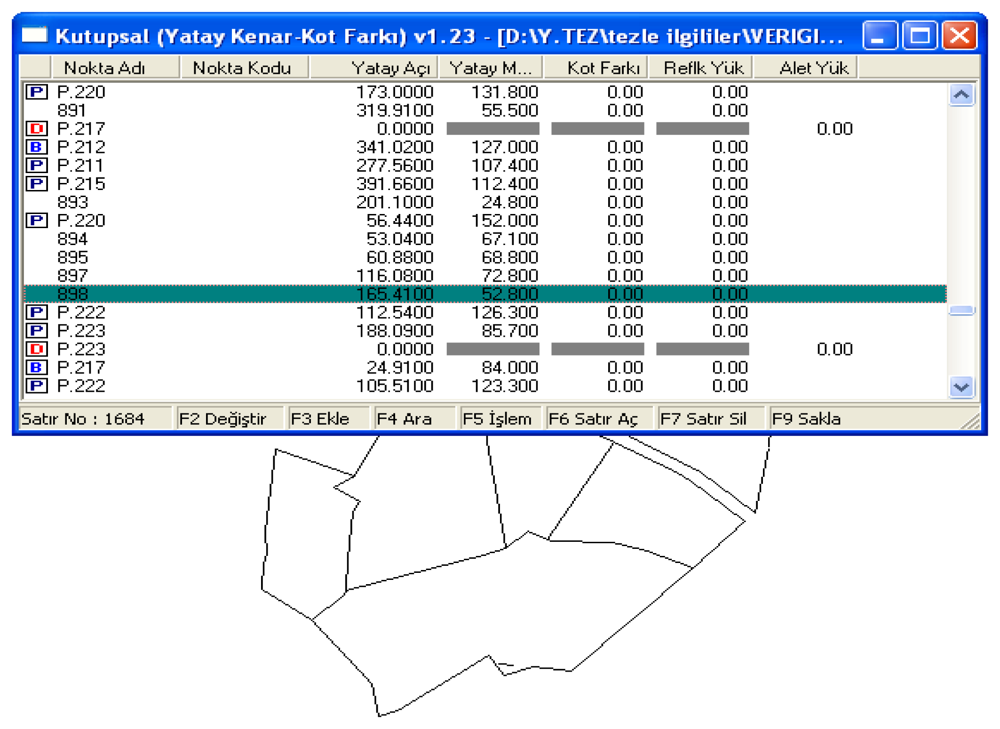
3.1. Digitizing the graphical cadastre bases
3.2. Problems in digitizing graphical cadastre sheets
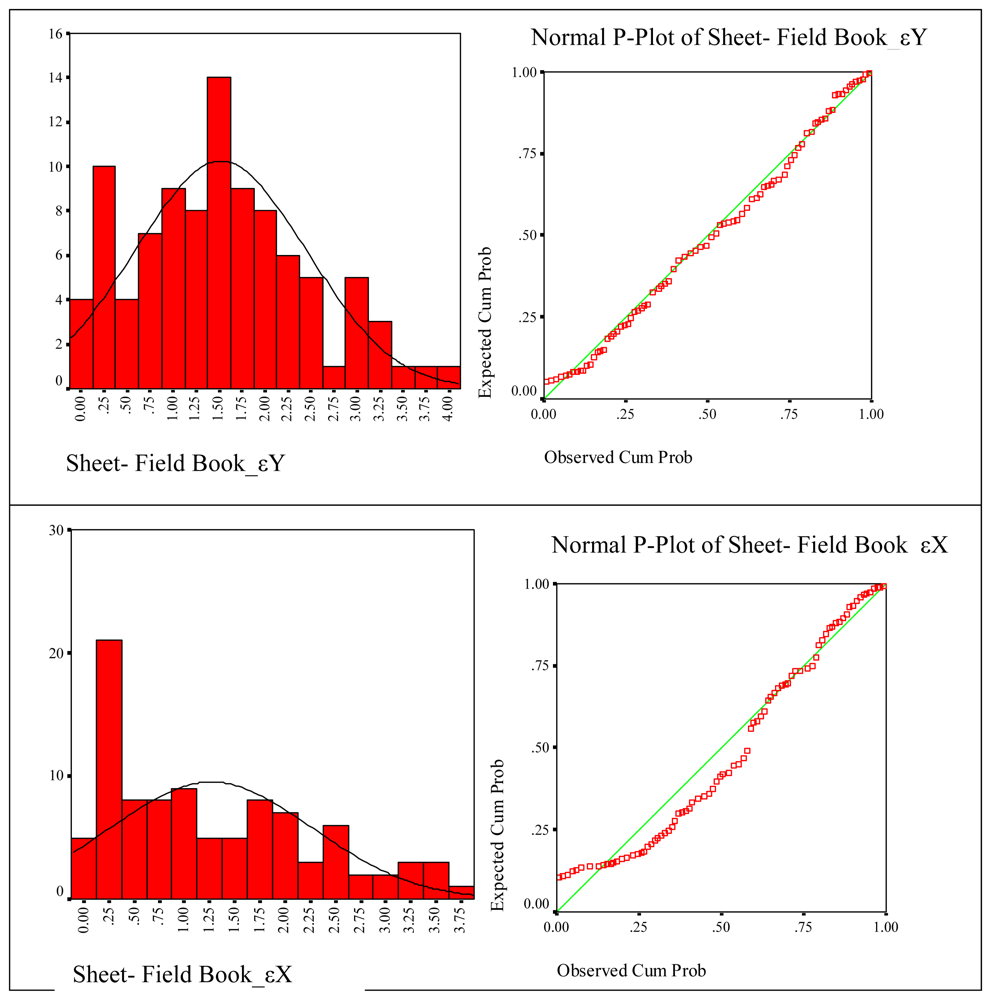
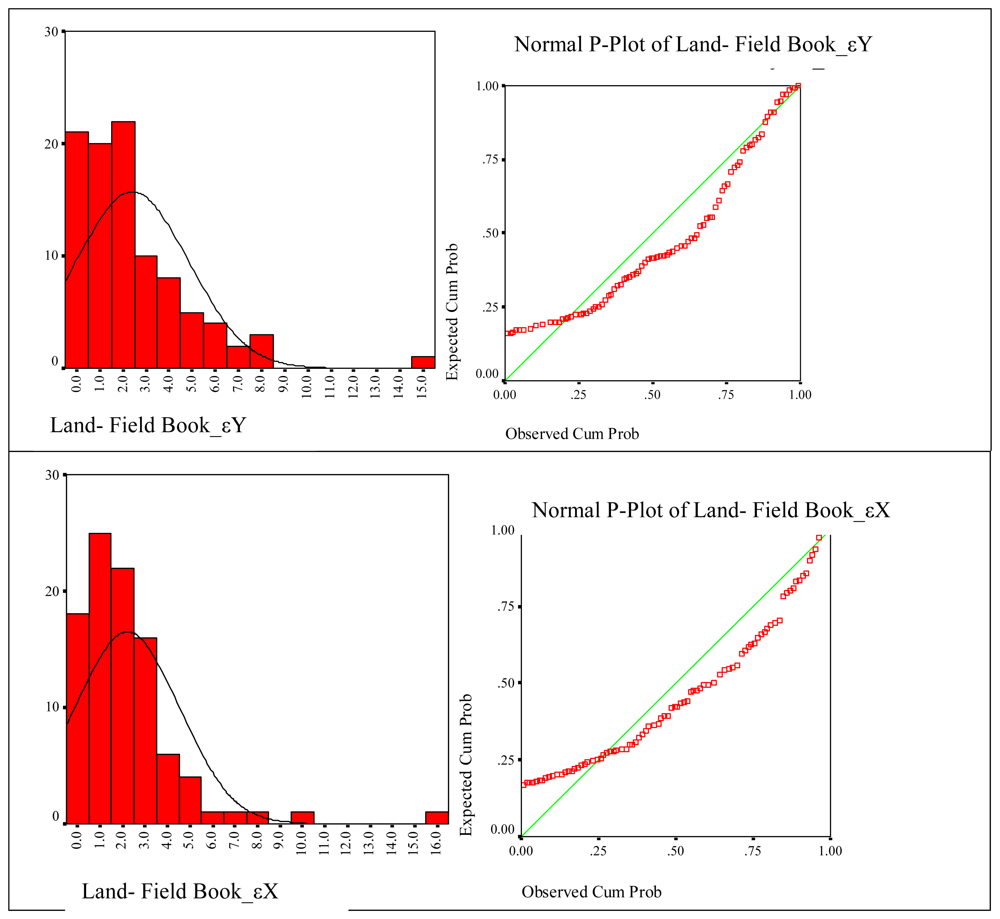
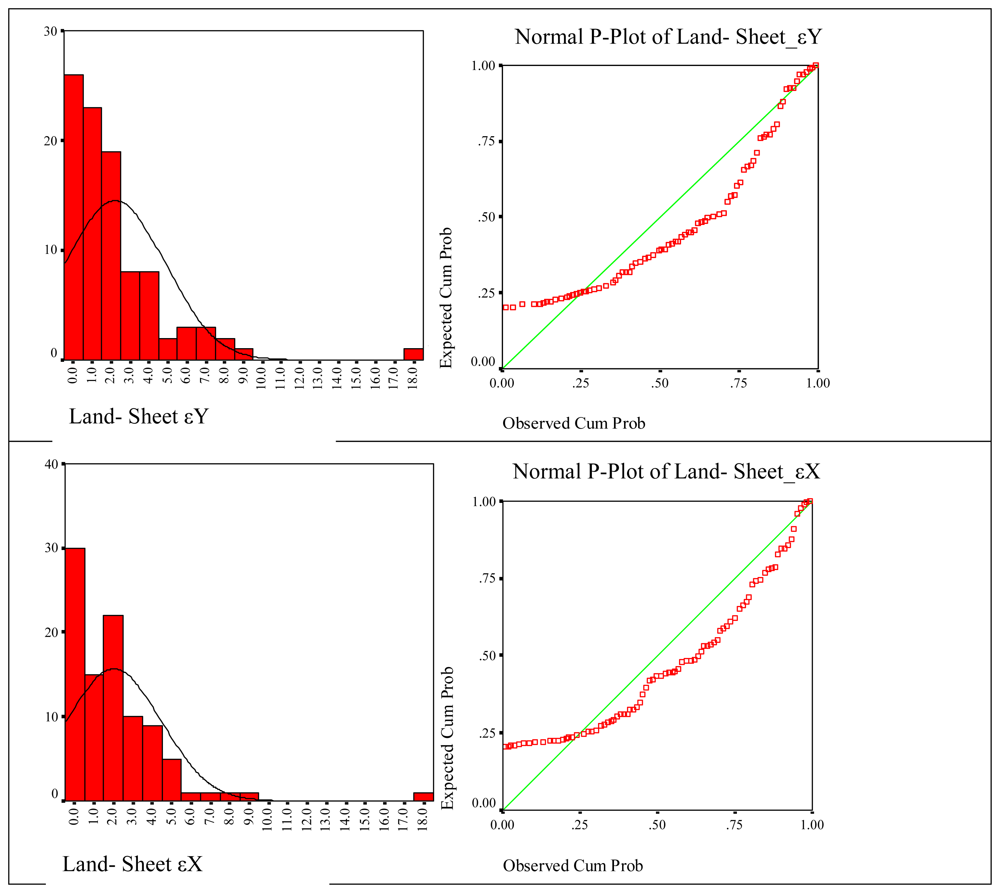
3.3. Verification analysis of produced digital cadastre data
- ya, xa: the coordinates obtained from the land by actual measurements,
- yo, xo: the coordinates obtained by digitizing the field books,
- xp, yp: the coordinates obtained from sheets by digitization,
- εx, εy errors are calculated as in the formula(1,2,3) below with the assumption that for a parcel's corner point, the digitized coordinates of the point are in the same direction and with the approach that there are real values of coordinates whose land coordinates are digitized;
- ✓
- if Ti〈tf,1α, the variation in parcel s corner points is harmonious,
- ✓
- if Ti〉tf,1α , the variation in parcel s corner points is not harmonious.
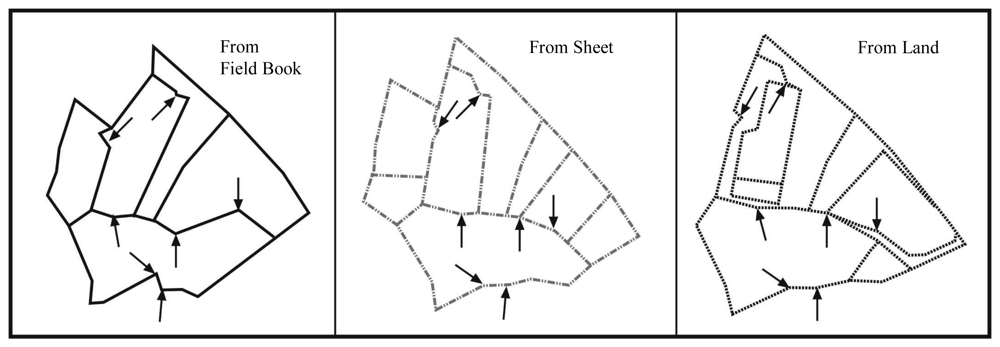
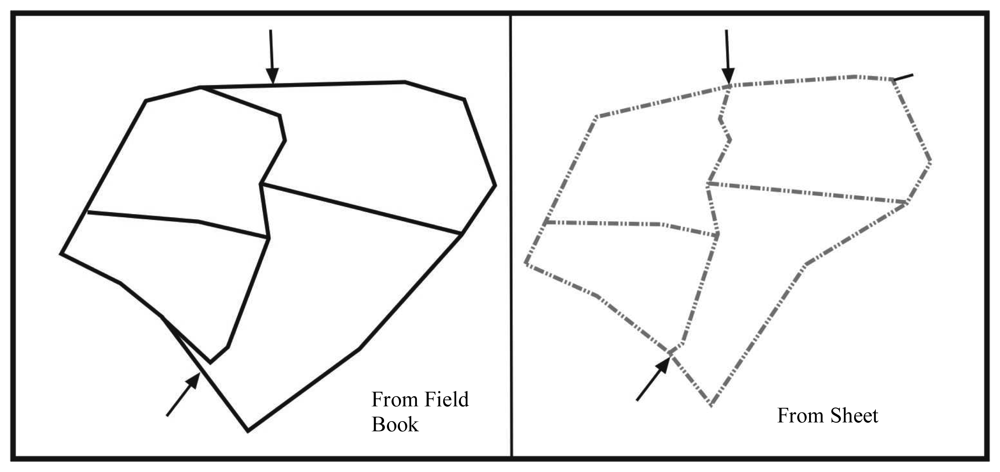
3.4. The comparison of land values of produced digital cadastre bases
4. Conclusions
- Because of the primitive techniques used and the wear, shrinking, and defacement problems of the sheets, together with location and drafting errors, edge-matching problems, shifts, and overriding were determined. The errors calculated according to sheet-field book were naturally smaller than the others. The largest number of coherent points were produced from sheet-field books as a result of statistical test results. But, it was seen that the rate of coherent points to the total data is only 10%, which suggests that graphical cadastre data at the beginning were still produced inaccurately.
- A significant part of graphical cadastre bases covers urban development regions. In these regions where the value of land is extremely high, parcels are sold according to the areas shown in the title deeds. At this point it was determined that 65% of the parcel areas in the application areas are erroneous. In these regions, stopping parcel sales until the cadastre bases can be produced with the required point accuracy could prevent possible socioeconomic problems.
- The average quadratic error of a point was determined to be m0=+/- 4.70m in created digital cadastre bases when land and field book data are taken into account. Therefore it is extremely important that use of those cadastre bases technically not right and should be banned legally, and correct and up to date cadastre bases should be created by carrying out cadastre works in these regions again. Considering that graphical cadastre bases cover 20% of Turkey's cadastre, this reveals the necessity of conducting cadastre projects in a large part of the country. This further suggests that a second cadastre is no longer avoidable for our country.
Acknowledgments
References and Notes
- Cashin, M.S.; McGrath, G. Establishing a modern cadastral system within a transition country: Consequences for the Republic of Moldova. Land Use Policy 2006, 23, 629–642. [Google Scholar]
- Çete, M.; Yomralıoğlu, T. Cadastre: The Key Component in Urban Based Information Systems. In FIG Working Week in Athens; Greece, 2004. [Google Scholar]
- Çete, M.; Uzun, B. The Evolving Role of Private Sector in Turkish Cadastral System. In FIG Working Week in Cairo; Egypt, 2005. [Google Scholar]
- Çoruhlu, Y.E. Investigating The Solution Of The Graphical Cadastre Problems: Case Study In Trabzon. M.Sc. Thesis, Karadeniz Technical University, Trabzon, Turkey, 2007. [Google Scholar]
- Demir, O. Forming base cadastral maps for cadastral information system in orthogonally measured urban areas. Ph. D. Thesis, Karadeniz Technical University, Trabzon, Turkey, 2000. [Google Scholar]
- Demir, O.; Uzun, B.; Çete, M. Turkish Cadastral System. Survey Review 2008, 40, 54–66. [Google Scholar]
- Demir, O.; Çoruhlu, Y.E. Determining The Landownership On Cadastre Works In Turkey. In Modern Technologies, Education and Professional Practice in Geodesy and Related Fields; Sofia, Bulgaria, November 9-10 2006. [Google Scholar]
- Demir, O.; Çoruhlu, Y.E. Investigation Of The Possibilities For Transformation Of The Graphical Cadastre Map Into The Digital Format In Turkey. In Modern Technologies, Education and Professional Practice in Geodesy and Related Fields; Sofia, Bulgaria, November 9-10 2006. [Google Scholar]
- Demir, O.; Coruhlu, Y.E. Determining the property ownership on cadastral works in Turkey. Land Use Policy. [CrossRef]
- Doytsher, Y.; Gelbman, E. Rubber-Sheeting Algorithm For Cadastral Maps. Journal of Surveying Engineering 1995, 155–162. [Google Scholar]
- Doytsher, Y. A Rubber-Sheeting Algorithm For Non-rectangular Maps. Computers & Geosciences 2000, 26, 1001–1010. [Google Scholar]
- Effenberg, W.; Williamson, I.P. Dıgıtal Cadastral Databases: The Australıan Experıence. In Division of information Technology, Proceedings of AGI 97 Conference; Birmingham, UK, 1997. [Google Scholar]
- Fradkin, K.; Doytsher, Y. Establishing an urban digital cadastre: analytical reconstruction of parcel boundaries. Computers, Environment and Urban Systems 2002, 26, 447–463. [Google Scholar]
- İnam, Ş. Türkiye' de Farklı Zaman ve Sistemlerde Üretilmi scedil; Kadastro Paftalarının Zemine Uygulama İncelikleri Üzerine Bir Ara scedil;tırma :Eski(Klasik) ve Grafik Kadastro Paftaları. HKMO Jeodezi, Jeoinformasyon ve Arazi Yönetimi 2005, 92, 21–28. [Google Scholar]
- http://www.tkgm.gov.tr


| No | Production Method | Number | % |
|---|---|---|---|
| 1 | Graphic | 110710 | 0,20 |
| 2 | Polar | 127118 | 0,24 |
| 3 | Orthogonal | 61271 | 0,11 |
| 4 | Photogrammetric | 87254 | 0,16 |
| 5 | Digital | 154008 | 0,29 |
| Total: 5 different map production methods | 540361 | 100.00 | |
| Period of cadastre works | Number Parcels Produced |
|---|---|
| 1925-1984 | 22458928 |
| 1985-1989 | 3100502 |
| 1990-1994 | 3473851 |
| 1995-2000 | 3288483 |
| 2001-2004 | 2850622 |
| 2004-2007 | 5564125 |
| Total Number Parcels Produced | 40736511 |
| Parcel Corner Number of points | Location sensitivity | [εxεx] | mx(m) | ⌊εyεy⌋ | my(m) | mp(m) |
|---|---|---|---|---|---|---|
| 395 | Field book measure-sheet | 1262.79 | 1.788 | 1038.85 | 1.622 | 2.415 |
| 395 | Land-Field book measure | 4655.26 | 3.433 | 4064.55 | 3.209 | 4.700 |
| 395 | Land-Sheet | 4696.03 | 3.448 | 3974.32 | 3.172 | 4.685 |
| Type of parcel area | Error limits | |||||
|---|---|---|---|---|---|---|
| In the | Out of | Total | ||||
| P.S. | % | P.S. | % | P.S. | % | |
| Land –Title deed | 24 | 36 | 43 | 64 | 67 | 100 |
| Land - Sheet | 18 | 27 | 49 | 73 | 67 | 100 |
| Land - Field book | 11 | 14 | 56 | 85 | 67 | 100 |
| Statistical Values | % | Sheet –Field Book (m) | Land – Field Book(m) | Land – Sheet (m) | |||
|---|---|---|---|---|---|---|---|
| Differences of Coordinates | εy | εx | εy | εx | εy | εx | |
| Number of Sample | 395 | 395 | 395 | 395 | 395 | 395 | |
| Mean | 1.5171 | 1.2666 | 2.4089 | 2.2085 | 2.2145 | 2.0142 | |
| Standard Deviation of the mean | 0.09526 | .1026 | .2485 | .2365 | .2688 | .2493 | |
| Median | 1.4700 | 1.0500 | 1.8950 | 1.7550 | 1.4850 | 1.6100 | |
| Standard Deviation | 0.9334 | 1.0054 | 2.4352 | 2.3174 | 2.6338 | 2.4427 | |
| Variance | 0.8711 | 1.0109 | 5.9300 | 5.3706 | 6.9369 | 5.9668 | |
| Minimum | 0.01 | 0.01 | 0.00 | 0.00 | 0.01 | 0.00 | |
| Maximum | 3.98 | 3.75 | 15.00 | 16.17 | 18.00 | 17.96 | |
| Percenteges | 10 | 0.2170 | 0.1700 | 0.2070 | 0.2350 | 0.1200 | 0.1270 |
| 20 | 0.6880 | 0.2700 | 0.4440 | 0.5280 | 0.2920 | 0.2140 | |
| 30 | 0.9720 | 0.4830 | 0.7250 | 0.8510 | 0.5340 | 0.4200 | |
| 40 | 1.2700 | 0.7760 | 1.4140 | 1.2680 | 0.9780 | 0.8180 | |
| 50 | 1.4700 | 1.0500 | 1.8950 | 1.7550 | 1.4850 | 1.6100 | |
| 60 | 1.6700 | 1.4620 | 2.1420 | 2.1800 | 1.8880 | 1.9040 | |
| 70 | 1.9170 | 1.7790 | 2.7390 | 2.5400 | 2.3070 | 2.4910 | |
| 80 | 2.3400 | 2.1960 | 4.1680 | 3.3320 | 3.6080 | 3.3900 | |
| 90 | 2.9030 | 2.8020 | 5.6650 | 4.5050 | 5.9520 | 4.5030 | |
| Statistical Values | Sheet-Field Book | Land-Field Book | Land-Sheet | ||||
|---|---|---|---|---|---|---|---|
| εy | εx | εy | εx | εy | εx | ||
| Number of Samples | 395 | 395 | 395 | 395 | 395 | 395 | |
| Normal Parametres | Mean | 1.5171 | 1.2666 | 2.4089 | 2.2085 | 2.2145 | 2.0142 |
| Stan. Dev. | .9334 | 1.0054 | 2.4352 | 2.3174 | 2.6338 | 2.4427 | |
| Ekstreem Differences | Final Value | 0.058 | 0.113 | 0.162 | 0.170 | 0.201 | 0.205 |
| Pozitive | 0.058 | 0.113 | 0.162 | 0.151 | 0.194 | 0.148 | |
| Negative | -0.053 | -0.106 | -0.161 | -0.170 | -0.201 | -0.205 | |
| Kolmogorov Smirnov Z | 0.571 | 1.103 | 1.588 | 1.669 | 1.972 | 2.007 | |
| Asymp.Sig. (2-tailed) | 0.900 | 0.175 | 0.013 | 0.008 | 0.001 | 0.001 | |
© 2008 by the authors; licensee Molecular Diversity Preservation International, Basel, Switzerland. This article is an open-access article distributed under the terms and conditions of the Creative Commons Attribution license (http://creativecommons.org/licenses/by/3.0/).
Share and Cite
Demir, O.; Çoruhlu, Y.E. The Graphical Cadastre Problem in Turkey: The Case of Trabzon Province. Sensors 2008, 8, 5560-5575. https://doi.org/10.3390/s8095560
Demir O, Çoruhlu YE. The Graphical Cadastre Problem in Turkey: The Case of Trabzon Province. Sensors. 2008; 8(9):5560-5575. https://doi.org/10.3390/s8095560
Chicago/Turabian StyleDemir, Osman, and Yakup Emre Çoruhlu. 2008. "The Graphical Cadastre Problem in Turkey: The Case of Trabzon Province" Sensors 8, no. 9: 5560-5575. https://doi.org/10.3390/s8095560
APA StyleDemir, O., & Çoruhlu, Y. E. (2008). The Graphical Cadastre Problem in Turkey: The Case of Trabzon Province. Sensors, 8(9), 5560-5575. https://doi.org/10.3390/s8095560