Article

An Approach for Measuring the Sorptive Behavior of Odorants Using a Multifunction Thermal Desorber Unit: Preliminary Tests on Reduced Sulfur Compounds

1
Atmospheric Environment Laboratory, Department of Earth & Environmental Sciences, Sejong University, Seoul, 143-747 Korea; Siheung Environmental Technology Development Center, Siheung, 429-793 Korea
2
Sam Sung Electronics, Young Tong Goo, Suwon, 443-742 Korea
3
Department of Chemistry, Soongsil University, Seoul 156-743, Korea
*
Author to whom correspondence should be addressed.
Sensors 2008, 8(3), 1858-1871; https://doi.org/10.3390/s8031858
Submission received: 2 January 2008 / Accepted: 14 March 2008 / Published: 7 March 2008

Abstract

:
In this study, the sorptive behavior of reduced sulfur compounds (RSC) was investigated using a combination of thermal desorber (TD) unit and gas chromatography (GC). To examine the sorptive properties of RSC on textile materials, two types of experiments were conducted under experimental conditions favorable for sorptive processes. In all the experiments, gaseous standards of hydrogen sulfide, methanethiol, dimethyl sulfide, and dimethyl disulfide were supplied to initiate the adsorption processes on textile pieces. The textile pieces were then forced to release those adsorbed RSC under a fixed condition. It was found that the extent of adsorption, if evaluated quantitatively, occurred at approximately 1/1000 to 1/100 of the level of RSC standards supplied originally to induce adsorption. It also indicated that RSC adsorption was affected very sensitively by the initial exposure durations to induce RSC adsorption with an exponential decrease in relative recovery (RR) values with increasing exposure time. The relative sorptive patterns, when compared between different RSCs, were affected most sensitively by such factors as molecular weight and/or physical contact conditions.

1. Introduction

In everyday life we encounter a broad range of odorous compounds [1,2]. Considering the severity of odorous pollution and the problems associated with it, there has been an increasing amount of research directed toward several fields of analytical chemistry including chemical/electronical sensing and the molecular biology of olfaction [3-5]. However, there are a great number of cases in which olfactory detection cannot be applied without restriction such as the differences in odor detection thresholds between single chemicals and mixtures [6].
If odorous compounds are released into the atmosphere, their detection and recognition by the human sensory system can occur in different ways. Some odors are transient, while others such as tobacco and barbecue smoke [7] persist until the application of a deodorizing treatment or process. Those who are exposed to such stimulating odors can act either directly or indirectly as the secondary sources. They are apt to release odors in other areas, as they move around. This phenomenon may be described as the transfer of sources to propagate odors and related problems. As clothing can be a good media for transferring odor problems, the sorptive process between odors and clothing materials is an intriguing subject in odor research. If one attempts to measure the interaction of odorous compounds with textile pieces, there are a few additional issues to consider. Large quantities of odorous compounds such as reduced sulfur compounds (RSC) are needed to induce their adsorption on the textile pieces. When the adsorption is induced, the actual amount of RSC remaining on the textile pieces (as the consequence of adsorption process) is substantially reduced. For instance, if the initial RSC quantity for loading is maintained at ng quantities, a significantly reduced amount (e.g., 1/1000 to 1/100) is actually adsorbed [8]. However, many methods applicable to RSC detection (such as FPD and PFPD) cover a limited range of linearity [9]. Therefore, an analytical set-up is required for the assessment of RSC processes between adsorption and desorption.
Many attempts have been made over past decades to accurately assess the behavior of odorous compounds through acquisition of quantitative olfactory data sets [10-13]. However, relatively little is known about the physicochemical properties of odorous compounds in terms of their interactions with various environmental matrices (or surfaces). In this study, we investigated the fundamental factors regulating the sorptive quantities of odorous compounds on textile materials. Due to the lack of information concerning various processes between odors and materials, we attempted to evaluate various properties involved in the sorptive processes and odorizing potentials of the major odorous compounds. As there have been many studies to measure the transfer of odorous compounds with environmental surfaces and their memory effect with surface materials, information acquired by this preliminary study can ultimately be used to design and assess different methods for the control of odors.

2. Materials and Methods

2.1 The basics of the Experimental Design

In our laboratory, various detection techniques have been developed to account for the sorptive mechanism of odorous compounds using RSC as an example. As part of these efforts, a study on the odorous sorption mechanism has been investigated by quantitatively measuring the extent of RSC adsorbed on textile pieces. The actual amount of RSC adsorption can be assessed by the physical flushing (or desorbing) of adsorbed RSC, e.g., via an introduction of an odorant-free gas stream flow. The mixtures of standard RSC and flushing gas (ultrapure N2) can subsequently be transferred to an analytical set-up for such purposes (i.e., a combination of an air server (AS) unit to control the supply condition of gas to the analytical line and a thermal desorption (TD) unit to cryofocus and release analytes). Our experimental set-up proved suitable for evaluating the sorptive mechanism of odorous sulfur compounds under a number of controlled conditions.
In order to inspect the interactions between odorous compounds and textile pieces, we selected five RSCs (including hydrogen sulfide (H2S), methanethiol (CH3SH), dimethyl sulfide (DMS), carbon disulfide (CS2), and dimethyl disulfide (DMDS)) as the primary target for the study. As a starting point for establishing the experimental method, we initiated our experiment with towel pieces. Although our experiments were extended to some other textile materials, our discussion in the present study is mainly confined to towel pieces to focus on the basics of the methodology. To induce adsorption of RSCs on towel pieces, one needs to supply them at sufficiently high concentration levels. To this end, original standard gas was prepared at a 10 ppm concentration without dilution or modification. To initiate adsorption, this standard gas was applied to the towel pieces held in quartz tubing at a given flow rate for a set period of time. Considering that the actual amount sorbed on the towel pieces was reduced drastically at the adsorption stage, the use of this high concentration standard was realistic. However, we were not able to overcome the contamination problem of CS2 in the preconcentration unit (e.g., cold trap) during the early part of the present study. As high blank values of CS2 remained persistently (i.e., memory effect), the quantification was limited to four RSCs as shown in Table 1A. Our comparative analysis of all five RSCs is hence confined to experiments performed at later stage. It should also be noted that the full amount of RSC adsorbed by the towel pieces cannot be desorbed by a single flushing cycle. Therefore, it is imperative that the desorption procedure needs to be performed repetitively to assess the entire quantity of the RSC adsorbed onto towel pieces. In this study, the absolute quantity of each detachable RSC was approximated by adding the sum from the first two consecutive flushing runs. According to our preliminary tests, the extent of RSC desportion generally amounted to greater than 80 to 90 % in the two consecutive desorption cycles. The total quantity of RSC desorbed from textiles was approximated as the sum of the first two, rather than all five desorption experiments [8].

2.2 Details of Experiment Types I and II

In the course of this study, two parallel experimental schemes (types I and II) were set up and tested in the laboratory at room temperature. The experimental conditions for type I are described in detail in Table 1. Experiment type I was conducted to allow a comparison of RSC quantities released from towel pieces prepared under identical adsorption conditions and under varying flushing conditions to induce desorption. As shown in Table 1A, the adsorption of RSC for experiment type I was induced by exposing RSC standards at the same flow rate (100 mL min−1) and duration (10 min); those physical conditions were determined in advance to optimize RSC adsorption from an ancillary experiment. The operation conditions to induce desorption of adsorbed RSC are described in Table 1B. The quantity of RSC desorption (or retrieval) was measured by modulating the flushing flow conditions (e.g., control on the desorption flow rates, as shown in Table 1B). The desorption (or flushing) conditions were compared at two different flow rate values (5 and 40 mL min−1) at varying durations. The duration for the supply of the N2 gas stream was initially adjusted across 5, 10, 20, and 30 minutes (experiment type IA). Then, desorption was induced by varying the flow rates at four different stages of 5, 10, 20, and 40 mL min−1 (experiment type IB).
As shown in Table 2, experiment type II was conducted under variable conditions for adsorption, while that for desorption was based on the results of experiment type I. For this experiment, the adsorption conditions were initially modulated by varying the exposure conditions of RSC standards at a fixed flow rate. Textile (towel) samples of similar sizes were exposed under the identical flow rate of 100 mL min−1 and at one of nine different exposure durations to induce adsorption. These included 0.17, 0.5, 1, 2, 5, 10, 20, 30 and 40 mins (refer to Table 2). As such, it is reasonable to expect that the adsorption of RSC may have been induced incrementally with increases in exposure duration. Thus, if one computes the RSC quantity supplied or exposed in terms of H2S, the amount of gaseous H2S standard introduced into the quartz tubing system corresponds to as little as 238 ng (0.17 min) to a maximum of 56 μg (40 min) (Table 2). In experiment type II, the desorption of RSC was then induced under an identical flush condition for all textile samples. The results demonstrate the effects of the changes in the initial adsorption condition, especially with respect to the contact duration. The desorption condition for experiment type II was maintained under constant conditions (10 ml min−1 flushing flow rate at 20 min duration). In addition to the two aforementioned experiments, some ancillary experiments were also conducted to simultaneously compare relative recovery (RR) values between different RSCs or to check the influence of physical variables (e.g., flow rate) on relative recovery over an extended flow rate range.

2.3 Analytical set-up for RSC quantification

Our research group has been involved in the development of both sampling and analytical methods for RSC in ambient air with the aid of thermal desorption [14,15]. To precisely assess such changes occurring as the result of sorptive process of RSC, a quartz tube (1/4 inch OD and 12 cm length) packed with a cotton towel piece was employed as an analogue to a micro-scale chamber. As a medium to diagnose the sorptive process, the pieces of cotton towel were cut and prepared in similar sizes (0.5×3 cm2 size with an average weight of 0.05 to 0.06 g); these sizes were chosen, because they would fit the internal diameter of the quartz tube used for adsorption/desorption experiment. Due to large differences in RSC quantities between the adsorption and desorption stages, experiments were conducted to examine both processes separately in room temperature (20±1°C). To induce RSC adsorption on the towel pieces, highly concentrated RSC standard gases (10 ppm) were introduced to the towel pieces held in a quartz tube at a given flow rate for a given time in accordance with the experiment type. A commercial product of gaseous RSC standards containing equimolar concentrations of four RSC (10 ppm) was purchased in certified pressure cylinders (produced by ISO 6145 method: Ri gas, Korea).
Once the adsorption stage was finished, the tubes were separated from the standard supply line (built to facilitate the adsorption of RSC standard) and immediately connected to the air server unit of the TD system (Markes International, Ltd., UK). Then, as a routine round of GC/TD operation, the desorption stage was initiated automatically by introducing ultrapure N2 gas to the preconcentration system via quartz tubing. As this system is equipped and operated with the aid of a mass flow controller (MFC) system, the extent of desorption can be controlled by changing the N2 gas supply conditions (i.e., flow rate and duration).
In the present study, RSC was analyzed by combining two different instrumental set-ups. First, the TD unit (UNITY model, Markes International Ltd., UK) was necessary to preconcentrate the RSC by controlling the AS unit. This facilitates the control of the gas stream flow rate for desorption and the sample transfer throughout the cryofocusing and thermal desorption stage. Second, the gas chromatograph (GC: Model 6200, Donam Instrument, Korea) was equipped with a pulsed flame photometric detector (PFPD: Model 5380, O.I. Co.). The experimental set-up for this study followed our preliminary study to test the sorptive behavior of odors [8]. The analysis of actual samples to evaluate RSC behavior between adsorption and desorption process was conducted in the following sequence. The combined system of the AS/TD unit was operated to regulate the time (0.1 ∼ 999.9 min) and rate of the sample transport (5 ∼ 100 mL min−1) within the analytical line. In this way, RSC standards (or gas samples) can be introduced into the TD (via AS) and cryofocused at cold trap by the Peltier cooler (– 15 °C). The cold trap was built to consist of an equivolume amount of Carbopack B and silicagel adsorbents in a quartz tube (1.5 (ID) and 2 mm (OD) with 12 cm length). Upon cryofocusing, the target S compounds were released by heating the cold trap (300°C) and then transported to the GC column (BP-1: 60 m × 0.32 mm, 5 μm, SGE). The temperature (T) conditions for the GC system were set as follows: (1) T(initial)=100°C for 2 min; (2) T(ramping)=6°C min−1 rate; and (3) T(final)=210°C at 2 min. This system was set to run for 20 min to complete one analytical cycle. Additional conditions for our S gas detecting system can be described as follows:
  • Flow rate (mL min−1): Air(1) =Air(2)= 10; H2=11.5; Carrier gas: N2= 1.2 (at 20 psi)
  • Detector temperature of PFPD: 220°C; Flow path temp: 80 °C
  • Cold trap: -15 (low end) ∼ 300°C (high end) with holding time of 5 min.
  • Outlet split: 5.0 mL min−1 (5:1 split ratio)
This analytical system is good for various applications of RSC measurements (e.g., on-line analysis of RSC [16]). In this study, however, it was mainly used for analyzing RSC samples contained in the quartz tube to quantitatively describe the amount of RSC adsorbed to or desorbed from the towel pieces. The analytical characteristics of our instrumental setting have been described in a study we recently published [e.g., 14, 15]. They can be summarized as follows. The detectability of the GC/PFPD system can be expressed in terms of the absolute quantity of S. Although the detection limit (DL) values are slightly variable with time, they can mostly be found in the range of ∼10 (CH3SH, DMS, and DMDS) to 20 pg (H2S). As our analysis was generally made on a total volume of 400 mL, the corresponding detection limits (DLs) for the above four S compounds correspond to a range of 10 to 20 ppt. If the precision of this system is expressed in terms of relative standard error (RSE) values from 7 replicate analysis, their precisions are also computed as 4.8, 3.0, 3.7, and 3.8 %, respectively.

3. Results and discussion

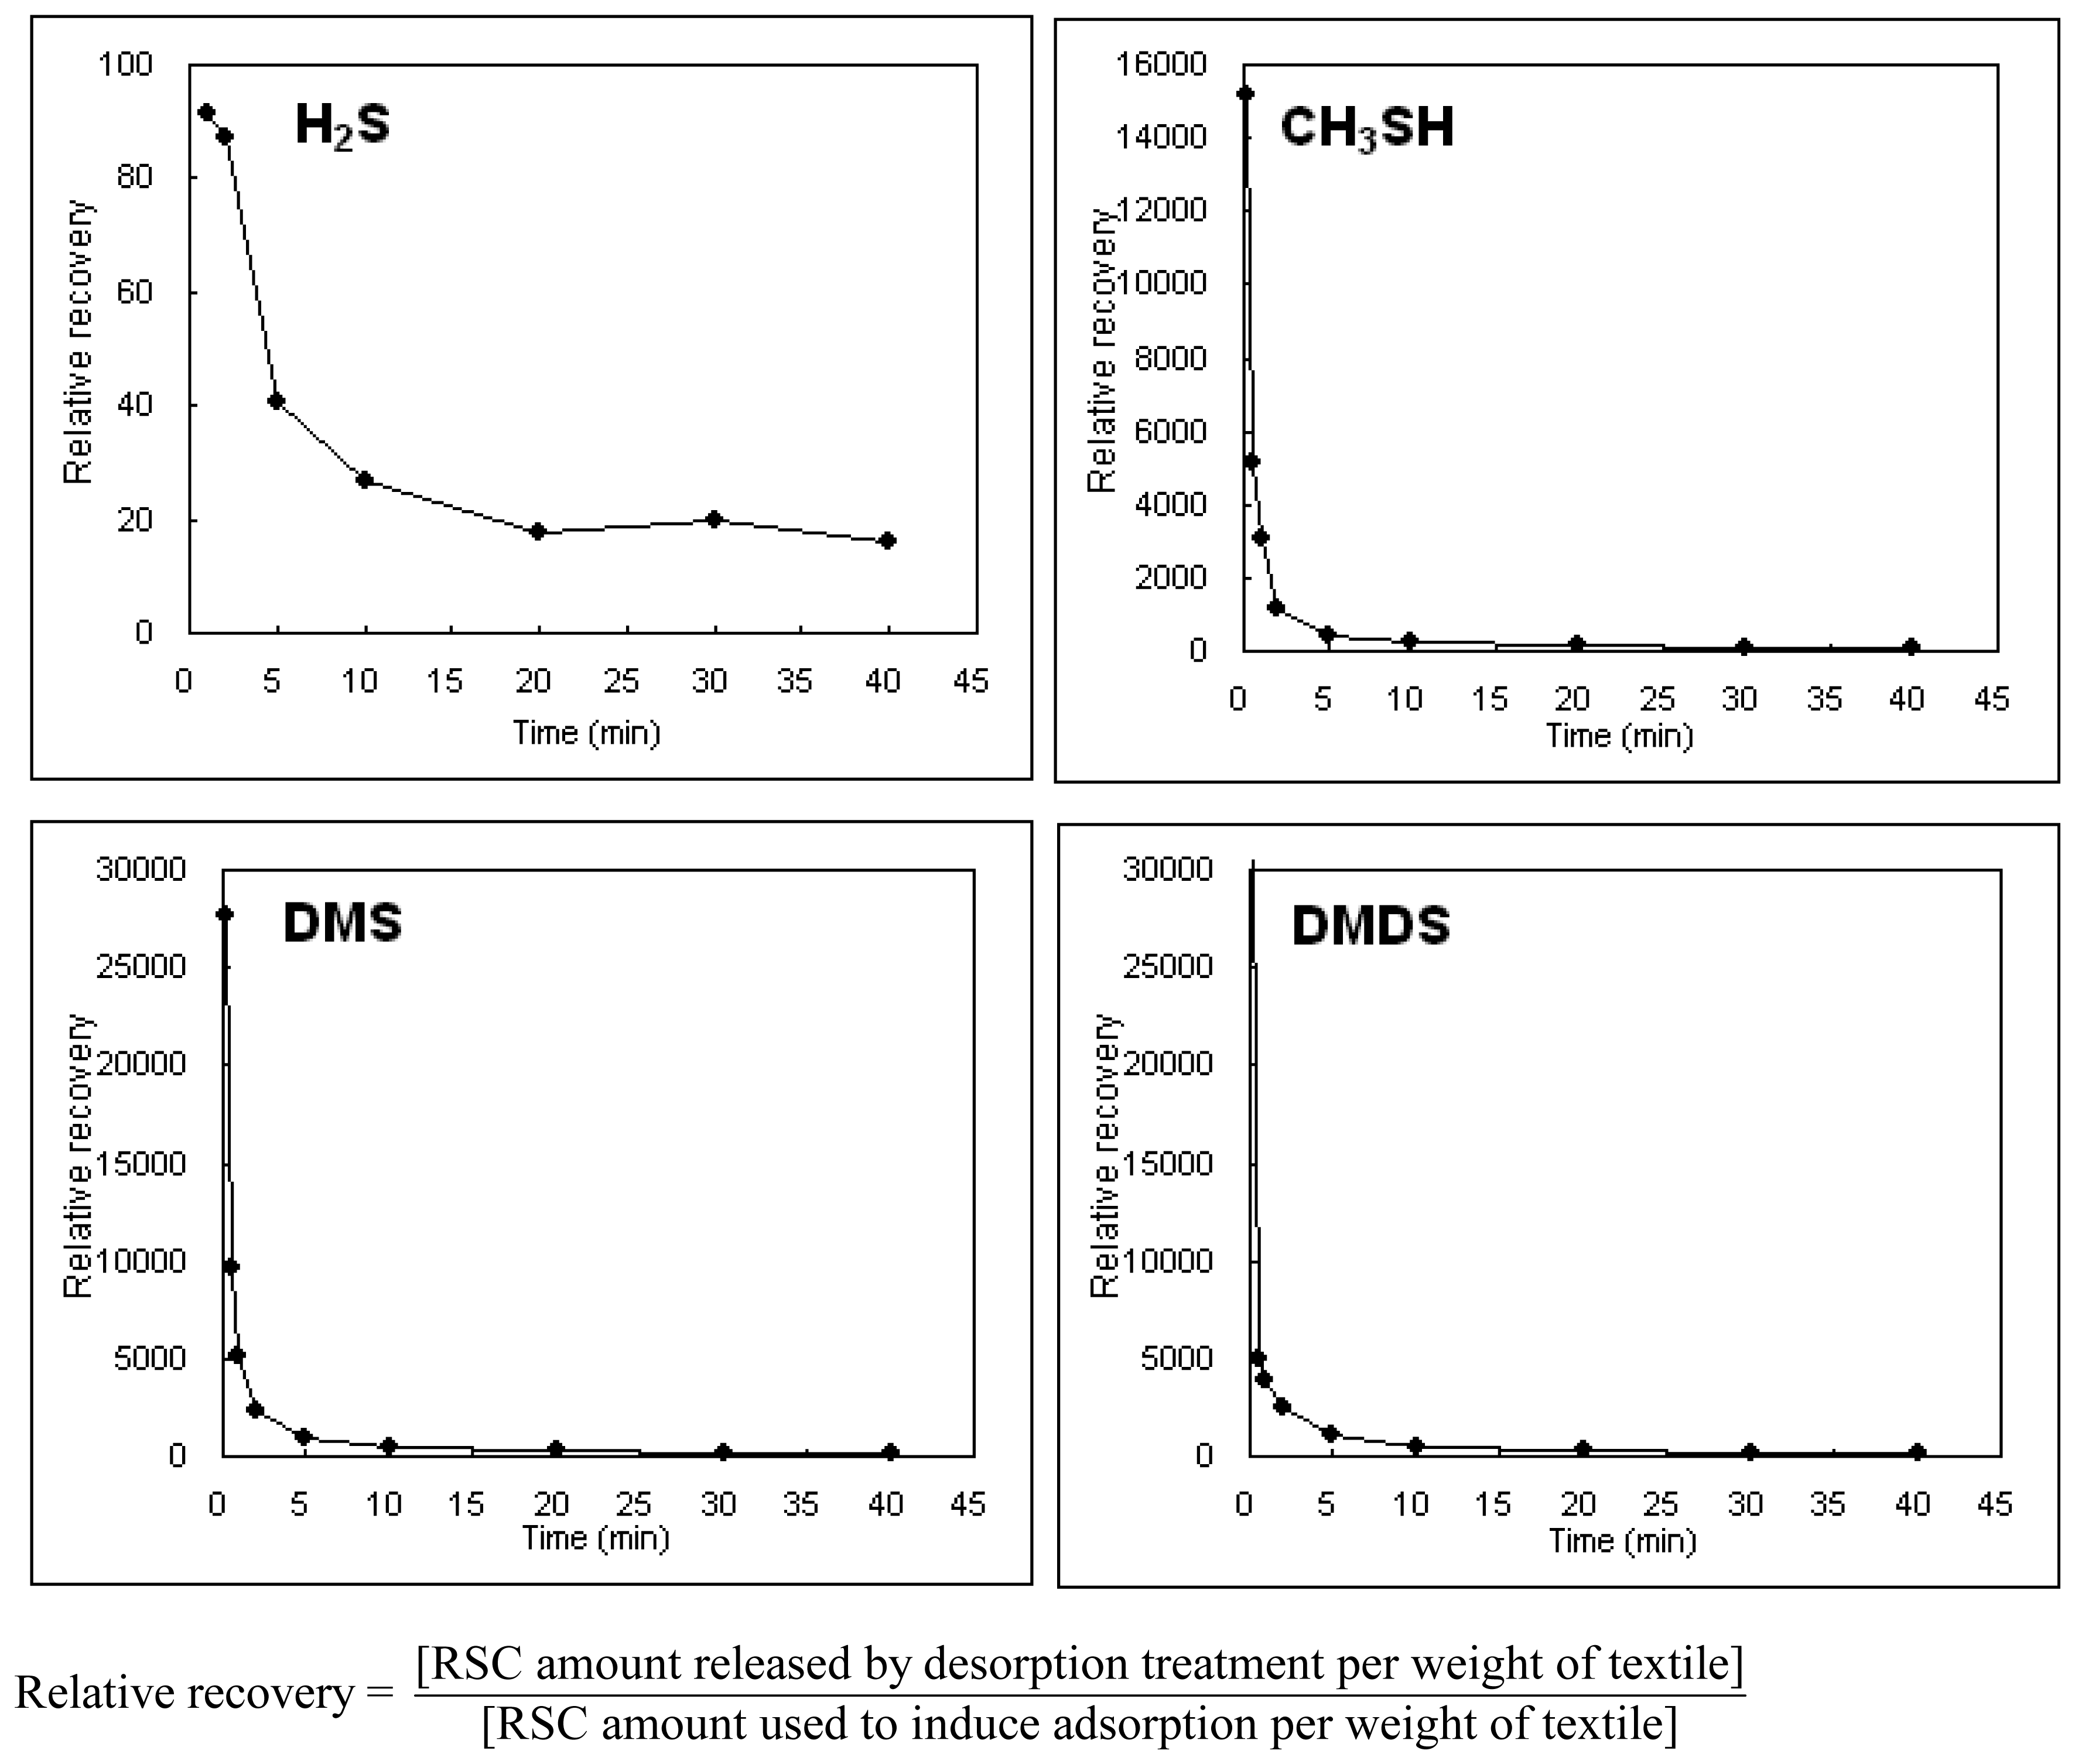
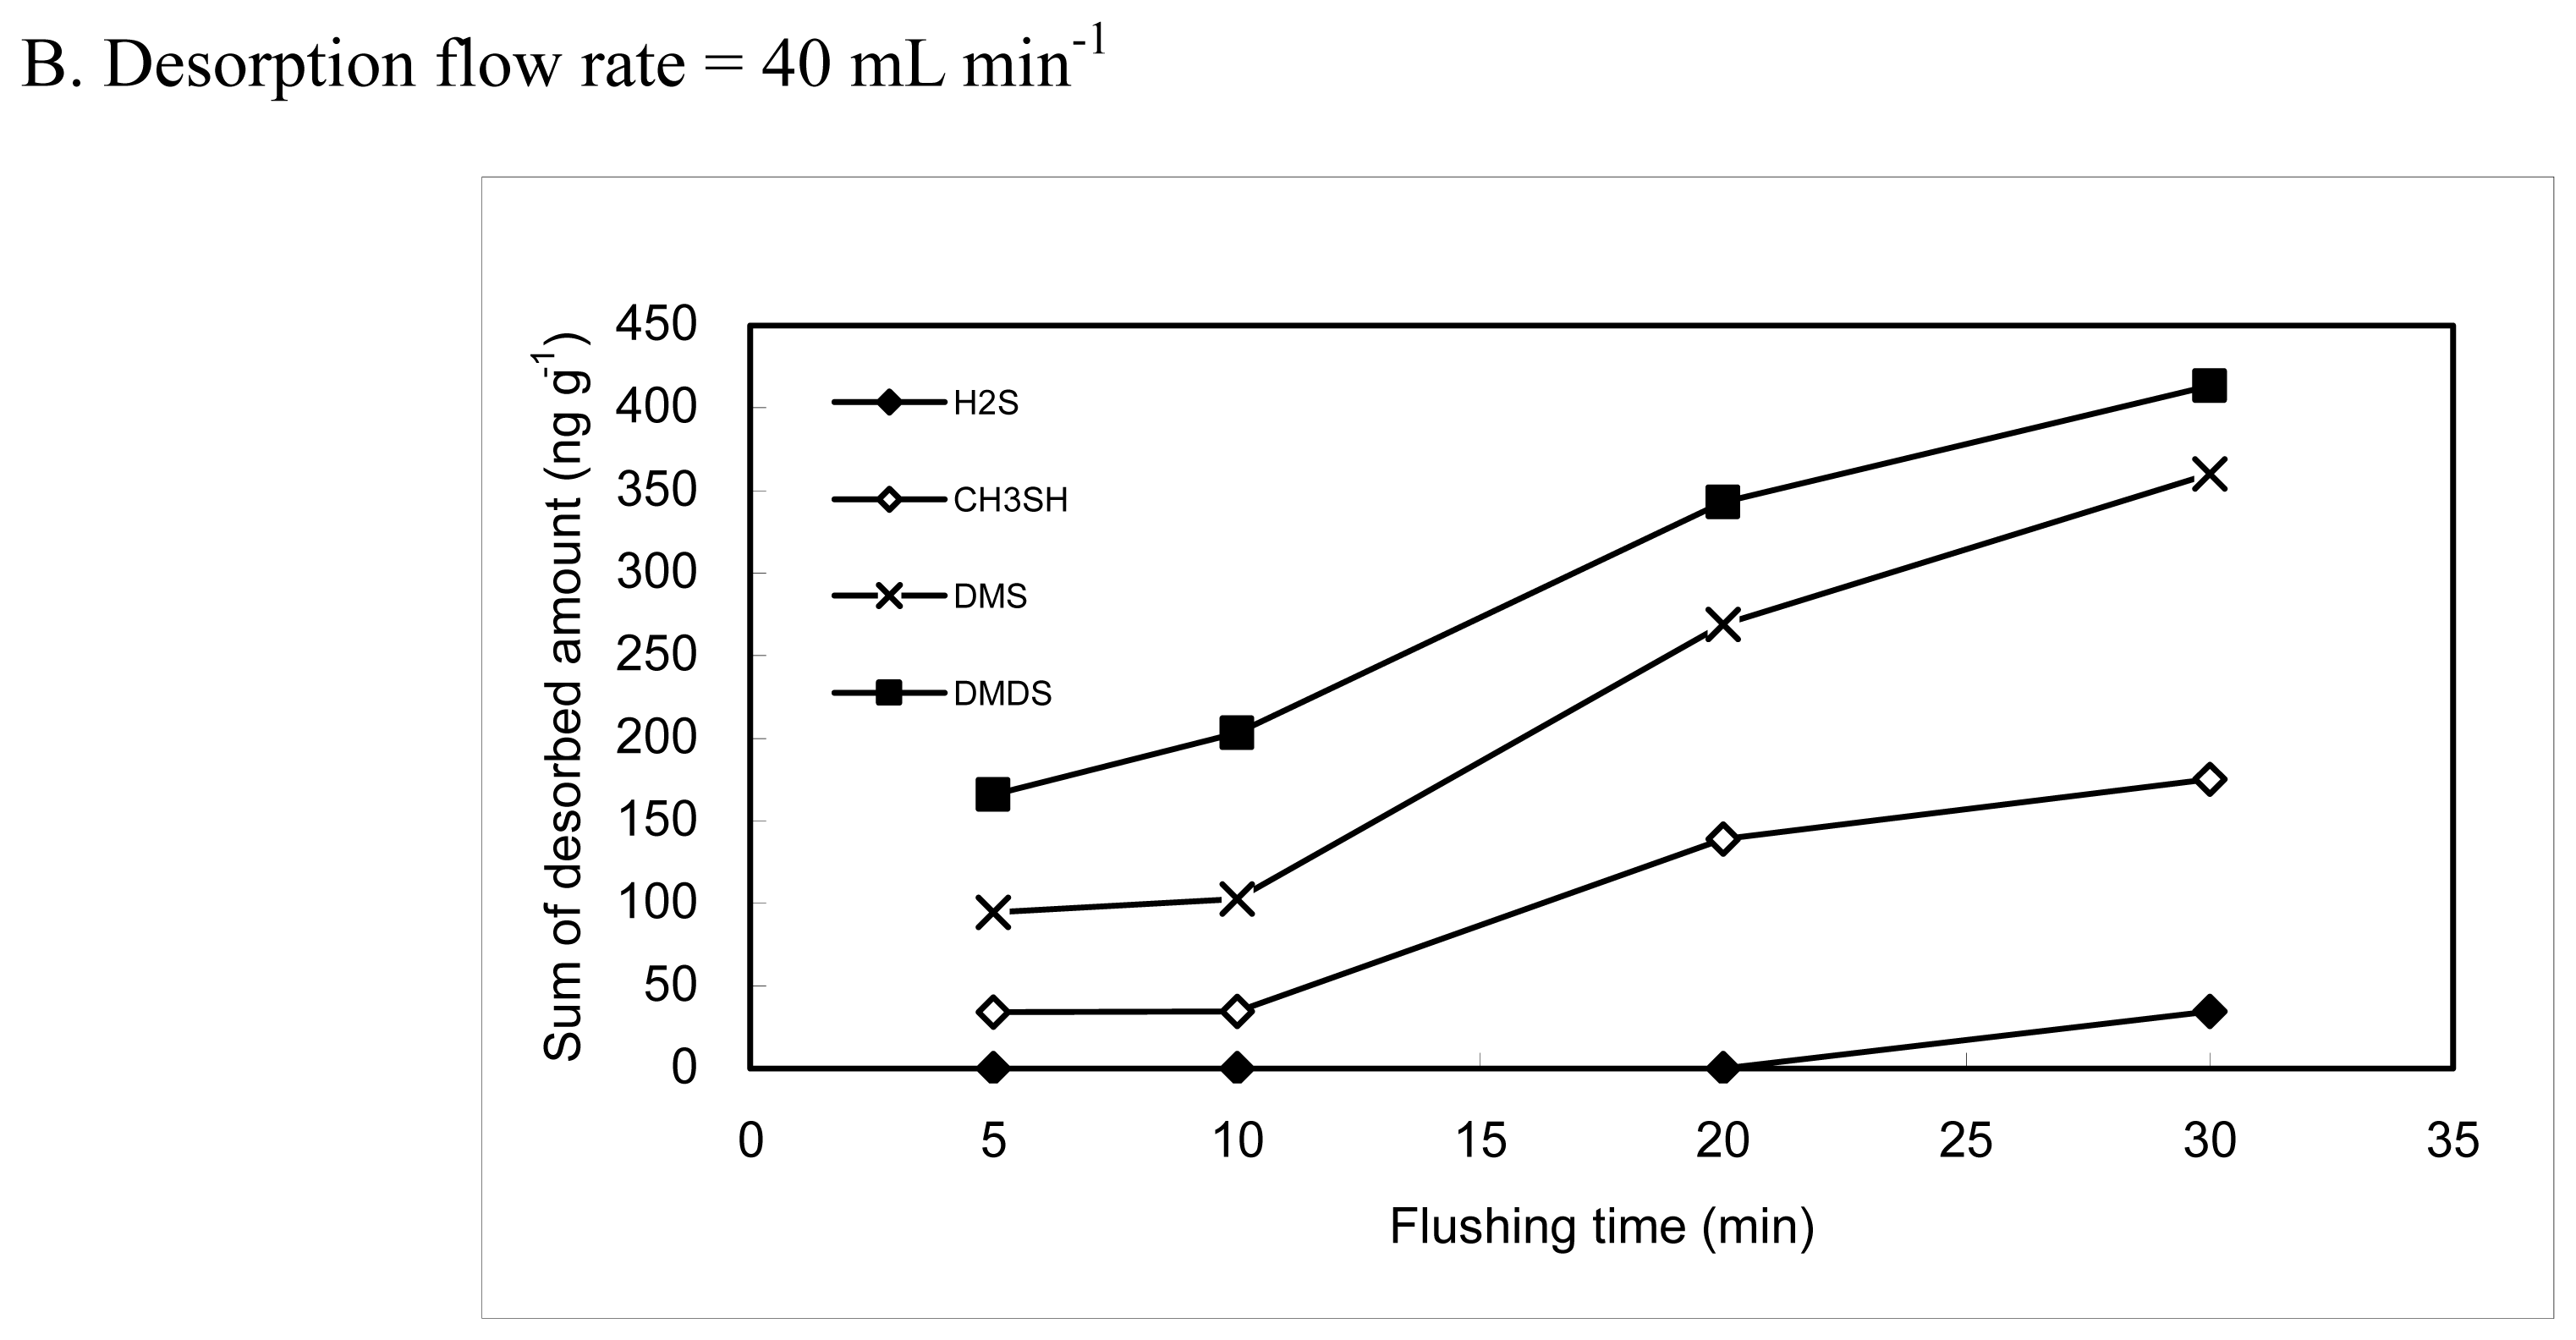
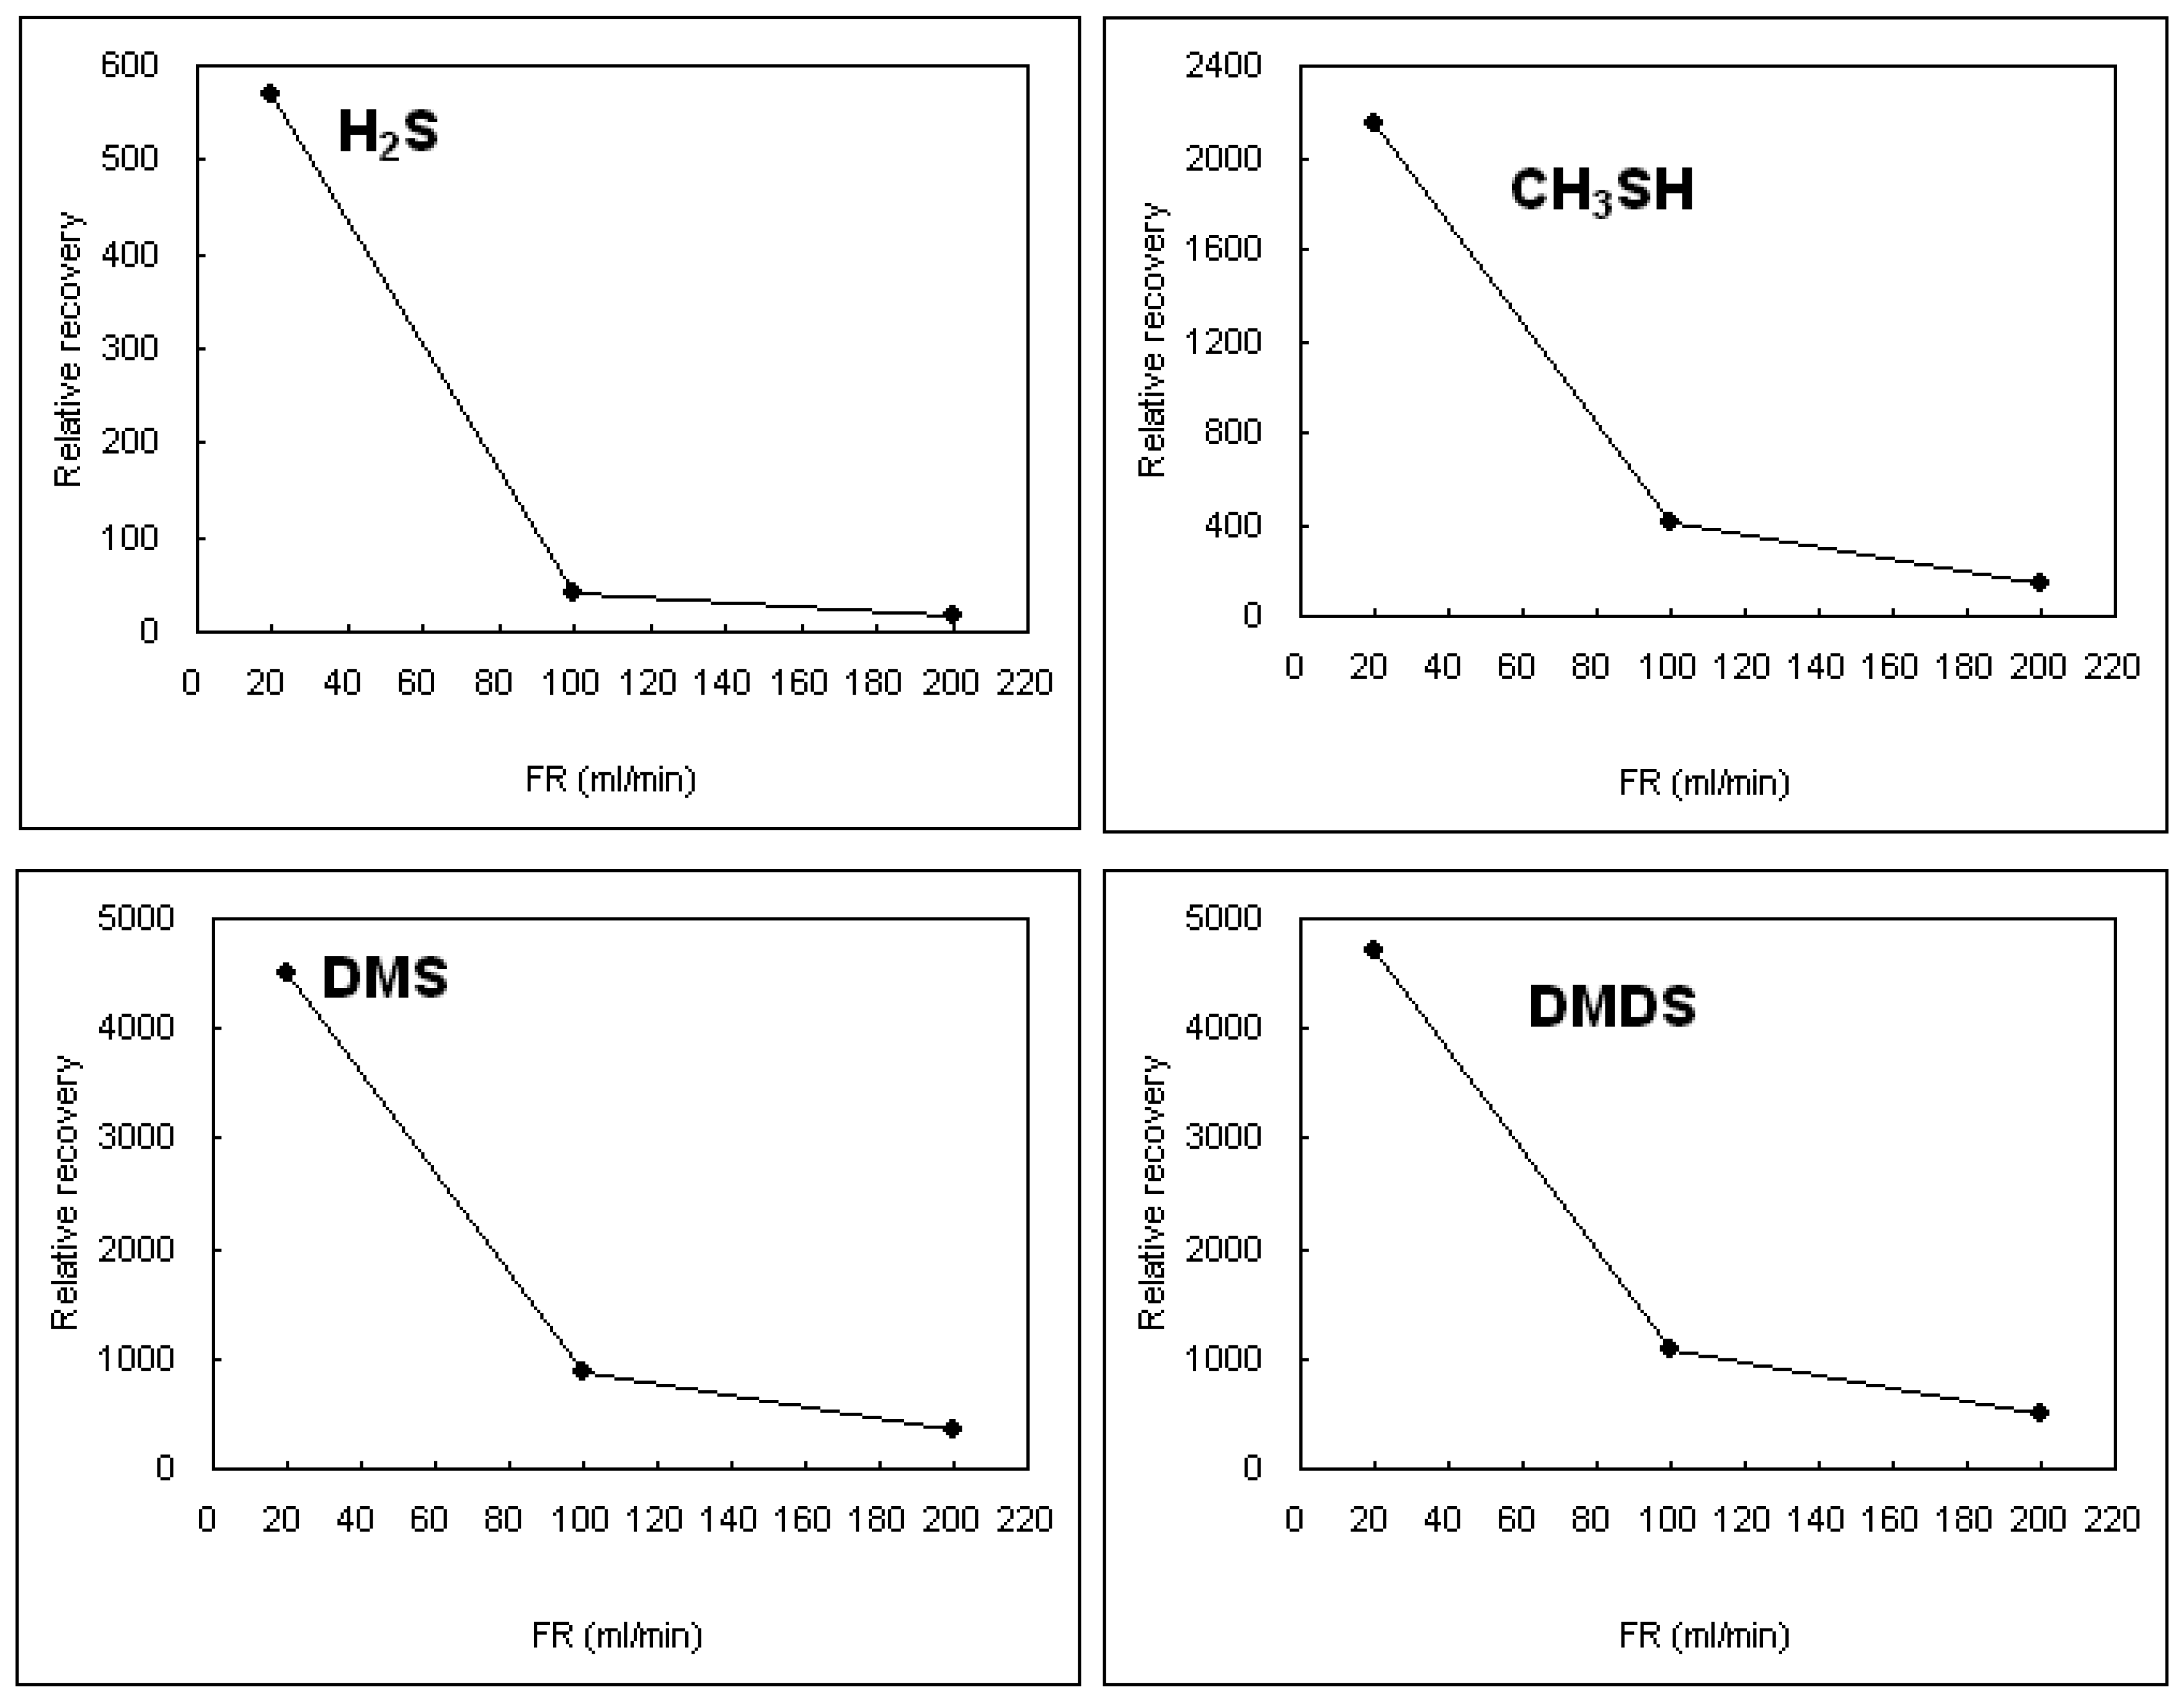
3.1 The effect of changes in RSC desorption condition - Experiment type I

The results of each analysis made in experiment type I are plotted in Figure 1. The RSCs were desorbed twice at each specified fixed time, thus all the data used for this comparision, unless otherwise specified, represents the sum of the results from two consecutive runs. The results shown in Figure 1 indicate that changes in desorption duration can affect the desorption efficiency of RSC in a different manner, relative to changes in flushing flow rate for desorption. In general, as shown in Figure 1, an increase in desorption duration (at a fixed flow rate) can enhance the amount of RSC desorbed in a rather systematic manner. These patterns are found consistently in the flow rates of 5 and 40 mL min−1. In the latter case, the desorbed amount of DMDS tends to increase from as little as 150 ng g−1 (desorption duration of 5 min) to 450 ng g−1 (30 min). As such, changes in desorption duration appear to be an important factor controlling the desorption efficiency.
In light of the fact that our experiments involve the quantification of RSC desorbed from clothing pieces, the evaluation of reproducibility for the whole methodological procedure may be considered one of the important variables to validate this experimental approach. However, it is important that all experimental procedures for a given series of experiments should be completed within a reasonably short time period during which similar instrumental performance can be maintained or achieved (e.g., less than 48 hrs). Hence, the reproducibility of this technique was checked both prior to and after a given experiment set (either type I or II experiment). A number of precision tests were hence conducted by a series of triplicate experiments in which three clothing pieces of a similar size were prepared and subjected to RSC exposure and subsequent GC/TD analysis. The precision of this adsorption/desorption test method was assessed by the ratio values obtained as the sum quantity of desorbed RSC (by running after two desorption cycles) divided by the weight of each clothing piece (in ng g−1 unit). The results indicated that relative standard error (RSE) values of those ratios vary moderately across RSCs with the maximum values of DMDS (11.8 %) followed by H2S (10.9 %), CH3SH (6.8 %), and DMS (4.1 %).

3.2 Influences of initial adsorption condition changes on the RSC desorption pattern – Experiment type 2

Table 2 shows both the amount of RSC supplied to induce adsorption and those released after the desorption treatment. To facilitate the comparison of the relative recovery (RR) through which RSC adsorption occurs, all of the experimental results made from experiment type 2 were put together and expressed in terms of RR as follows.
The use of the RR concept is convenient in that it facilitates the understanding of the relationships between RSC amounts (at different processing stage) and between different compounds (among RSCs). For instance, if two textile samples exposed by RSC standards at different durations had the same amount of RSC desorption, the one with shorter exposure time would lead to a higher RR value than the other. As the experiment type I was intended to determine the desorption conditions by varying flushing rates or durations, the results were simply compared to assess the most efficient conditions to induce desorption (e.g., Fig 1). However, in the case of experiment type II, all results were compared in terms of RR to sensitively detect the effect of initial exposure conditions on RSC adsorption.
Figure 2 details all results from experiment type 2 in terms of RR values. Although the initial quantity of H2S supplied to the system is comparable to the other RSCs, the actual amount of H2S desorbed from towel pieces appears to be significantly reduced relative to the other RSCs. It may be reasonable to conclude that H2S has the least RR values because it has the smallest molecular weight and highest polarity. The results of this comparative analysis further indicate that the patterns are highly systematic for each compound. All RR results are characterized so that the highest value is found under the least exposure conditions and then decreases exponentially with increasing exposure time. According to the results of experiment type II, the adsorption of most RSCs on the towel pieces occurs instantaneously. The pattern of an exponential decrease in RR values from Figure 2 suggests that the adsorption efficiency should record the maximum value in the least exposure condition and drop dramatically with the extension of exposure duration. It is most striking to find that these results vary systematically under certain parameter such as molecular weight.
As a means to further examine the relative effect of the initial loading conditions, the RR-based data sets acquired at 2 min loading intervals were compared for each different RSC (as shown in Figure 3). It should be noted that another compound, CS2 was also added in this part of the experiment to expand the basis for comparison. (In all other experiments, quantification of CS2 was limited because of contamination problems of CT due to a strong memory effect.) The results of this comparison clearly indicate that RR values change systematically with molecular weights within chemicals of similar types, when the physico-chemical conditions for their adsorption process are maintained identically. In another respect, the results show that adsorption efficiency can increase in a systematic manner with the increase in molecular weights. This suggests that, as expected, the compounds with high molecular weight exhibit a stronger affinity for adsorbable surfaces than lighter ones.
In Figure 4, the results of a different type of RR test are also plotted in which the initial supply of RSC to induce adsorption (at a fixed duration of 5 min) was adjusted as a function of varying flow rate. Although this comparison is made for a single duration with varying flow rates, it indicates that changes in the flow rate can also exert some influences on the RR values among different RSCs. The results of this experiment also indicate that the rate with which RSC standards are supplied to induce adsorption is greatly affected by the physical conditions of the RSC supply (e.g., the flow rate). The relatively enhanced adsorption rate at a low flow rate is comparable to test results derived based on exposure time (i.e., Figure 3). The results of these experiments show that the adsorption of odorous compounds can be regulated by combining the effects of various factors such as molecular weight and the physical condition of contact (e.g., flow rate).

4. Conclusions

In this study, the fundamental factors governing the sorptive processes of odorous compounds were studied based on their interaction with textile surfaces. To explain the basic aspects of such a micro-scale process, the limitations as well as the current state of knowledge on this subject have been considered. To sensitively detect the behavior of odorous compounds, an experimental scheme was designed and tested using a combination of GC/PFPD and an AS/TD set-up. The experimental data obtained in the first stage were important to determine the general structure of the experiments, as the changes made in the desorption stage differed moderately among different RSCs. Based on the information obtained from the first stage experiment, the effects of subtle changes on adsorption conditions were examined further as part of the second stage experiment. The results of this second stage experiment showed that the initial condition for RSC adsorption onto textile samples could be reflected in an extremely sensitive manner, if such conditions are modulated arbitrarily.
When all of these results are compared in terms of relative recovery, maximum efficiency was found at the shortest exposure interval followed by exponential decreases with the passage of time. In addition, if these results are compared among different RSCs, it was found that such efficiency increases vary systematically with increasing molecular weights. The RR values increased on the order of H2S, CH3SH, DMS, and DMDS. Based on this study, it is possible to demonstrate some basic properties and behaviors of reduced sulfur compounds on absorbable surfaces. However, more studies are needed to describe the precise nature of sorptive processes, especially with respect to the general factors involved in the sorptive processes.

Acknowledgments

We acknowledge a support for this project from the Korea Research Foundation Grant fund by the Korean Government (MOEHRD: KRF-2006-341-C00026).

References

  1. Burbank, H.M.; Qian, M.C. Volatile sulfur compounds in Cheddar cheese determined by headspace solid-phase microextraction and gas chromatograph-pulsed flame photometric detection. J. Chromatogr. A 2005, 1066, 149–157. [Google Scholar]
  2. Lillo, M.P.; Latrille, E.; Casaubon, G.; Agosin, E.; Bordeu, E.; Martin, N. Comparison between odour and aroma profiles of Chilean Pisco spirit. Food Qual. Pref. 2005, 16, 59–70. [Google Scholar]
  3. Willig, S.; Lacorn, M.; Claus, R. Development of a rapid and accurate method for the determination of key compounds of pig odor. J. Chromatogr. A 2003, 1038, 11–18. [Google Scholar]
  4. Hallier, A.; Courcoux, P.; Serot, T.; Prost, C. New gas chromatography-olfactometric investigative method, and its application to cooked Silurus glanis (European catfish) odor characterization. J. Chromatogr. A 2004, 1056, 201–208. [Google Scholar]
  5. van Ruth, S. M. Evaluation of two gas chromatography-olfactory methods: the detection frequency and perceived intensity method. J. Chromatogr. A 2004, 1054, 33–37. [Google Scholar]
  6. Cometto-Muniz, J.E.; Cain, W.S.; Abraham, M.H. Odor detection of single chemicals and binary mixtures. Behav. Brain Res. 2005, 156, 115–123. [Google Scholar]
  7. Baek, S.O.; Jenkins, R.A. Characterization of trace organic compounds associated with aged and diluted sidestream tobacco smoke in a controlled atmosphere – volatile organic compounds and polycyclic aromatic hydrocarbons. Atmos. Environ. 2004, 38, 6583–6599. [Google Scholar]
  8. Kim, K.-H.; Choi, Y.-J.; Yang, H.S. The adsorption/desorption behavior of odorous compounds on clothing materials: a case study on reduced sulfur compounds. Korean J. Atmos. Environ. 2006, 22, 249–257. [Google Scholar]
  9. Muezzinoglu, A. A study of volatile organic sulfur emissions causing urban odors. Chemosphere 2003, 51, 245–252. [Google Scholar]
  10. Ohmori, S.; Ohno, Y.; Makino, T.; Kashihara, T. Application of an electronic nose system for evaluation of unpleasant odor in coated tablets. Eur. J. Pharmaceut. Biopharmaceut. 2005, 59, 289–297. [Google Scholar]
  11. Draper, D.; Rutt, P. Operational experience with management of odours in Thames Water. Second CIWEM National Conference on Odour Control in Sewage Treatment, London, 30 April 1988.
  12. Schultz, T. J.; van Harreveld, A. P. International moves towards standardisation of odour measurement using olfactometry. Water Sci. Tech. 1996, 34, 541–547. [Google Scholar]
  13. Henshaw, P.; Nicell, J.; Sikdar, A. Parameters for the assessment of odour impacts on communities. Atmos. Environ. 2006, 40, 1016–1029. [Google Scholar]
  14. Kim, K.-H. Some insights into the gas chromatographic determination of reduced sulfur compounds (RSC) in air. Environ. Sci. Technol. 2005, 39, 6765–6769. [Google Scholar]
  15. Kim, K.-H.; Choi, Y.-J.; Choi, G.-H.; Song, H. N.; Yang, H.-S.; Oh, J. M. The effects of sampling materials selection in the collection of reduced sulfur compounds in air. Talanta 2006, 68, 1713–1719. [Google Scholar]
  16. Kim, K.-H.; Im, M.-S.; Jeon, E.-C.; Koo, Y.-S.; Youn, Y.-H. An on-line analysis of reduced sulfur gases in the ambient air surrounding a large industrial complex. Atmos. Environ. 2007, 41, 3829–3840. [Google Scholar]
Figure 1. Comparison of desorbed amounts of RSC at two desorption flow rates of 5 and 40 mL min−1. Results are compared by varying desorption duration at each flow rate. (Refer to Table 1 for such duration.).
Sensors 08 01858f1aSensors 08 01858f1b
Figure 2. Comparison of relative recovery as a function of RSC supplying duration (time:min) at a fixed flow rate of 100 mL min−1.
Sensors 08 01858f2
Figure 3. Comparison of relative recovery (ppm) between different RSCs as a function of their molecular weights (H2S(34), CH3SH(48), DMS(62), CS2(76), and DMDS(94)). Triplicate analyses were undertaken at a fixed flow rate (100 mL min−1) and supplying duration (2 min) to derive the odoring efficiency of each RSC.
Sensors 08 01858f3
Figure 4. Comparison of relative recovery (ppm) as a function of RSC loading flow rate at a fixed supplying duration of 5 min.
Sensors 08 01858f4
Table 1. The conditions of experiment type I for inducing adsorption and desorption of RSC.
A. RSC adsorption conditions for experiment type I
  • GC/PFPD (OI) plus TD (Markes Air Server)
  • All experiments were conducted in the laboratory at room temperature.
  • Target analytes: 10 ppm standard (4 RSC gases shown below)
  • The conditions of RSC STD loading (or supply) to induce adsorption: 10 ppm std for 10 min at FR of 100 mL min−1
  • The absolute quantities of RSC supplied to the clothing pieces to induce adsorption for each towel sample.
CompoundH2SCH3SHDMSDMDS
Amount (ng)13,98019,74025,50038,650
B. Desorption conditions of RSC for experiment type I
A. Experiment type IA: Desorption at fixed flushing flow rate (5 or 40 ml min−1)B. Experiment type IB: Desorption at fixed flushing duration (10 or 20 ml min−1)


Exp No.Flow rate (mL min−1)Duration (min)Exp No.Flow rate (mL min−1)Duration (min)


1595
2510101010
3201120
4301240


55135
64010141020
7201520
8301640


Table 2. The effects of changes in loading conditions on RSC desorption patterns: results of experiment type II. All experiments for type II are conducted by changing exposure (or loading) time from 0.17 to 40 min at a fixed loading flow rate (100 mL min−1).
Exp No.LD timeH2SCH3SHDMSDMDS
A. Total amount of RSC supplied (ng)
10.17238336433657
20.569998712751933
311398197425503865
422797394851007731
55699298711275019330
61013980197402550038650
72027970394805100077310
830419505922076500115960
9405594078970101990154620
B. Total amount of RSC deloaded (ng g−1)
10.17-111251455
20.5-112257211
312.7130273321
425.299235400
556.186232441
6108.6107260437
72010.8122262477
83016.5118245432
94018.8155277504
C. Relative recovery (ppm)
10.17-151602662031850
20.5-517891784974
3191.6308250003875
4287.2118921782444
5540.84068511066
61026.9236446494
72017.8143237285
83019.699159185
94016.094130156
*The mean and 1 SD of masses for clothing pieces used for all 9 individual experiments are 0.0466 ± 0.0016 g (range=0.04376 ∼ 0.04972 g).

