Analysis of Urban-Rural Land-Use Change during 1995-2006 and Its Policy Dimensional Driving Forces in Chongqing, China

Abstract
:1. Introduction
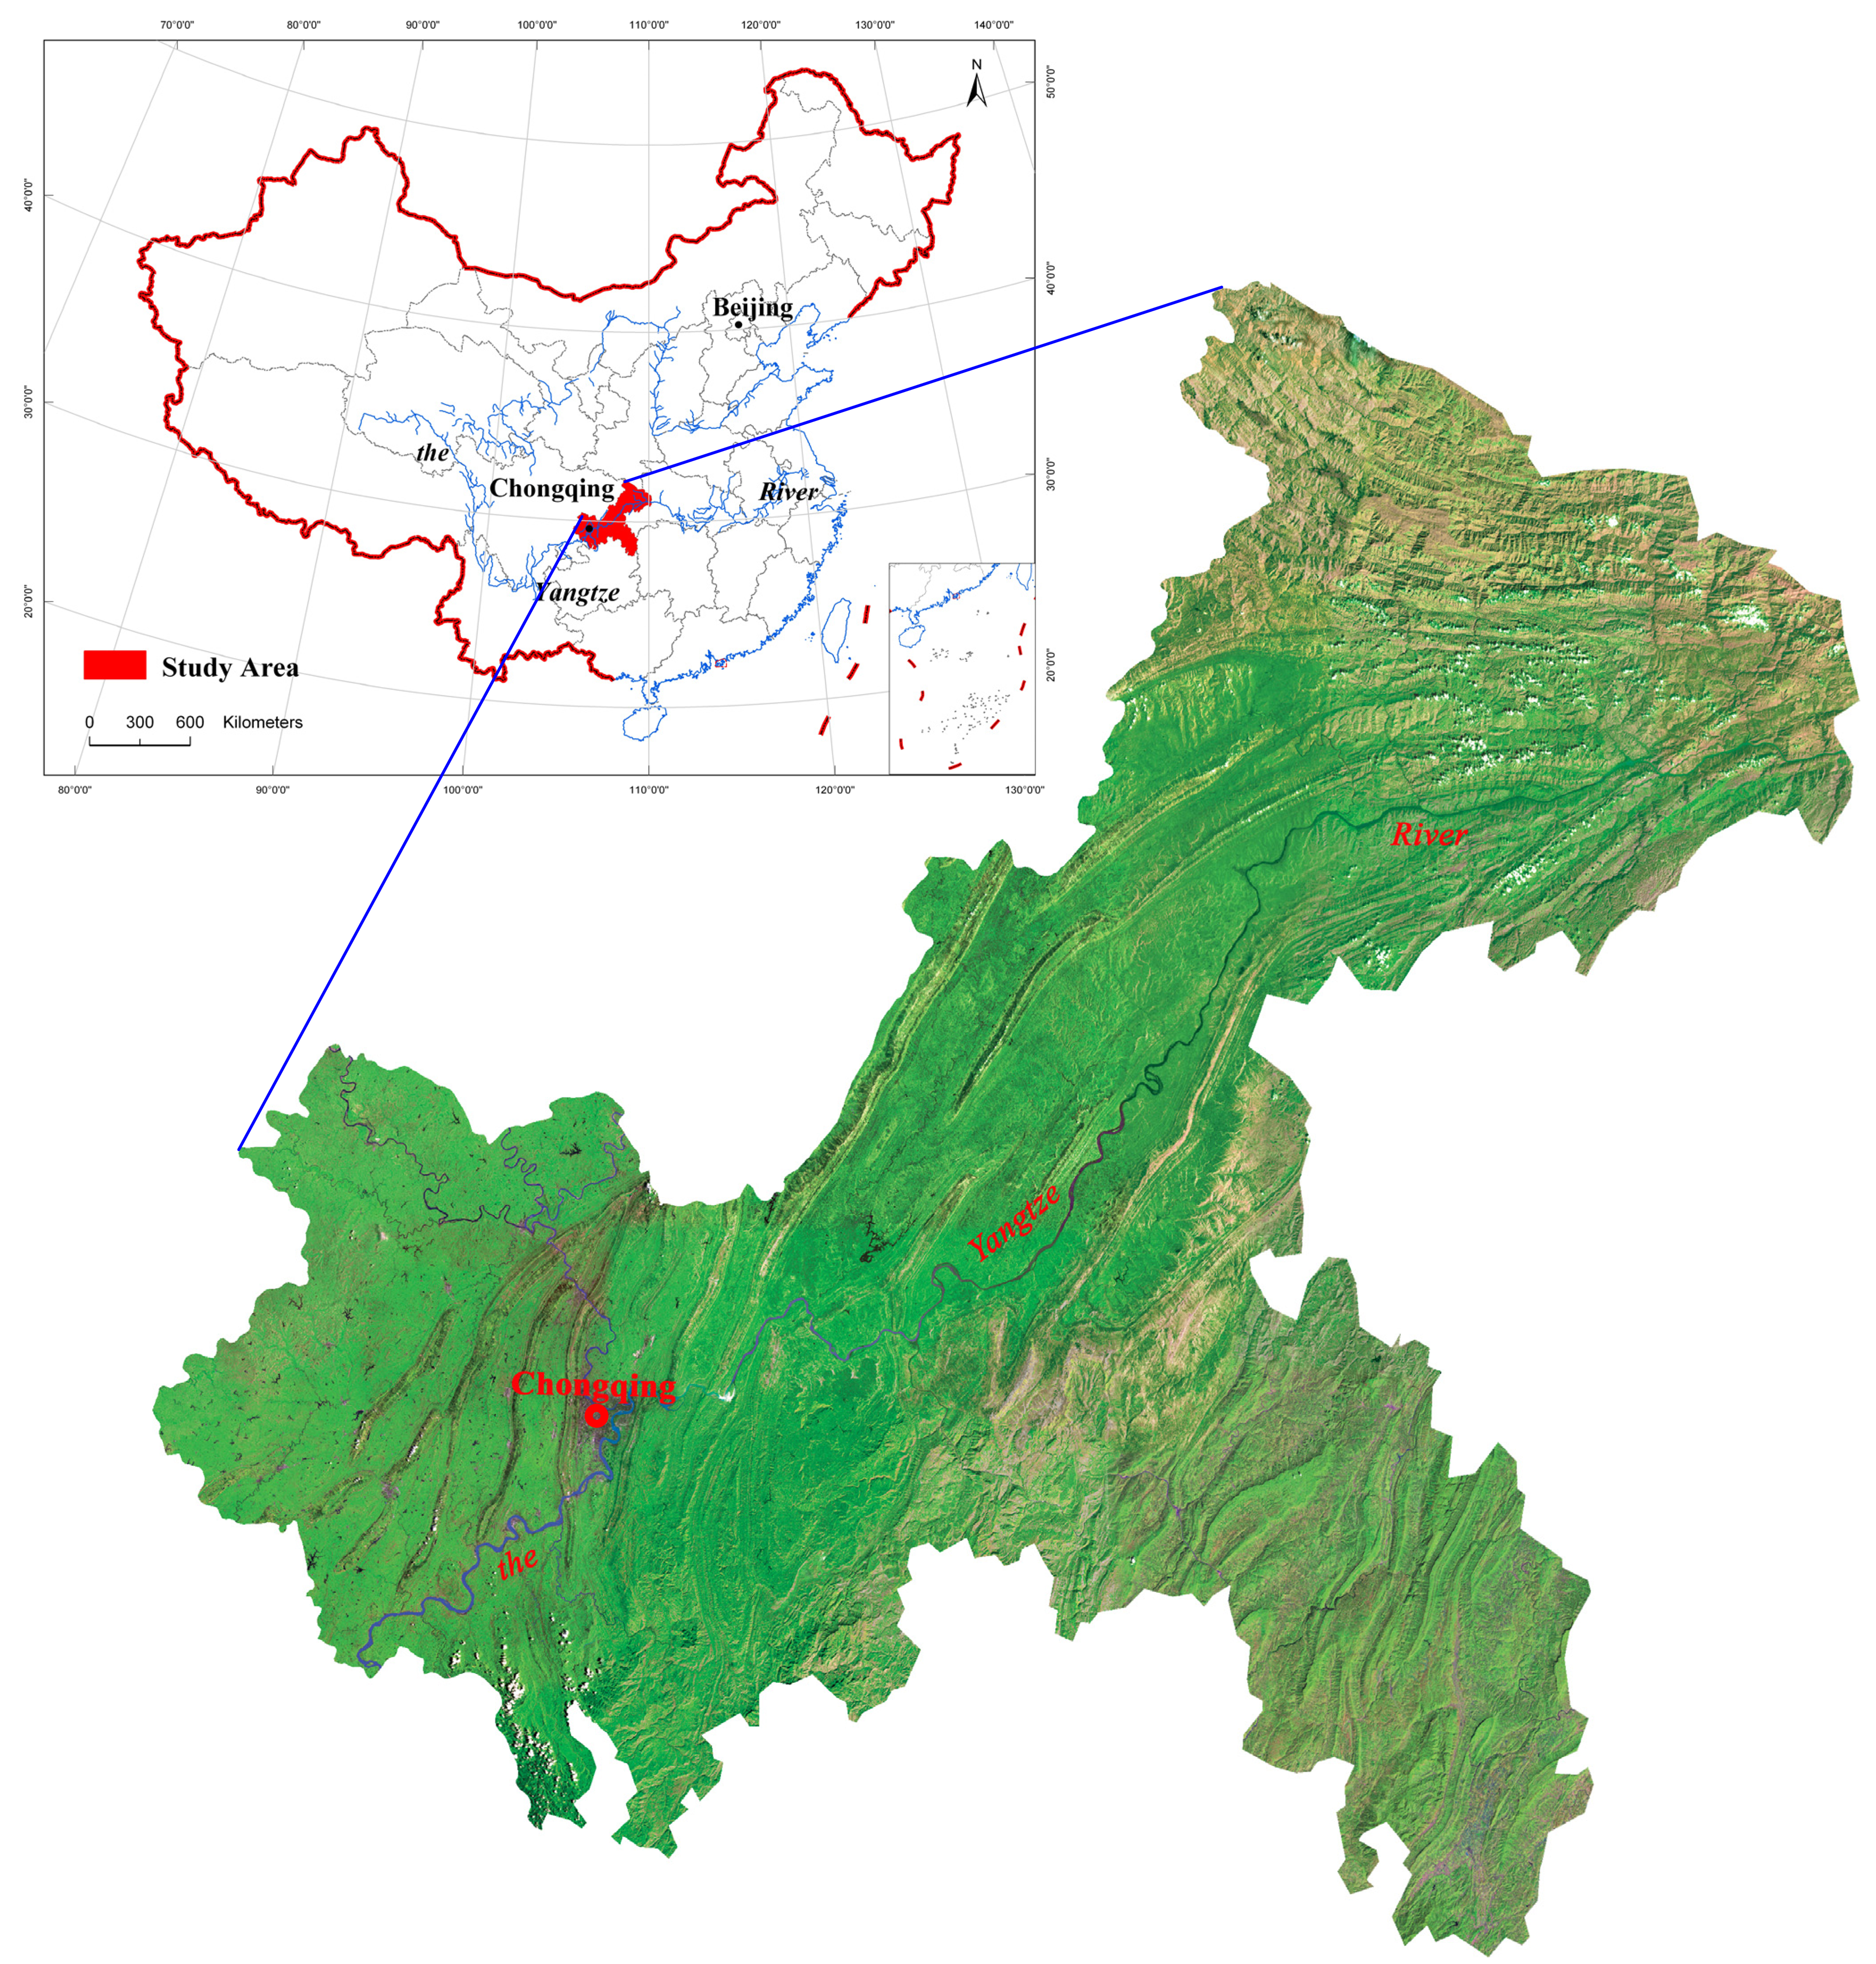
2. Study area
3. Methodology
3.1 Data
3.2 Methods
- CHi is the change of LULC in row i relative to the previous compared year;
- pi. is the row total of grid cells for category i;
- p.i is the column total of grid cells for category i.
- Ploss (i), j is the percentage taken by type j in the total “conversion loss” of category row i;
- Pgain (i), j is the percentage taken by type j in the total “conversion gain” of category row i;
- pi, j and pj, i is the individual entry in a change matrix A.
4. Results
4.1 Land-use change in Chongqing
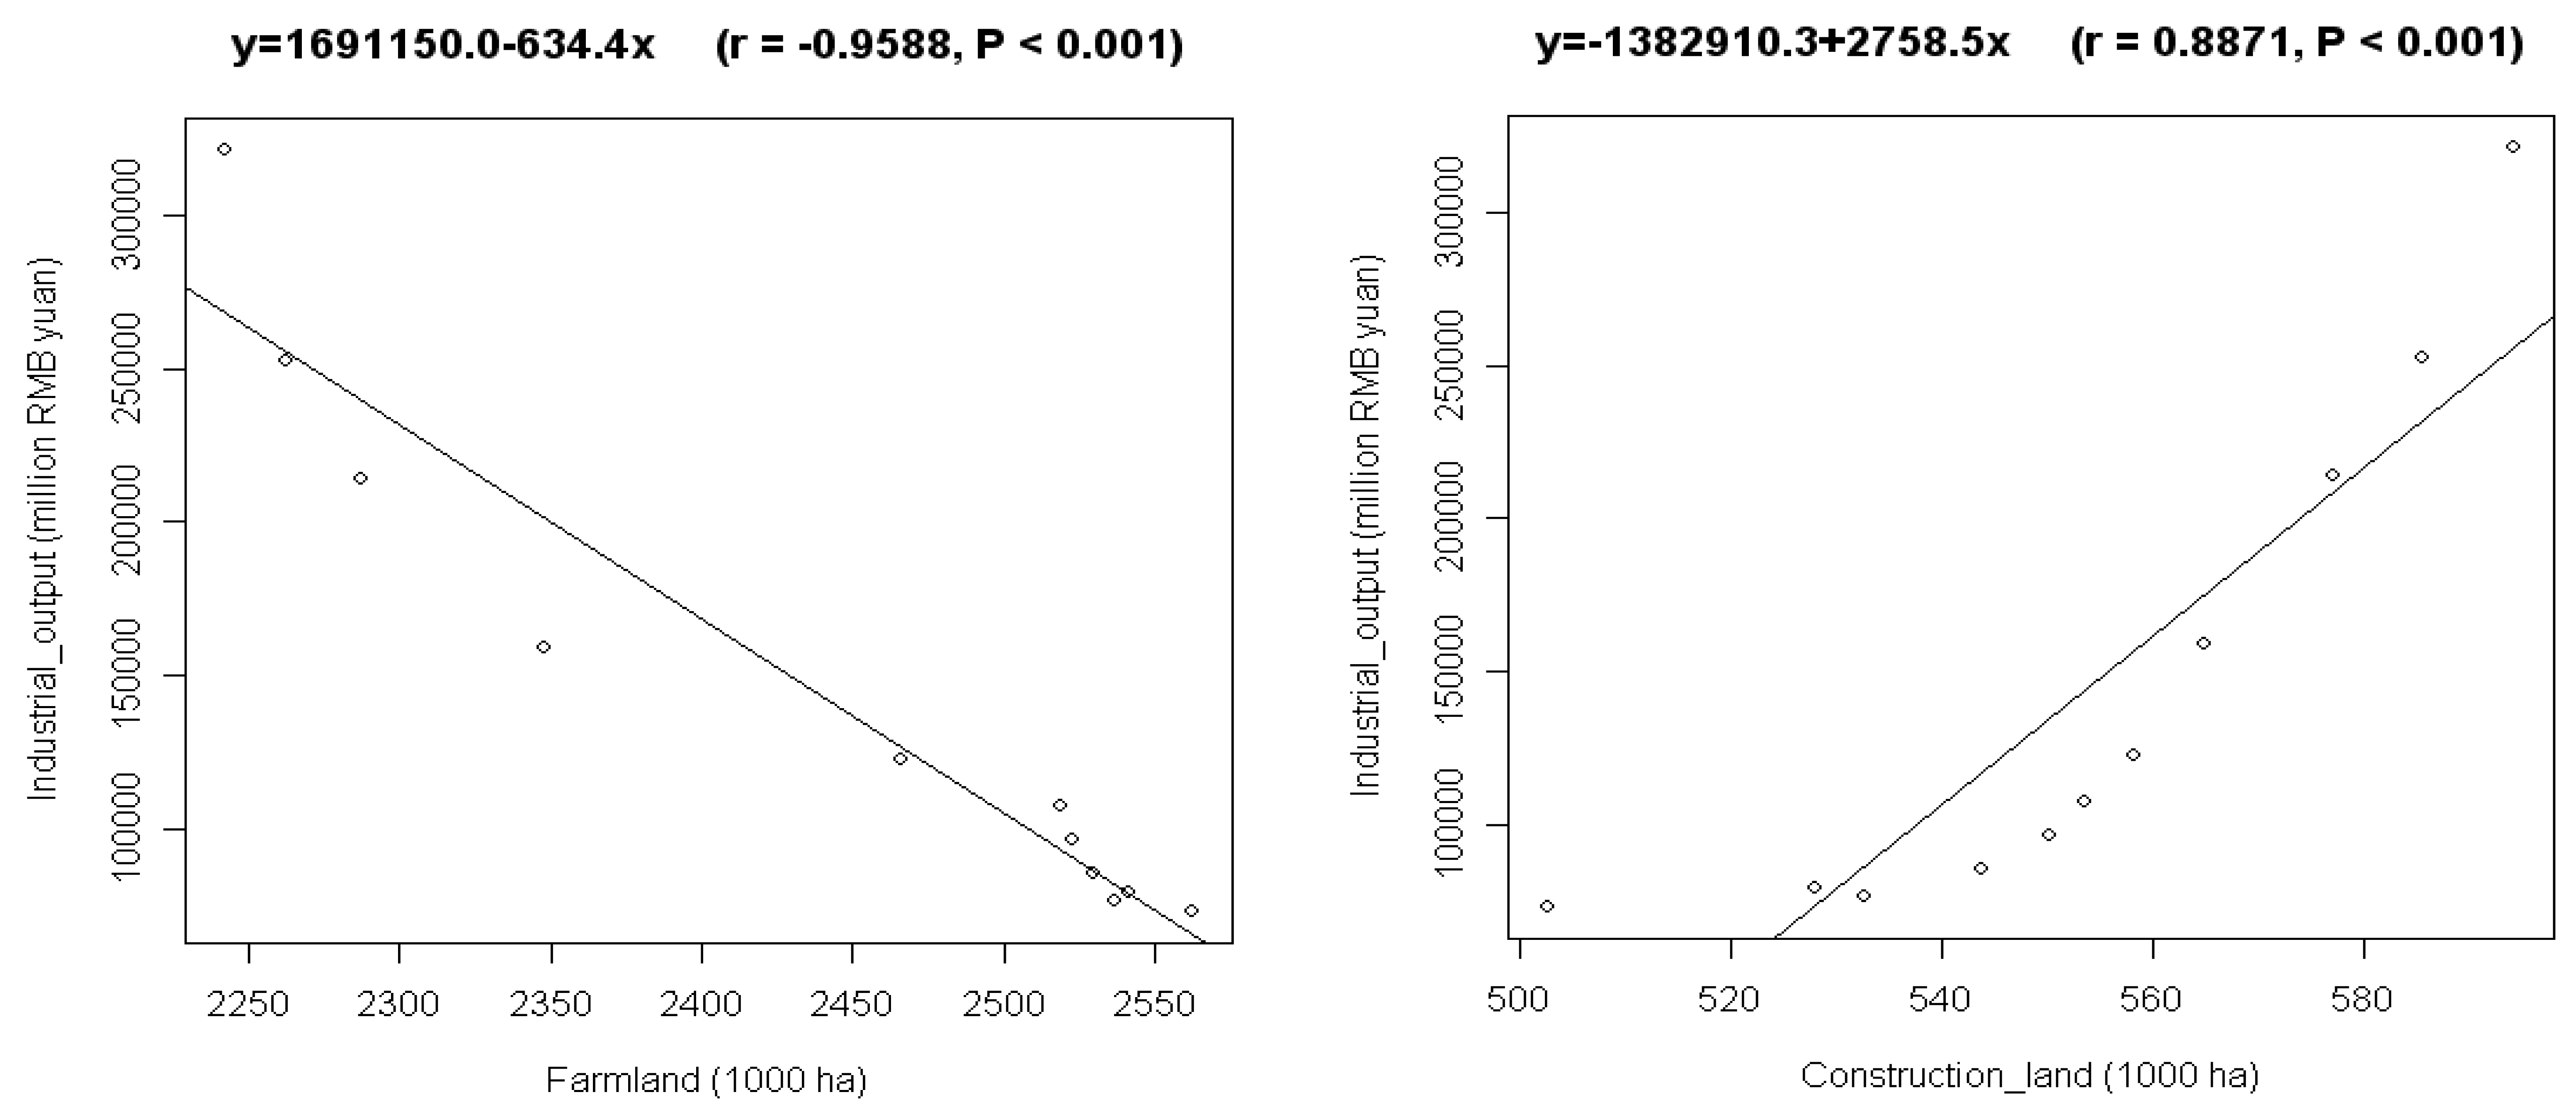
4.2 Policy dimensional driving forces of land-use change
4.2.1 The establishment of the municipality directly under the Central Government
4.2.2 The Three Gorges Dam Project
4.2.3 The Western China Development Program
4.2.4 The Grain-for-Green Programme
4.3 Implications for the new policy of ‘Urban-rural Integrated Reform’
5. Conclusions
Acknowledgments
References
- Ray, S.S.; Dadhwal, V.K. Estimation of crop evapotranspiration of irrigation command area using remote sensing and GIS. Agricultural Water Management 2001, 49(3), 239–249. [Google Scholar]
- Jiang, D.; Yang, X.H.; Nicholas, C.; Wang, N.B. An artificial neural network model for estimating crop yields using remotely sensed information. International Journal of Remote Sensing 2004, 25(9), 1723–1732. [Google Scholar]
- Kato, S.; Yamaguchi, Y. Estimation of storage heat flux in an urban area using ASTER data. Remote Sensing of Environment 2007, 110(1), 1–17. [Google Scholar]
- Weng, Q.H.; Quattrochi, D.A. Thermal remote sensing of urban areas: an introduction to the special issue. Remote Sensing of Environment 2006, 104(2), 119–122. [Google Scholar]
- Li, Z.W.; Zeng, G.M.; Zhang, H.; Yang, B.; Jiao, S. The integrated eco-environment assessment of the red soil hilly region based on GIS—a case study in Changsha City, China. Ecological Modelling 2007, 202(3-4), 540–546. [Google Scholar]
- Fazal, S. Urban expansion and loss of agricultural land - a GIS based study of Saharanpur City, India. Environment and Urbanization 2000, 12, 133–149. [Google Scholar]
- Weng, Q.H. Land use change analysis in the Zhujiang Delta of China using satellite remote sensing, GIS and stochastic modelling. Journal of Environmental Management 2002, 64, 273–284. [Google Scholar]
- Liu, J.Y.; Liu, M.L.; Zhuang, D.F.; Zhang, Z.X.; Deng, X.Z. Study on spatial pattern of land-use change in China during 1995-2000. 2003, 46, 373–378. [Google Scholar]
- Nagendra, H.; Munroe, D.K.; Southworth, J. From pattern to process: landscape fragmentation and the analysis of land use/land cover change. Agriculture Ecosystems & Environment 2004, 101, 111–115. [Google Scholar]
- Lambin, E.F.; Turner, B.L.; Geist, H.J.; Agbola, S.B.; Angelsen, A.; Bruce, J.W.; Coomes, O.T.; Dirzo, R.; Fischer, G.; Folke, C.; George, P.S.; Homewood, K.; Imbernon, J.; Leemans, R.; Li, X.B.; Moran, E.F.; Mortimore, M.; Ramakrishnan, P.S.; Richards, J.F.; Skanes, H.; Steffen, W.; Stone, G.D.; Svedin, U.; Veldkamp, T.A.; Vogel, C.; Xu, J.C. The causes of land-use and land-cover change: moving beyond the myths. Global Environmental Change-Human and Policy Dimensions 2001, 11, 261–269. [Google Scholar]
- Yildirim, H.; Ozel, M.E.; Divan, N.J.; Akca, A. Satellite monitoring of land cover/land use change over 15 years and its impact on the environment in Gebze/Kocaeli-Turkey. Turkish Journal of Agriculture and Forestry 2002, 26, 161–170. [Google Scholar]
- Giri, C.; Defourny, P.; Shrestha, S. Land cover characterization and mapping of continental Southeast Asia using multi-resolution satellite sensor data. International Journal of Remote Sensing 2003, 24, 4181–4196. [Google Scholar]
- Zhang, B.P.; Yao, Y.H.; Cheng, W.M.; Zhou, C.H.; Lu, Z.; Chen, X.D. Human-induced changes to biodiversity and alpine pastureland in the Bayanbulak Region of the East Tianshan Mountains. Mountain Research and Development 2002, 22, 1–7. [Google Scholar]
- Walker, R. Mapping process to pattern in the landscape change of the Amazonian frontier. Annals of the Association of American Geographers 2003, 93, 376–398. [Google Scholar]
- Xie, Y.C.; Fang, C.L.; Lin, G.C.S.; Gong, H.M.; Qiao, B. Tempo-spatial patterns of land use changes and urban development in globalizing China: a study of Beijing. Sensors 2007, 7, 2881–2906. [Google Scholar]
- Moglen, G.E.; Beighley, R.E. Spatially explicit hydrologic modeling of land use change. Journal of the American Water Resources Association 2002, 38, 241–253. [Google Scholar]
- Poyatos, R.; Latron, J.; Liorens, P. Land use and land cover change after agricultural abandonment - the case of a Mediterranean Mountain Area (Catalan Pre-Pyrenees). Mountain Research and Development 2003, 23, 362–368. [Google Scholar]
- Himiyama, Y. Land use cover changes in Japan: from the past to the future. Hydrological Processes 1998, 12, 1995–2001. [Google Scholar]
- Chen, J.; Gong, P.; He, C.Y.; Pu, R.L.; Shi, P.J. Land-use/land-cover change detection using improved change-vector analysis. Photogrammetric Engineering and Remote Sensing 2003, 69, 369–379. [Google Scholar]
- Liu, Y.S.; Gao, J.; Yang, Y.F. A holistic approach towards assessment of severity of land degradation along the Greatwall in northern Shaanxi province, China. Environmental Monitoring and Assessment 2003, 82, 187–202. [Google Scholar]
- Hietel, E.; Waldhardt, R.; Otte, A. Analysing land-cover changes in relation to environmental variables in Hesse, Germany. Landscape Ecology 2004, 19, 473–489. [Google Scholar]
- Kaufmann, R.K.; Seto, K.C. Change detection, accuracy, and bias in a sequential analysis of Landsat imagery in the Pearl River Delta, China: econometric techniques. Agriculture Ecosystems & Environment 2001, 85, 95–105. [Google Scholar]
- Krausmann, F.; Haberl, H.; Schulz, N.B.; Erb, K.H.; Darge, E.; Gaube, V. Land-use change and socio-economic metabolism in Austria - Part I: driving forces of land-use change: 1950-1995. Land Use Policy 2003, 20, 1–20. [Google Scholar]
- Verburg, P.H.; Veldkamp, A.; Fresco, L.O. Simulation of changes in the spatial pattern of land use in China. Applied Geography 1999, 19, 211–233. [Google Scholar]
- Aspinall, R. Modelling land use change with generalized linear models--a multi-model analysis of change between 1860 and 2000 in Gallatin Valley, Montana. Journal of Environmental Management 2004, 72, 91–103. [Google Scholar]
- Kelly, P.F. Urbanization and the politics of land in the Manila region. Annals of the American Academy of Political and Social Science 2003, 590, 170–187. [Google Scholar]
- Alig, R.J.; Kline, J.D.; Lichtenstein, M. Urbanization on the US landscape: looking ahead in the 21st century. Landscape and Urban Planning 2004, 69, 219–234. [Google Scholar]
- Long, H.L.; Tang, G.P.; Li, X.B.; Heilig, G.K. Socio-economic driving forces of land-use change in Kunshan, the Yangtze River Delta Economic Area of China. Journal of Environmental Management 2007, 83(3), 351–364. [Google Scholar]
- Jat, M.K.; Garg, P.K.; Khare, D. Monitoring and modelling of urban sprawl using remote sensing and GIS techniques. International Journal of Applied Earth Observation and Geoinformation 2008, 10(1), 26–43. [Google Scholar]
- Luck, M.; Wu, J. A gradient analysis of urban landscape pattern: a case study from the Phoenix metropolitan region, Arizona, USA. Landscape Ecology 2002, 17, 327–339. [Google Scholar]
- Yu, X.J.; Ng, C.N. Spatial and temporal dynamics of urban sprawl along two urban–rural transects: A case study of Guangzhou, China. Landscape and Urban Planning 2007, 79(1), 96–109. [Google Scholar]
- Camagni, R.; Gibelli, M.C.; Rigamonti, P. Urban mobility and urban form: the social and environmental costs of different patterns of urban expansion. Ecological Economics 2002, 40, 199–216. [Google Scholar]
- El-raey, M.; Fouda, Y.; Gal, P. GIS for environmental assessment of the impacts of urban encroachment on rosetta region, Egypt. Environmental Monitoring and Assessment 2000, 60, 217–233. [Google Scholar]
- Martinuzzi, S.; Gould, W.A.; Gonzalez, O.M.R. Land development, land use, and urban sprawl in Puerto Rico integrating remote sensing and population census data. Landscape and Urban Planning 2007, 79, 288–297. [Google Scholar]
- Sudhira, H.S.; Ramachandra, T.V.; Jagadish, K.S. Urban sprawl: metrics, dynamics and modelling using GIS. International Journal of Applied Earth Observation and Geoinformation 2004, 5(1), 29–39. [Google Scholar]
- Hathout, S. The use of GIS for monitoring and predicting urban growth in East and West St Paul, Winnipeg, Manitoba, Canada. Journal of Environmental Management 2002, 66, 229–238. [Google Scholar]
- Herold, M.; Goldstein, N.C.; Clarke, K.C. The spatiotemporal form of urban growth: measurement, analysis and modeling. Remote Sensing of Environment 2003, 86, 286–302. [Google Scholar]
- Long, H.L.; Heilig, G.K.; Li, X.B.; Zhang, M. Socio-economic development and land-use change: analysis of rural housing land transition in the Transect of the Yangtse River, China. Land Use Policy 2007, 24(1), 141–153. [Google Scholar]
- Deng, X.Z.; Huang, J.K.; Rozelle, S.; Uchida, E. Growth, population and industrialization, and urban land expansion of China. Journal of Urban Economics 2008, 63, 96–115. [Google Scholar]
- Tian, G.J.; Liu, J.Y.; Xie, Y.C.; Yang, Z.F.; Zhuang, D.F.; Niu, Z. Analysis of spatio-temporal dynamic pattern and driving forces of urban land in China in 1990s using TM images and GIS. Cities 2005, 22(6), 400–410. [Google Scholar]
- Liu, J.Y.; Zhan, J.Y.; Deng, X.Z. Spatio-temporal patterns and driving forces of urban land expansion in China during the economic reform era. Ambio 2005, 34, 450–455. [Google Scholar]
- Li, X.; Yeh, A.G.O. Analyzing spatial restructuring of land use patterns in a fast growing region using remote sensing and GIS. Landscape and Urban Planning 2004, 69, 335–354. [Google Scholar]
- Seto, K.C.; Kaufmann, R.K. Modeling the drivers of urban land use change in the Pearl River Delta, China: integrating remote sensing with socio-economic data. Land Economics 2003, 79, 106–121. [Google Scholar]
- Weng, Q.H.; Yang, S.H. Managing the adverse thermal effects of urban development in a densely populated Chinese city. Journal of Environmental Management 2004, 70(2), 145–156. [Google Scholar]
- Weng, Q.H.; Yang, S.H. An approach to evaluation of sustainability for Guangzhou's urban ecosystem. International Journal of Sustainable Development & World Ecology 2003, 10, 69–81. [Google Scholar]
- Walcotta, S.M.; Pannell, C.W. Metropolitan spatial dynamics: Shanghai. Habitat International 2006, 30, 199–211. [Google Scholar]
- Tan, M.H.; Li, X.B.; Xie, H.; Lu, C.H. Urban land expansion and arable land loss in China – a case study of Beijing–Tianjin–Hebei region. Land Use Policy 2005, 22, 187–196. [Google Scholar]
- Xiao, J.Y.; Shen, Y.J.; Ge, J.F.; Tateishi, R.; Tang, C.Y.; Liang, Y.Q.; Huang, Z.Y. Evaluating urban expansion and land use change in Shijiazhuang, China, by using GIS and remote sensing. Landscape and Urban Planning 2006, 75, 69–80. [Google Scholar]
- Zhang, L.C.; Zhu, T.M.; Yao, S.M. Evolvement of urban spatial structure and main drives in Wuxi, China. Chinese Geographical Science 2005, 15(4), 309–314. [Google Scholar]
- Xie, Y.C.; Yu, M.; Bai, Y.F.; Xing, X.R. Ecological analysis of an emerging urban landscape pattern—desakota: a case study in Suzhou, China. Landscape Ecology 2006, 21, 1297–1309. [Google Scholar]
- Wu, Q.; Li, H.Q.; Wang, R.S.; Paulussen, J.; He, Y.; Wang, M.; Wang, B.H.; Wang, Z. Monitoring and predicting land use change in Beijing using remote sensing and GIS. Landscape and Urban Planning 2006, 78(4), 322–333. [Google Scholar]
- Han, S.S.; Wang, Y. City profile: Chongqing. Cities 2001, 18(2), 115–125. [Google Scholar]
- Chongqing Statistical Bureau (CSB). Chongqing Statistical Yearbook; Chinese Statistical Publishing House: Beijing, 1996-2007. [Google Scholar]
- The Ministry of Land and Resources of China (MLRC). Reports on China's land-use survey and update.; China Land Press: Beijing, 2002-2006. [Google Scholar]
- McGarigal, K.; Cushman, S.A.; Neel, M.C.; Ene, E. FRAGSTATS: Spatial Pattern Analysis Program for Categorical Maps 2002.
- Turner, M.G. Landscape ecology: the effect of pattern on process. Annual Review of Ecology and Systematics 1989, 20, 171–197. [Google Scholar]
- Sleeman, J.C.; Kendrick, G.A.; Boggs, G.S.; Hegge, B.J. Measuring fragmentation of seagrass landscapes: which indices are most appropriate for detecting change? Marine and Freshwater Research 2005, 56, 851–864. [Google Scholar]
- Jenerette, G.D.; Wu, J.G. Analysis and simulation of land-use change in the central Arizona-Phoenix region, USA. Landscape Ecology 2001, 16, 611–626. [Google Scholar]
- Wu, L.X.; Sun, B.; Zhou, S.L.; Huang, S.E.; Zhao, Q.G. A new fusion technique of remote sensing images for land use/cover. Pedosphere 2004, 14, 187–194. [Google Scholar]
- Skinner, M.W.; Kuhn, R.G.; Joseph, A.E. Agricultural land protection in China: a case study of local governance in Zhejiang Province. Land Use Policy 2001, 18, 329–340. [Google Scholar]
- Cui, G.; Ma, L.J.C. Urbanization from below in China: its development and mechanisms. Acta Geographica Sinica 1999, 54, 106–115, in Chinese. [Google Scholar]
- Chongqing Construction Committee. Chongqing Construction Industry Report in Year 2000; Chongqing, 2000. [Google Scholar]
- Wu, J.G.; Huang, J.H.; Han, X.G.; Gao, X.M.; He, F.L.; Jiang, M.X.; Jiang, Z.G.; Primack, R.B.; Shen, Z.H. The Three Gorges Dam: an ecological perspective. Frontiers in Ecology and the Environment 2004, 2, 241–248. [Google Scholar]
- Marta, P.; Jordi, L.P. The Three Gorges Dam Project in China: history and consequences. Revista HmiC 2006, VI, 151–187. [Google Scholar]
- Wang, L.L.; Wei, H.K. Progress of Western China Development Drive, and Evaluation of the Results. China & World Economy 2004, 12(2), 20–33. [Google Scholar]
- State Forestry Administration (SFA). China Forestry Development Report in 2000; Chinese Forestry Press; Beijing, 2000. [Google Scholar]
- Feng, Z.M.; Yang, Y.Z.; Zhang, Y.Q.; Zhang, P.T.; Li, Y.Q. Grain-for-green policy and its impacts on grain supply in West China. Land Use Policy 2005, 22, 301–312. [Google Scholar]
- Wang, X.H.; Lu, C.H.; Fang, J.F.; Shen, Y.C. Implications for development of grain-for-green policy based on cropland suitability evaluation in desertification-affected north China. Land Use Policy 2007, 24, 417–424. [Google Scholar]
- Long, H.L.; Heilig, G.K.; Wang, J.; Li, X.B.; Luo, M.; Wu, X.Q.; Zhang, M. Land use and soil erosion in the upper reaches of the Yangtze River: some socio-economic considerations on China's Grain-for-green Programme. Land Degradation & Development 2006, 17, 589–603. [Google Scholar]
- Bengston, D.N.; Fletcher, J.O.; Nelson, K.C. Public policies for managing urban growth and protecting open space: policy instruments and lessons learned in the United States. Landscape and Urban Planning 2004, 69, 271–286. [Google Scholar]
- Carlson, T. Applications of remote sensing to urban problems. Remote Sensing of Environment 2003, 86, 273–274. [Google Scholar]


| LULC type in 2000 | LULC type in 1995 | Changes in 2000 (%) | ||||||||
|---|---|---|---|---|---|---|---|---|---|---|
| FML | FL | GL | WB | US | RS | CL | UL | Total | ||
| FML | 3806070 | 1423 | 676 | 56 | 3808225 | -0.32 | ||||
| FL | 53 | 3163241 | 16228 | 44 | 67 | 3179633 | -0.08 | |||
| GL | 113 | 16677 | 1022096 | 35 | 1038921 | -0.06 | ||||
| WB | 189 | 202 | 123236 | 123627 | 0.21 | |||||
| US | 8769 | 479 | 191 | 46764 | 56203 | 20.18 | ||||
| RS | 3574 | 265 | 73 | 16337 | 20249 | 23.95 | ||||
| CL | 1762 | 169 | 104 | 26 | 3736 | 5797 | 55.17 | |||
| UL | 37 | 12 | 13 | 1128 | 1190 | -3.25 | ||||
| Total | 3820567 | 3182266 | 1039583 | 123362 | 46764 | 16337 | 3736 | 1230 | 8233845 | |
| LULC type in 2006 | LULC type in 2000 | Changes in 2006 (%) | ||||||||
|---|---|---|---|---|---|---|---|---|---|---|
| FML | FL | GL | WB | US | RS | CL | UL | Total | ||
| FML | 3789960 | 1893 | 1041 | 71 | 53 | 30 | 3793048 | -0.40 | ||
| FL | 6478 | 3175301 | 1186 | 32 | 3182997 | 0.11 | ||||
| GL | 319 | 1035860 | 45 | 1036224 | -0.26 | |||||
| WB | 811 | 525 | 277 | 123507 | 9 | 24 | 125153 | 1.23 | ||
| US | 7266 | 1462 | 417 | 47 | 56142 | 40 | 674 | 66048 | 17.52 | |
| RS | 2088 | 312 | 54 | 20132 | 231 | 22817 | 12.68 | |||
| CL | 1303 | 119 | 52 | 2 | 52 | 4862 | 6390 | 10.23 | ||
| UL | 21 | 34 | 1113 | 1168 | -1.85 | |||||
| Total | 3808225 | 3179633 | 1038921 | 123627 | 56203 | 20249 | 5797 | 1190 | 8233845 | |
| LULC type | Patch density (number/100 ha) | Aggregation index | Number of patches | Average area (ha) | ||||||||
|---|---|---|---|---|---|---|---|---|---|---|---|---|
| 95 | 00 | 06 | 95 | 00 | 06 | 95 | 00 | 06 | 95 | 00 | 06 | |
| FML | 0.338 | 0.331 | 0.330 | 83.42 | 84.41 | 84.11 | 27821 | 27257 | 27151 | 136.1 | 142.2 | 137.0 |
| FL | 0.158 | 0.142 | 0.142 | 84.41 | 84.74 | 84.86 | 12972 | 11699 | 11716 | 218.9 | 240.0 | 245.1 |
| GL | 0.081 | 0.081 | 0.089 | 78.53 | 78.47 | 77.74 | 6671 | 6662 | 7304 | 176.6 | 170.6 | 137.7 |
| WB | 0.013 | 0.013 | 0.065 | 79.77 | 79.71 | 71.49 | 1067 | 1086 | 5374 | 105.4 | 104.5 | 111.3 |
| US | 0.001 | 0.001 | 0.008 | 85.88 | 88.04 | 85.72 | 100 | 97 | 628 | 238.4 | 352.9 | 114.9 |
| RS | 0.014 | 0.016 | 0.020 | 63.09 | 65.08 | 62.97 | 1166 | 1345 | 1681 | 14.6 | 16.2 | 13.9 |
| CL | 0.002 | 0.003 | 0.006 | 72.90 | 72.05 | 62.62 | 147 | 229 | 496 | 30.2 | 30.4 | 15.5 |
| UL | 0.002 | 0.002 | 0.001 | 58.60 | 58.40 | 59.47 | 144 | 137 | 77 | 15.1 | 15.1 | 15.0 |
| Corresponding LULC type | Main urban-rural LULC types (1995-2000) | Main urban-rural LULC types (2000-2006) | ||||||||||
|---|---|---|---|---|---|---|---|---|---|---|---|---|
| FML - | FL- | GL- | US+ | RS+ | CL+ | FML- | FL+ | GL- | US+ | RS+ | CL+ | |
| FML | 52.0 | 85.0 | 92.9 | 91.4 | 85.5 | 136.3* | 26.8 | 73.8 | 79.2 | 214.7* | ||
| FL | -11.1 | -67.8 | 5.1 | 6.8 | 8.2 | 30.2 | 44.0 | 14.9 | 12.1 | 20.1 | ||
| GL | -4.6 | 17.1 | 2.0 | 1.9 | 5.0 | -4.8 | 35.3 | 4.2 | 2.1 | 8.8 | ||
| WB | 1.1 | -1.7 | 30.5 | 1.3 | 4.9 | -15.6 | 10.3 | 0.4 | -0.9 | 0.3 | ||
| US | 71.1 | 18.2 | 28.9 | 47.9 | -43.5 | 15.5 | -1.6 | -104.9 | ||||
| RS | 29.0 | 10.1 | 11.0 | 13.4 | -9.3 | 2.0 | 0.4 | -39.0 | ||||
| CL | 14.3 | 6.4 | 15.7 | 8.4 | -3.5 | 1.9 | 6.3 | 9.0 | ||||
| UL | 0.3 | -2.1 | -3.3 | 0.3 | -0.4 | |||||||
© 2008 MDPI Reproduction is permitted for noncommercial purposes.
Share and Cite
Long, H.; Wu, X.; Wang, W.; Dong, G. Analysis of Urban-Rural Land-Use Change during 1995-2006 and Its Policy Dimensional Driving Forces in Chongqing, China. Sensors 2008, 8, 681-699. https://doi.org/10.3390/s8020681
Long H, Wu X, Wang W, Dong G. Analysis of Urban-Rural Land-Use Change during 1995-2006 and Its Policy Dimensional Driving Forces in Chongqing, China. Sensors. 2008; 8(2):681-699. https://doi.org/10.3390/s8020681
Chicago/Turabian StyleLong, Hualou, Xiuqin Wu, Wenjie Wang, and Guihua Dong. 2008. "Analysis of Urban-Rural Land-Use Change during 1995-2006 and Its Policy Dimensional Driving Forces in Chongqing, China" Sensors 8, no. 2: 681-699. https://doi.org/10.3390/s8020681
APA StyleLong, H., Wu, X., Wang, W., & Dong, G. (2008). Analysis of Urban-Rural Land-Use Change during 1995-2006 and Its Policy Dimensional Driving Forces in Chongqing, China. Sensors, 8(2), 681-699. https://doi.org/10.3390/s8020681