Article

Detection of the Deformation of an Intelligent Textile in a Specific Point

1
TT- Electronics Area, Enginyeria i Arquitectura La Salle, Quatre Camins 30 08022 Barcelona – Spain
2
Electronics Department, Enginyeria i Arquitectura La Salle, Quatre Camins 30 08022 Barcelona – Spain
3
AITEX Instituto tecnológico del textil, Carrer Telers, 20 - Apdo. 344, 46870 Ontinyent - Spain
Sensors 2007, 7(6), 921-931; https://doi.org/10.3390/s7060921
Submission received: 8 May 2007 / Accepted: 7 June 2007 / Published: 13 June 2007
(This article belongs to the Special Issue Intelligent Sensors)

Abstract

:
An intelligent textile is a textile structure that measures and reacts in front of external agents or stimulus with or without integrated electronic equipment. The finality of the present textile is to take one more step towards intelligent textile, considering the integration of electronics and textile needs, to be industrially viable and to keep up the necessary competitiveness, raising the final price as little as possible. The finality of these experiments is to develop a textile that varies in conductivity and resistance in relation to the elongation of the textile, detecting changes caused by the alteration of a piece of clothing, from the pressure of a finger on the material, for example. One of the most important characteristics of textile is the capacity of reproducing measures, of varying the response in different tests. Two lines of research were opened: the study of the most adequate structure to achieve a response that can be reproduced and the study of the best way of taking measures without altering the behavior of the textile.

1. Introduction: Scientific-technical principles

Considering the hypothesis that a textile woven with conductor thread and elastic thread modifies its resistance according to the degree of elongation, whenever this measure can be standardized and reproduced at any time, we can obtain an elastic conductor textile with a certain degree of superficial electric resistance which will only depend on the degree of elongation and structure of the textile. It is important to underline that for this to happen the superficial conductivity of the textile needs to be sensible enough to small changes in tension, and the same tension force on the textile in one only direction must be reproducible and give the same change value on the superficial conductivity. The variables researched are mainly two:
  • The type of conductor wire used in textile production.
  • The structure of the textile itself; design of the weaving
Based on this hypothesis, AITEX and La Salle School of Engineering at the Universitat Ramon Llull, Barcelona, have centered their work on the research and development of a textile of these characteristics, following the technical specifications defined in the first place, concerning elongation and superficial conductivity, and considering important parameters such as causality and industrial viability.
With this finality, different types of test developments were carried out with an extensive variety of samples of conductor thread, as well as wide range of ways of weaving. The characteristics of these samples are detailed in the following chart:

2. Detection of deformation

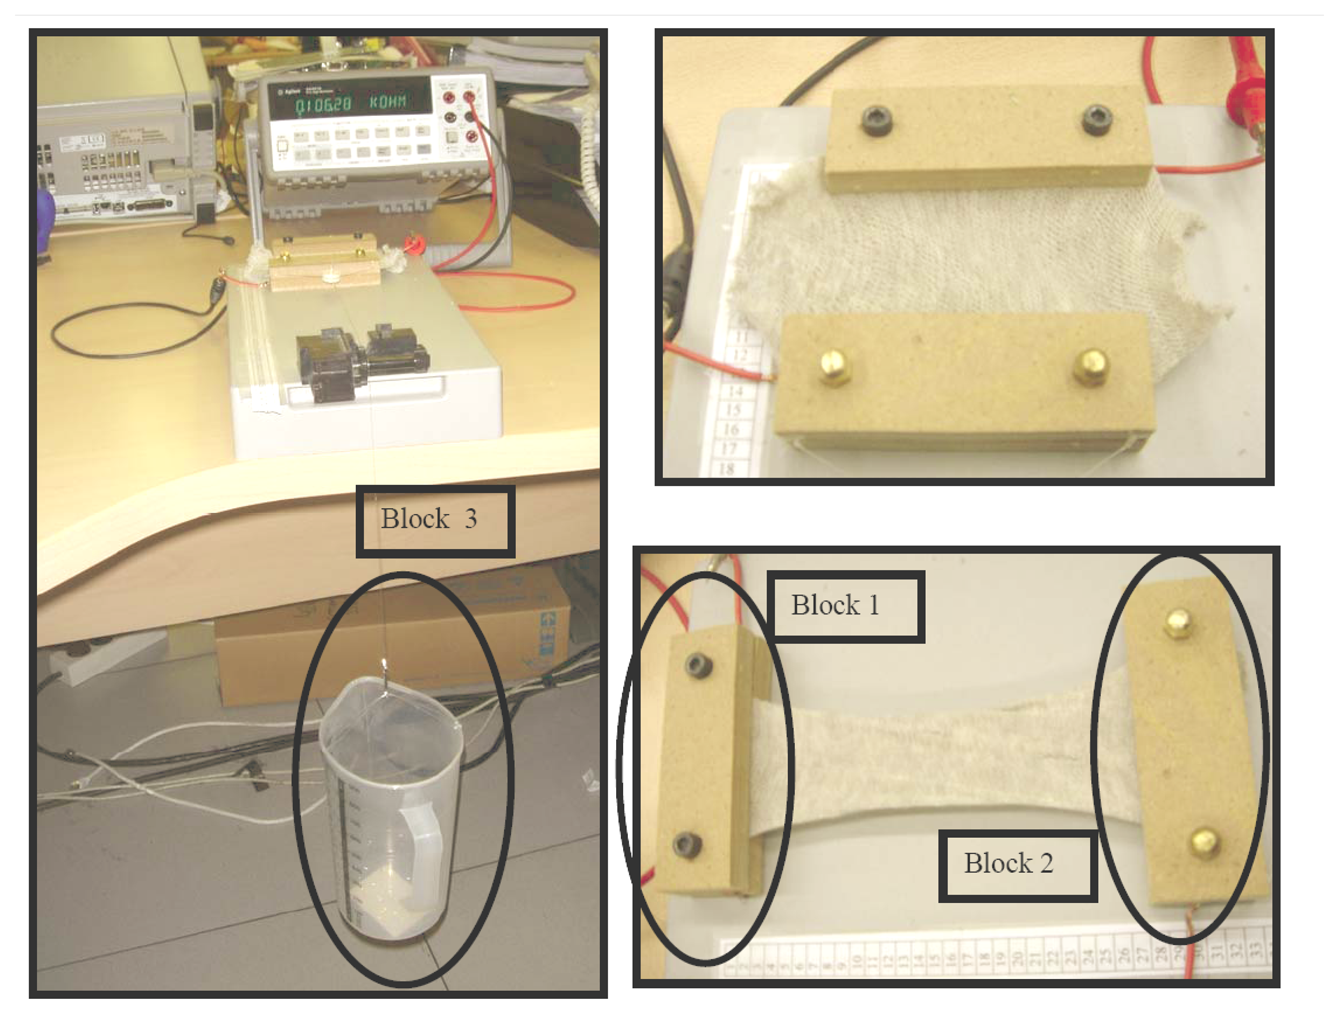
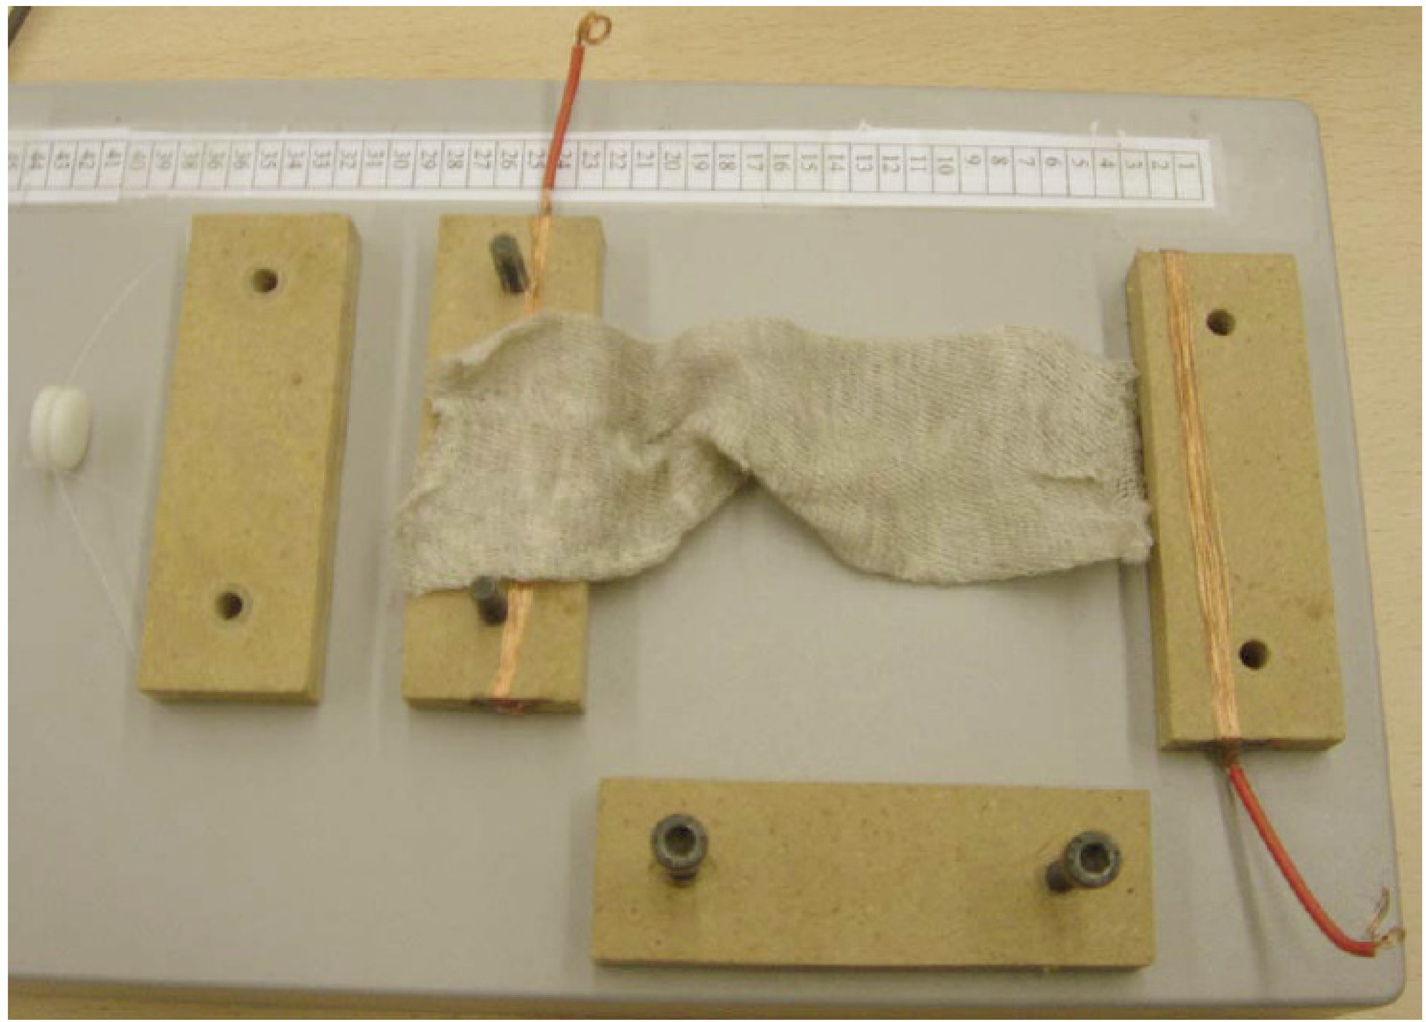
2.1. Preparation of the test

The tests bench must provide the measure of resistance of the textile, considering elongation [1]. A system was suggested to allow the measure of this elongation from predetermined volumes of water. This way we can ensure the tension the textile [2] is exposed to. The tests bench is formed by a platform with two pieces that make it possible to hold and pull the textile from both extremes. These pieces can be seen in block 1 and 2 of figure 1.
Block 1 is fixed to the work platform and keeps one extreme of the textile in the same place. Block 2 is tied to a fishing thread with a graduated plastic container on the other end measuring in cubical centimetres, which allows the application of the tension desired on the textile.
The resistance between these two blocks is measured, as can be seen in figure 2.
If we separate the pieces in the middle, a conductor wire can be seen covering the piece vertically, so when the textile is placed between the two pieces it causes contact with one of the ends of the textile to be analyzed. The finality will be to measure the existing resistance between the extremes of the textile and to see if a there is any variation as we increase the tension applied.
It is important to understand the way contacts have place within the textile. Following we have a small illustration of the structure of the weaving.
It is evident how important the direction of the weaving is, in the sense of the contacts between threads. If we wished to measure the resistance between point 1 and 2 of figure 3, supposing the thread used was formed by 60% conductor, we would obtain a resistance close to 0. On the other hand, if we measured the resistance between points 2 and 4, the resistance value would depend of the contact between threads. If we measure between points 3 and 2, the dependence among the thread contacts will be higher. At this point we can see that if we pull the structure there is more contact among the threads, and the resistance between points decreases.
Block 3 belongs to the end causing the tension on the textile depending on the content of the container. To cause a controlled stretching or elongation, reproducible and regulated, the plastic container is filled with pre-determined amounts of water. This way the experiment can always be repeated. If the elongation of the textile was to be caused manually, we would never know the exact force applied and this would not be a reproducible experiment. The quantities of water used to cause the tension to the textiles have always been the same: 25cc, 50cc, 100cc, 150cc, 200cc, 250cc and 300cc. These volumes allow us to take the textile from its natural elongation to breaking point, allowing intermediate elongations in order to study the progression of the textiles resistance value [2].
This trial set does not require any gauging, as it does not intend to determine an absolute measure of resistance or elongation. The finality is to see whether this relation can exist and which thread allows a better progression of the resistance, considering this variation to be easier to detect through a microprocessor.
Different types of measures have been determined according to the variation of the resistance value, considering the elongation direction and the weaving direction, and also the manipulation of the textile. The battery of tests carried out is the following:
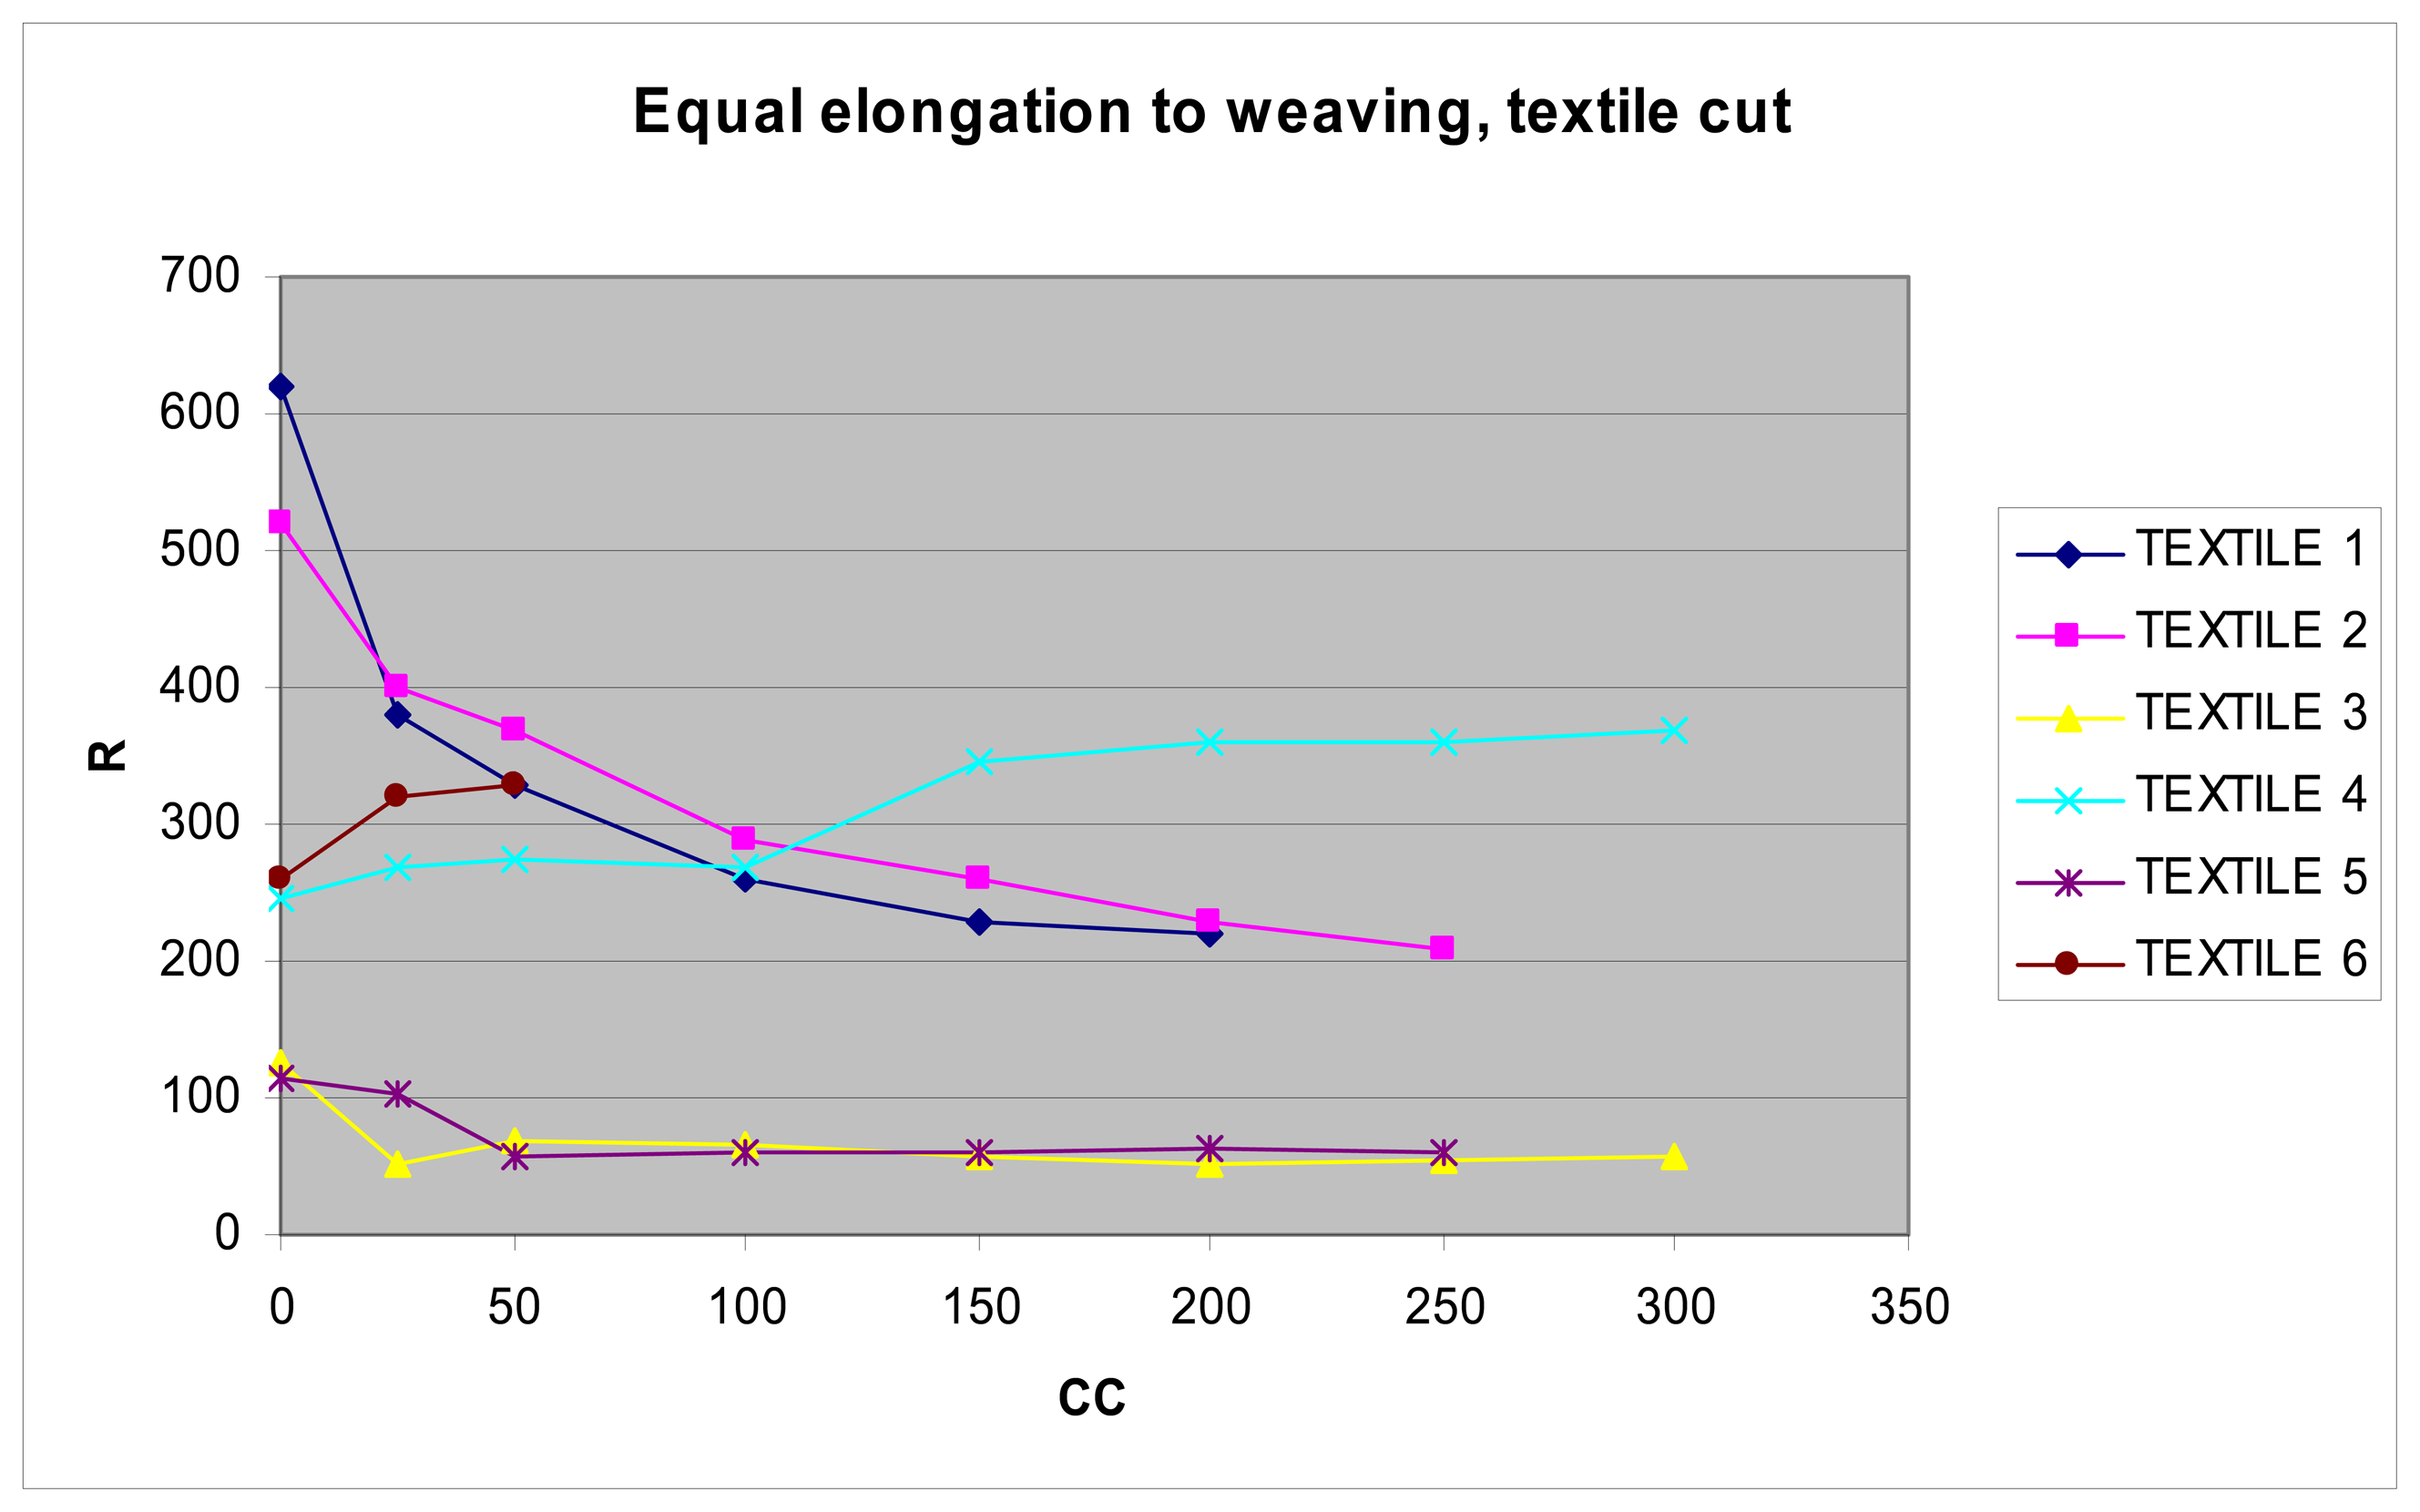
  • Resistance measures of each one of the textiles cut with and woven in the same way and causing an elongation in the same direction as the weaving.
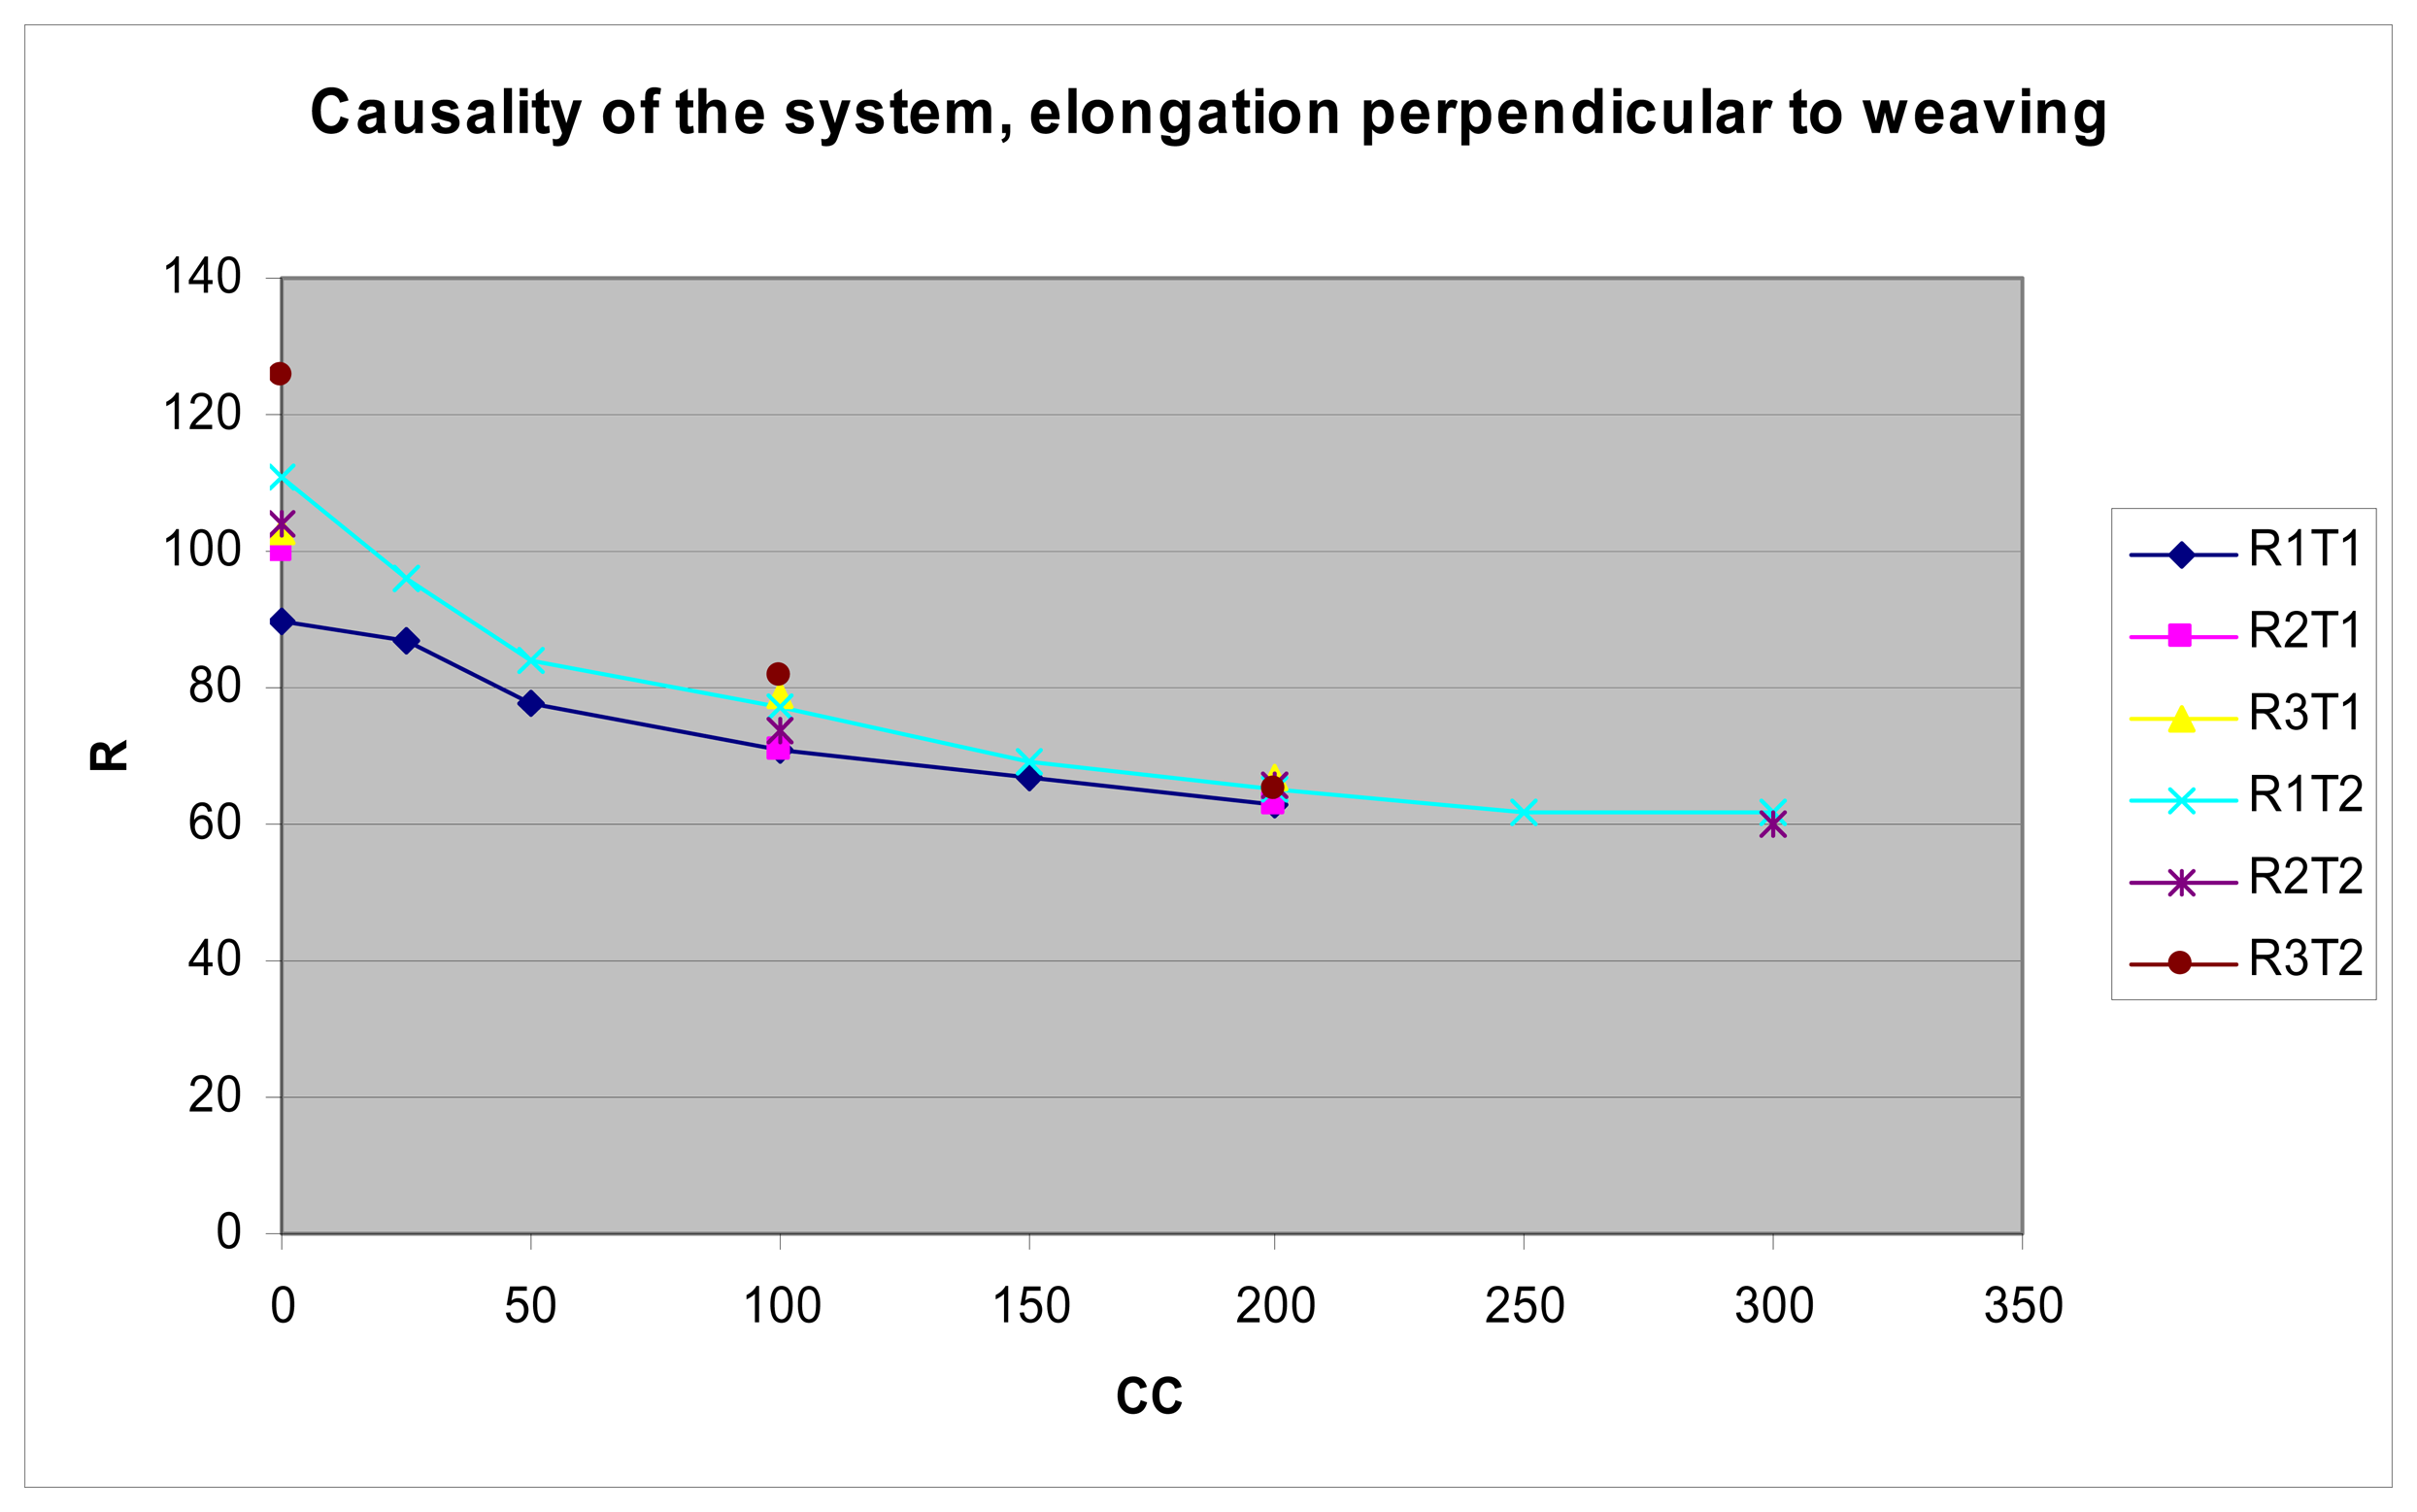
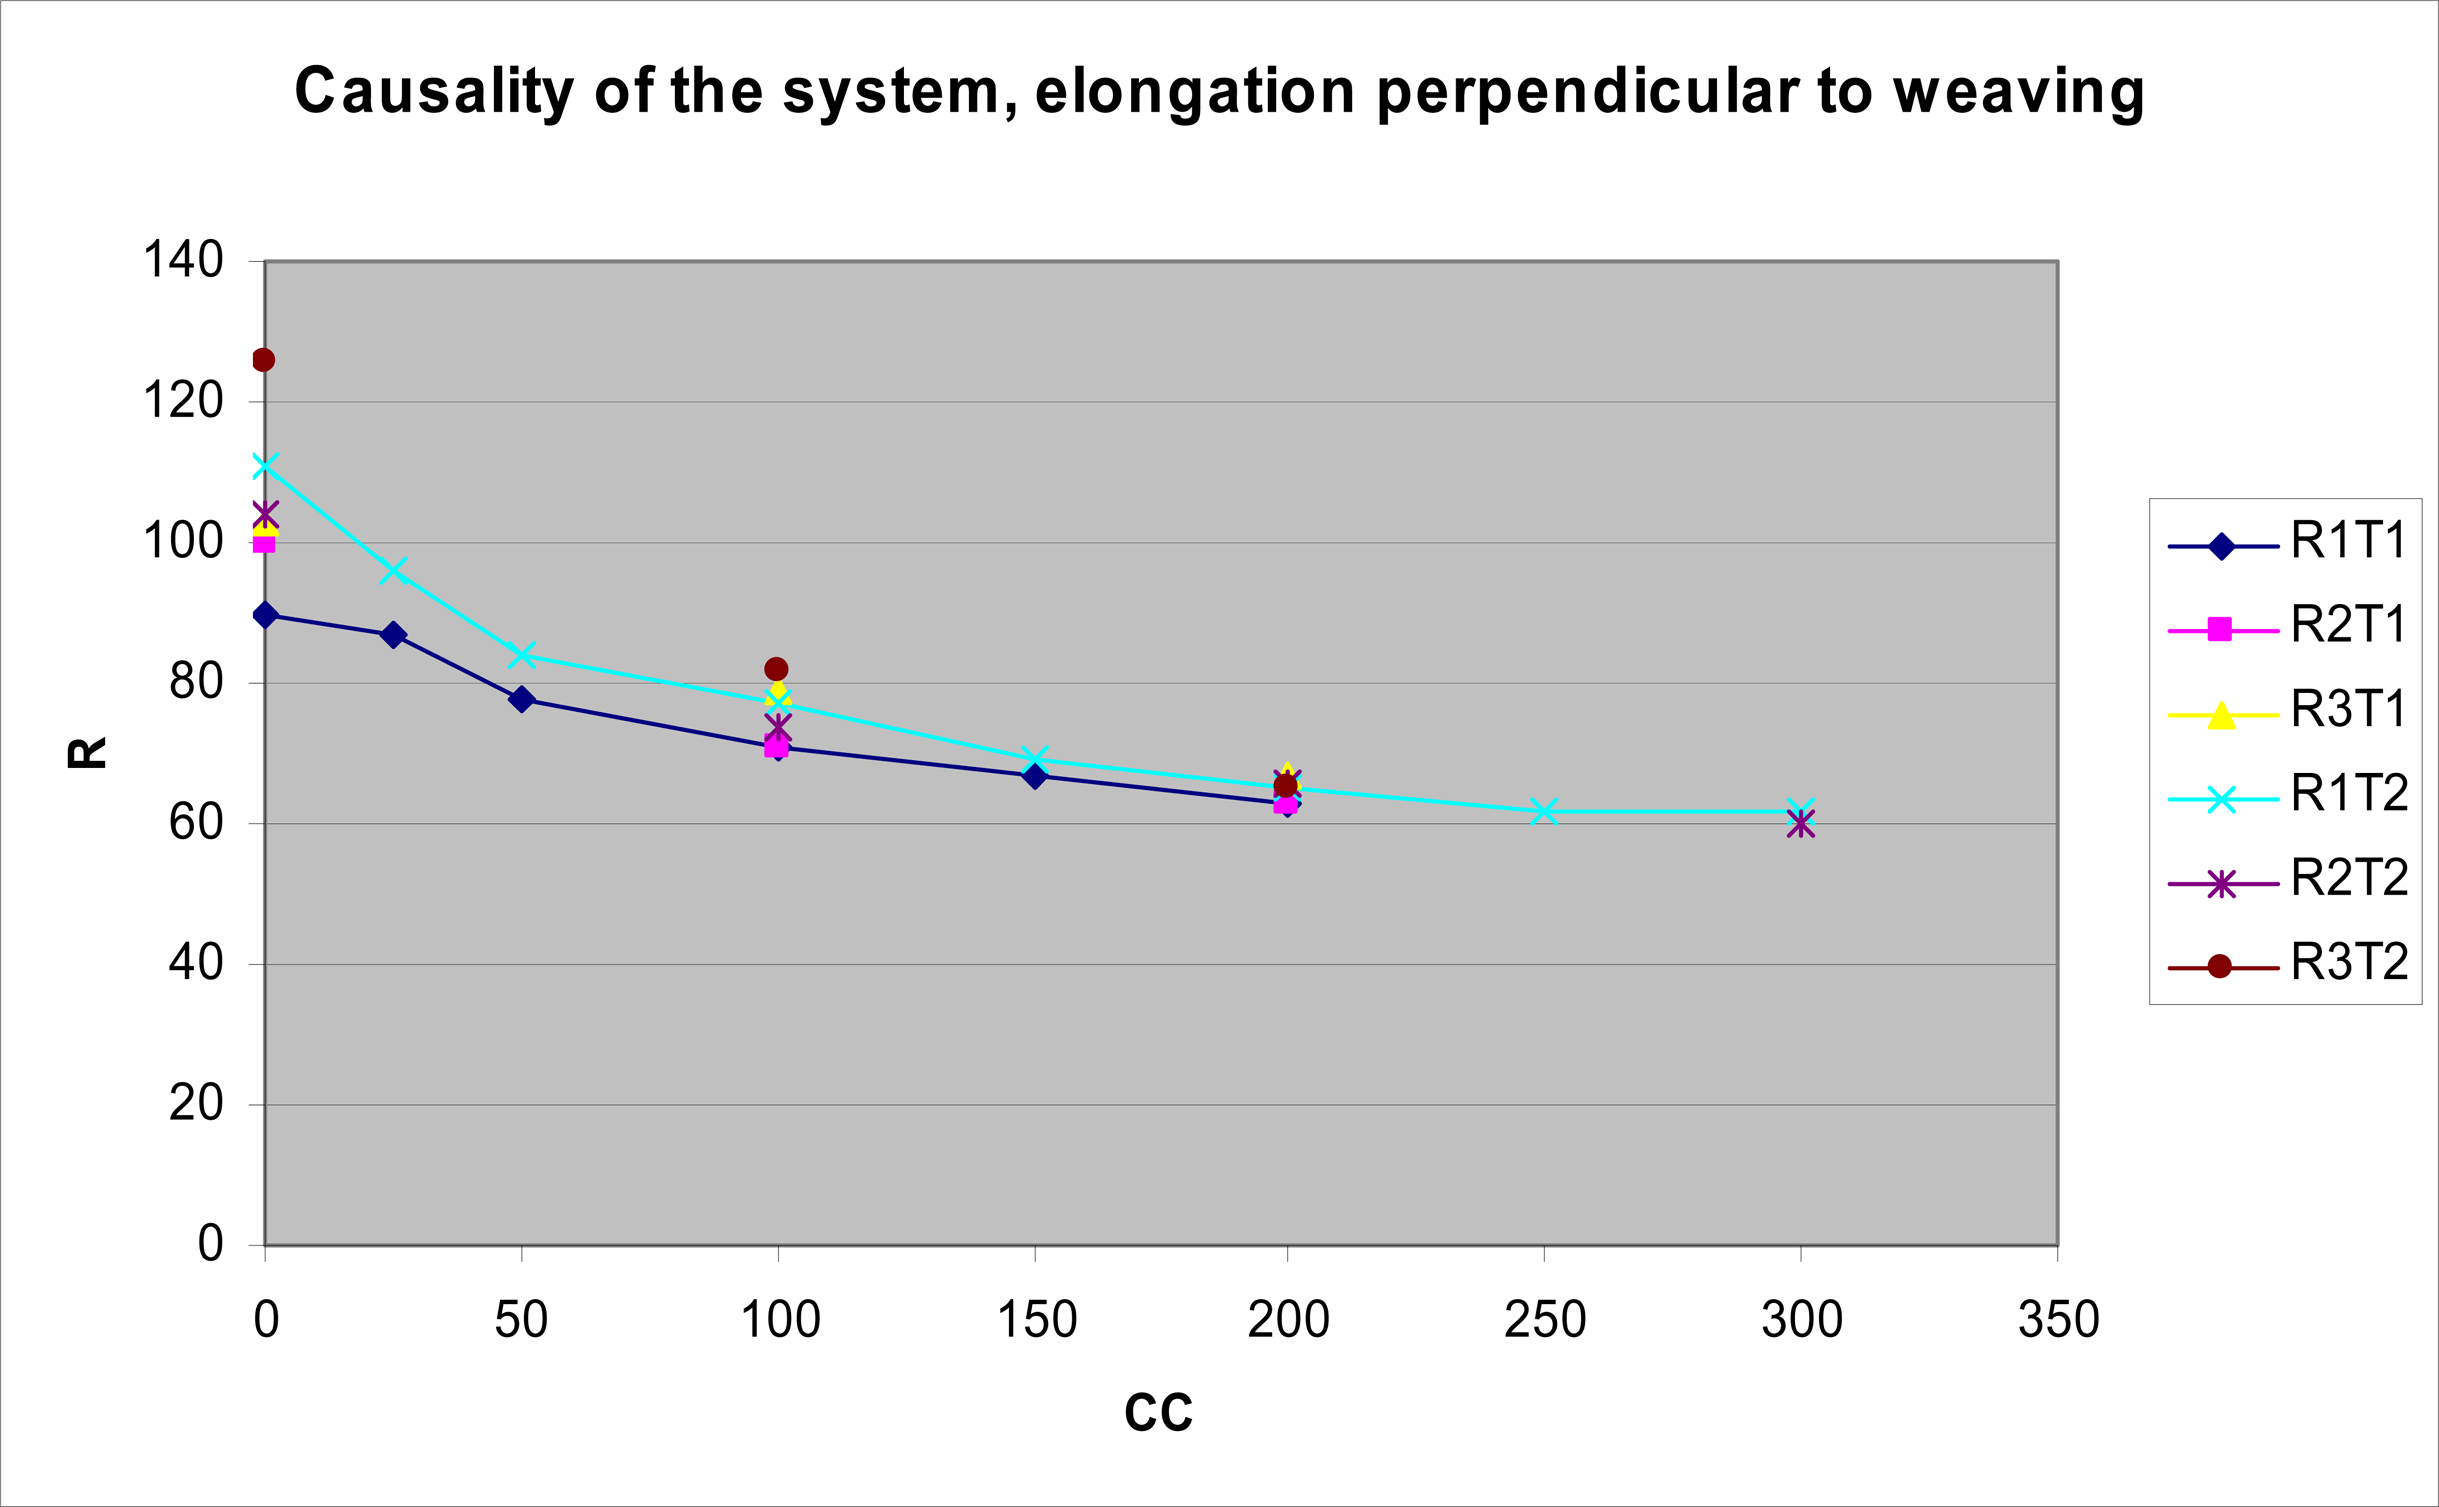
  • Resistance measures of each one of the types of textile cut and woven in the same way and causing an elongation that is perpendicular to the direction of the weaving.
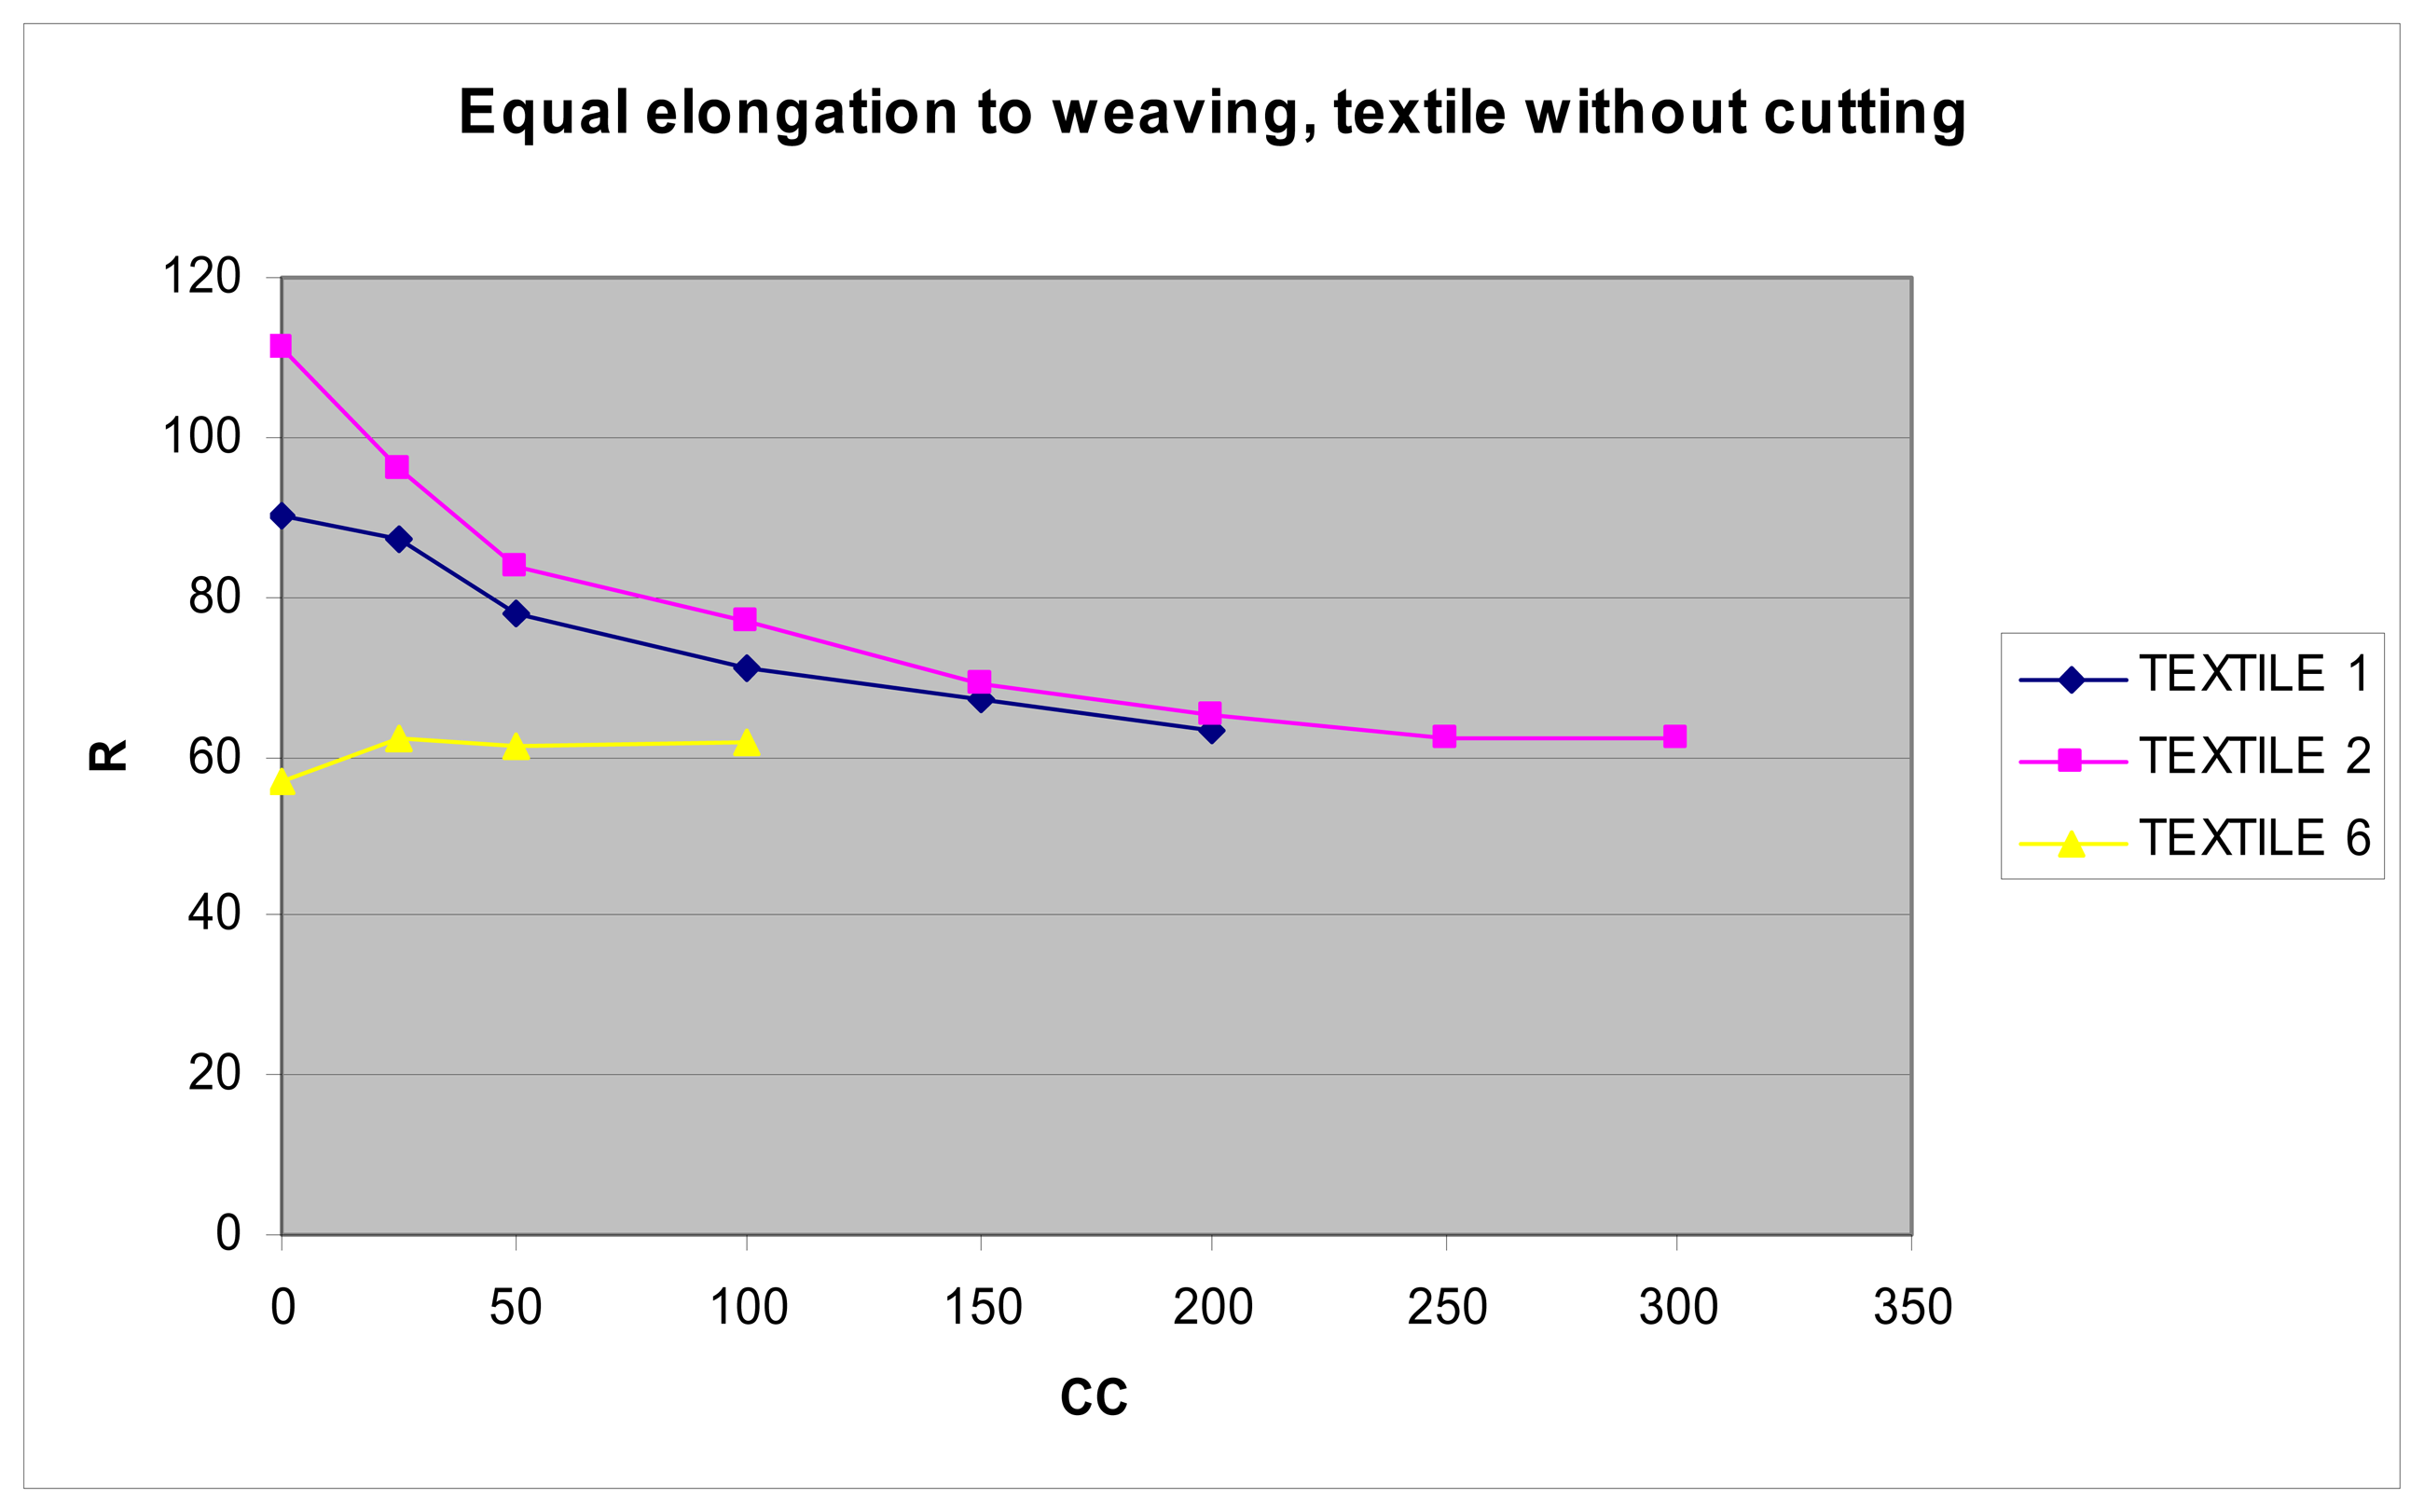
  • Measures of the resistance of each one of the types of uncut textile, causing an elongation in the same direction as the weaving.
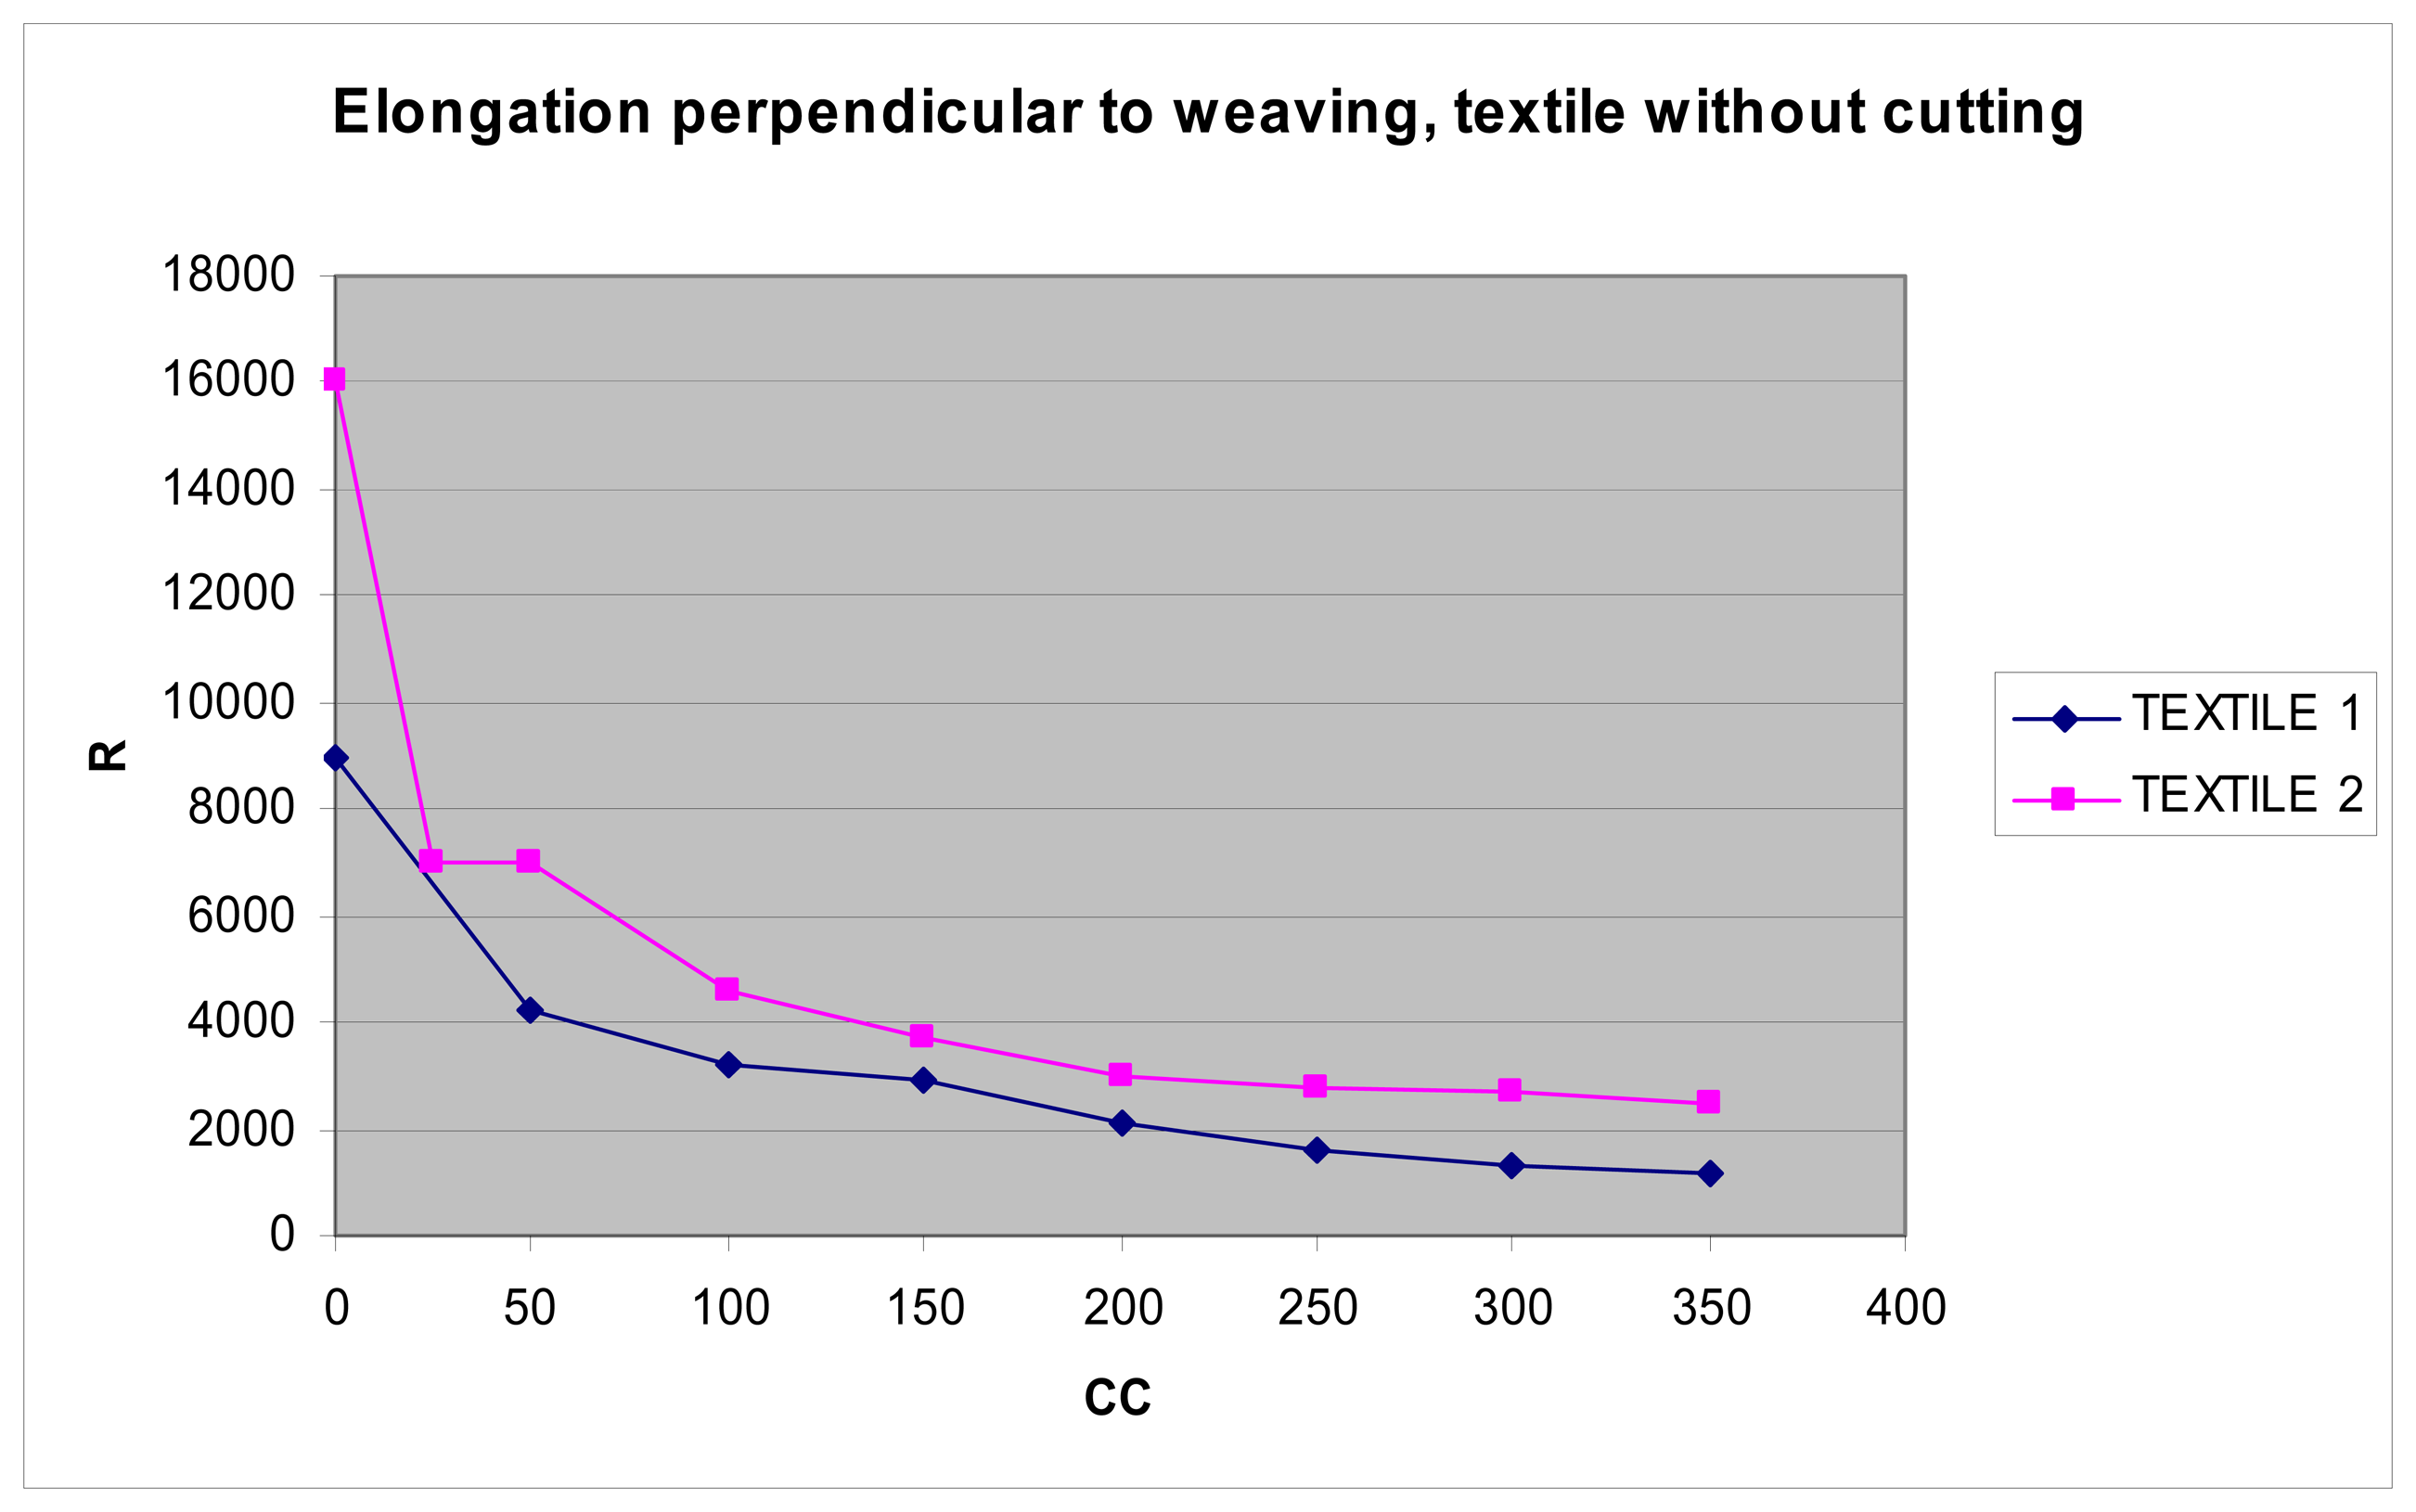
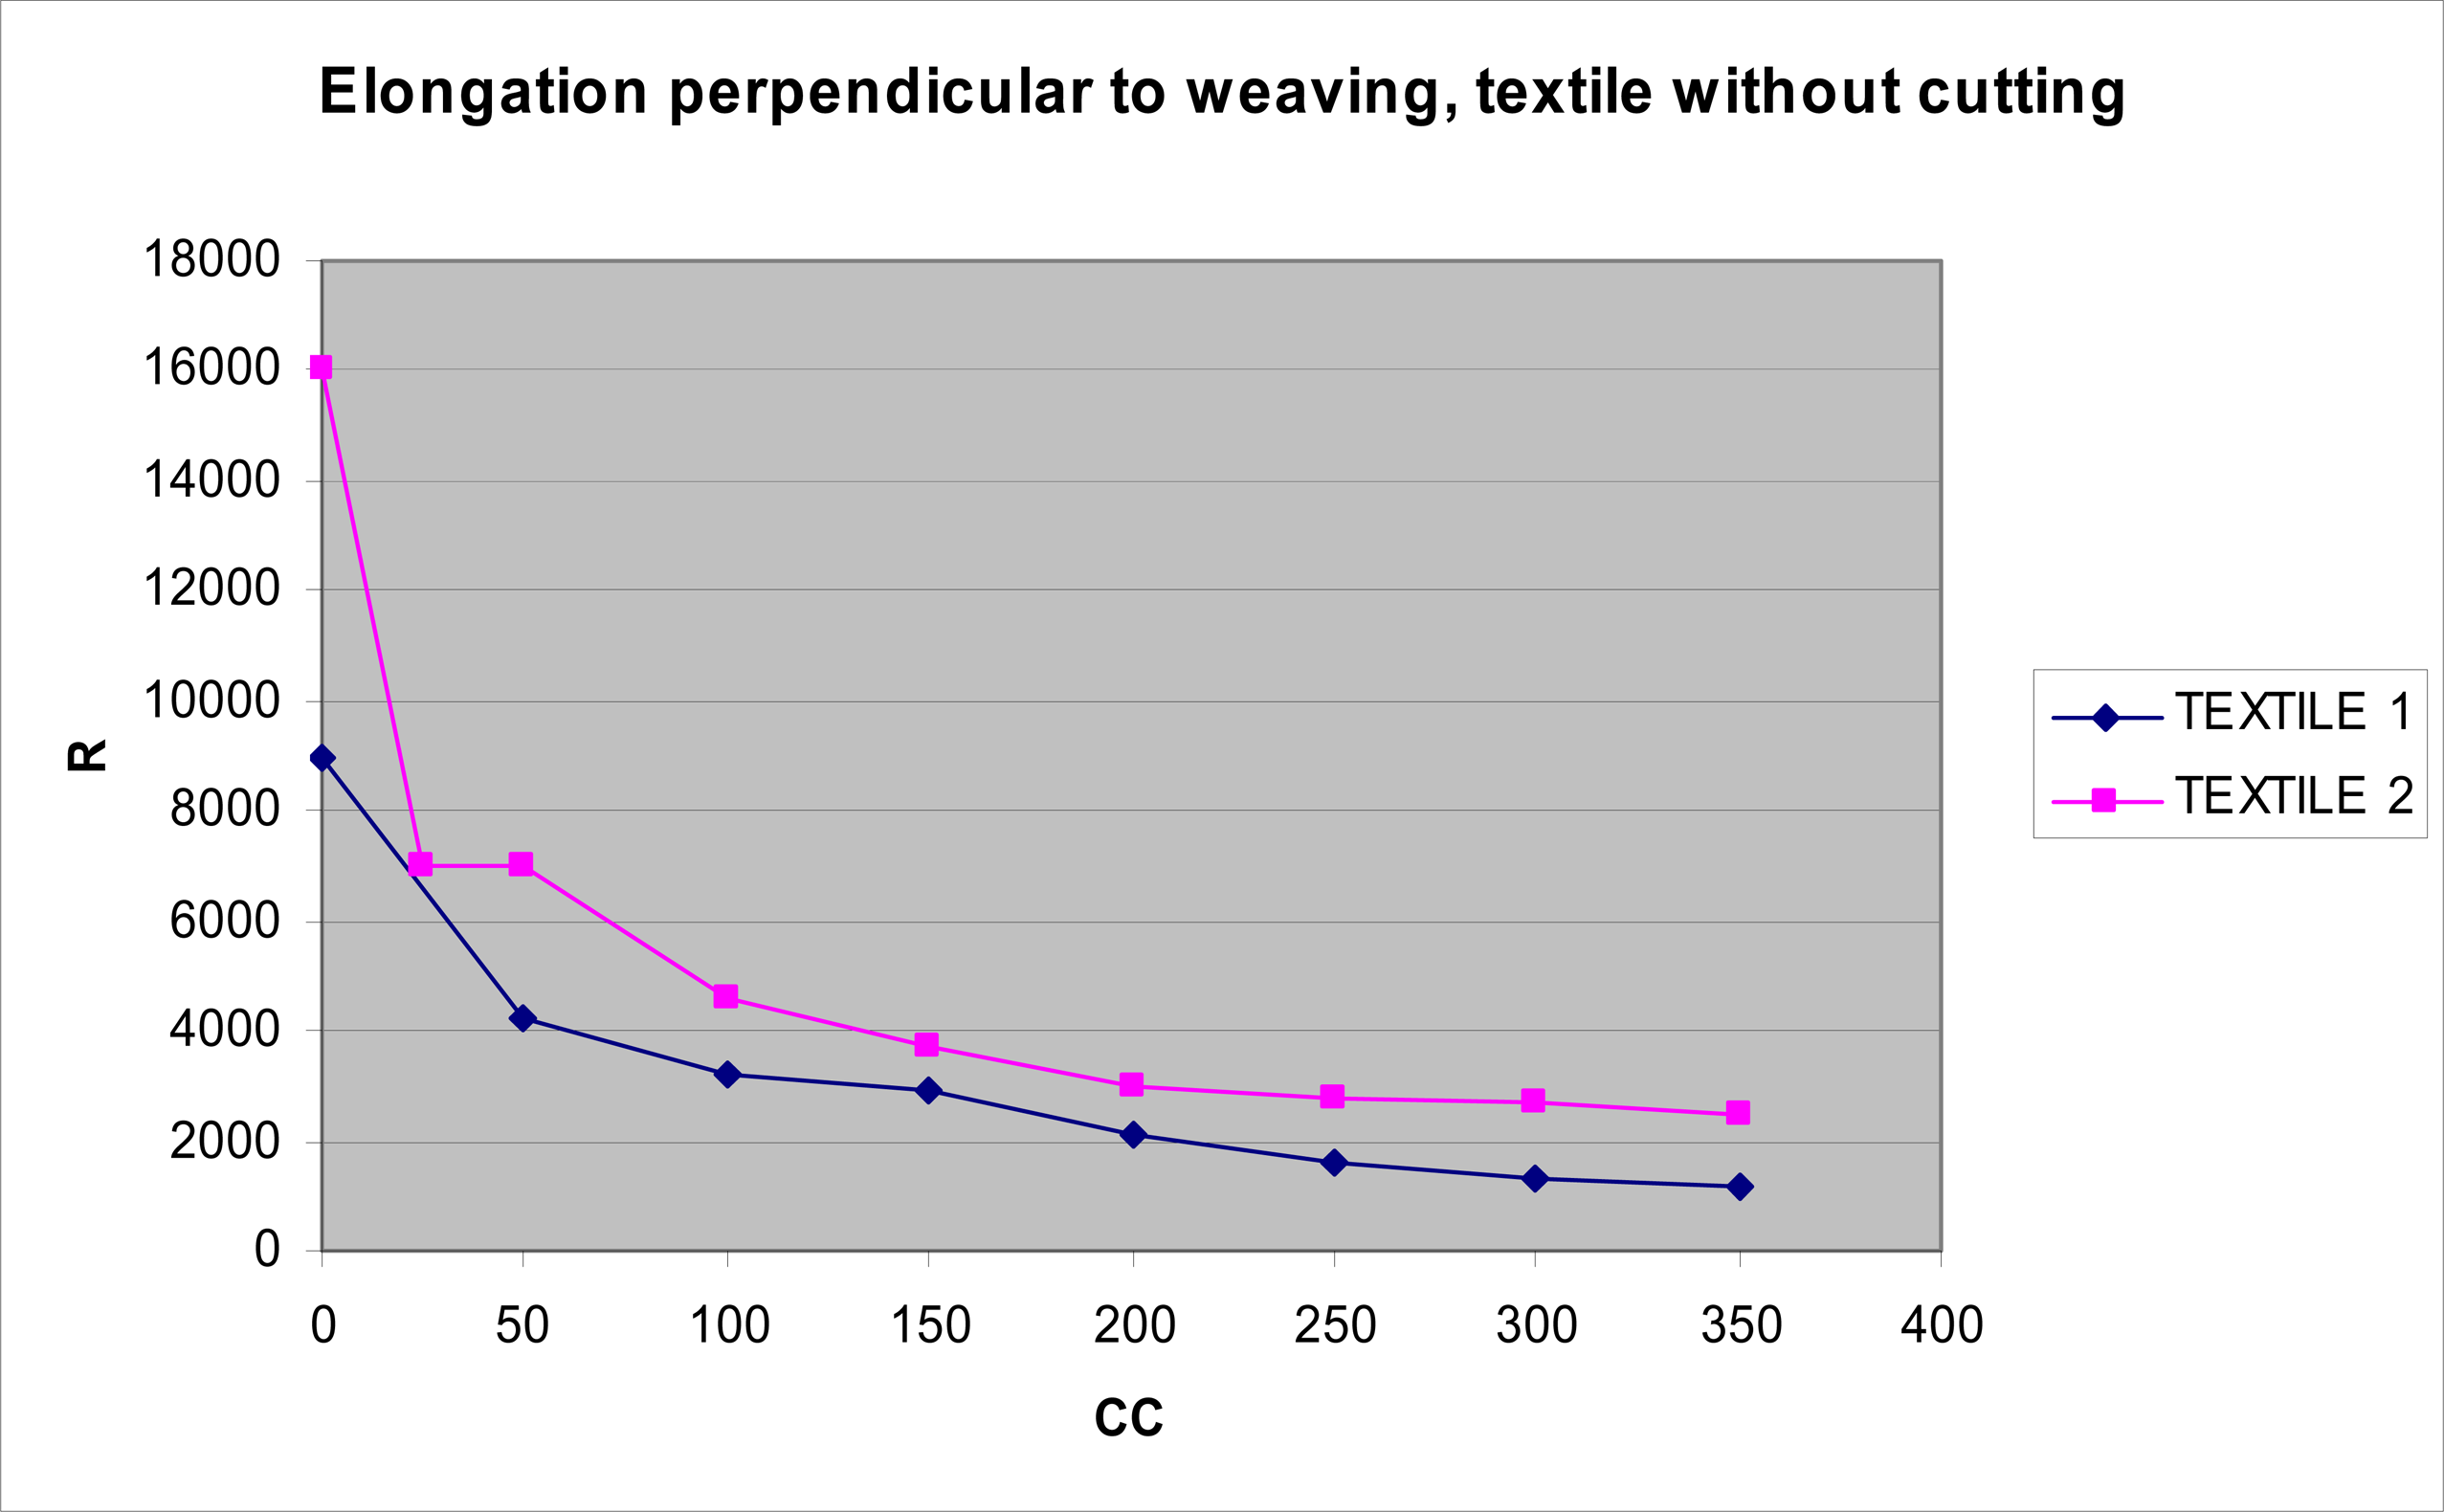
  • Measures of the resistance of each one of the types of uncut textile, causing an elongation that is perpendicular to the direction of the weaving.
  • Measures of the recovery of the resistance value based on successive measures of each one of the uncut fibres, causing an elongation in the same direction as the weaving.
  • Measures of the recovery of the resistance value based on successive measures of each one of the uncut fibres and causing an elongation that is perpendicular to the direction of the weaving.
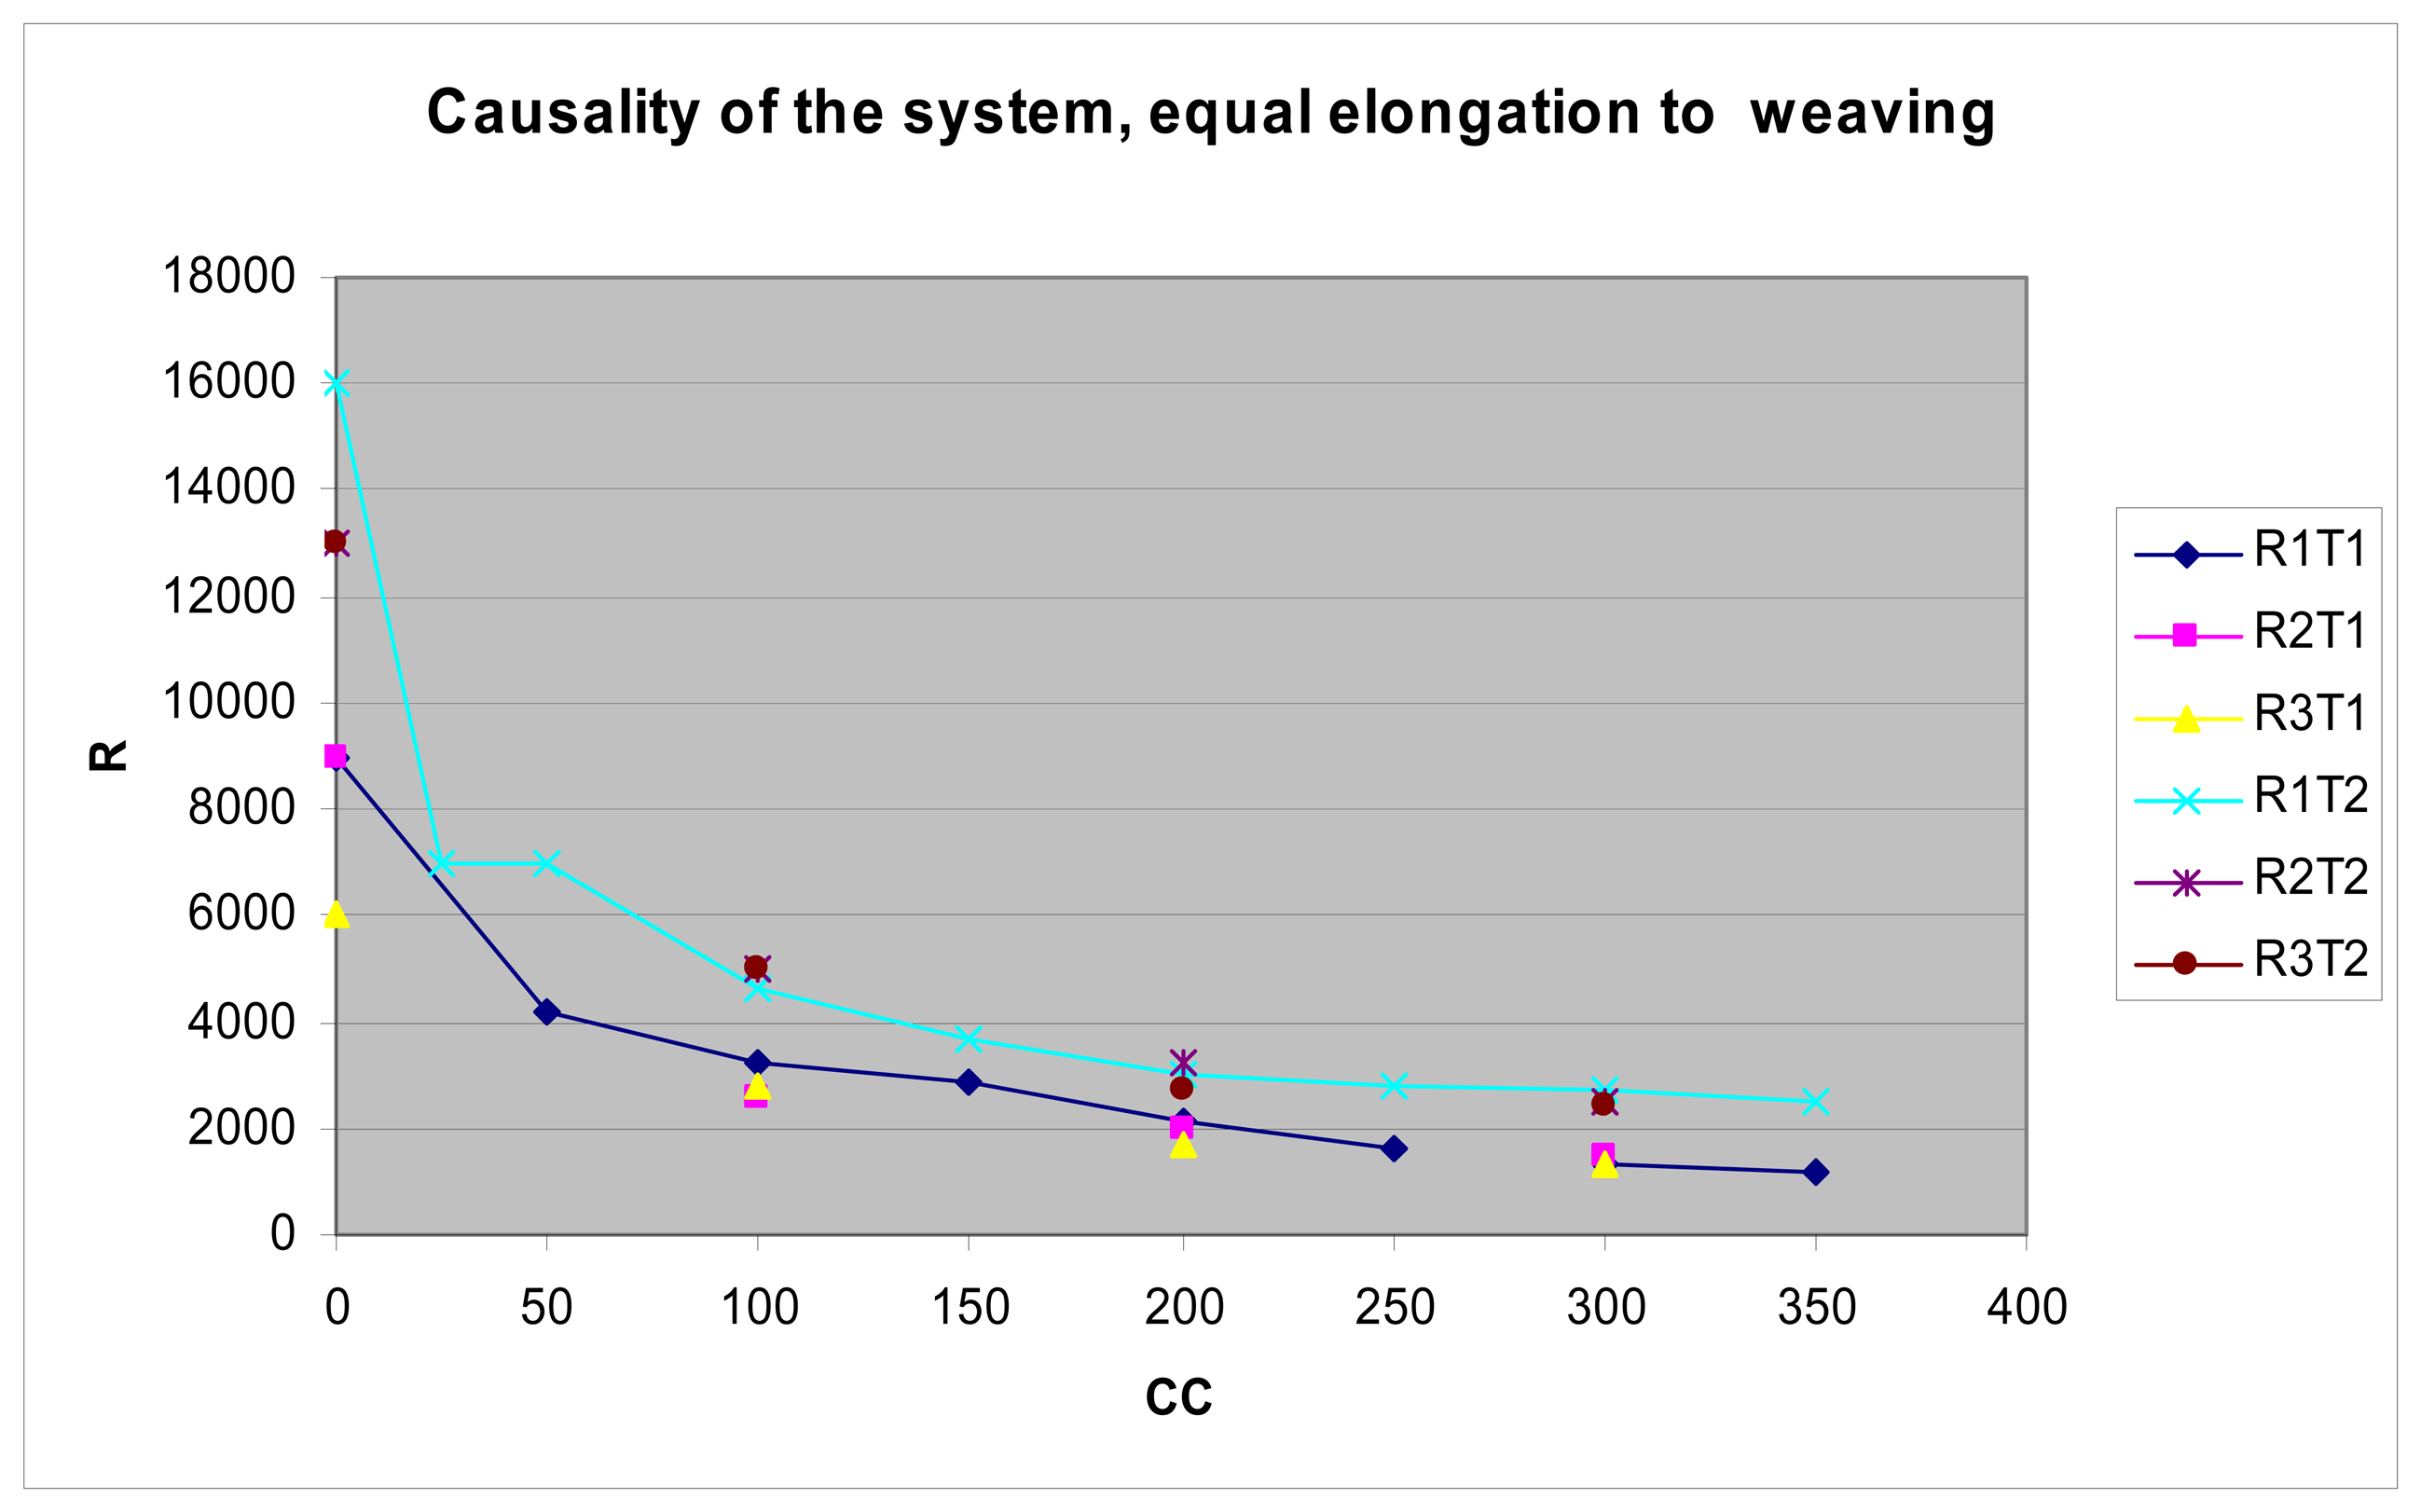
2.2. Tests results

The final results can be seen in the graphics following this section. Figure 4 presents the results of the first test posed in the previous section. It includes the values measured in textile 1 and 2 according to Table 1. They presented a decrease in resistance with the increase of the tension caused to the textile with a variation of the acceptable resistance for a subsequent detection. All the rest of textiles presented an infinite resistance, meaning, a disconnection between the extremes of the textile.
Figure 5 shows the results of the second test. In the results textiles 1 and 2 present a decrease of the resistance value with the progressive increase of the tension. Differently to the previous tests, the start values are much lower, reducing the detection margin. The rest of the textiles do not present an acceptable or caused variation.
Figure 6 shows the test with the uncut textile. As in the first test, textiles 1 and 2 present high enough start values for a wide dynamic detection margin, while the rest do not present the resistance variation with the increase of the tension practiced, and the results are not acceptable.
Figure 7 presents the fourth test. As in figure 5, the start values are lower than in the previous case and acceptable for textiles 1 and 2.
In figures 8 and 9 the test has been repeated three times in order to be able to analyze the causality of the system. It is evident that the progression of resistance in relation to the tension caused on the textile is maintained even when the elongation is caused in the same direction as the weaving. The variation is of an average of 40 ohms of variation compared to the average variation of 800 ohms produced by an elongation that is perpendicular to the direction of the weaving.

2.3 Further considerations

Results can be divided in two groups: those that present a variation of the resistance in relation to the elongation caused to the textile and those that do not present such elongation. If the textile reaches to vary in resistance, it is possible to see how it decreases as the tension produced on the textile increases.
Textiles with the best results are 1 and 2. These are different to the others in the covering of the thread, as the last layer is only silver. This construction allows the thread to make contact with the previous and the later woven threads. We do not observe this variation in the rest of textiles, as the fact that the thread is covered by other materials makes it impossible to contact electronically with the other woven threads.
As the variation observed is related to the contact between woven threads and not the elongation of the thread, the differences observed between a perpendicular elongation and one in the same direction of the weaving can be easily explained. When we pull in the same direction as the weaving we are pulling the same string, the resistance measured is low as the thread is conductor. If we pull in a perpendicular direction, the resistance measured is higher as we are measuring between threads. When we cause an elongation between different threads we are forcing contacts and the total resistance is low.
Based on this principle we can understand the progression experienced: increasing the tension decreases the resistance.

3. Detection of deformation in a specific point

3.1. Experimentation

We part from the principle that causing tension on a textile (type 1 or 2, TABLE 1) produces a decrease of the resistance. Figure 10 reflects the measuring structure to detect if the pressure is caused on zone A or B (not in both at the same time). If pressure is exerted on two different regions A and B of the same row (see Fig. 12) at the same time, the electronic system in its present stage cannot tell that the pressure was exerted on both regions at the same time. If we were interested in detecting the pressures exerted on several regions of the same row in Fig. 12 at the same time, we would have placed the test points following a matrix structure.
Measuring on the test point we can observe that tension increases if the pressure is caused on zone A and decreases if it is caused on zone B.

3.2. Application

Observing this leads us to think of a textile that makes it possible to tell the difference between areas, woven with conductor thread separated by areas woven with non-conductor thread, producing a structure like the following:
The grey strips represent the areas woven with conductor thread and the white strips the areas woven with non conductor thread. This structure allows us to work on completely independent areas and to create different detection areas.
The following graphic represents a final structure, with the feeding and measuring points. The configuration shown in figure 12 allows the detection of pressure in 6 different areas. This is a tactile-textile panel that was presented in a textile fair in Valencia called TextilHogar 2006 (Home Textiles), 21-24/06/2006. The same idea may be applied to others applications with some changes, but the core will be the same.
The test point does not have to necessarily be in the exact center, as we are not searching for an absolute value, but a variation related to a setting without pressure.
The application described in the paper is aimed at detecting six specified areas, and it can be shown easily that the number of areas can be increase as much as the designer wants. Therefore, for the same textile pattern, the higher the number of areas under detection, the smaller the size of the areas.

3.3. Further considerations

The signal from the measuring point allows an adequate detection from a microprocessor, so the analog electronics attached to the sensor are the minimum [3, 4]. This allows the integration in a final robust and optimal intelligent system [5-8].
The causality of the textile used is the present area of our study, as the physical structure of the contacts within the textile in a specific point of pressure deteriorates after an average of 200 uses approximately. This structure allows the behavior of a resolution tactile panel. It is useful if we think of applications that need a positioning on non-uniform surfaces, or deformed structures.

4. Final considerations

Present studies are centered on two areas: the improvement of the textile from the point of view of the proportion of conductor thread used, as well as the structure of the weaving, and the improvement of the detection of the signal from the microprocessor. The results of the experiment have been satisfactory and the have allowed us to test the performance of the system, its feasibility and to patent it

Acknowledgements

This work was supported by the Department of Electronics in the ETSEEI of Enginyeria i Arquitectura La Salle at the Universitat Ramon Llull, Barcelona, Spain.

References

  1. Hernandez, W. Improving the response of a load cell by using optimal filtering. Sensors 2006, 6, 697–711. [Google Scholar]
  2. Chou, T.W.; Ko, F.K. Textile Structural Composites; Elsevier: Amsterdam, 1989. [Google Scholar]
  3. Millman, J. Microelectronics: Digital & Analogs Circuits & Systems; McGraw-Hill: New York, 1979. [Google Scholar]
  4. Malvino, A.P. Electronic Principles, 4th Edition ed; McGraw-Hill: New York, 1997. [Google Scholar]
  5. Hernandez, W. Robust multivariable estimation of the relevant information coming from a wheel speed sensor and an accelerometer embedded in a car under performance tests. Sensors 2005, 5, 488–508. [Google Scholar]
  6. Hernandez, W. Improving the response of a rollover sensor placed in a car under performance tests by using a RLS lattice algorithm. Sensors 2005, 5, 613–632. [Google Scholar]
  7. Hernandez, W. Improving the response of a wheel speed sensor by using a RLS lattice algorithm. Sensors 2006, 6, 64–79. [Google Scholar]
  8. Hernandez, W. A survey on optimal signal processing techniques applied to improve the performance of mechanical sensors in automotive applications. Sensors 2007, 7, 84–102. [Google Scholar]
Figure 1. Tests bench.
Sensors 07 00921f1
Figure 2. Tests bench.
Sensors 07 00921f2
Figure 3. Weaving.
Figure 3. Weaving.
Sensors 07 00921f3
Figure 4. Graphic of the first test presented.
Sensors 07 00921f4
Figure 5. Graphic of the second test presented.
Sensors 07 00921f5
Figure 6. Graphic of the third test presented.
Sensors 07 00921f6
Figure 7. Graphic of the fourth test presented.
Sensors 07 00921f7
Figure 8. Graphic of the fifth test posed.
Sensors 07 00921f8
Figure 9. Graphic of the sixth test posed.
Sensors 07 00921f9
Figure 10. Measuring structure.
Sensors 07 00921f10
Figure 11. Textile thought for areas detection.
Sensors 07 00921f11
Figure 12. Final structure.
Sensors 07 00921f12
Table 1. Specifications of the textiles.
REFERENCETECHNICAL DATA
TEXTILE 1Textile made from 2 cut fibre threads with a composition of 90% cotton and 10% polyamide and silver coating. These threads are woven alternatively, repeating this sequence all through the textile. Each line of thread woven consists of one only thread which is different from the one before and the one after, and equal to the ones before and after those.
TEXTILE 2Textile made from one fibre of cut thread with a composition of 90% cotton and 10% polyamide and silver coating. The textile is made from the same thread but without cutting, so if it is pulled from the start the whole textile can come undone
TEXTILE 3Textile made from 2 continuous threads of silver covered by a fine layer of polyester. This continuous thread is also covered by cotton. These threads are woven alternatively, one each time, repeating the sequence through the whole textile. Each line of thread woven consists of one only thread which is different from the one before and the one after, and equal to the ones before and after those
TEXTILE 4Textile made from 2 continuous threads of silver covered by polyester. This continuous thread is also covered by cotton. These threads enter simultaneously, so the weaving is formed by two different threads each time. This sequence is repeated all through the textile.
TEXTILE 5Textile formed by 1 continuous silver thread covered by a fine layer of polyester. This continuous thread is also covered by cotton fibres. The textile is made of the same uncut thread, so if it is pulled from the start the whole textile can come undone.
TEXTILE 6The same textile as Textile 5 except for the dye treatment.

