Article

Improvement of Bioactive Compound Classification through Integration of Orthogonal Cell-Based Biosensing Methods

by
Frank W. R. Chaplen
1,*,
Ganesh Vissvesvaran
2,
Eric C. Henry
3 and
Goran N. Jovanovic
2
1
Department of Biological and Ecological Engineering, Oregon State University, 116 Gilmore Hall, Corvallis, OR 97331, USA
2
Department of Chemical Engineering, Oregon State University, 103 Gleeson Hall, Corvallis, OR 97331, USA
3
Department of Botany and Plant Pathology, Oregon State University, 2082 Cordley Hall, Corvallis, OR 97331, USA
*
Author to whom correspondence should be addressed.
Sensors 2007, 7(1), 38-51; https://doi.org/10.3390/s7010038
Submission received: 14 December 2006 / Accepted: 18 January 2007 / Published: 21 January 2007

Abstract

:
Lack of specificity for different classes of chemical and biological agents, and false positives and negatives, can limit the range of applications for cell-based biosensors. This study suggests that the integration of results from algal cells (Mesotaenium caldariorum) and fish chromatophores (Betta splendens) improves classification efficiency and detection reliability. Cells were challenged with paraquat, mercuric chloride, sodium arsenite and clonidine. The two detection systems were independently investigated for classification of the toxin set by performing discriminant analysis. The algal system correctly classified 72% of the bioactive compounds, whereas the fish chromatophore system correctly classified 68%. The combined classification efficiency was 95%. The algal sensor readout is based on fluorescence measurements of changes in the energy producing pathways of photosynthetic cells, whereas the response from fish chromatophores was quantified using optical density. Change in optical density reflects interference with the functioning of cellular signal transduction networks. Thus, algal cells and fish chromatophores respond to the challenge agents through sufficiently different mechanisms of action to be considered orthogonal.

1. Introduction

The pollution of surface and ground water due to the byproducts of ever increasing industrial, agricultural and other human activities often places severe physiological stress on many aquatic ecosystems. These pollutants, including heavy metals, herbicides and pesticides, can cause damage to aquatic habitats. Specific detectors derived from nucleic acid and other molecular recognition technologies have the major advantage in identifying unknown bioactive agents. However, a high specificity can be a disadvantage because much of what is toxic in the environment is unidentified or ill-characterized. Non-specific detectors of bioactivity, such as tissue-based biosensors, have the advantage of being responsive to a wide range of bioactivities. Further analysis is then generally necessary to identify the unknown bioactive agent. The development of better methods for classifying unknown bioactive agents and environmental pollutants by type and mechanism of action is an important step in increasing the range of possible applications. More specifically, new methods can decrease the cycle time associated with non-specific detection approaches. Orthogonal methods that integrate different modes of detection more effectively capture the type and mechanism of action of bioactive compounds and are less subject to systematic errors than individual detection methods.
Many fish, amphibian and reptile species are capable of changing their color in response to a wide variety of environmental stimuli. This adaptation is used for camouflage, intra-species communication, and thermoregulation. In response to environmental cues, the migration of pigments in the chromatophores offers a considerable scope for their use as non-specific biosensors. This movement can easily be detected and quantified using microscopy and image analysis. Karlsson et al. [1] used fish scale encapsulated chromatophores in the medical diagnosis of bacteria producing pertussis toxin, which are responsible for whooping cough. Elwing et al. [2] monitored catecholamine levels in human blood plasma using fish scales. Chaplen et al. [3] developed a portable device capable of detecting certain environmental toxins and toxins produced by bacterial pathogens through monitoring changes in pigment granule distribution in isolated fish chromatophores.
Algae and cyanobacteria are present in all surface waters exposed to sunlight. Exposing these cells to toxins can result in either the disruption of the structural integrity of chlorophyll (upstream effect) or inhibition of electron transport in the photosynthetic electron transfer train (downstream effect). Both of these effects can be quantified through fluorescence measurements. Altamirano et al. [4] reported on a genetic approach for improving the specificity of detection of chemical compounds by green algae. A TNT-resistant mutant of Dicytosphaerium chlorelloides was used in conjunction with a wild-type strain to identify TNT. Rizzuto et al. [5] tested a biosensor consisting of Photosystem II (PSII) particles of the cyanobacterium Synechococcus elongatus for detection of herbicides in three river samples. Naessens et al. [6] detected a response to atrazine, simazine, and diuron using a Chlorella vulgaris biosensor. Rodriguez et al. [7] developed an algal-based detector for toxins in primary source freshwater drinking samples. This system detected potassium cyanide, methyl parathion, (N′3,4-dichlorophenyl)-N, N-dimethylurea and paraquat using background matrices obtained from the Tennessee and Clinch Rivers.
The choice of four bioactive compounds reflects the goal of this study to demonstrate the feasibility of an orthogonal biosensor system that integrates outputs from M. caldariorum and B. splendens to detect and classifying a broad range of bioactive substances. Mercury, obtained from mercury chloride in this study, is a heavy metal toxin and an environmental contaminant that strongly inhibits photosynthetic electron transport in photosynthetic organisms, with photosystem II being the most sensitive target. Previous studies using mercury chloride have demonstrated that chlorophyll fluorescence analysis can be used as a useful physiological tool to assess early stages of change in photosynthetic performance of algae in response to heavy metal pollution [8]. Clonidine is a commonly used antihypertensive agent that binds to the α2-adrenergic receptor. This ligand-receptor binding induces the activation of Gi proteins. The process triggers a cascade of events in which adenyl cyclase is inhibited, causing a decrease in cAMP levels. This, in turn, deactivates PKA, which leads to dephosphorylation and aggregation of chromatophores [9]. Sodium arsenite is a confirmed human carcinogen, and is used in herbicides, pesticides and insecticides. Other common applications of arsenic are in ceramic manufacture, computer chips, and embalming. In addition, some water supplies contain naturally hazardous concentrations of arsenic. Common effects in fish are seen in accumulation, avoidance, behavior, biochemistry, growth, histology, morphology, mortality, and physiology. This toxin affects protein and energy metabolism in humans and fish [10, 11]. Paraquat dichloride is an herbicide used on a variety of crops. This compound penetrates into the cytoplasm, causing the light-mediated formation of peroxides and free electrons which damage cell membranes. Paraquat inhibits photosynthesis in algae by accepting an electron from photosystem I and passing it to O2, forming superoxide (O2-). An increase in fluorescence is therefore observed. Paraquat dichloride is slightly toxic to fish on an acute basis, with LC50 values ranging from 13 ppm on a 24% formulated product to 156 ppm on material that was 29.1% cationic paraquat [12,13].
The reliable monitoring of the environment for pollutants requires the development of non-specific detection systems with better classification efficiencies and a broader range of applicability. However, classification in this instance does not mean quantification, but rather implies an indication of the presence of toxic compounds. In this study, algal cells and fish chromatophores are challenged with the four toxins described above: paraquat, mercuric chloride, sodium arsenite and clonidine. This study demonstrates that the combined use of algal cells (M. caldarioum) and chromatophores isolated from the Siamese fighting fish (B. splendens) results in much improved efficiency of classification of bioactive substances.

2. Results and Discussion

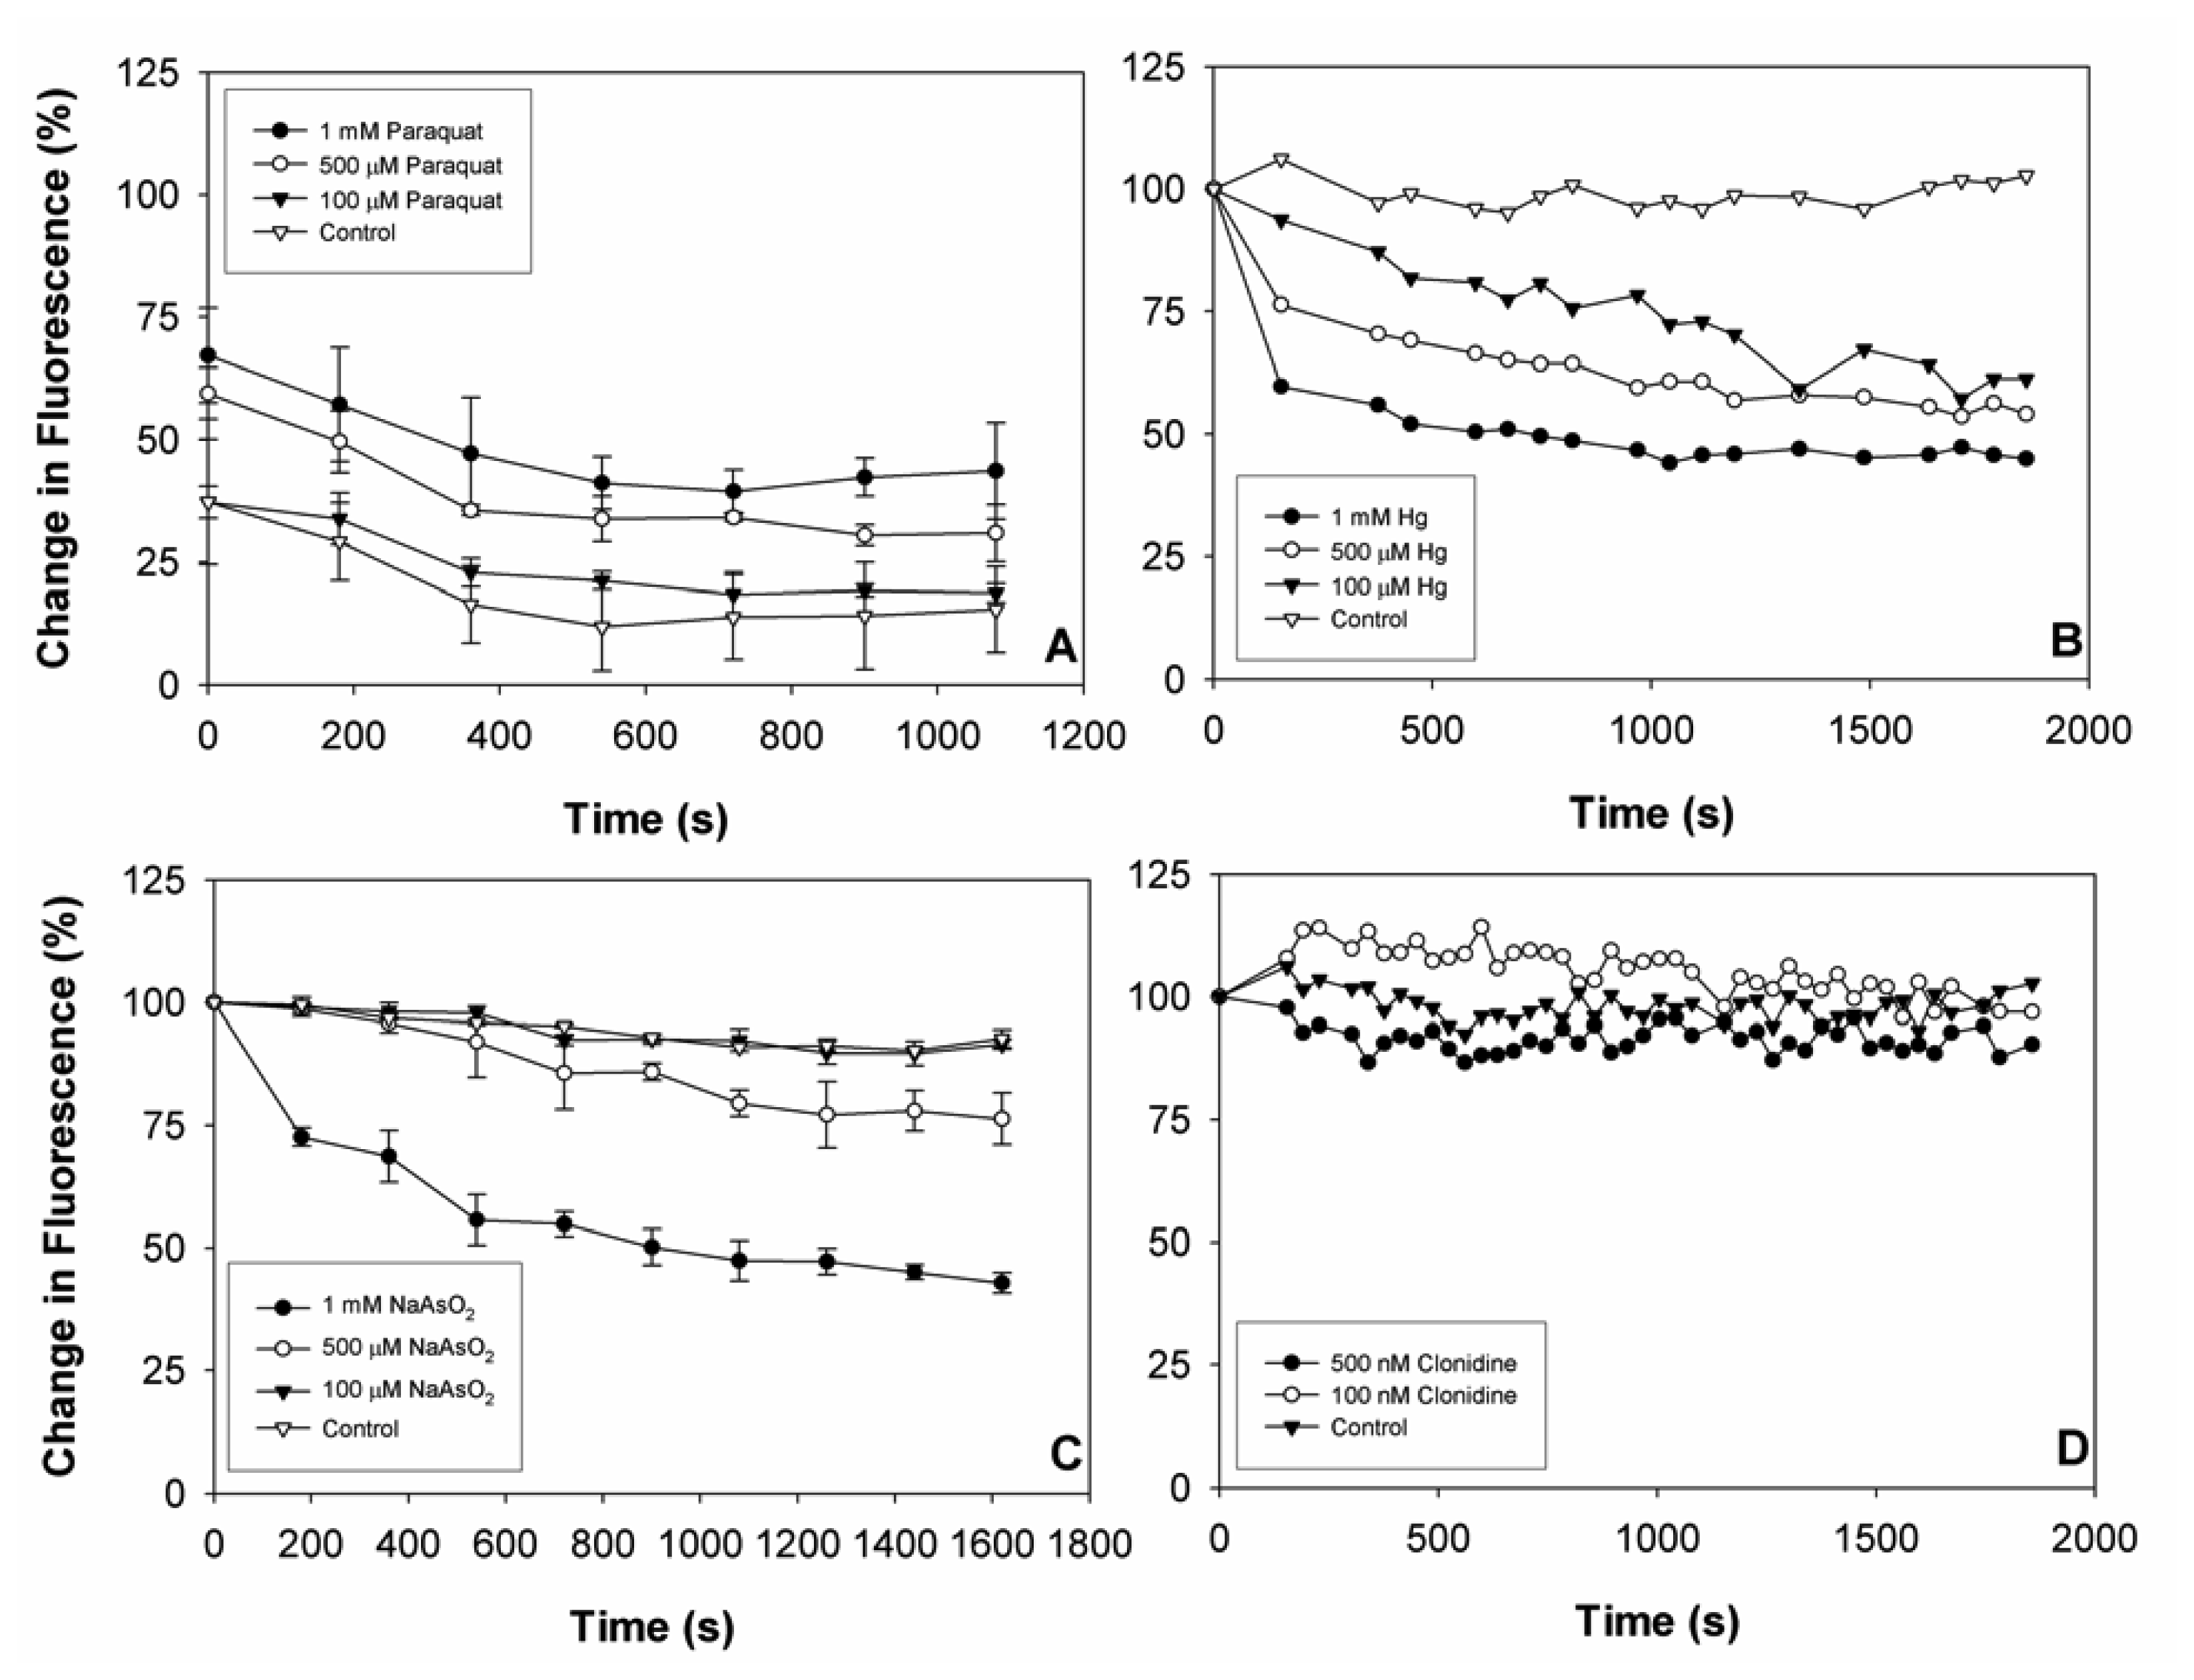
2.1 Algal responses to model compounds

Example responses of algae to the model compounds are shown in Figure 1. The paraquat dose response of M. caldariorum cells is shown in Figure 1A. Algal cells were exposed to light for 10 minutes after toxin addition at a light intensity of 400 Lux in order to increase peroxide production and improve sensitivity. This resulted in different initial starting values for the fluorescence measurements. However, the starting values were consistent for each concentration of paraquat. Fluorescence increases were observed at all paraquat concentrations indicating inhibition of photosynthesis. The slight increase in fluorescence in the control sample can be attributed to the light exposure. After reaching the peak fluorescence value, the sensitivity of the cells deteriorates due to continuous exposure to light. This phase is characterized by an exponential decay of fluorescence levels.
The mercury dose response is shown in Figure 1B. Algae exhibit a decline in the presence of mercury. Mercury, like some other heavy metals, has the potential to replace magnesium as the central metal in chlorophyll under low light intensities. Mercury has a poisonous effect on the photosynthetic pigments, damaging their structure. In addition, high light intensities prevent the formation of heavy metal chlorophylls, thus experimental conditions were selected to avoid this effect.
The arsenite dose response is shown in Figure 1C. Arsenite upsets plant metabolism and interferes with normal growth by entering into reactions in place of phosphate. Besides being absorbed and translocated similarly to phosphates, it is a substitute for essential phosphate under many conditions. This leads to rapid decrease in fluorescence and mortality after treatment.
The clonidine dose response is shown in Figure 1D. Clonidine, a neuroactive agent, is an agonist at central α2-adrenergic receptors. In our study, the two different nanomolar concentrations of clonidine failed to evoke any strong perceivable response from the algal cells. Reports indicated that algae contain G-protein linked pathways. However, the effect of clonidine on M. caldariorum was indeterminate indicating that primitive eukaryotic cells such as those that comprise M. caldariorum may not possess receptors (GPCRs) for signal transduction similar to those in more complex species.

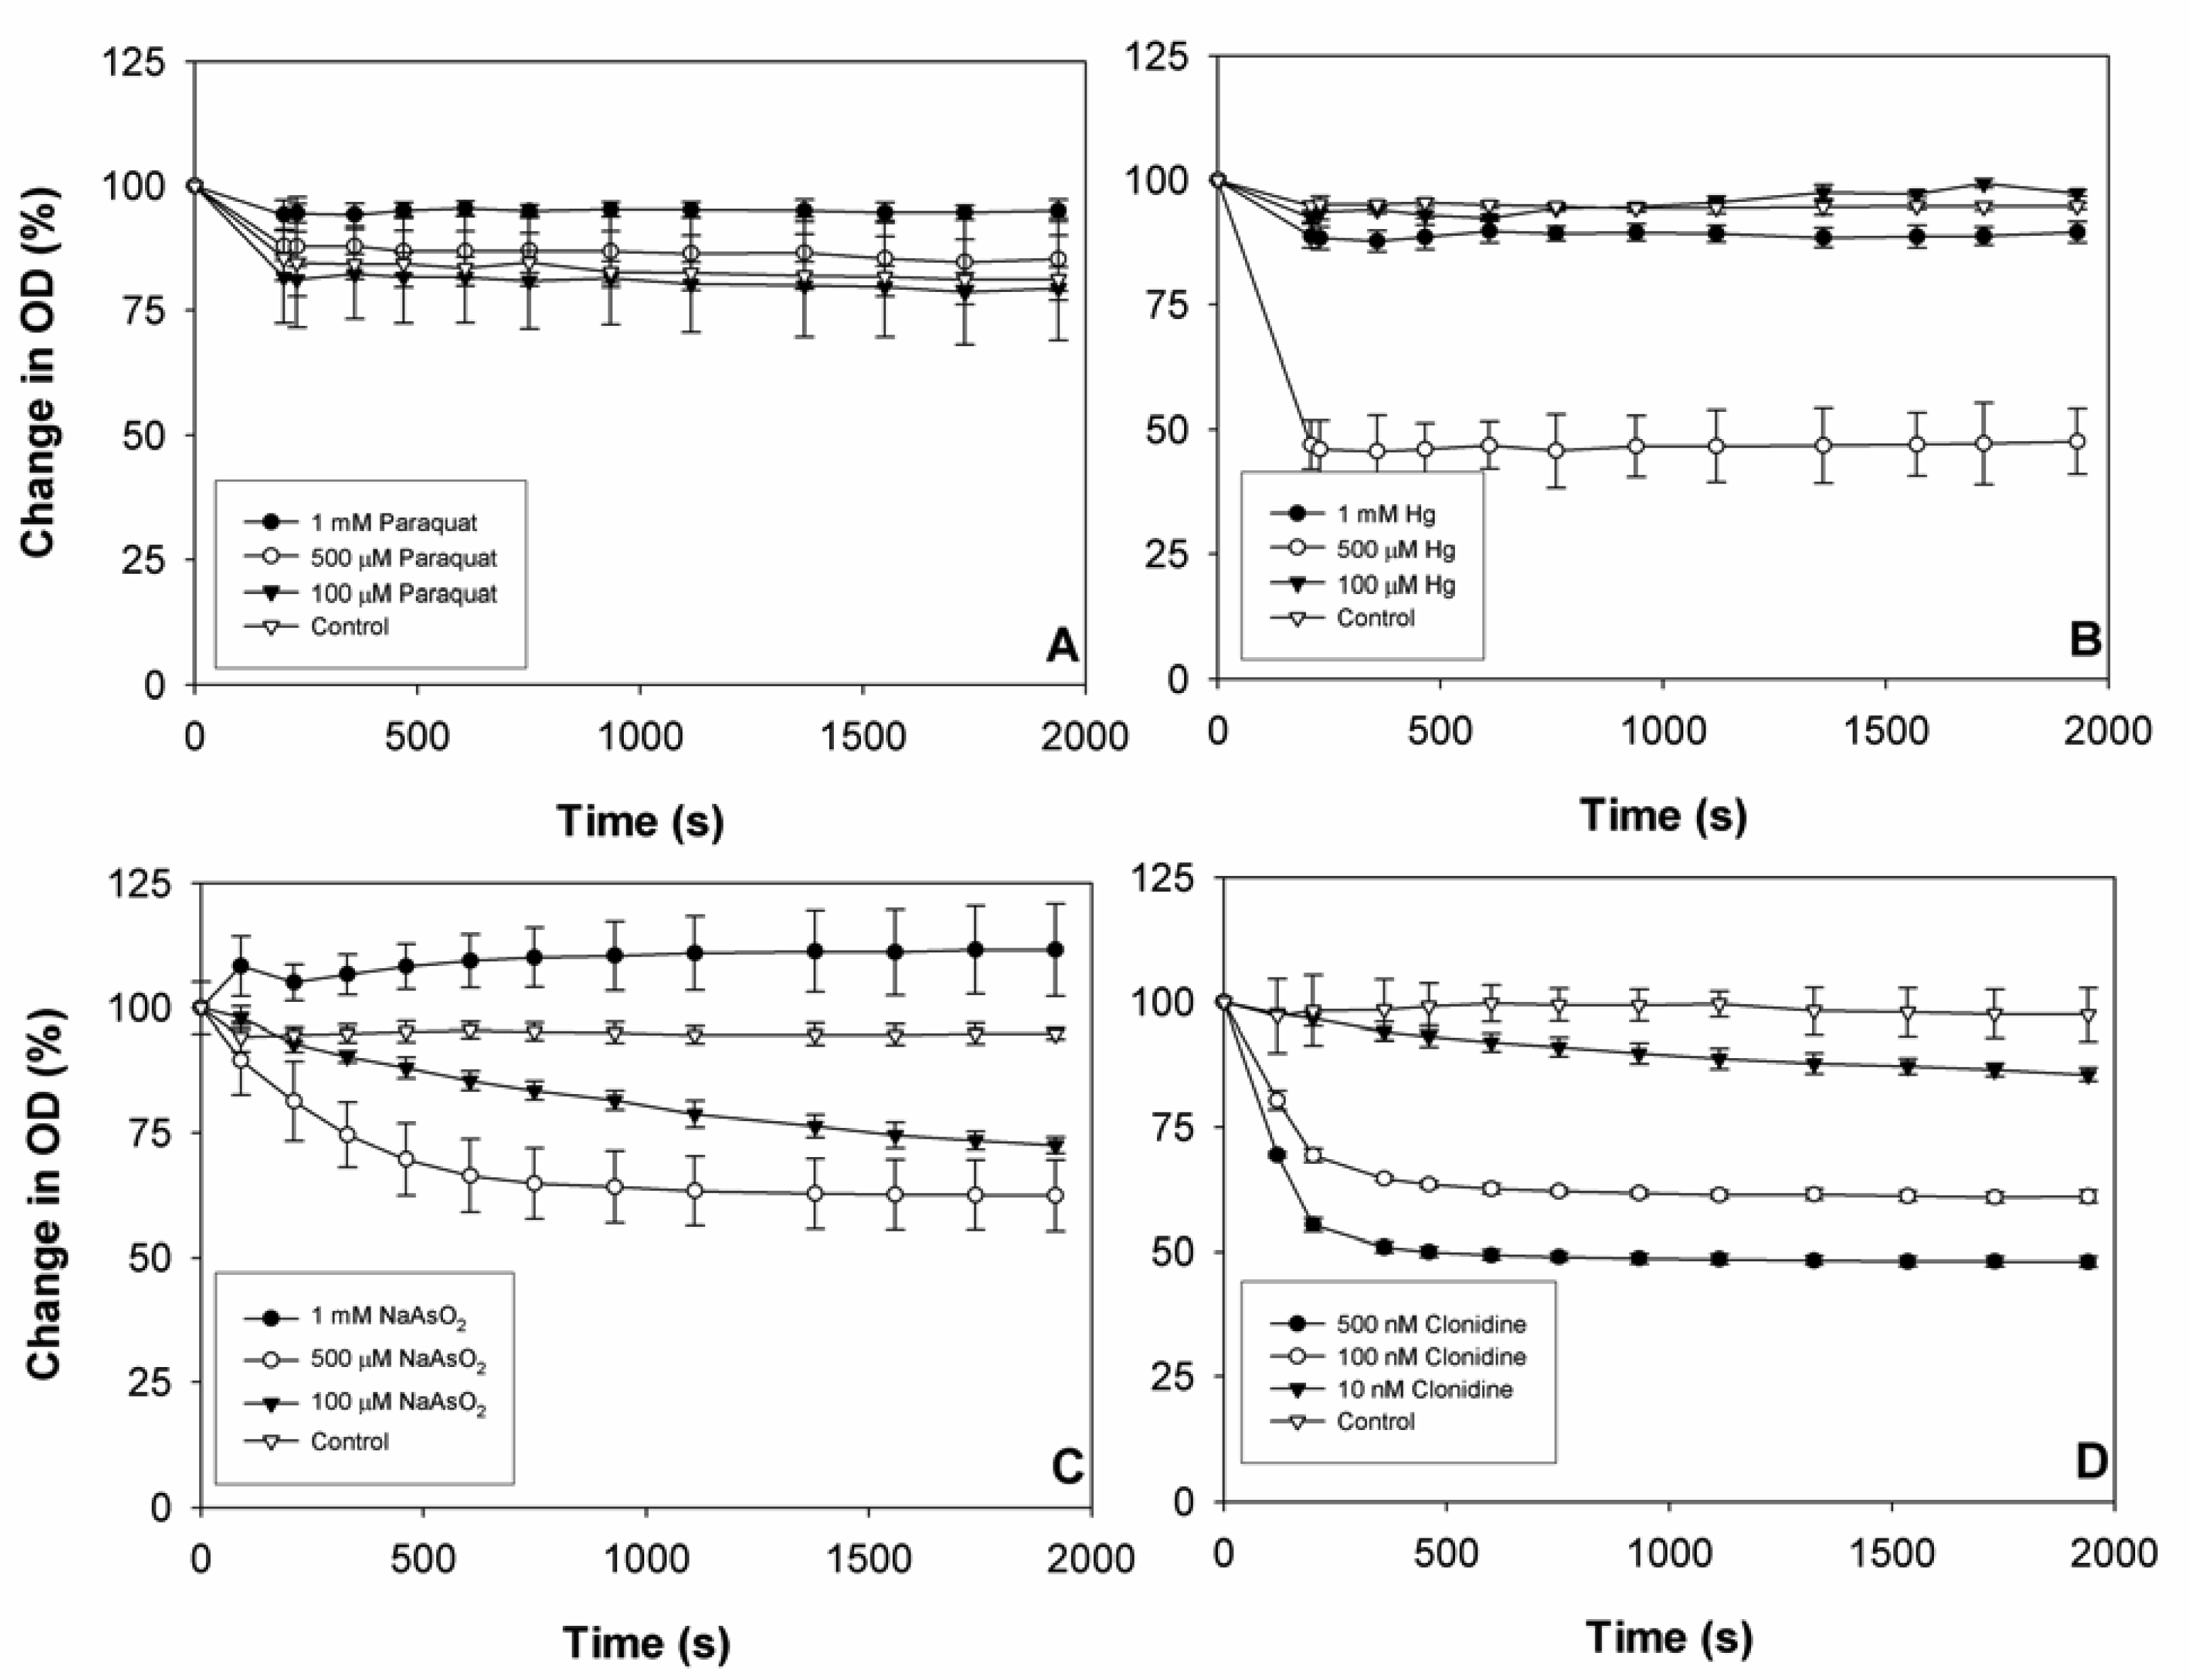
2.2 Chromatophore response to model compounds

Example responses of chromatophores to the model compounds are shown in Figure 2. Figure 2A shows the dose response of chromatophores to paraquat. Chromatophores respond with movement of chromatosomes (dye particle organelles) along microtubules resulting in a change in measured optical density. Application of paraquat yielded similar threshold responses with all three concentrations. The response curves clearly show that lower concentrations of 50 μM and 100 μM inhibited changes in the optical density readings by 20%, whereas a 200 μM concentration suppressed changes in the optical density readings by only 15%.
Figure 2B shows the dose response of chromatophores to mercuric chloride. Mercury did not exhibit a dose response with fish chromatophores. The highest concentration of 1mM failed to evoke a significant response and optical density decreased by only 11%. In stark contrast, the 500 μM concentration reduced the optical density by almost 53%. The 100 μM concentration also failed to evoke any response. This irregular pattern of response indicates that there might be a concentration range within which the fish chromatophores are sensitive to mercury chloride.
Figure 2C shows the dose response of chromatophores to sodium arsenite. The chromatophore response pattern was irregular, where the highest concentration evoking a dispersion response. Consistent aggregation dose response was observed at lower concentration levels of 500 μM and 100 μM Literature shows that sodium arsenite is toxic to fish at a concentration of 10-100 ppm (0.7-700 μM) [11]. Also, it is found to affect protein metabolism [11]. These results indicate that cell response to sodium arsenite might affect different spectra of proteins at different concentrations resulting in the disparate aggregation/dispersion response. Such a dichotomy has been observed for fish chromatophores responding to β-amyloid and is evident for other receptor mediated bioactive compounds such as cirazoline [14].
Figure 2D shows the dose response of chromatophores to clonidine. Clonidine binds to the α2-adrenergic receptor in eukaryotes and this ligand-receptor binding induces the activation of Gi proteins. Consistent with the mechanistic aspects of the pathway, we notice a distinct dose response in the case of clonidine. From literature, it is also seen that nanomolar concentrations are sufficient to evoke a significant response from the fish chromatophore cells [3]. The chromatophore cells aggregate by the action of clonidine, leading to reduction in the optical density of the cells. A 500 nM concentration of clonidine decreased the optical density of cells by 53%, whereas the 100 nM and the 10 nM concentrations reduced optical density by 40% and 18% respectively.

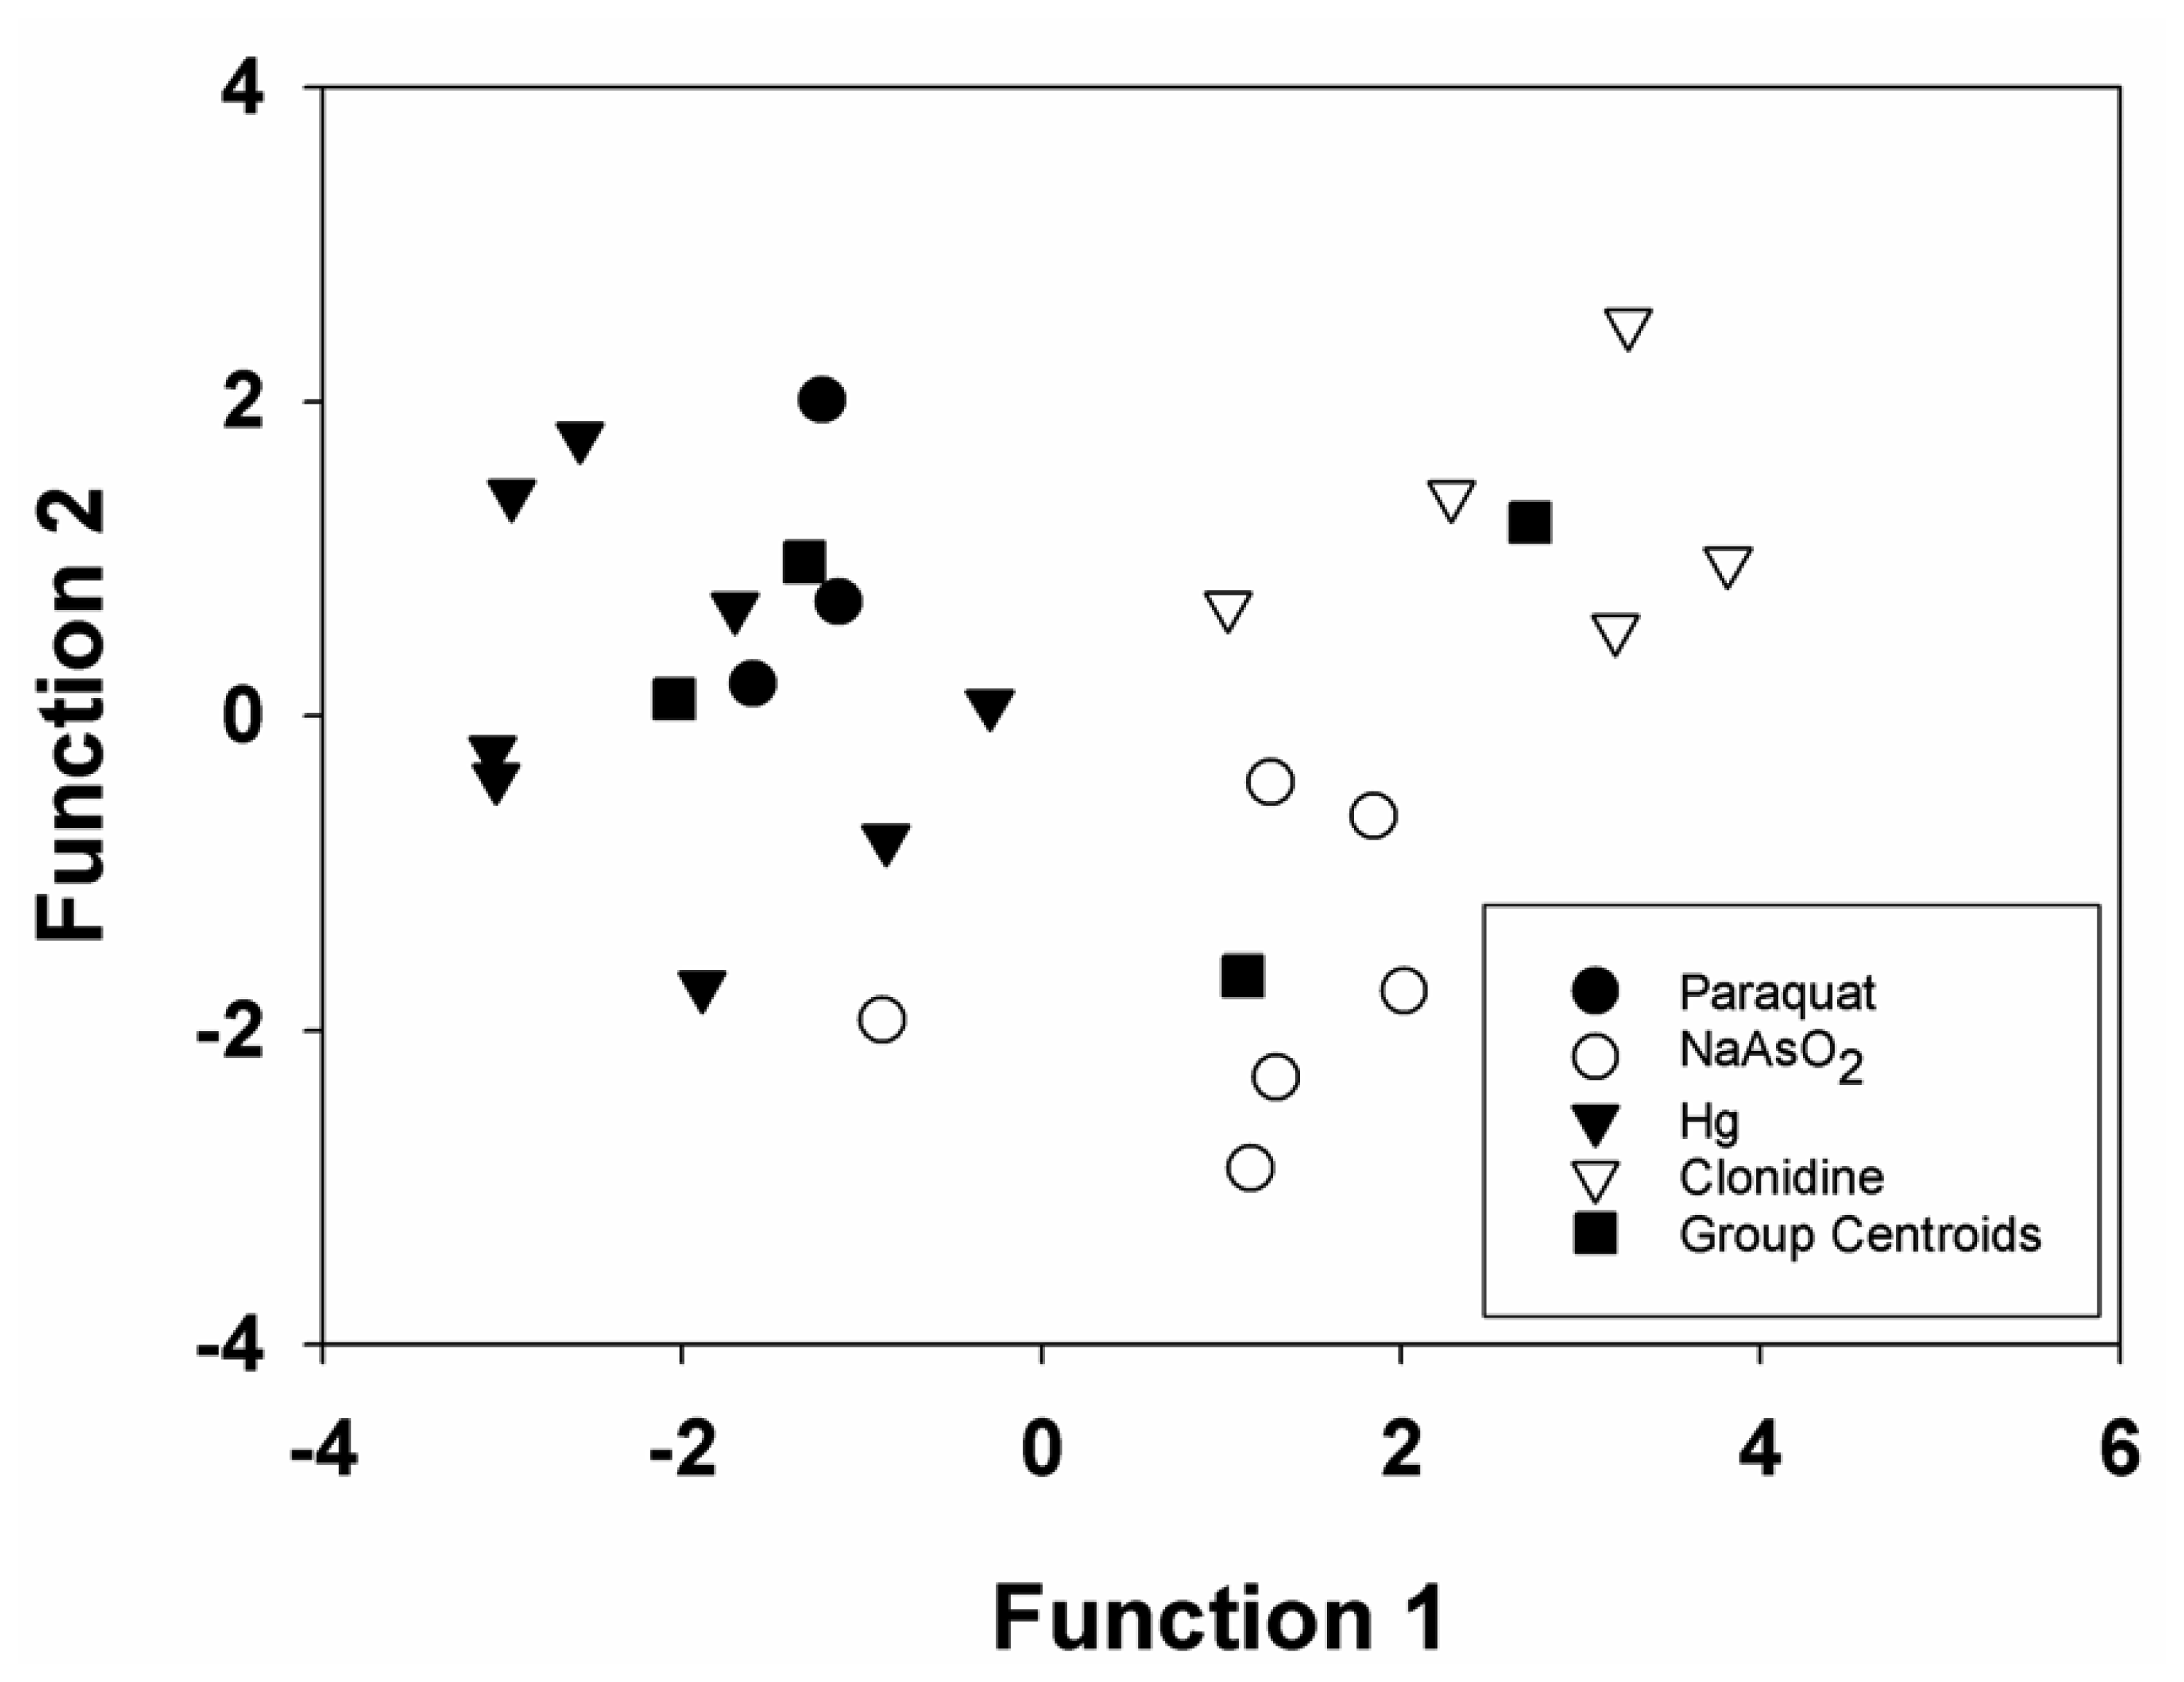
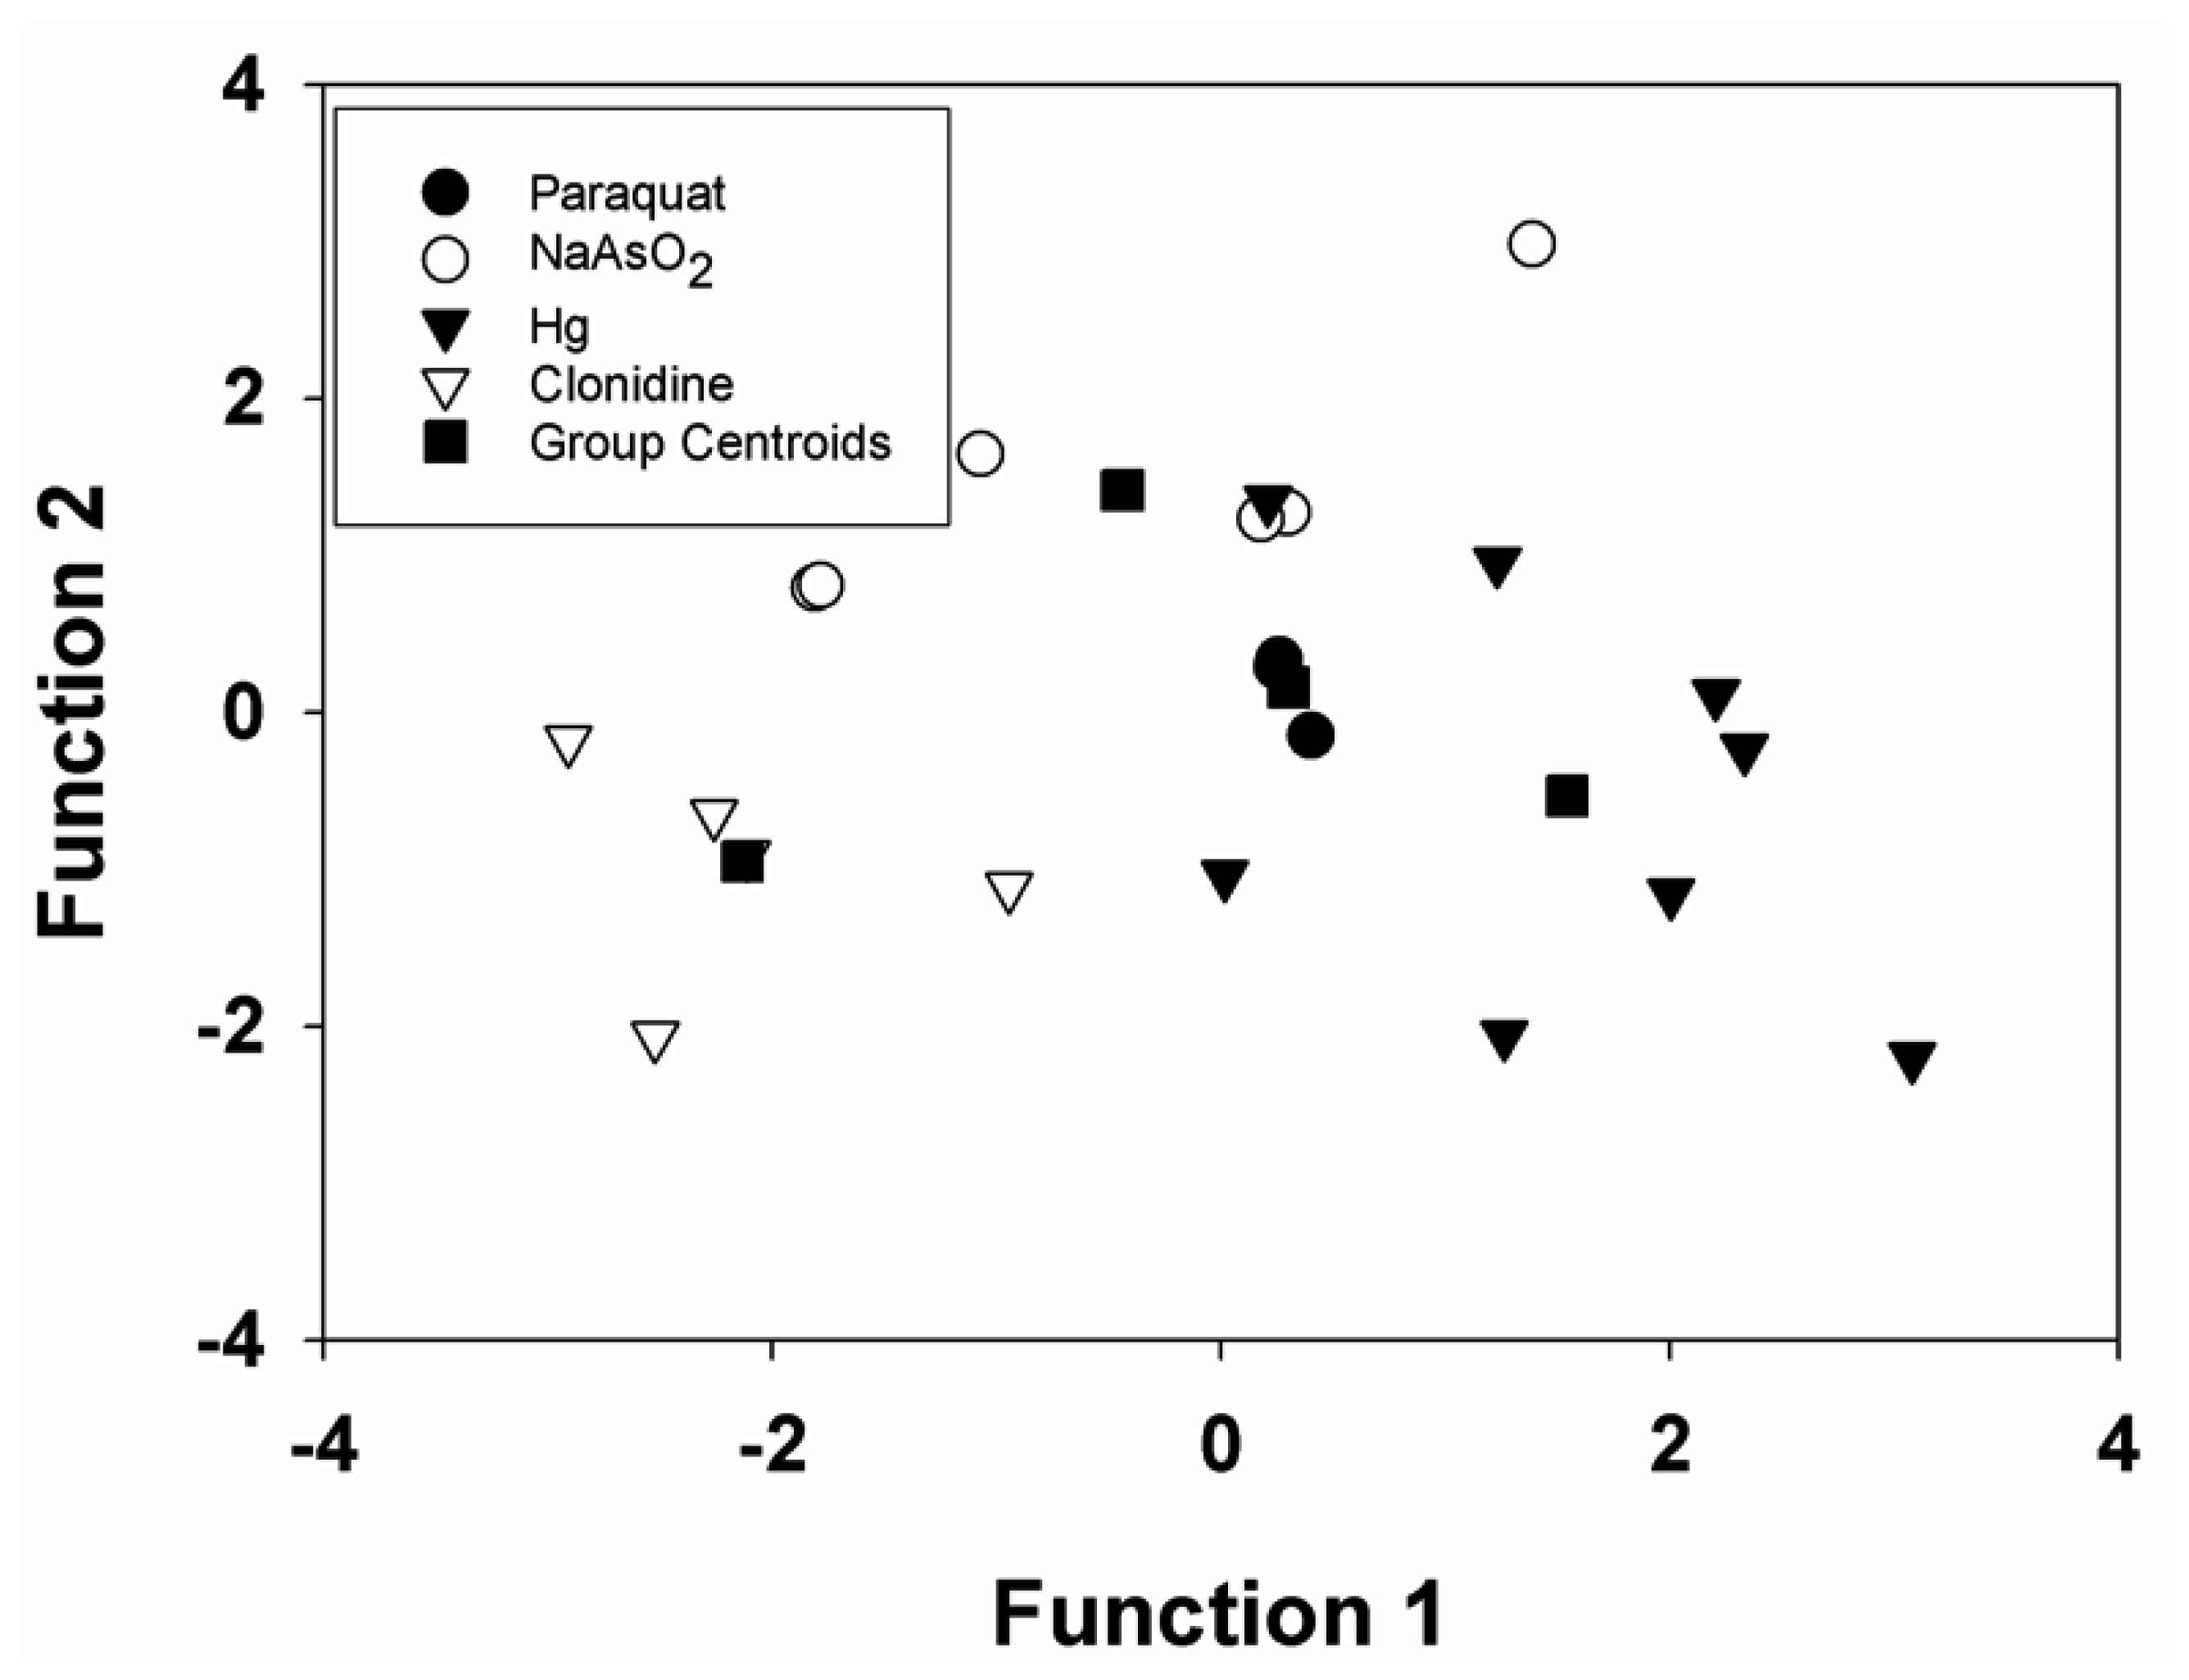
2.3 Classification of algal and chromatophore system responses

Based on the nature of response curves of the two cell systems for the toxin set, a generic exponential fit was chosen for the systems in consideration. The steady state value can be attributed to the highest magnitude of the effect of the bioactive compounds on the cell systems. The exponential fit relates to the physical phenomenon of the exponential decay of fluorescence observed with similar other algal systems. Similarly, the chromatophore response curves also demonstrated a good fit for exponential decay. Concentration and variables a, b and c are used as explanatory variables to differentiate among (or classify) the four toxin groups for fish chromatophores and a1, b1 and c1 for algal cells. Table 1 summarizes the curve fit data included in the Linear Discriminant Analysis.
Linear discriminant analysis was used to find the best linear combinations of the explanatory or independent predictor variables for separating the clusters for each tissue-based biosensor system. Discriminant analysis is used to classify data into two or more groups and to find one or more functions of quantitative measurement that discriminates among the groups. It is thus closely related to principal component analysis and factor analysis in that it looks for linear combinations that best explain the data [15]. Linear discriminant analysis is also closely related to analysis of variance (or regression analysis), except that the dependent variable is a feature (or categorical variable) rather than a numerical quantity. Discriminant functions created for this study allowed allocation of each toxin to a predefined class, based solely on the explanatory variables derived from the original measurements.
Three discriminant functions were derived for algae, chromatophores and the combined data each, whilst including concentration as an explanatory variable. The functions are expressions obtained through discriminant analysis and used to classify the experimental results. The functions are “trained” using experimental data and then applied to determine the identity, but not quantity, of the unknowns. 22 experiments, divided into 4 classes common to both the fish and algal biosensor data, were selected to derive the discriminant functions. The overall classification efficiency of the algal system was 72.7%; and the overall of the chromatophore systems was 68.2%. The combined analysis containing 22 experiments divided into 4 classes mapping to each of the model toxins and is shown in Figure 3. Inclusion of Function 3 improves significantly the separation of the paraquat and mercury data seen in Figure 3 (data not shown).
Table 2 shows the classification table for the data analysis derived using seven explanatory variables (concentration, a, b, c, a1, b1, c1) and including the three discriminant functions. The classification table represents a quantitative output from the classification process and shows how well the discriminant functions performed in classifying the various compounds. Overall classification efficiency for this set of experiments was 95.5%, indicating that combining outputs from both cell types significantly increased the ability of the discriminant functions to distinguish the various toxic agents.
The availability of concentration data with respect to the unknowns assumes that the concentration information (with respect to the unknowns) will be available for classification purposes. Another scenario is that such information is absent. In order to determine whether the general classification approach was operative in the absence of concentration information, three discriminant functions were derived for algae, chromatophores and the combined data but without including concentrations as the explanatory variable. The majority of the differences between cell responses were captured by the first function in each case. As before, 22 algal analysis experiments were divided into 4 classes, each mapping to one of the model toxins. Overall classification efficiency for the algal experiments improved only marginally, to 63.6%. Chromatophore analysis also consisted of 22 experiments divided into 4 classes, each mapping one of the model toxins, and is shown in Figure 4. Overall classification efficiency for the chromatophore experiments was 68.2%. Figure 4 also shows the data distribution for the algal series of experiments. Results obtained from the 22 experiments for the combined analysis are compared in Figure 4 as well. Table 3 shows the classification distribution for the data analysis derived using six explanatory variables (a, b, c, a1, b1, c1) and including the three discriminant functions. Overall classification efficiency for this set of experiments was 86.4%, again a significant increase over using each cell type separately.

3. Conclusions

The combined sensing systems were able to provide a more reliable classification of the toxins selected for this study than either system taken individually. The response pattern of fish chromatophores to sodium arsenite and clonidine seemed to overlap with each other resulting in the inappropriate classification of 500nM clonidine. Although paraquat did not evoke any significant response from the fish cells at high concentrations, its response indices did not interfere with any of the other toxins. The algal system was unable to detect clonidine and exhibited low sensitivity to sodium arsenite, whereas paraquat elicited a clear dose response. The results of this study show that the development of more reliable non-specific biosensing approaches will significantly reduce the cycle time associated with the detection and classification of bioactive agents.

4. Experimental Section

4.1 Chemicals and Solutions

All chemicals were of reagent grade unless otherwise indicated: 1. Antibiotic/antimycotic (penicillin, streptomycin and Fungizone from Gibco-BRL 15240-062, diluted 1:100); 2. Phosphate buffered saline (PBS: 128 mM NaCl, 5.6 mM glucose, 2.7 mM KCl, 10 mM Na2HPO4, 1.46 mM KH2PO4, antibiotic/antimycotic; pH 7.3); 3. Skinning solution (PBS with 1 mM NaEDTA; pH 7.3); 4. Digestion solution (30mg collagenase type I: 220 U/mg (5 mg/ml) from Worthington and 3 mg hyaluronidase: 348 U/mg (0.5 mg/ml) from Worthington dissolved in 7 ml PBS and filter sterilized with a 0.2 μm filter immediately before use); 5. Culture medium (L-15 from GIBCO BRL with antibiotics/antimycotic); 6. Fetal Bovine Serum (FBS) (from HyClone Laboratory, Inc., Logan, UT).

4.2 Cell Culture

B. splendens (Siamese fighting fish) were anaesthetized in ice-cold water for 10 min. Fins were removed by scalpel in PBS and washed with 10 ml skinning solution 8-10 times. Fins were then added to 7 ml digestion solution in a small beaker and rotated on an orbital shaker until the digestion solution appeared cloudy (5-15 min). The digestion solution was separated from the fins and centrifuged for 2 min at 400xg to pellet cells. The fins were resuspended in the clarified digestion solution (7-ml) for the next harvest. The cell pellet was suspended in 7 ml L-15 medium following each harvest and then centrifuged for 2 min at 400xg and 20 °C. The first harvest was discarded as it consisted mostly of epithelial cells. Cells were collected following subsequent harvests and plated in 24-well tissue culture dishes (Costar; Fisher Scientific, Inc.) with 1-2 ml of L-15 culture medium/10% FBS.
M. caldariorum (green alga) UTEX 41 was obtained from the Culture Collection of Algae at the University of Texas (Austin, Texas, USA). Bold's media was used to cultivate algal cells. Cells were grown at 27 °C with agitation (shaker table, 150 rpm) to avoid cell clumping. 24 h illumination was supplied through a cool white fluorescent light (50-100 μmol m−2 s−1, Sylvania, USA). The cells were sub-cultured every seven days by replacing 50% of the culture volume with fresh medium.

4.3 Bioactive Compound Preparation

Sodium arsenite and mercuric chloride stock solutions were prepared at concentrations of 1 mM, 500 μM and 100 μM; paraquat stock solutions were prepared at concentrations of 200 μM, 100 μM and 50 μM for the algal experiments and 1 mM, 500 μM and 100 μM for the fish chromatophore experiments. Clonidine stock solutions were prepared at concentrations of 500 nM, 100 nM, and 10 nM. The diluting liquid for the agents and the negative control was the media for cell cultivation.

4.4 Algal Cell Fluorescence Measurements

Preliminary experiments were performed using an SLM AMINCO fluorescence spectrophotometer. A uniform density cell preparation was obtained by repeated centrifugation and mixing using a vortex shaker. The cells suspended in medium were added to a quartz cuvette for fluorescence measurements. The cells tend to settle at the bottom of the cuvette, therefore, a magnetic stir bar was also placed inside the cuvette to keep the cells suspended in solution for accurate measurements during the course of the experiment. An emission scan was performed within the wavelength range of 660-690 nm to detect the maximum fluorescence peak. The gain was adjusted in such a way that the starting fluorescence value was around 40,000 FLUs. The emission scan showed that the fluorescence peak occurred at a wavelength of 685 nm.
Algal cell cultures were centrifuged twice at 3000xg for 5 min at 23-24 °C and rinsed with fresh medium following each centrifugation. Fluorescence measurements were taken with a SpectraMax GEMINI XS microplate spectrofluorometer (Molecular Devices, Inc., Sunnyvale CA) using 24-well plates (Costar) with a path length of 4 mm. Excitation wavelength was 660 nm, while emission wavelength was 685 nm. Wavelength optimization was performed as previously reported [14]. 20 μl of each bioactive compound stock solution was added to 1 ml culture solution for each experiment. Cells were exposed to illumination at 400 Lux for 10 min prior to initiating the paraquat measurements in order to accelerate peroxide formation and improve sensitivity. Measurements were performed over a 30 min period at 3 min intervals. Typical response curves are shown in Figure 1.

4.5 Chromatophore Optical Density Measurements

Medium was exchanged 24 h prior to measurements. Final volume was 1 ml L-15 5% v/v FBS. Optical density measurements were made at 595 nm using an Ultramark Microplate Systems microplate reader (BioRad, Inc.; Hercules, CA). Optical density measurements were taken before and after addition of agents/effectors at regular time intervals. The first 100 readings were taken at 10 s intervals. Subsequent readings were taken every 20-30 s for 45 min of total elapsed time. Percentage of optical density (OD) change was calculated by normalizing with respect to the OD measurement at time zero. Typical response curves are shown in Figure 2.

4.6 Data Analysis

Response curves were modeled with a three-parameter model as shown in Equation 1 (a, b, c, t1) where t1 represents the time lag before the sensor cell response is observed.
F ( t ) = a [ e b ( t t 1 ) ] + c
Regression analyses were performed using a quasi-Newton algorithm for parameter optimization with the MacCurve Fit V. 1.5 (Shareware) software program. Fish chromatophores were unresponsive to all concentrations of sodium arsenite and 100 μM mercuric chloride. Algal cells were unresponsive to 10 nM clonidine.
Classification of algal and fish chromatophore responses was performed using linear discriminant analysis with StatGraphics (Mangustics, Inc., Rockville, MD; http://www.statgraphics.com). The three model variables and concentration were used as explanatory variables for classifying the four bioactive compounds. The three model variables, and concentration from each system, were used together for the combined case.

Acknowledgments

We would like to acknowledge Dr. Michael Schimerlik, Dr. Deborah Hobbs and Dr. Ricardo Letelier for generously sharing their spectrofluorometer facilities and Lin Liu, Antonio Parades and Nicolas Roussel for their assistance with statistical data analysis.

References and Notes

  1. Karlsson, J.; Andersson, R.G.; Askelof, P.; Elwing, H.; Granstrom, M.; Grundtrom, N.; Lunstrom, I.; Ohman, L. The melanophore aggregating response of isolated fish scales: a very rapid and sensitive diagnosis of whooping cough. FEMS Microbiology Letters 1991, 82, 169–176. [Google Scholar]
  2. Elwing, H.; Karlsson, J.O.; Grundstrom, N.; Gustafsson, A.L.; von Schenck, H.; Sundgren, H.; Odman, S; Andersson, R.G.; Lunstrom, I. Fish scales as biosensors for catecholamines. Biosensors & Bioelectronics 1990, 5, 449–459. [Google Scholar]
  3. Chaplen, F.W.R.; Upson, R.J.; McFadden, P.N.; Kolodziej, W.J. Fish chromatophores as cytosensors in a microscale device: Detection of environmental toxins and bacterial pathogens. Pigment Cell Res. 2002, 15, 19–26. [Google Scholar]
  4. Altamirano, A.; Garcia-Villada, L.; Agrelo, M.; Sanchez-Martin, L.; Martin-Otero, L.; Flores-Moya, A.; Rico, M.; Lopez-Rodas, V.; Costas, E. A novel approach to improve specificity of algal biosensors using wild-type and resistant mutants: an application to detect TNT. Biosensors & Bioelectronics 2004, 19, 1319–1323. [Google Scholar]
  5. Rizzuto, M.; Polcaro, C.; Desiderio, C.; Koblizek, M.; Pilloton, R.; Giardi, M.T. Herbicide monitoring in surface water samples with a photosystem-II based biosensor, Proceedings of the 2nd workshop on Chemical Sensors and Biosensors; Mazzei, F., Pilloton, R., Eds.; E.N.E.A.: Rome, 2000; pp. 346–357.
  6. Naessens, M.; Leclerc, J.C.; Tran-Minh, C. Fiber optic biosensor using Chlorella vulgaris for determination of toxic components. Ecotoxicology and Environmental Safety 2000, 46, 181–185. [Google Scholar]
  7. Rodriguez, M., Jr.; Sanders, C.A.; Greenbaum, E. Biosensors for rapid monitoring of primary-source drinking water using naturally occurring photosynthesis. Biosensors & Bioelectronics 2002, 17. [Google Scholar]
  8. Bernier, M; Popovic, R; Carpentier, R. Mercury inhibition at the donor side of photosystem II is reversed by chloride. FEBS Lett. 1993, 321, 19–23. [Google Scholar]
  9. Chen, G.; Way, J.; Armour, S.; Watson, C.; Queen, K.; Jayawickreme, C.K.; Chen, C.J.; Kenakin, T. Use of constitutive G-protein coupled receptor activity for drug discovery. Molecular Pharmacology 1999, 57, 125–134. [Google Scholar]
  10. Tseng, C.H. The potential biological mechanisms of arsenic-induced diabetes mellitus. Toxicol. Appl. Pharmacol. 2004, 197(2), 67–83. [Google Scholar]
  11. Shobha Rani, A; Sudharsan, R.; Reddy, T.N.; Reddy, P.U.M.; Raju, T.N. Effect of arsenite on certain aspects of protein metabolism in fresh water teleost, Tilapia mossambica. J. Environ. Biol. 2001, 22(2), 101–104. [Google Scholar]
  12. Wong, P.K. Effects of 2,4-D, glyphosate and paraquat on growth, photosynthesis and chlorophyll-a synthesis of Scenedesmus quadricauda Berb 614. Chemosphere 2000, 41(1-2), 177–82. [Google Scholar]
  13. Elstner, E.F.; Osswald, W. Chlorophyll photobleaching and Ethane production in Dichlorophenyldimethylurea-(DCMU) or Paraquat- treated Euglena gracilis cells. Z. Naturforsch. 1980, 35c, 129–135. [Google Scholar]
  14. Narayanan, A. Use of Elicitor Sets to Characterize Cellular Signal Transduction Networks. M.S. Thesis, Oregon State University, 2003. [Google Scholar]
  15. Martinez, A.M.; Kak, A.C. PCA versus LDA. IEEE Transactions on Pattern Analysis and Machine Intelligence 2001, 23(2), 228–233. [Google Scholar]
  16. Vissvesvaran, G. Classification of Toxins using Orthogonal Sensing Techniques. M.S. Thesis, Oregon State University, 2003. [Google Scholar]
Figure 1. (A) Algae exposed to paraquat. Readings are shown are shown from time of light exposure. Light exposure prior to fluorescence detection is necessary for the peroxide production that represents the toxic effect of paraquat. (B) Algae exposed to mercury (HgCl2). (C) Algae exposed to sodium arsenite (NaAsO2). (D) Algae exposed to clonidine.
Sensors 07 00038f1
Figure 2. (A) Chromatophores exposed to paraquat. (B) Chromatophores exposed to mercury (HgCl2). (C) Chromatophores exposed to sodium arsenite (NaAsO2). (D) Chromatophores exposed to clonidine.
Sensors 07 00038f2
Figure 3. Combined analysis consisted of 22 experiments divided into 4 classes mapping to each of the model agents. Function 1 captured 67.98% of the differences with Function 2 capturing 22.02% and Function 3 capturing 10.00%. Wilks-Lambda for all three functions was below 1. The centroids for each class were the average of the discriminant score for each class. The effect of Function 3 on the classification results is not shown here.
Sensors 07 00038f3
Figure 4. Chromatophore analysis consisted of 22 experiments divided into 4 classes mapping to each of the model toxins. Function 1 captured 72.4% of the differences with Function 2 capturing 20.3% and Function 3 capturing 7.3%. Wilks-Lambda for all three functions was below 1. The centroids for each class were the average of the discriminant score for each class. The effect of Function 3 on the classification results is not shown here.
Sensors 07 00038f4
Table 1. The table includes explanatory variables a, b and c obtained from linear regression of the fish chromatophore experiments and the explanatory variables a1, b1, c1 obtained from the algal cell experiments.
Case#Toxin[X]aBca1b1c1
1Paraquat100 μM43.750.00557.0319.10.006180.44
2Paraquat100 μM53.920.002847.0816.10.004382.76
3Paraquat100 μM59.560.002742.5619.20.00479.49
4NaAsO21 mM50.280.00347.37-8.20.0008109.54
5NaAsO21 mM57.430.002441.5-25.150.0013123.65
6NaAsO2500 μM100.680.00021.27-7.60.0042106.32
7NaAsO2500 μM43.970.000757.7546.470.002366.17
8NaAsO2100 μM15.680.000885.649.280.002163.04
9NaAsO2100 μM16.350.000784.1438.980.000865.87
10HgCl21 mM53.530.01147.748.90.00891.14
11HgCl21 mM49.920.01348.8512.80.006497.4
12HgCl21 mM44.540.002942.040.6-0.000686.87
13HgCl2500 μM41.430.009260.3155.560.0144.41
14HgCl2500 μM34.340.001461.10.066-0.001852.78
15HgCl2500 μM550.002445.2458.610.008841.3
16HgCl2100 μM46.40.001243.150.44-0.001392.52
17HgCl2100 μM46.870.000554.260.42-0.001692.03
18Clonidine500 nM-14.650.0006100.0653.260.006148.05
19Clonidine500 nM12.80.001388.4252.020.005549.18
20Clonidine500 nM13.070.004888.554.210.005547.25
21Clonidine100 nM13.050.001699.7141.810.004260.1
22Clonidine100 nM16.050.001487.2341.270.004760.46
Table 2. This table represents a quantitative output of the classification efficiency of the discriminant functions for the combined case, which utilized both cell types. The table is read left to right and shows how the discriminate functions predicted the toxin that was present following the training procedure. Overall classification efficiency was 95.5%.
Actual TypeGroup SizePredicted Type
ParaquatSodium ArseniteMercuryClonidine
Paraquat33
(100.00%)
0
(0.00%)
0
(0.00%)
0
(0.00%)
Sodium Arsenite60
(0.00%)
6
(100.00%)
0
(0.00%)
0
(0.00%)
Mercury81
(12.50%)
0
(0.00%)
7
(87.5%)
0
(0.00%)
Clonidine50
(0.00%)
0
(0.00%)
0
(0.00%)
5
(100.00%)
Table 3. This table represents a quantitative output of the classification efficiency of the discriminant functions for the combined case, which utilized both cell types. The table is read left to right and shows how the discriminate functions predicted the toxin that was present following the training procedure. Overall classification efficiency was 86.6%.
Actual TypeGroup SizePredicted Type
ParaquatSodium ArseniteMercuryClonidine
Paraquat33
(100.00%)
0
(0.00%)
0
(0.00%)
0
(0.00%)
Sodium Arsenite61
(16.67%)
5
(83.33%)
0
(0.00%)
0
(0.00%)
Mercury81
(12.50%)
1
(12.50%)
6
(75.00%)
0
(0.00%)
Clonidine50
(0.00%)
0
(0.00%)
0
(0.00%)
5
(100.00%)

