1. Introduction
Catalytic biosensors are sensors that use enzymes which catalyse a specific conversion of analyte [
1]. Amperometric biosensors measure the faradic response that arises on a working indicator electrode due to direct electrochemical oxidation or reduction of products of biocatalytic reaction. In amperometric biosensors, the potential at the electrode is held constant while the response is measured as a current. The response of amperometric biosensors is determined by enzyme activity and mass transport [
1]. It is established that if enzyme activity is low in comparison with the mass transfer rate the response is determined by biocatalytic reaction, and the biosensor acts in a “kinetic regime”. If the overall process is determined by mass transport through a stagnant (Nernst) layer the biosensor acts in an “external diffusion limitation” regime. If the process is limited by mass transport inside the biocatalytic membrane the biosensor acts in an “internal diffusion limitation” regime. The modelling of biosensors utilizing simple Michaelis-Menten kinetics in different regimes and geometries of electrodes and micro bioreactors was carried out using digital integration [
2-
16].
Very often the kinetics of enzyme action is much more complicated. Inhibition, activation, allostery and other types of non-Michaelis-Menten kinetics are known for the diversity of enzymes [
17]. The simplest scheme of non-Michaelis-Menten kinetics may be, for example, described by adding to the Michaelis-Menten scheme (1) the relationship of the interaction of the enzyme substrate complex (ES) with another substrate molecule (S) (2) followed the generation of non-active complex (ES
2):
For this scheme, the steady-state “initial” rate (Vst) shows maximum dependence of Vst on substrate concentration.
The modelling of the amperometric biosensor utilizing the enzyme with substrate inhibition has been very recently performed at external diffusion limitation and steady state conditions [
18]. The inhibitory constant in these calculations was assumed to be equal to the Michaelis-Menten constant. These simplified calculations revealed a multi-steady response of the biosensor if the diffusion module was much larger than 1 and the substrate bulk concentration was much higher than the Michaelis-Menten parameter [
18]. The non-steady state and a more generalised analysis of amperometric biosensor action at substrate inhibition can be performed using digital calculations. This work presents the results of non-steady state biosensor modelling at mixed enzyme kinetics, external and internal diffusion limitation with substrate inhibition.
2. Mathematical Model
It is assumed that substrate (S) conversion to product (P) was catalysed by the enzyme (E) and proceeded according to the scheme (1, 2). The biosensor is considered as an electrode having a layer of enzyme (enzyme membrane) applied to the electrode surface. The model involves three regions: (i) the enzyme layer where enzymatic reaction, as well as mass transport, by diffusion takes place; (ii) the diffusion region where only mass transport by diffusion takes place; (iii) the convective region where the analyte concentration is maintained constant. Assuming the symmetrical geometry of the electrode and homogeneous distribution of immobilized enzyme in the enzyme layer of uniform thickness, the concentration of substrate and product at
t > 0 can be expressed by the system of reaction-diffusion equations:
where
x stands for space,
t stands for time,
Se(
x,
t),
Sb(
x,
t) (
Pe(
x,
t),
Pb(
x,
t)) are the concentration of the substrate (reaction product) in the enzyme and in the bulk solution, respectively,
d is the thickness of the enzyme layer,
δ is the thickness of the diffusion layer,
Vmax is the maximal enzymatic rate,
KM and
Ki are Michaelis-Menten and inhibition constants, respectively,
DSe and
DPe are the diffusion coefficients of the substrate and the reaction product in the enzyme layer, respectively,
DSb and
DPb are the corresponding diffusion coefficients in the bulk solution.
Let
x = 0 represent the electrode surface, while
x =
d – the boundary between the enzyme membrane and the buffer solution. The biosensor starts to respond when some substrate appears in the bulk solution. This is used to define initial conditions (
t = 0)
where
S0 is the concentration of the substrate in the bulk solution.
On the boundary between two regions having different diffusivities, we define the matching conditions (
t > 0).
These conditions mean that fluxes of the substrate and product through the stagnant external layer is equal to the corresponding fluxes entering the surface of the enzyme membrane. The partition of the substrate and the product in the membrane vs bulk is assumed to be equal.
In the bulk solution, the concentration of the substrate, as well as of the product, remains constant (
t > 0),
Because of electrode polarization, the concentration of the reaction product at the electrode surface (
x = 0) is permanently reduced to zero. Since the substrate is electro-inactive substance, this is described by the following boundary conditions (
t > 0):
The diffusion layer (d < x < d + δ) may be treated as the Nernst diffusion layer. According to the Nernst approach, a layer of thickness δ remains unchanged with time. Away from it, the solution is in motion and is uniform in concentration.
The concentration
S of the substrate and the concentration
P of the reaction product can be defined for the entire domain 0 ≤
x ≤
d +
δ as follows:
Let us notice that due to the matching conditions (10) and (11) both concentrations, S and P, are continuous in the entire domain: 0 ≤ x ≤ d + δ.
The measured response is accepted as the current of a biosensor in physical experiments. The current is directly proportional to the flux of the reaction product at the electrode surface, i.e. on the border
x = 0. Since the total response is also directly proportional to the area of the electrode surface, we normalize the total response with the area of that surface. The density
i(
t) of the biosensor current at time
t can be obtained explicitly from Faraday's and Fick's laws,
where
ne is the number of electrons involved in charge transfer at the electrode surface, and
F is the Faraday constant,
F = 96485 C/mol. We assume that the system (3)-(14) approaches a steady state as
t → ∞,
where
I is assumed as the steady-state biosensor response.
A simplified analytical solution of the biosensor response was performed at external diffusion limitation at steady-state conditions assuming that surface enzyme activity is
Vmaxd. The steady-state surface rate (
Vst*) of enzyme activity following the scheme (1, 2) is described by:
where
Ss is the substrate concentration at
x =
d.
At steady-state conditions, the substrate flux (
Jst) through the Nernst diffusion layer is equal to the enzymatic rate on the surface:
Ss at fixed
S0 was calculated solving the cubic
equation (18) and using a symbolic processor of “
Mathcad” (MathSoft Inc., Cambridge, MA). The analytical solution is not presented in the text due to a very bulky expression.
The steady-state biosensor response for this case was calculated:
The digital modelling of biosensor response was evaluated for different values of the maximal enzymatic rate (
Vmax), substrate concentration (
S0) and the thickness
d of the enzyme layer. The following values of the model parameters were constant in all simulations:
3. Results and discussion
The modelling of the amperometric biosensor was performed at 2 critical values of Vmax. At Vmax = 10 mM/s and d = 20 μm, the internal diffusion module calculated as Φ = (Vmax/KM DSe)1/2d was 2, and at d = 10 μm it was 1. The formal external diffusion module calculated as ρ = Vmaxdδ/KMDSb was 30 and 15 for the respective thickness of the enzyme layer. This means that the biosensor response was strongly limited by diffusion.
At 100 times lower catalytic activity, i.e. at Vmax = 100 μM/s, Φ was 0.2 and 0.1, whereas ρ was 0.3 and 0.15 for d = 20 μm and d = 10 μm, respectively. The values of diffusion modules less than 1 indicated that the biosensor acted in a kinetic regime.
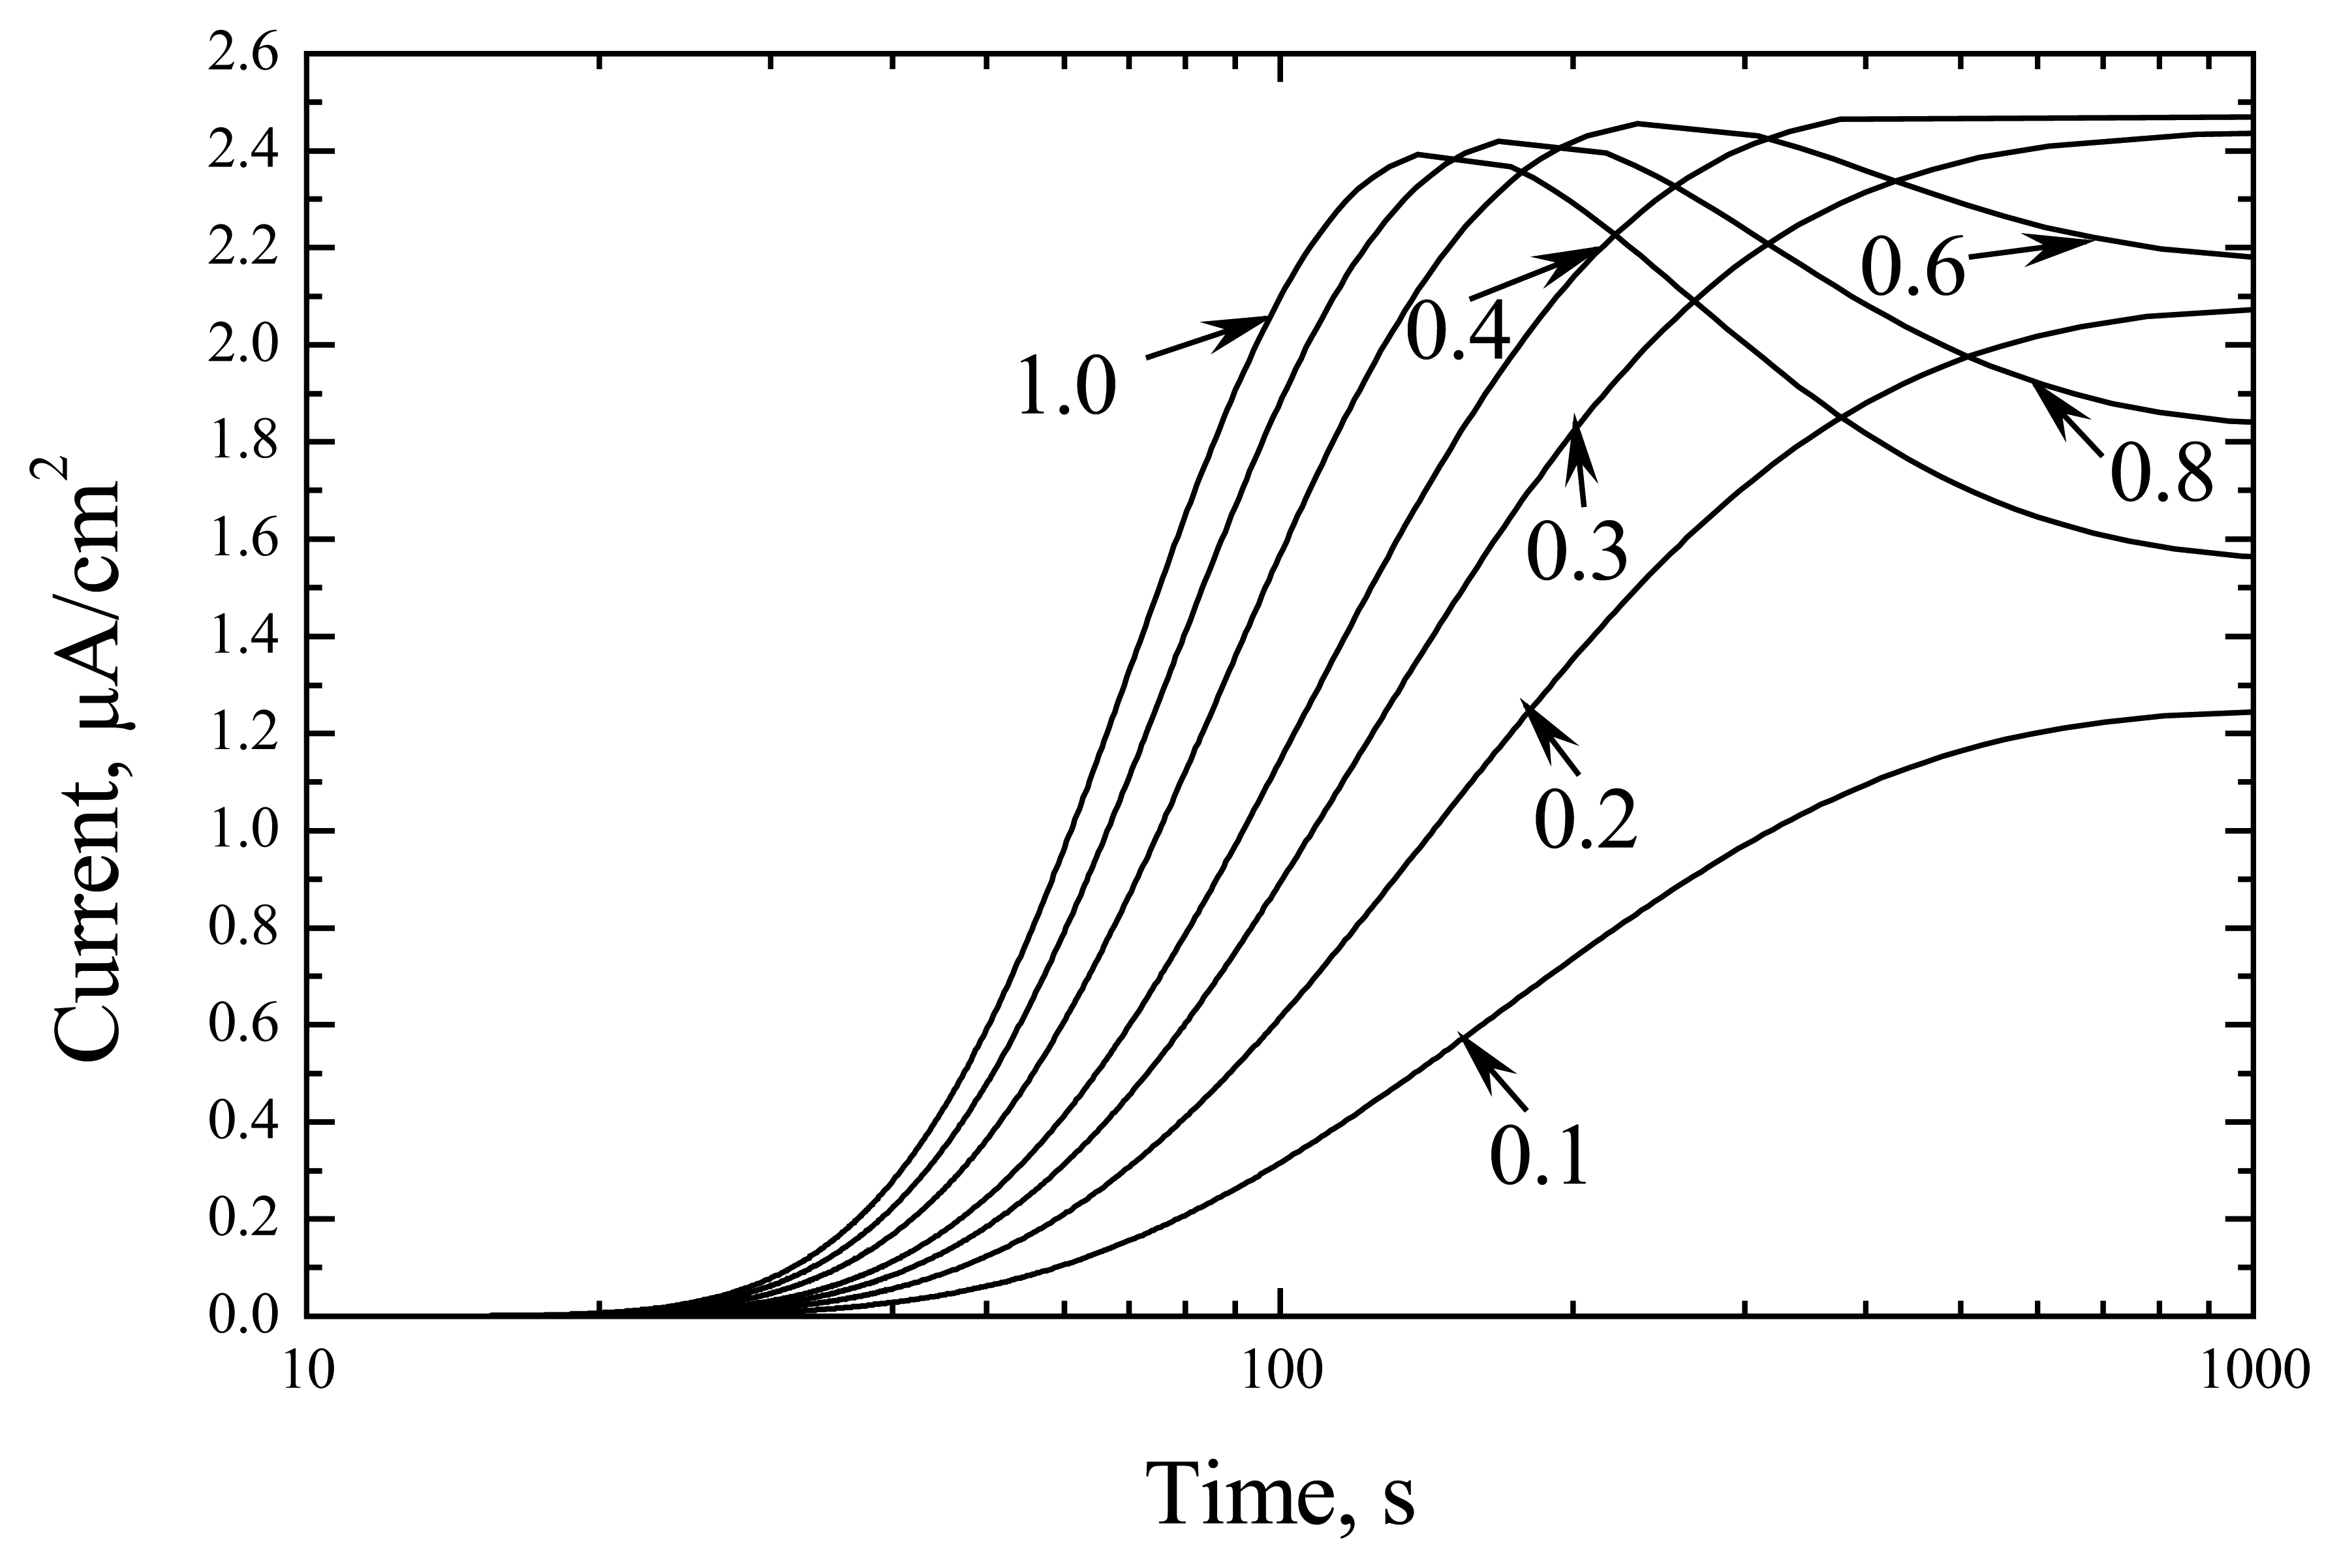
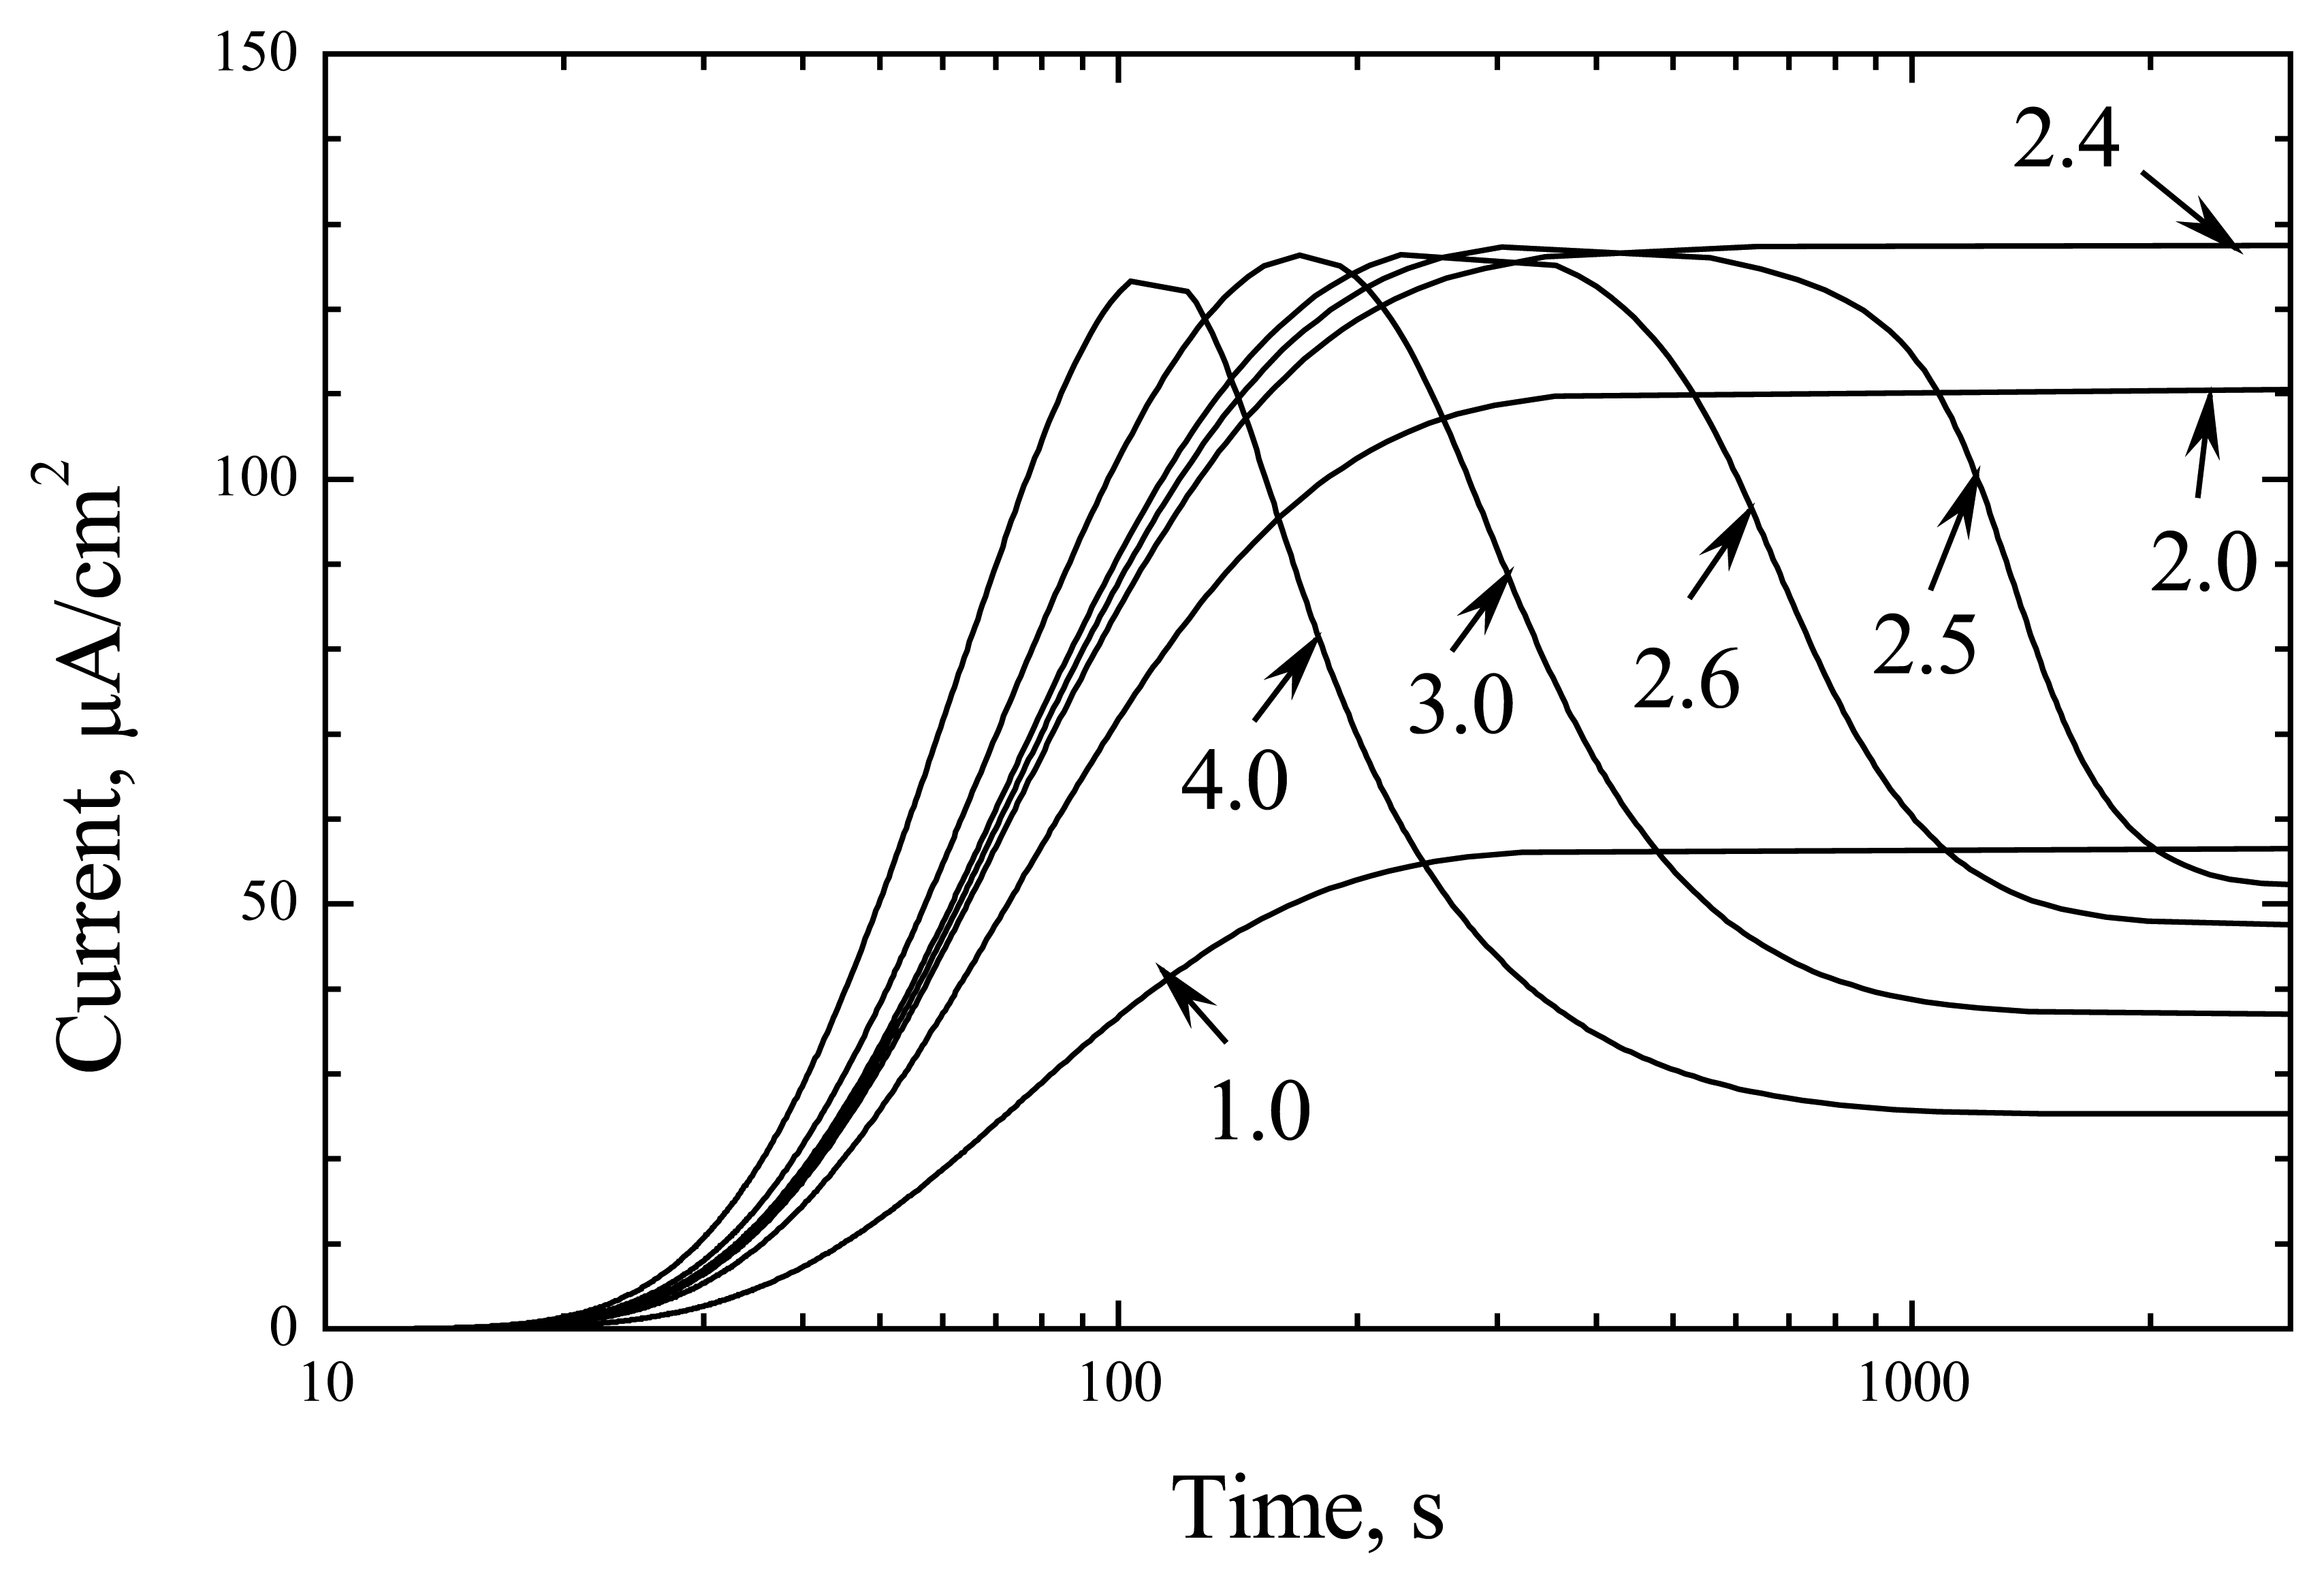
The digital modelling of the biosensor with low active enzyme indicated a complex character of the transition state (
Fig. 1). At low substrate concentration, the kinetic curves resembled the diffusion shape, whereas at
S0/
KM above 0.4 they showed maximal values.
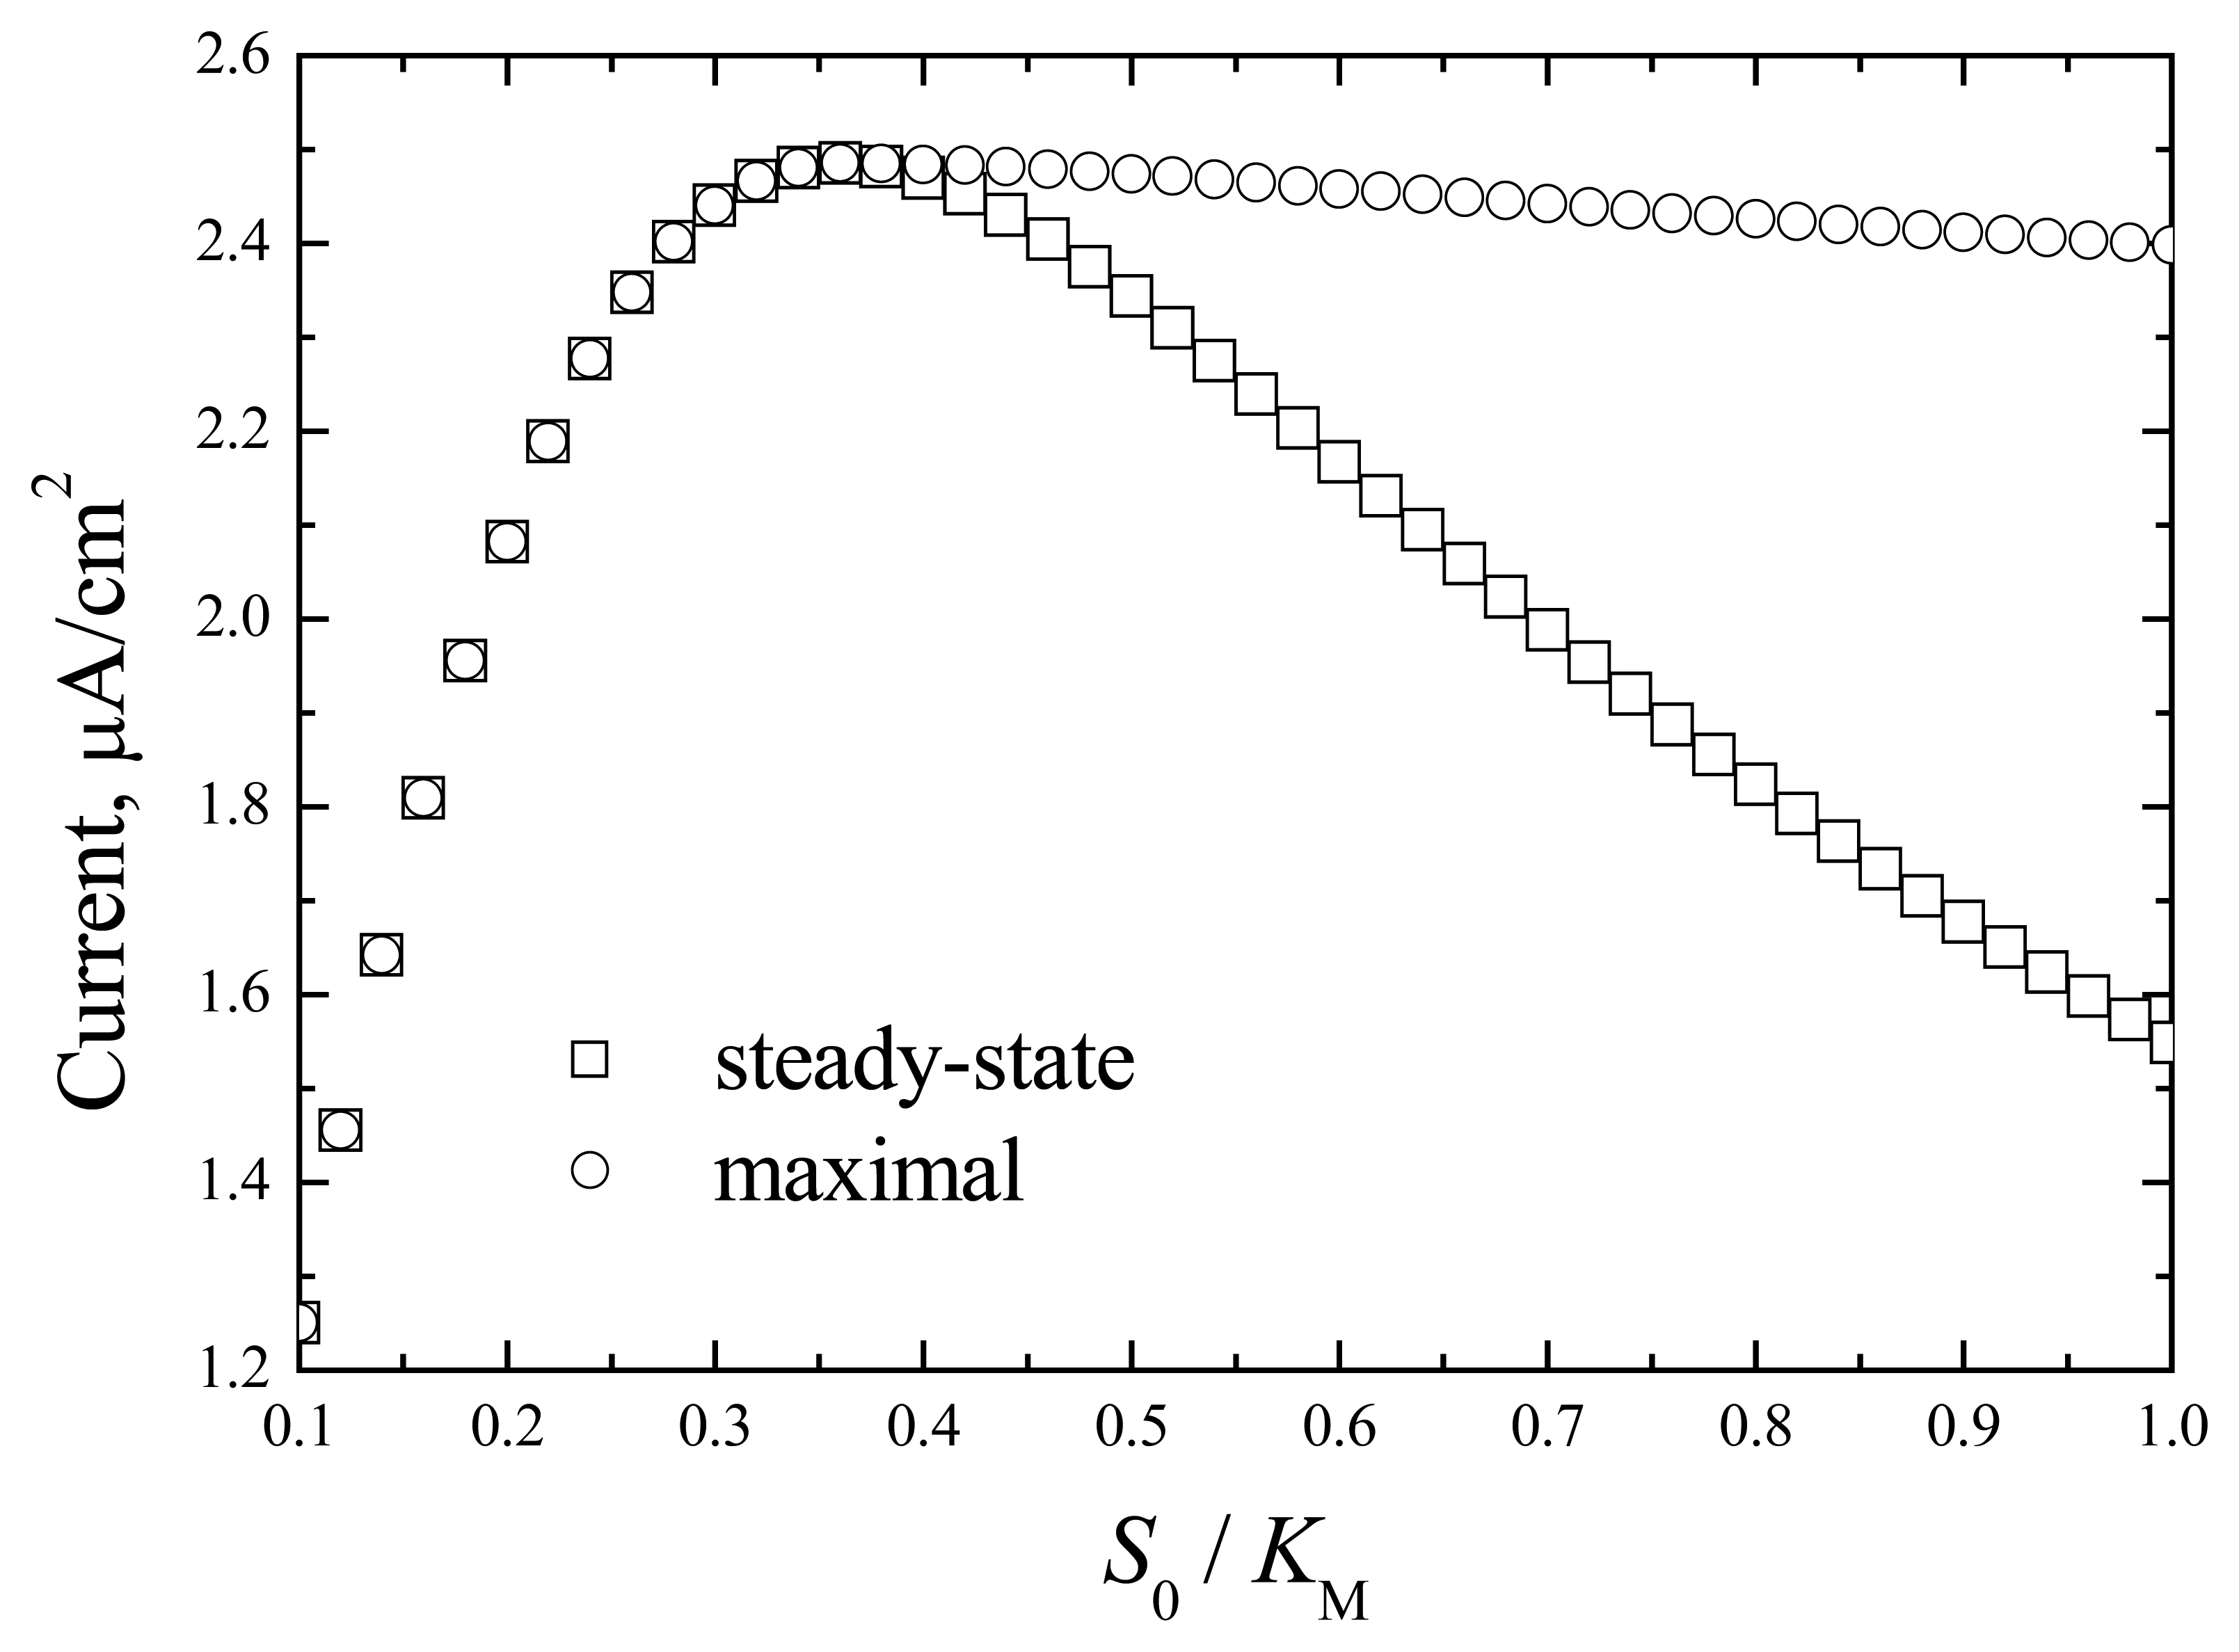
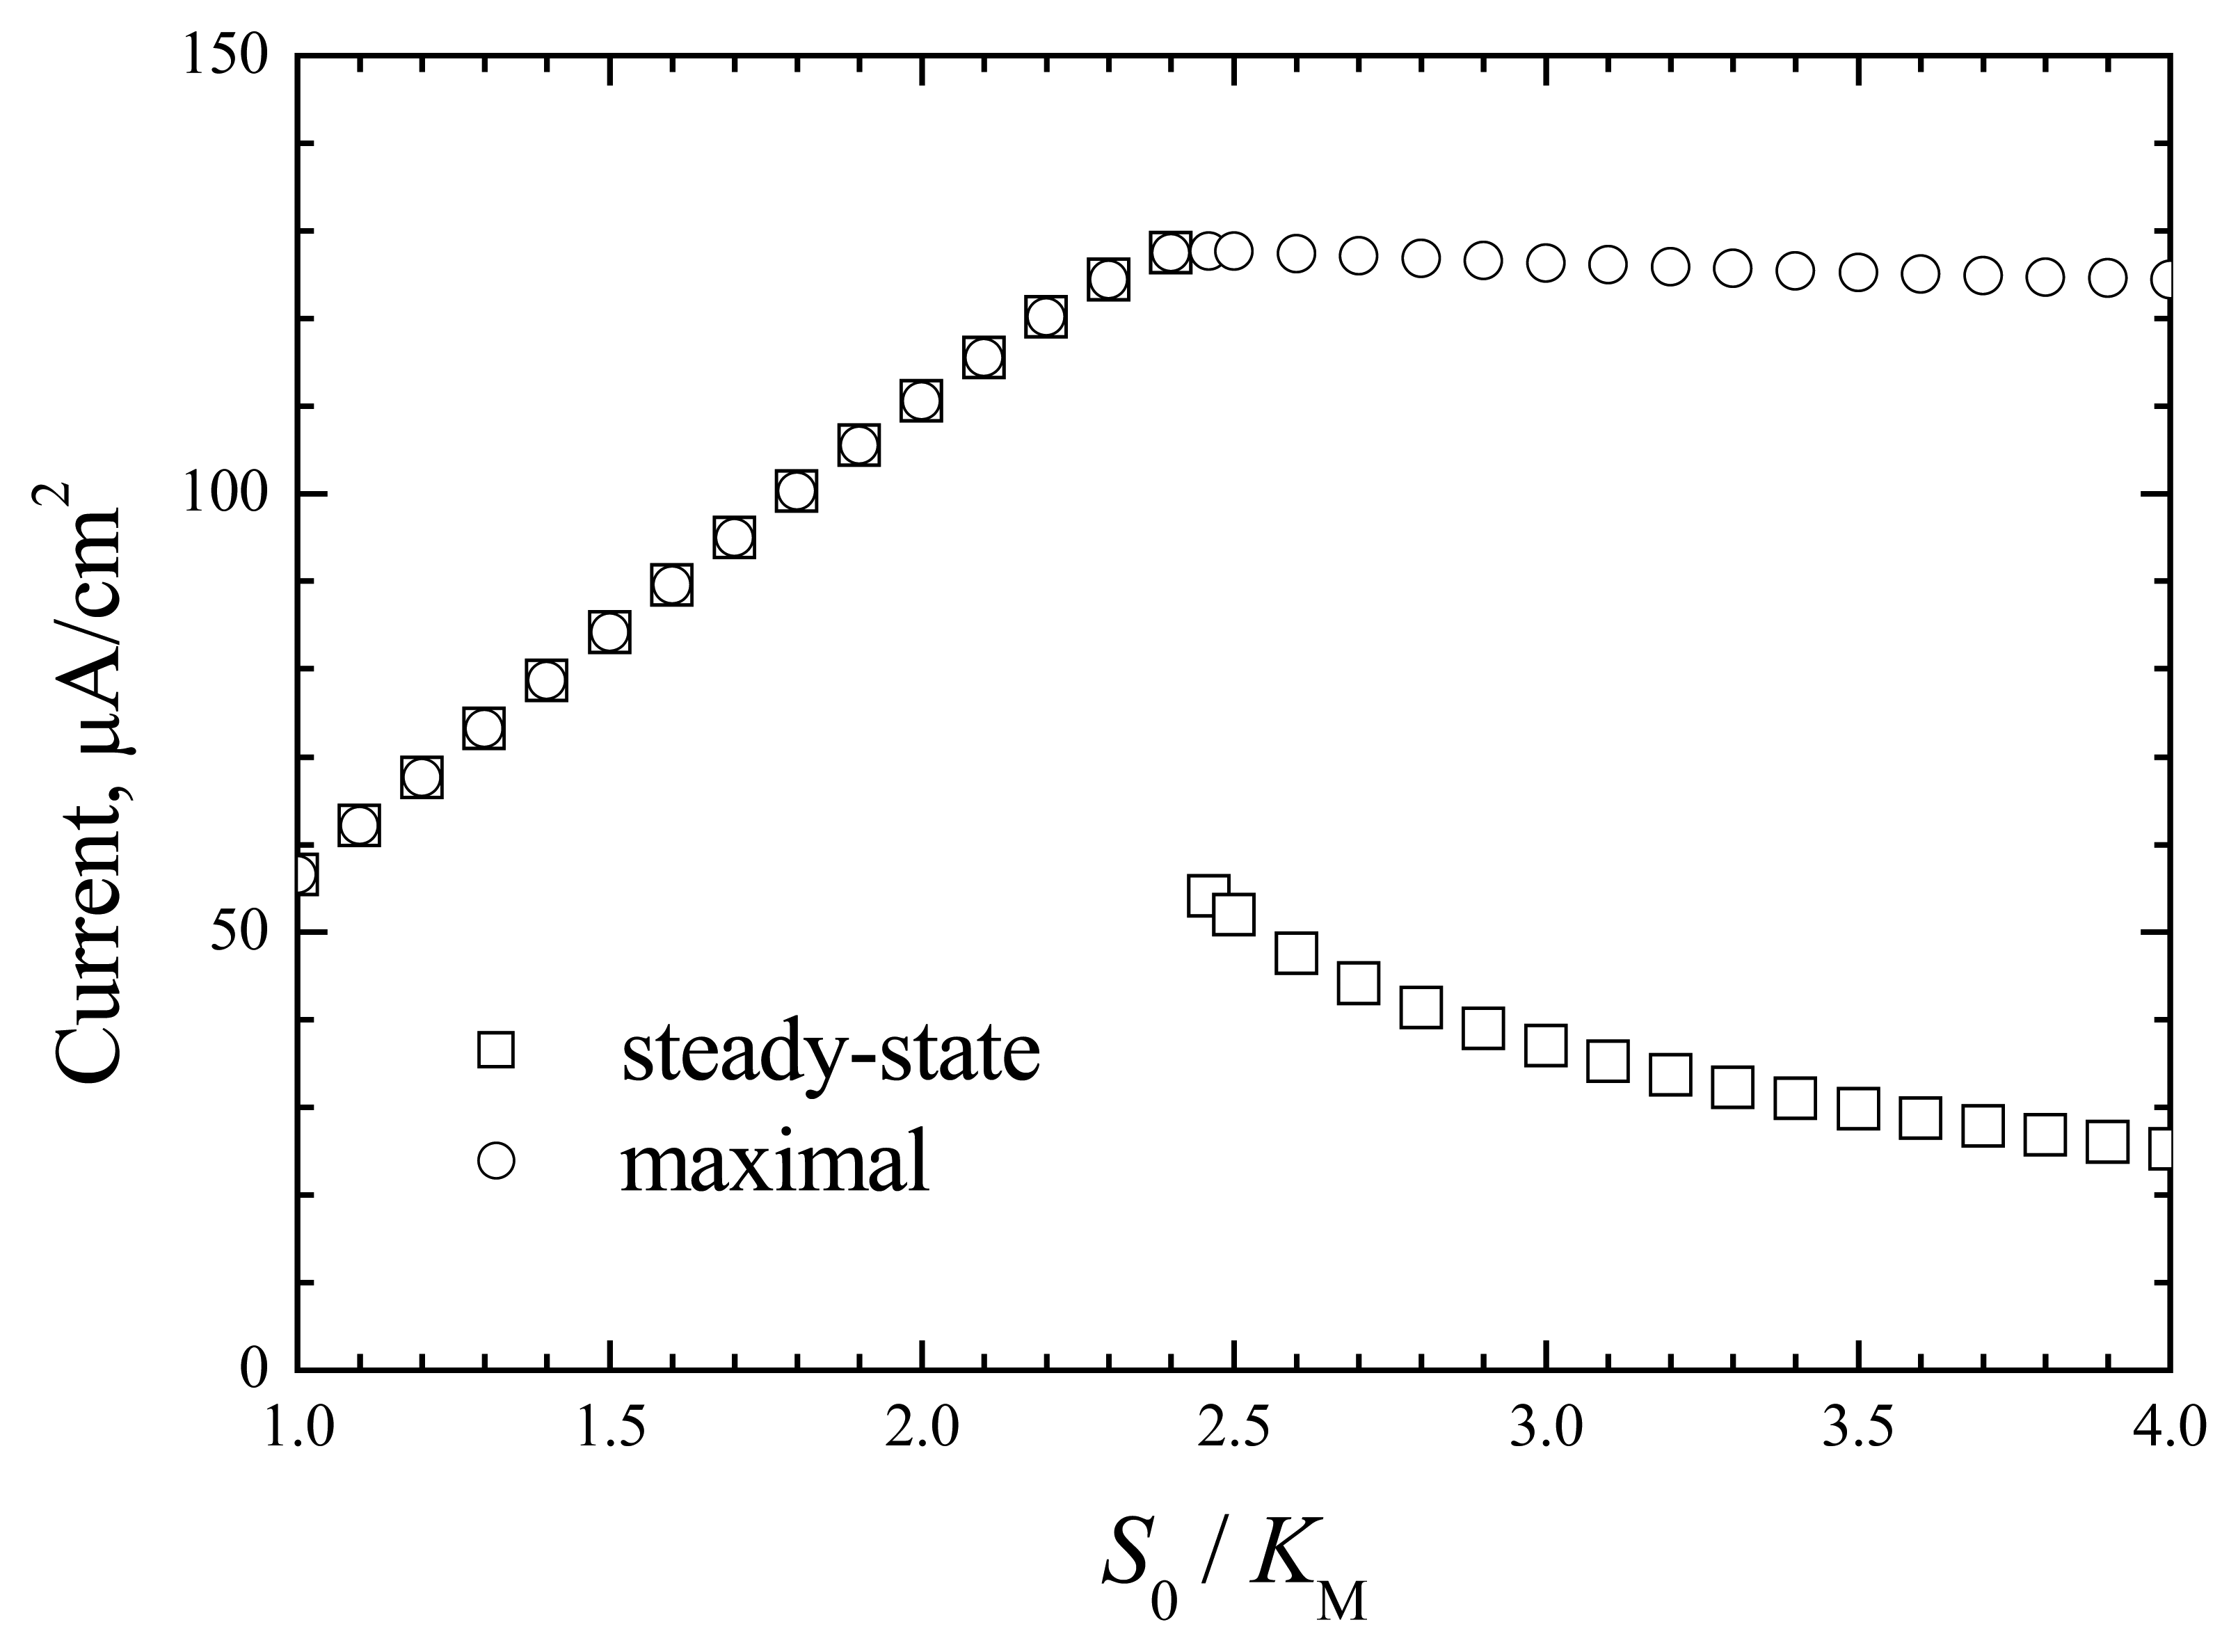
The dependence of the maximal and steady-state responses on the normalised substrate concentration is shown in
Fig.2.
The appearance of the maximal response value is associated with enzyme kinetics. The differentiation of the enzyme reaction rate on the bulk substrate concentration gave the maximal value at
S0/
KM=0.316. A similar maximal value can be indicated in the dependence of response on substrate concentration (
Fig. 2). The appearance of the maximal response at non-steady conditions (
Fig. 1) is associated with change in the substrate concentration in the enzyme layer that agrees with the dependence of the enzyme rate on the substrate concentration. The steady-state response is determined by the stationary substrate concentration and enzyme rate. This response is less than the maximal value due to the inhibition of enzyme activity with the substrate.
At the enzyme layer with a thickness of 10 μm, the response is almost 2 times lower, and the maximal value of the normalised substrate fits more precisely the value 0.316 (data not shown in figures). These results indicate that biosensor response is determined by enzyme kinetics.
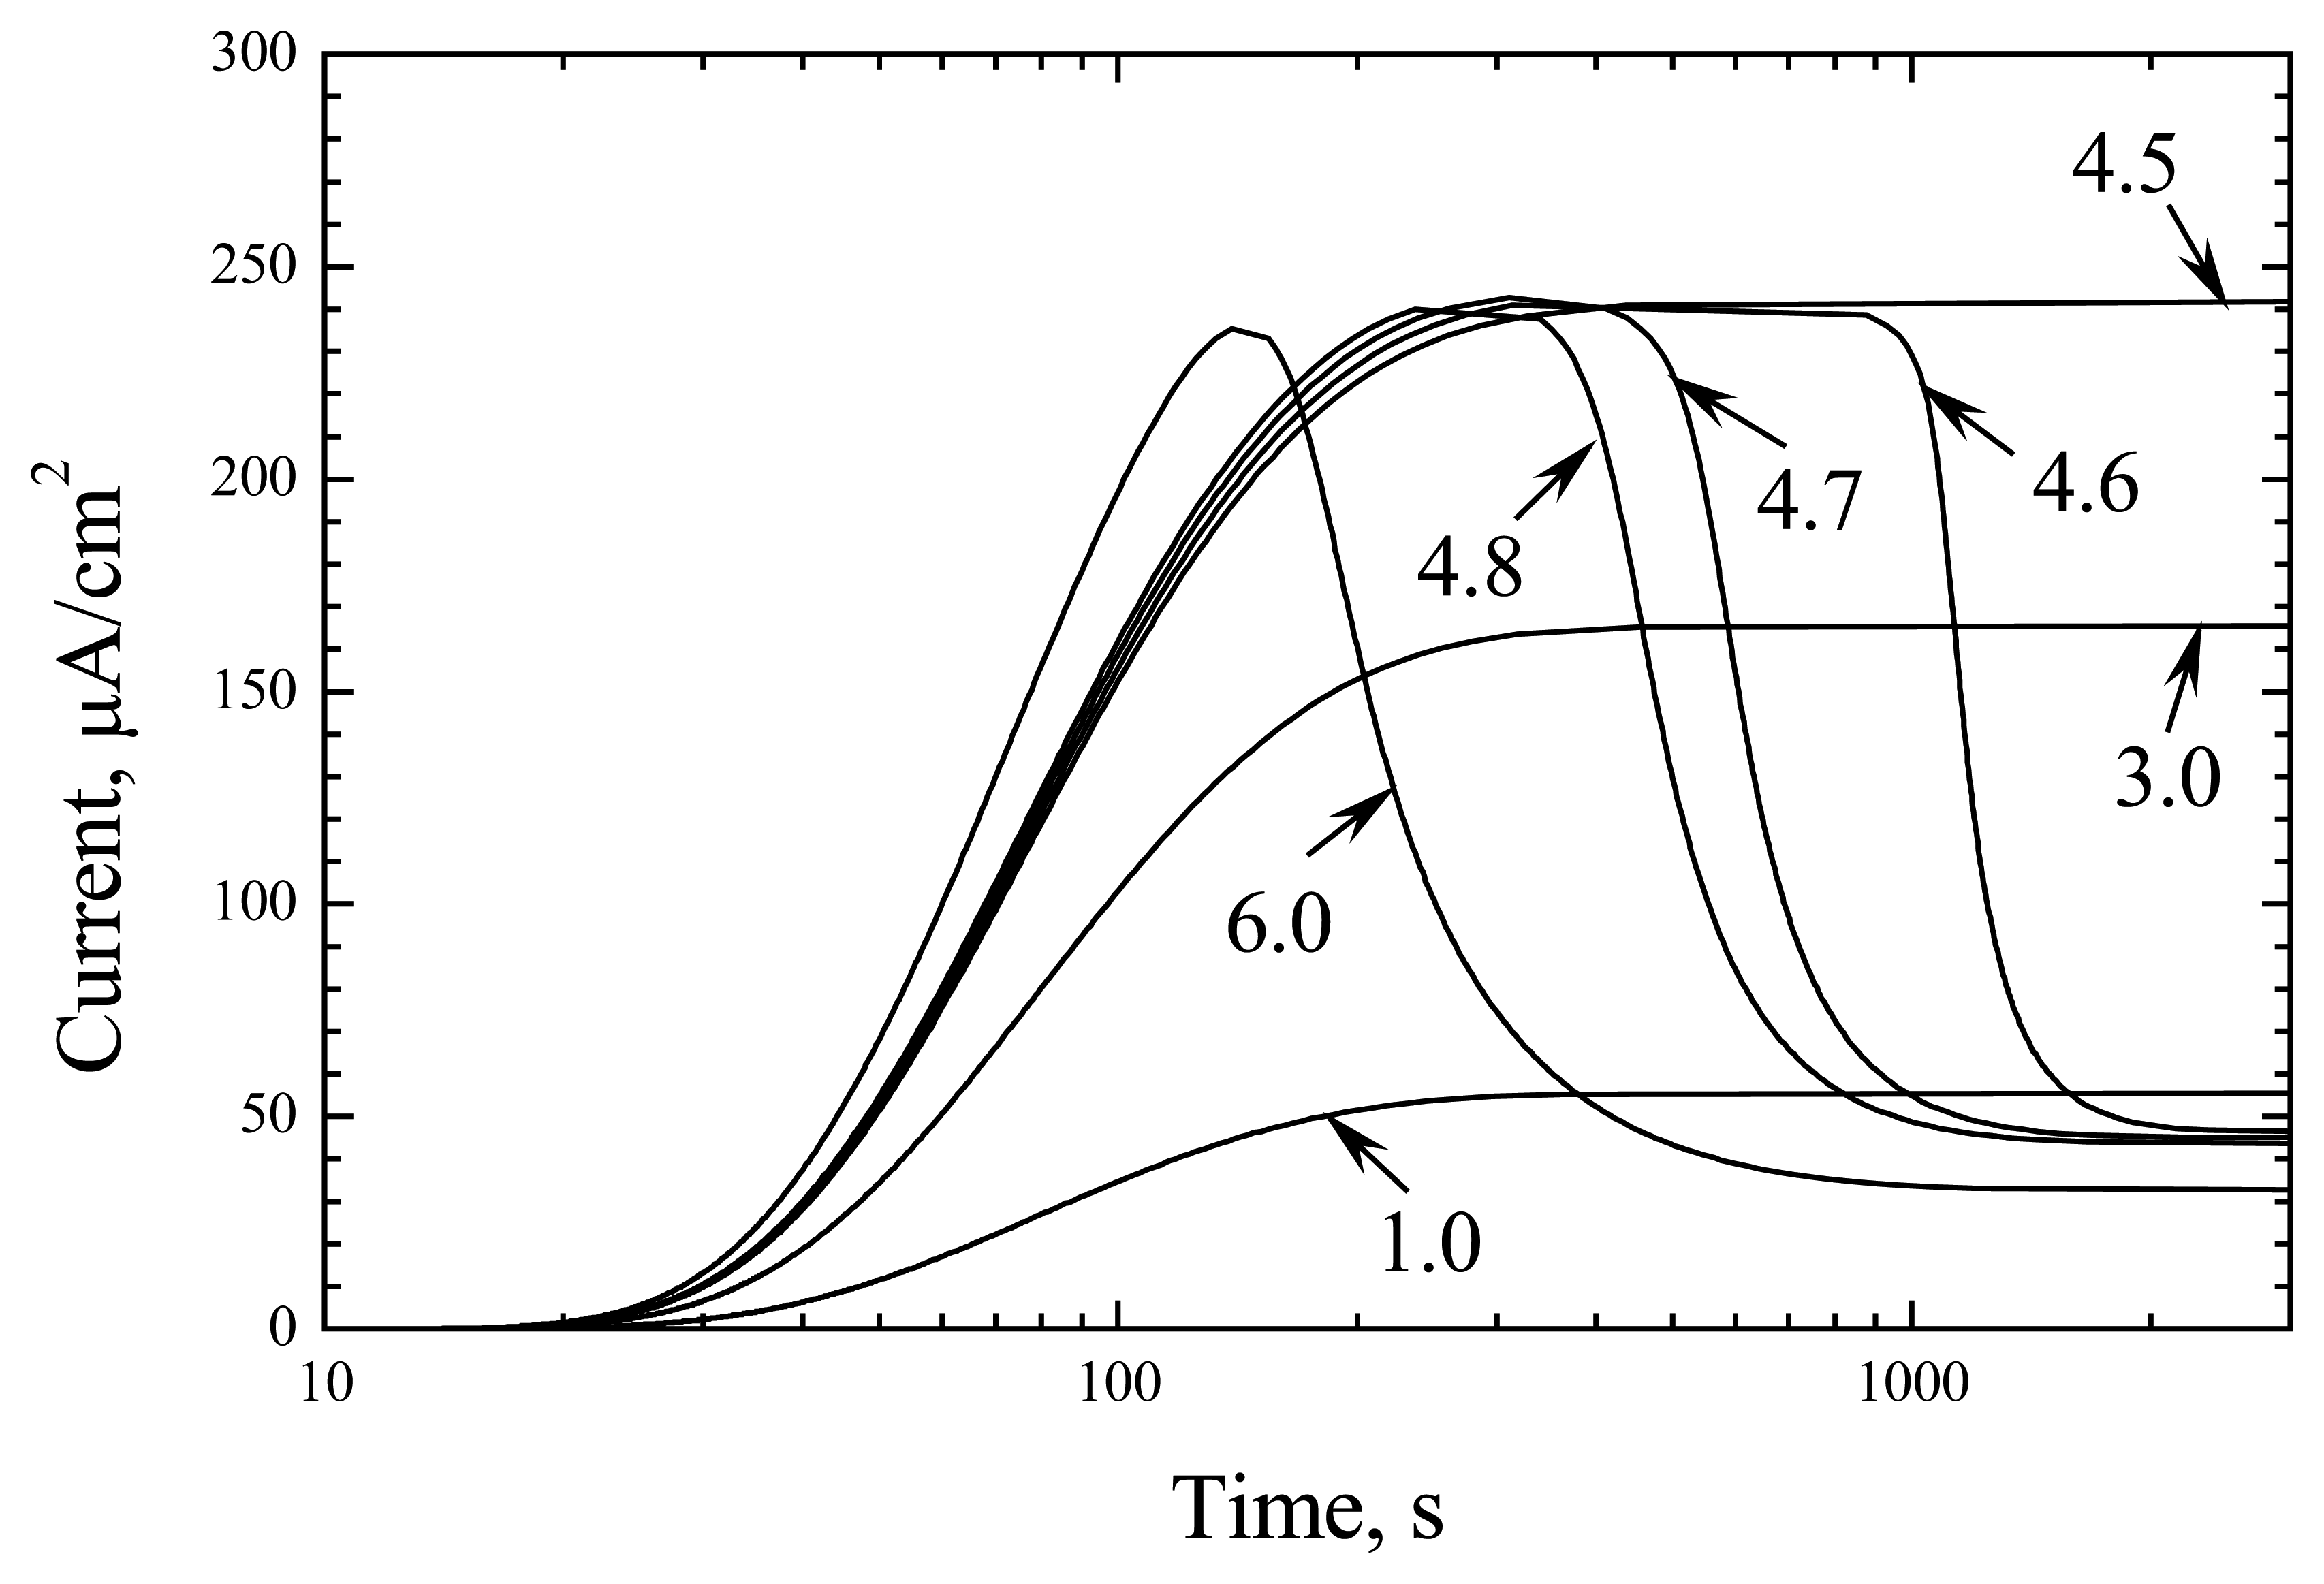
When enzyme activity is high, the response change is quite different at different substrate concentrations (
Fig. 3). At
S0/
KM less than 4.5, the response monotonically increases and saturates during 3000 s. However, a further small increase in substrate concentration causes a sharp decrease in response for a time of about 1000 s. This time becomes shorter to 300 s at
S0/
KM = 4.9, but the character of response change is similar. Further increase in
S0 changes the character of response kinetics as it is shown for
S0/
KM value 6 (
Fig. 3).
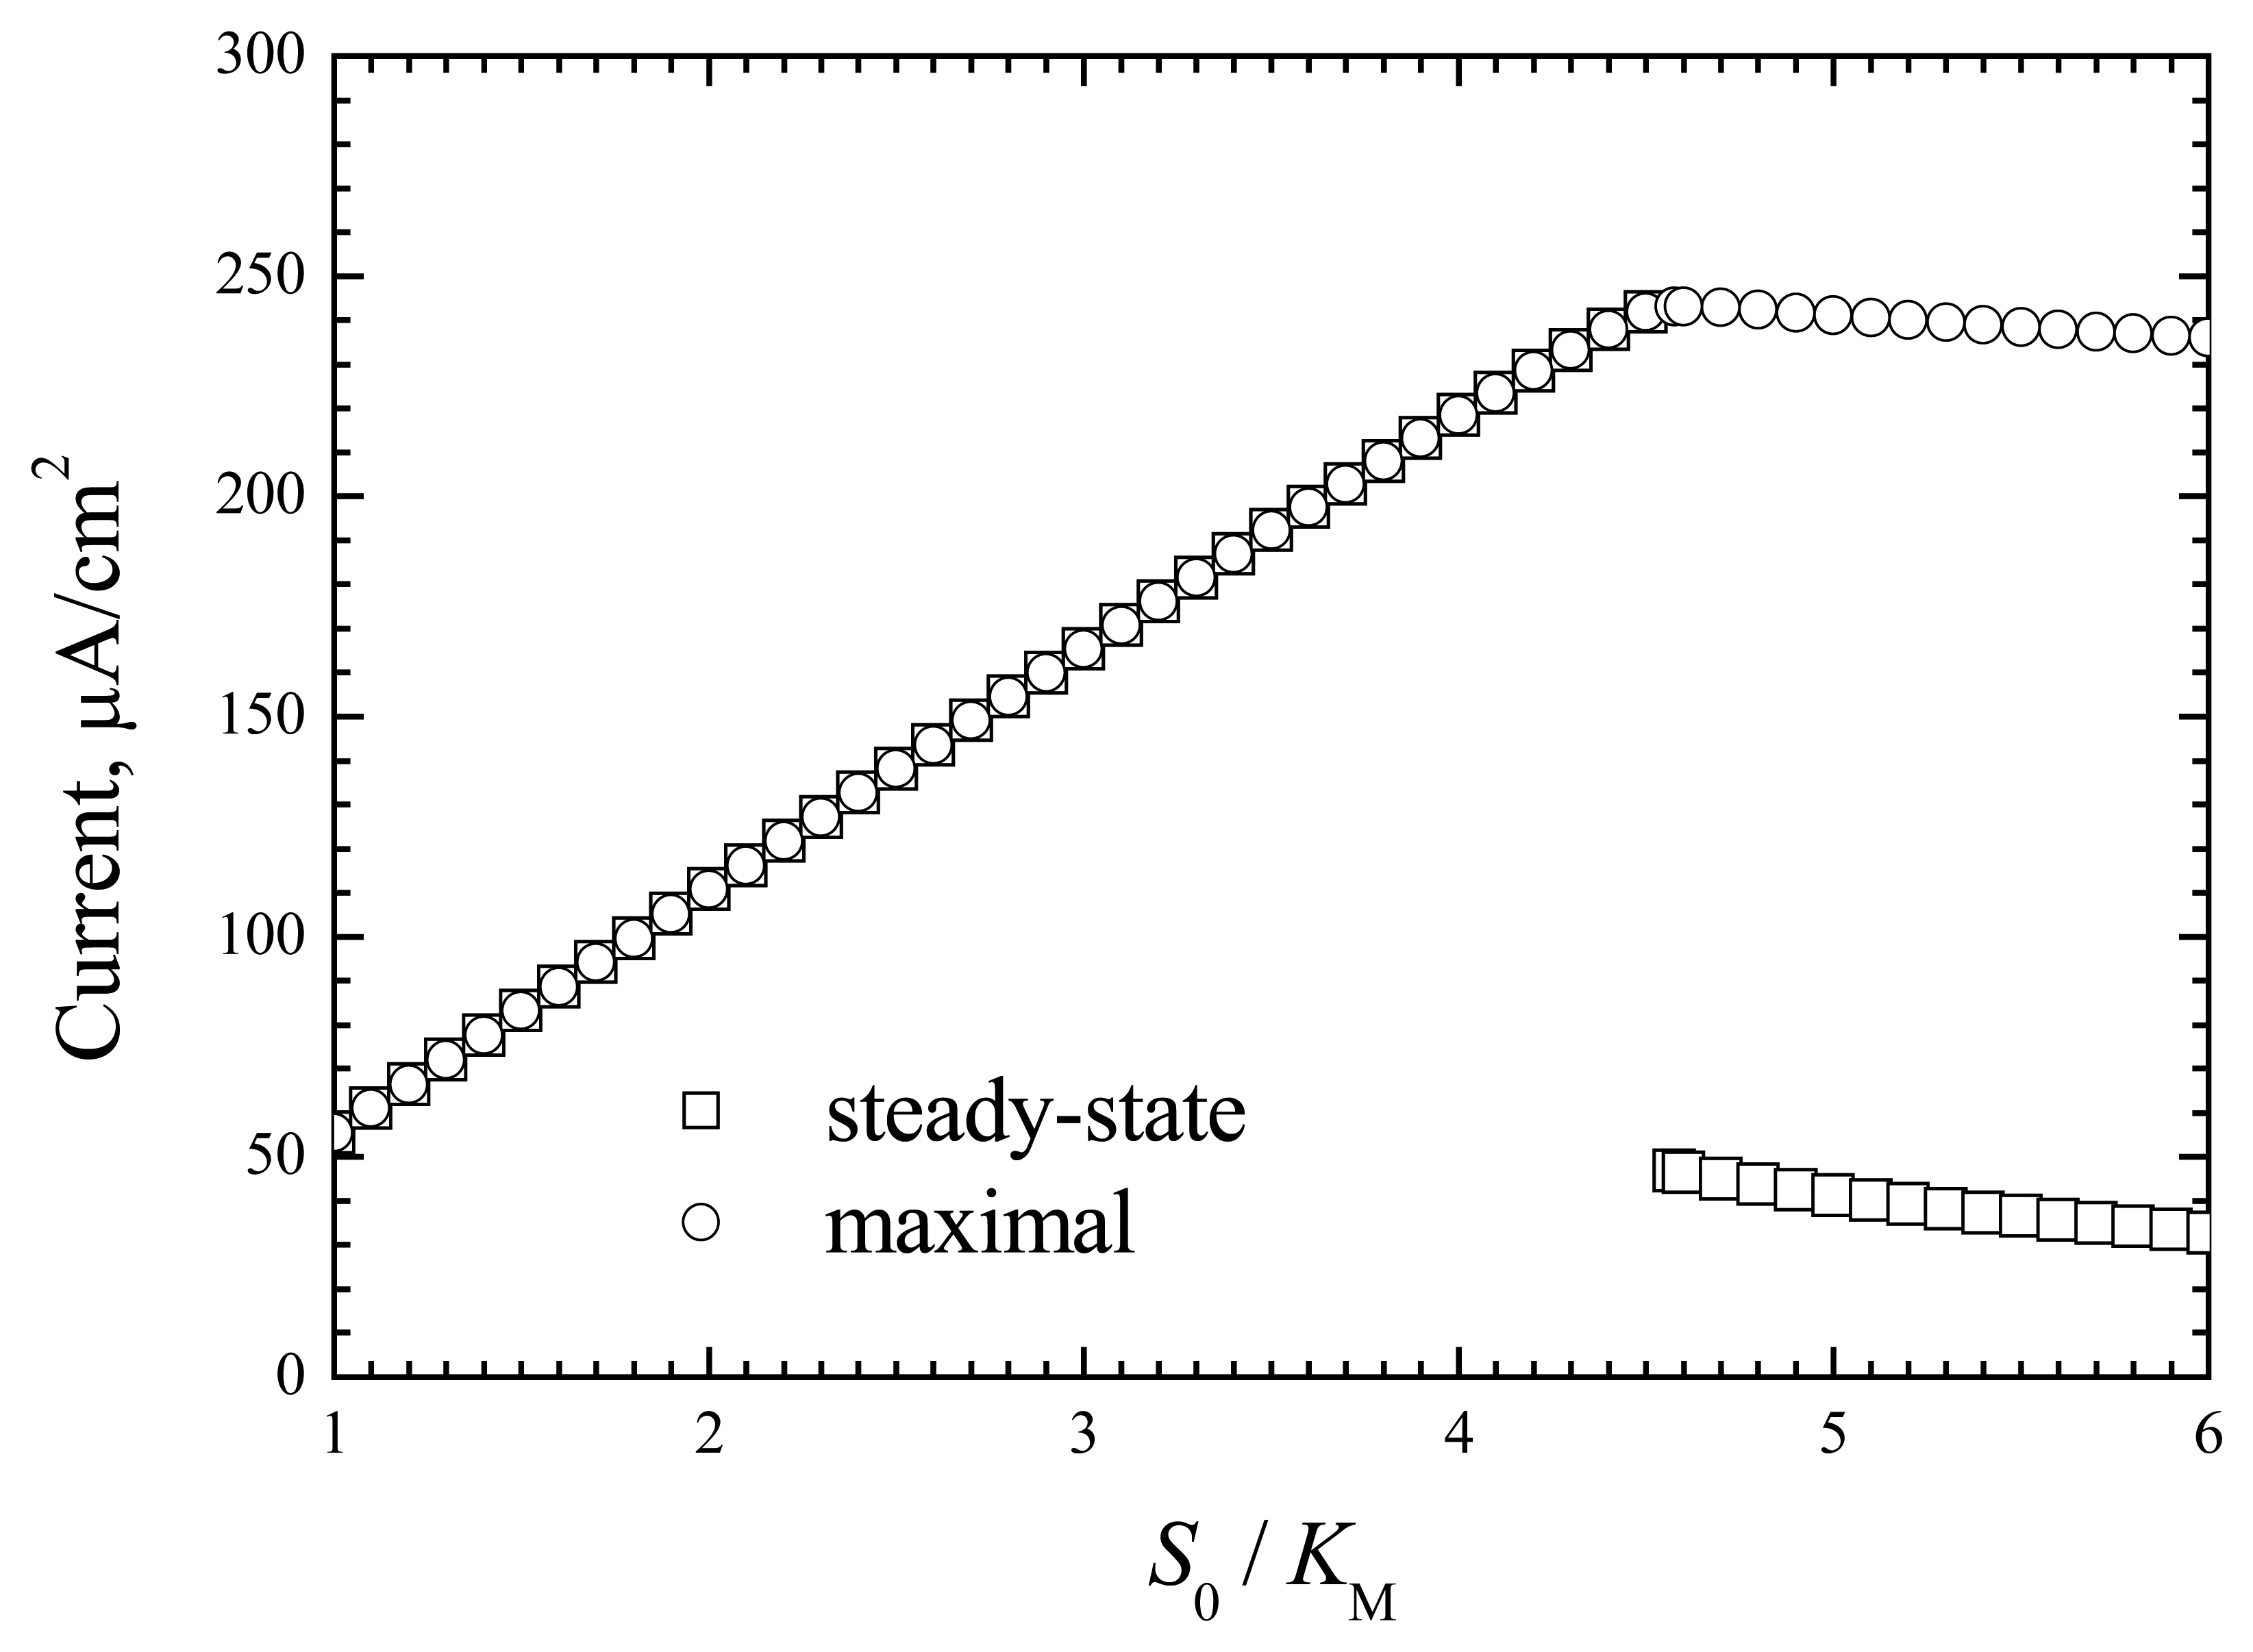
These sharp changes in response more precisely demonstrate the data presented in
Fig. 4.
If the thickness of the enzyme layer is lower (
d = 10 μm), the effect of a sharp change in response is much less pronounced (
Fig.5). Only at
S0/
KM value of about 2.5, some acceleration of response change can be indicated at
t = 1000 s.
To explain a sharp response change and non-typical calibration curves, the biosensor response was modelled at simplified external diffusion limitation and steady-state conditions (18), (19). If
Vmax = 10 mM/s and
d = 20 μm the analytical solution gave biosensor steady-state responses 62, 185, 50, 48, 47, 46 and 34 μA/cm2 at
S0/
KM 1.0, 3.0, 4.5, 4.6, 4.7, 4.8 and 6.0, respectively. These values, with exception of the value at
S0/
KM = 4.5, are very similar to those digitally calculated. The difference of the values at
S0/
KM = 4.5 indicates some critical concentration when the simple external diffusion model does not further represents the model of the biosensor. The modelling of simple external diffusion limitation, however, permits to explain this difference, as well as the sharp change in response kinetics (
Fig.3) and concentration dependence (
Fig. 4).
The solution of the cubic
equation (18) produces 3 meanings of
Ss at some
S0/
KM. At
Vmax = 10 mM/s and
d = 20 μm these values appear at 3.3 <
S0/
KM < 4.4. If
d= 10 μm the zone is more narrow; 3 solutions can be found at 2.2 <
S0/
KM < 2.4. At low enzyme activity there is always only a single value of
Ss. These calculations indicate the zones of
S0/
KM where multi steady-state solution exists. They are close to the critical zones found by digital calculations, and little difference is caused by excluding the internal diffusion in the simplified model.
The presence of zones with multi-concentrations means that at the same bulk substrate concentration 2 stable surface concentrations may exist. At external diffusion limitation, the concentration change was indicated at the vanishing
S0 change [
18]. The presence of the enzyme layer with fixed thickness produces different concentration zones inside the enzyme layer. Therefore, the transition is not so sharp. Nevertheless, the kinetics of response change in the multi-concentration zone (4.9 >
S0/
KM > 4.5) are still faster than in the other zones indicating a critical state of the system (
Figs. 3 and
4). A more detailed analysis of these processes, possibly, can be evaluated with higher space resolution during the digital modelling. A decrease in enzyme layer thickness decreases diffusion modules and the multi-concentration zone becomes very narrow. For this reason the kinetics of response change (
Figs. 5 and
6) are similar to those of all substrate concentrations (
Figs. 1 and
2).
