Article

Catalytic Oxidation of Thiourea at Alumina Modified Pt Electrode

Department of Chemistry, Faculty of Science, University of Bu-Ali-Sina, Hamadan Iran
*
Author to whom correspondence should be addressed.
Sensors 2003, 3(11), 534-543; https://doi.org/10.3390/s31100534
Submission received: 19 August 2003 / Accepted: 7 October 2003 / Published: 5 December 2003

Abstract

:
Catalytic oxidation of thiourea has been studied at alumina modified Pt electrode using cyclic voltammetry. The results indicate the suitability of alumina modified Pt electrode for voltammetric determination of thiourea. The catalytic peak currents are linearly dependent on the thiourea concentration in the range 2.5 × 10⁻⁵ – 7.0 × 10⁻³ M. The usefulness of the method was tested in determination of thiourea in real samples. Moreover, in this work the heterogeneous electron transfer rate constants of thiourea at the surface of modified and unmodified Pt electrodes were estimated by comparing the experimental cyclic voltammetric responses with the digital simulated results.

Introduction

Thiourea and its derivatives are widely used in the rubber industry as accelerators, in photography as fixing agents and to remove stains from negatives, and in agriculture as fungicides, herbicides and rodenticides. The use of an aqueous solution of thiourea as leaching agent for gold has been widely reported in the literature. Thiourea is also used as a spectrophotometric reagent for the determination of several metals [1]. It is toxic owing to its influence on the metabolism of carbohydrates [2]. Moreover, thiourea has been labeled as having carcinogenic activity [3]. A survey of analytical procedures that exist in the literature reveals that titrimetry with haloamines [4], N-bromosuccinimide [5], iodine [6] or mercury(II) nitrate [7] are commonly used for analysis of thiourea. Some Raman spectrometry [8], spectrophotometry [9], polarography [10], stripping voltammetry [11,12], high performance liquid chromatography [13,14], kinetic methods [15,16], and FTIR spectrometry [17] procedures have also been reported for determination of thiourea. In spite of the suitability of the detection limit of some of presented methods, these require complicated and expensive instruments or are subject to interferences from other organic compounds. These prompted us to investigate anodic behavior of thiourea at platinum modified and unmodified electrodes by cyclic voltammetry. Chemically modified electrodes (CMEs) have been widely used to enhance the reversibility of chemical redox reactions [18] and numerous examples of electrocatalytic CMEs systems have been reported [19,20]. A type of electrocatalysis that relies on the dispersion of alumina particles on a glassy carbon surface was illustrated in the voltammetric studies of Zak and Kuwana [21,22]. It has been suggested that the electrocatalysis at these electrodes involves adsorption of the electroactive species on the alumina and electrolysis of the surface species that then undergoes catalytic reaction with solution species.
In this work we have examined the utility of alumina modified platinum electrode for oxidation of thiourea. Comparison to bare platinum electrode emphasizes the advantages of the modified Pt surface. Our investigation shows the suitability of alumina modified Pt electrode for determination of thiourea. We present a very simple catalytic method for the analysis of thiourea based on the oxidation of it at the surface of alumina modified Pt electrode with very facile modification procedure. Moreover, in this work the heterogeneous electron transfer rate constants of thiourea at the surface of modified and unmodified platinum electrodes were estimated by comparing the experimental cyclic voltammetric responses with the digital simulated results.

Experimental

Cyclic voltammetry and linear sweep voltammetry were performed using an Autolab model PGSTAT20 potentiostat/galvanostat. The working electrode used in the voltammetric experiments was a Pt disc (1.8 mm diameter) and a platinum wire was used as counter electrode. The working electrode potentials were measured versus the SCE (all electrodes from Azar electrode). The platinum was modified by polishing the surface with 1-μm α-alumina on a deck of a polishing cloth; using a circular motion for 1 min. Reagent-grade thiourea (from Fluka) was used without further purification. The alumina was pro-analysis grade (from E. Merck) and used as received. The homogeneous electron transfer rate constants were estimated by analyzing the cyclic voltammetric responses using the simulation CVSIM software [23].

Results and Discussion

Electrochemical oxidation of thiourea at bare Pt-electrode

Electrochemical study of 0.75 mM thiourea in acetate buffer solution (C = 0.15 M, pH = 4.5) at bare Pt electrode has been studied using cyclic voltammetry (
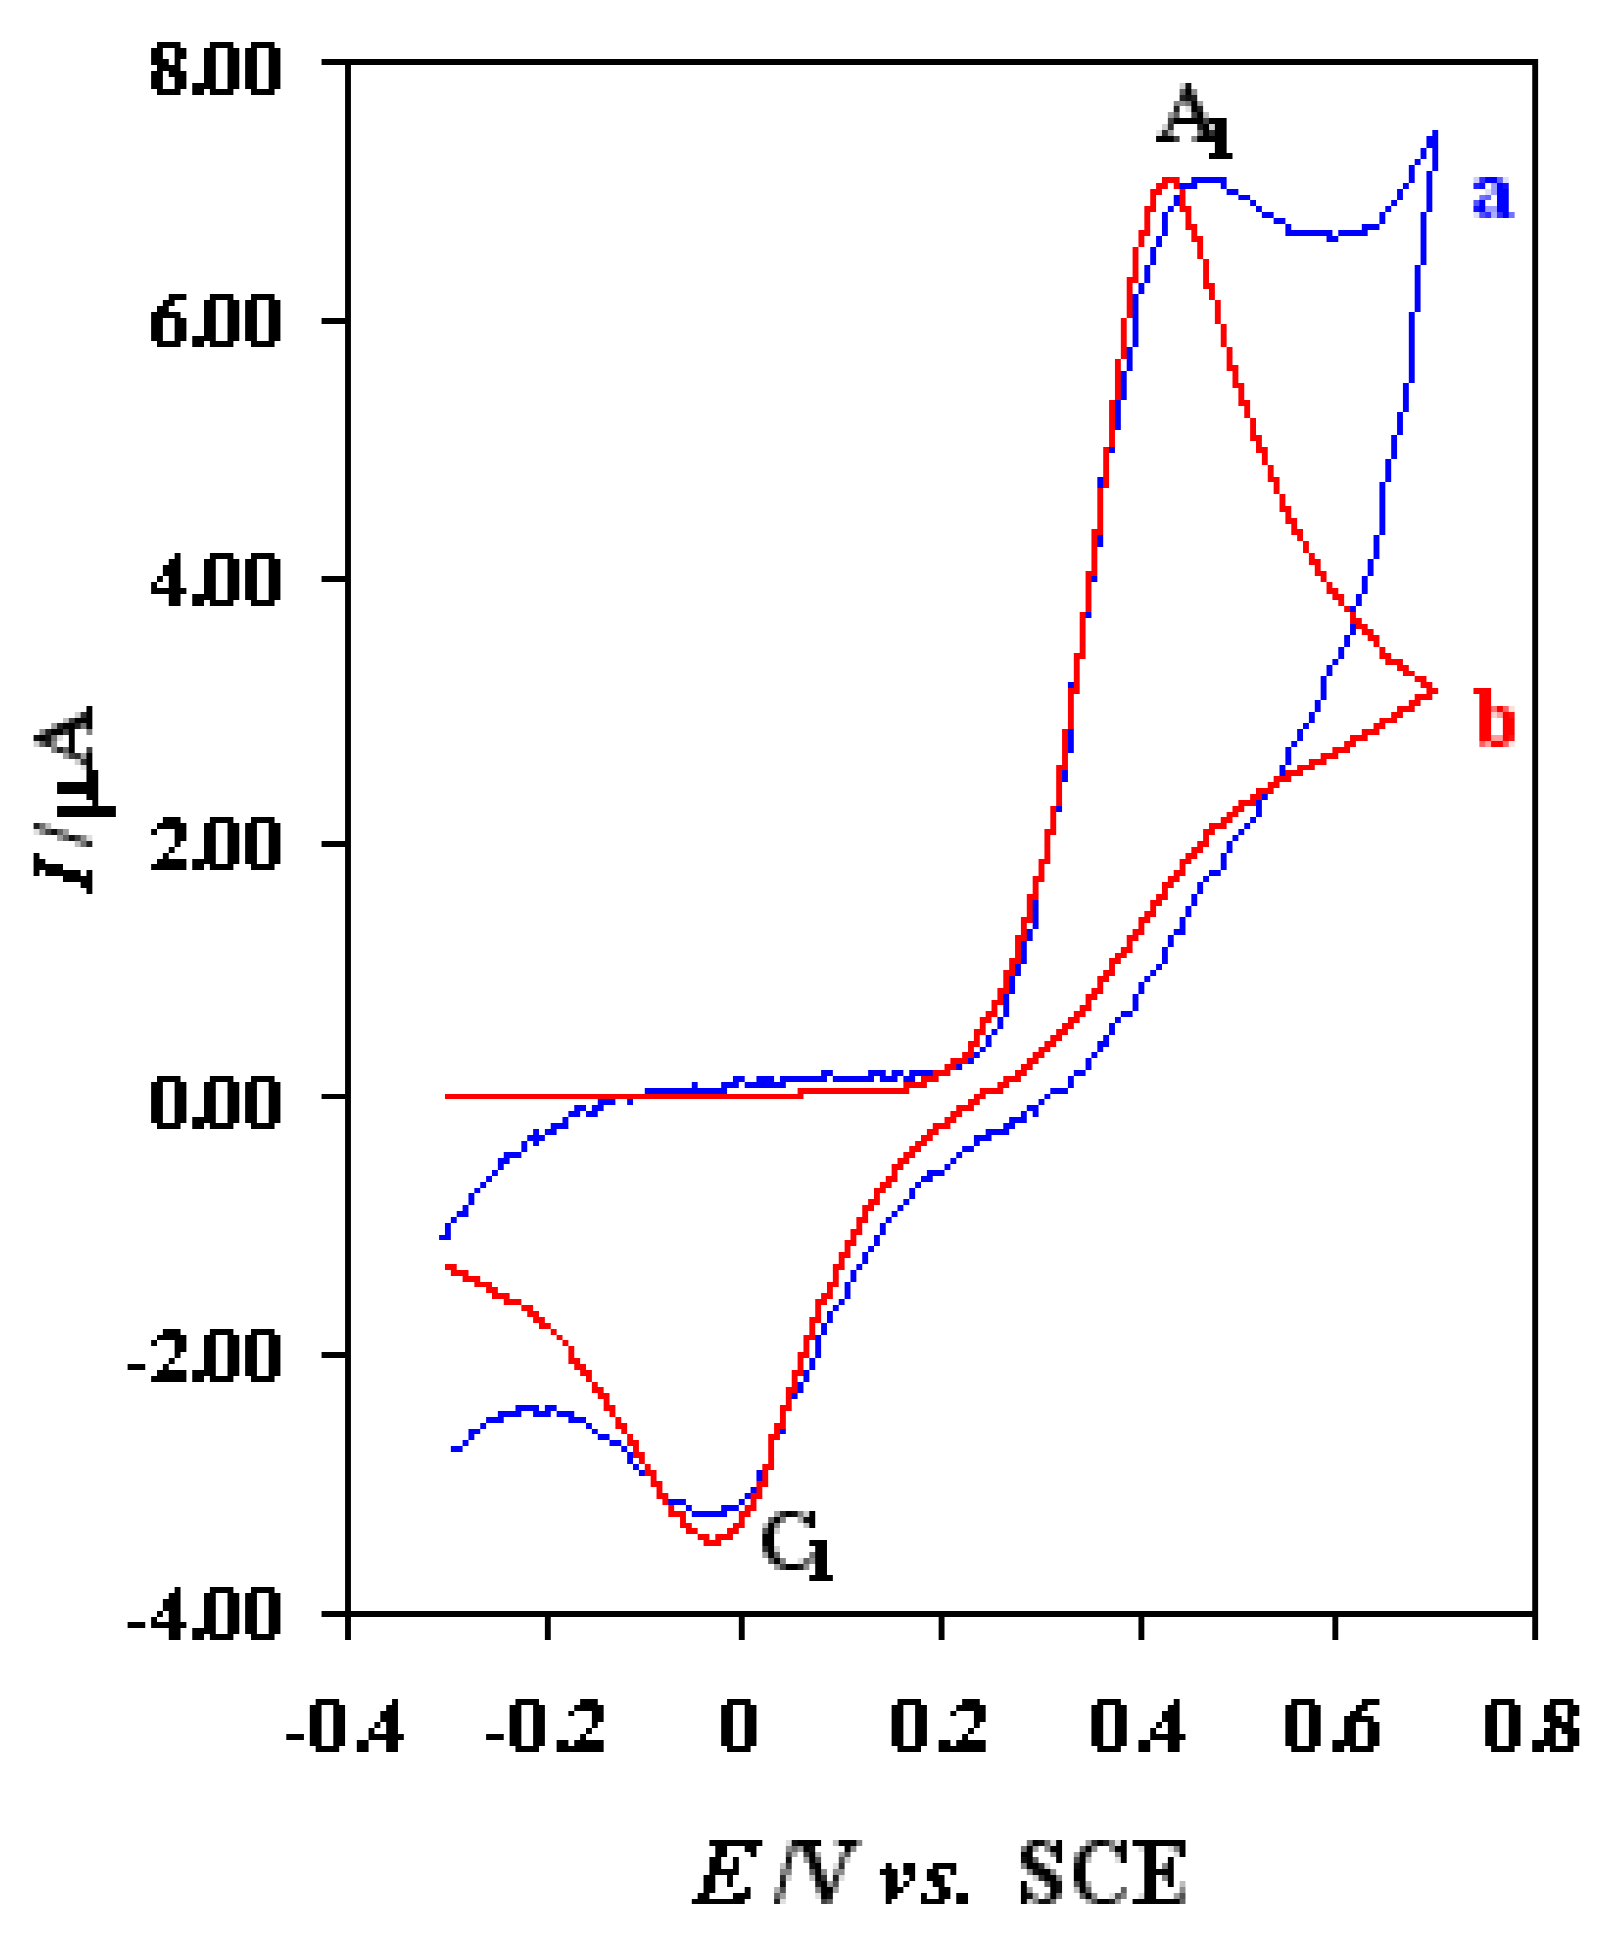
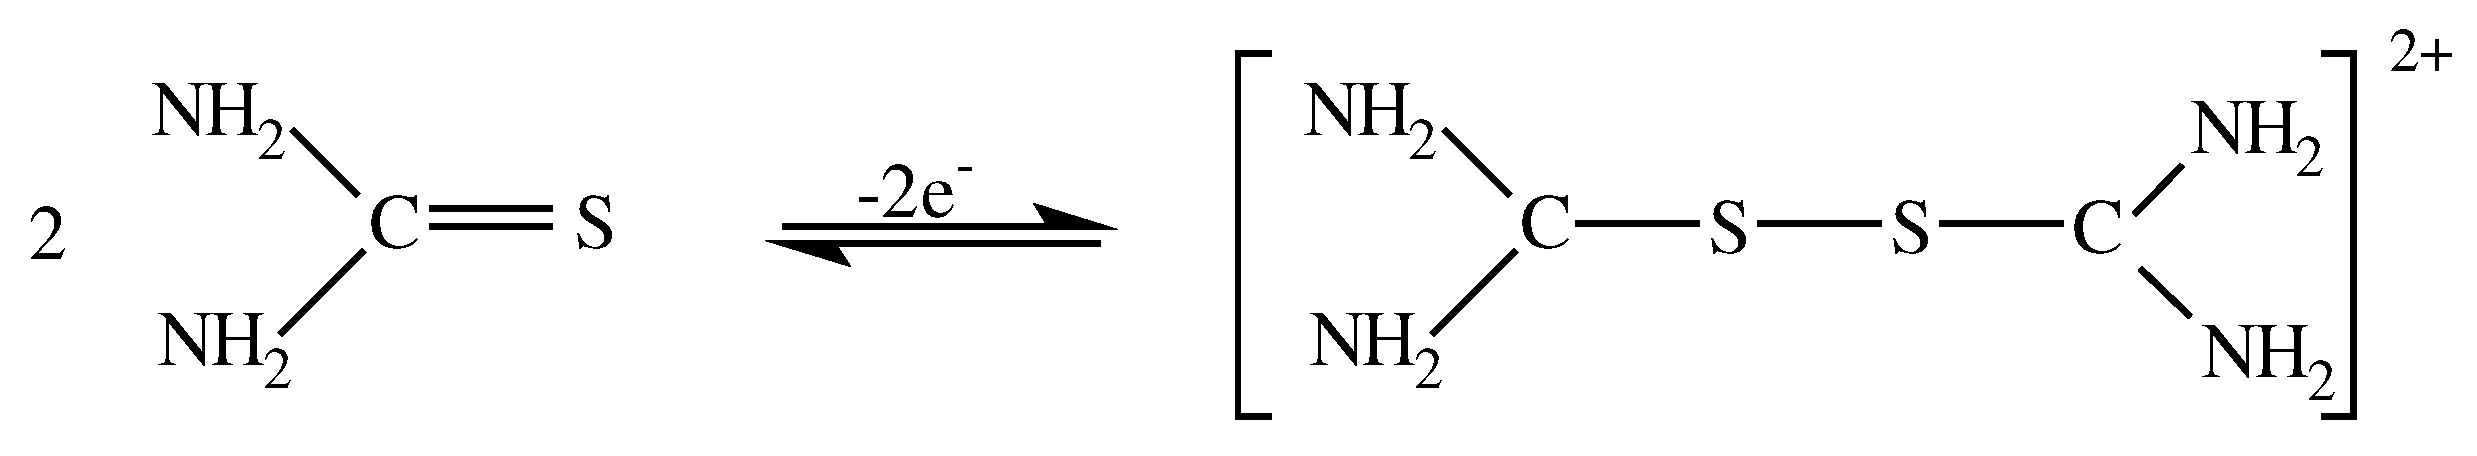
Fig. 1, curve a). The voltammogram shows one anodic (A1) and corresponding cathodic peak (C1), at 0.47 V and –0.03 V, respectively, which correspond to the transformation of thiourea to c,c’-dithiodiformamidinium ion and vice versa within a quasi-reversible (Scheme 1) [24].
Scheme (1).
Scheme (1).
Sensors 03 00534 g007
Figure 1. Experimental (curve a) and simulated (curve b) cyclic voltammograms of thiourea at bare Pt electrode in acetate buffer solution (C = 0.15 M, pH = 4.5). Scan rate, 50 mV/s. Thiourea concentration, 0.75 mM.
Sensors 03 00534 g001
In this case, the peak separation is about 500 mV and increase with increasing the potential scan rate (Fig. 2). In addition, anodic peak current (I
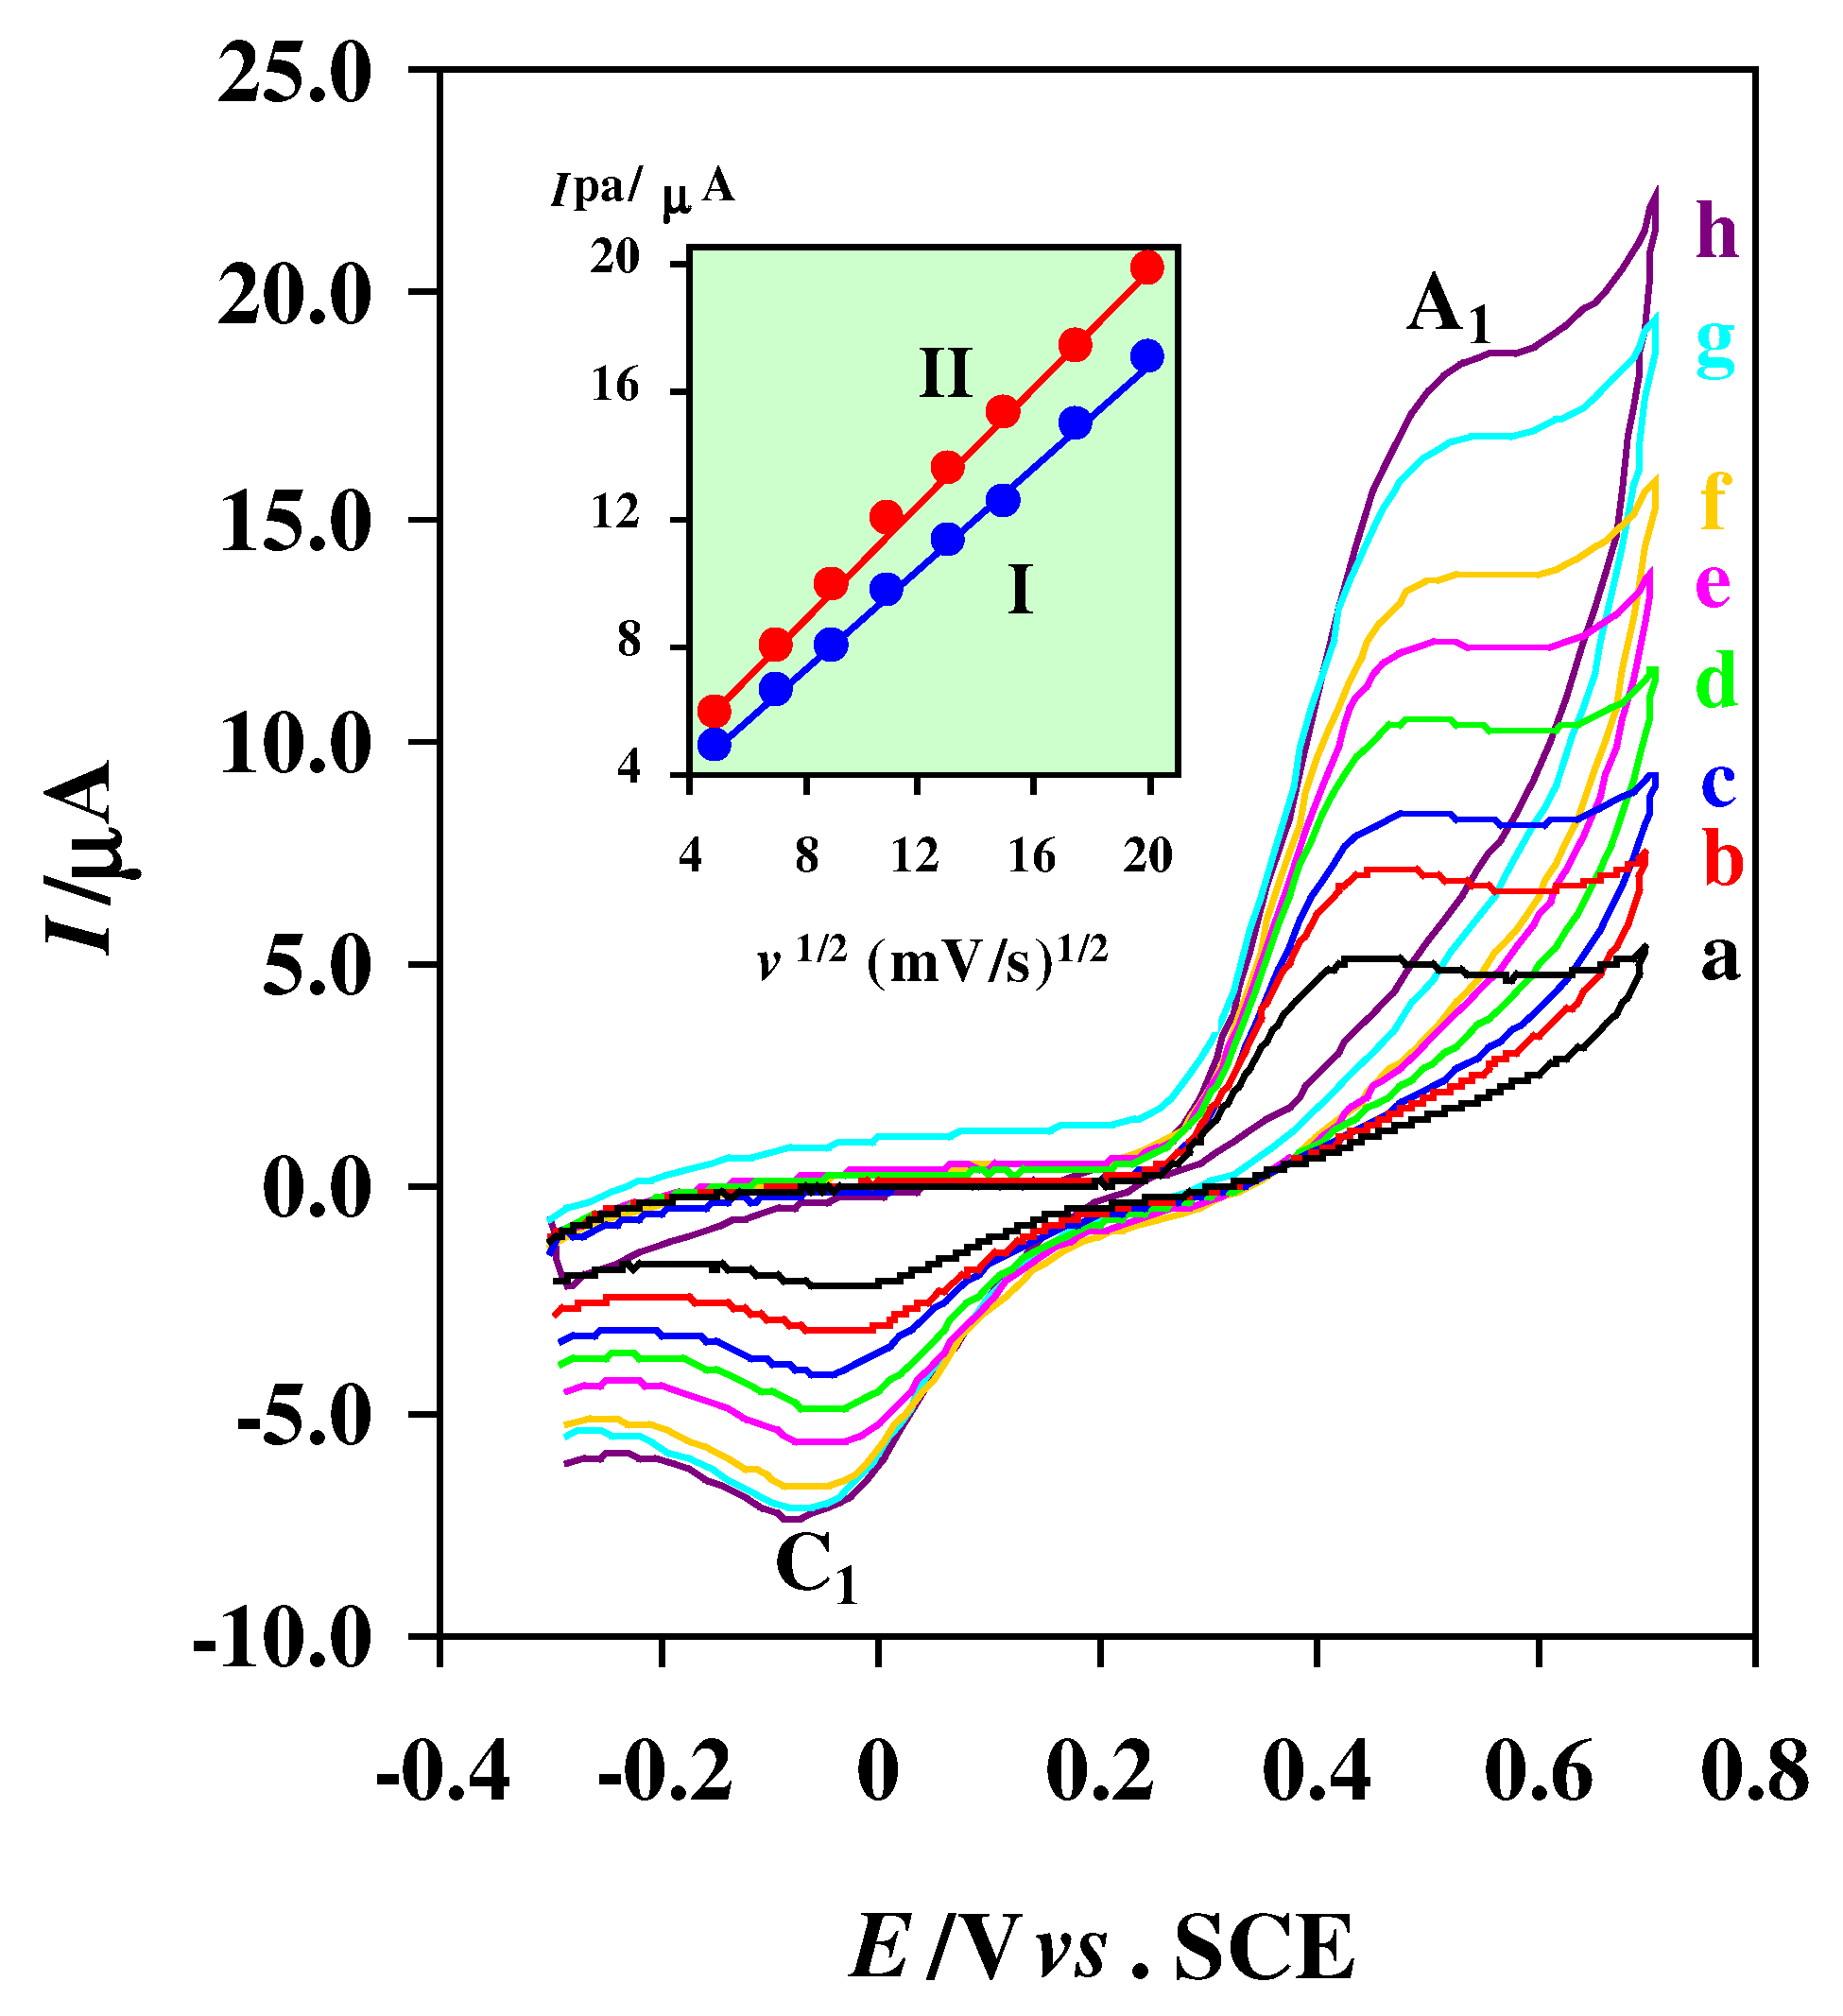
pa) increased linearly with the square root of scan rate in the range of 25-400 mV/s, as expected for diffusion-controlled process, with the regression equation of Ip=0.869 + 0.799v1/2 (Ip: μA, v: mV/s, r = 0.999) (Fig. 2, inset). The electrochemical oxidation of thiourea at unmodified Pt electrode tested by digital simulation, and the heterogeneous electron transfer rate constant has been estimated by comparison of the simulation result with experimental cyclic voltamogram (Fig. 1, curve b). The transfer coefficient (α) was assumed to be 0.6, and the formal potentials were obtained experimentally as the average of the two peak potentials observed in cyclic voltammetry. The calculated heterogeneous electron transfer rate constant is 7.5 × 10⁻⁵ cm/s.
Figure 2. Typical voltammograms of 0.75 mM of thiourea at bare Pt electrode (2 mm diameter) in acetate buffer solution (C = 0.15 M, pH = 4.5) at various scan rates. Scan rates from (a) to (h) are: 25, 50, 80, 120, 170, 225, 306 and 400 mV/s, respectively. Inset: variation of anodic peak current (Ipa) versus square root of scan rate; (I) at bare Pt electrode, (II) at alumina Pt modified electrode. T= 25 ± 1 °C.
Sensors 03 00534 g002

Electrochemical oxidation of thiourea at alumina modified Pt electrode

Electrochemical study of 0.75 mM thiourea in acetate buffer solution (C = 0.15 M, pH = 4.5) at alumina modified Pt electrode has been studied using cyclic voltammetry (
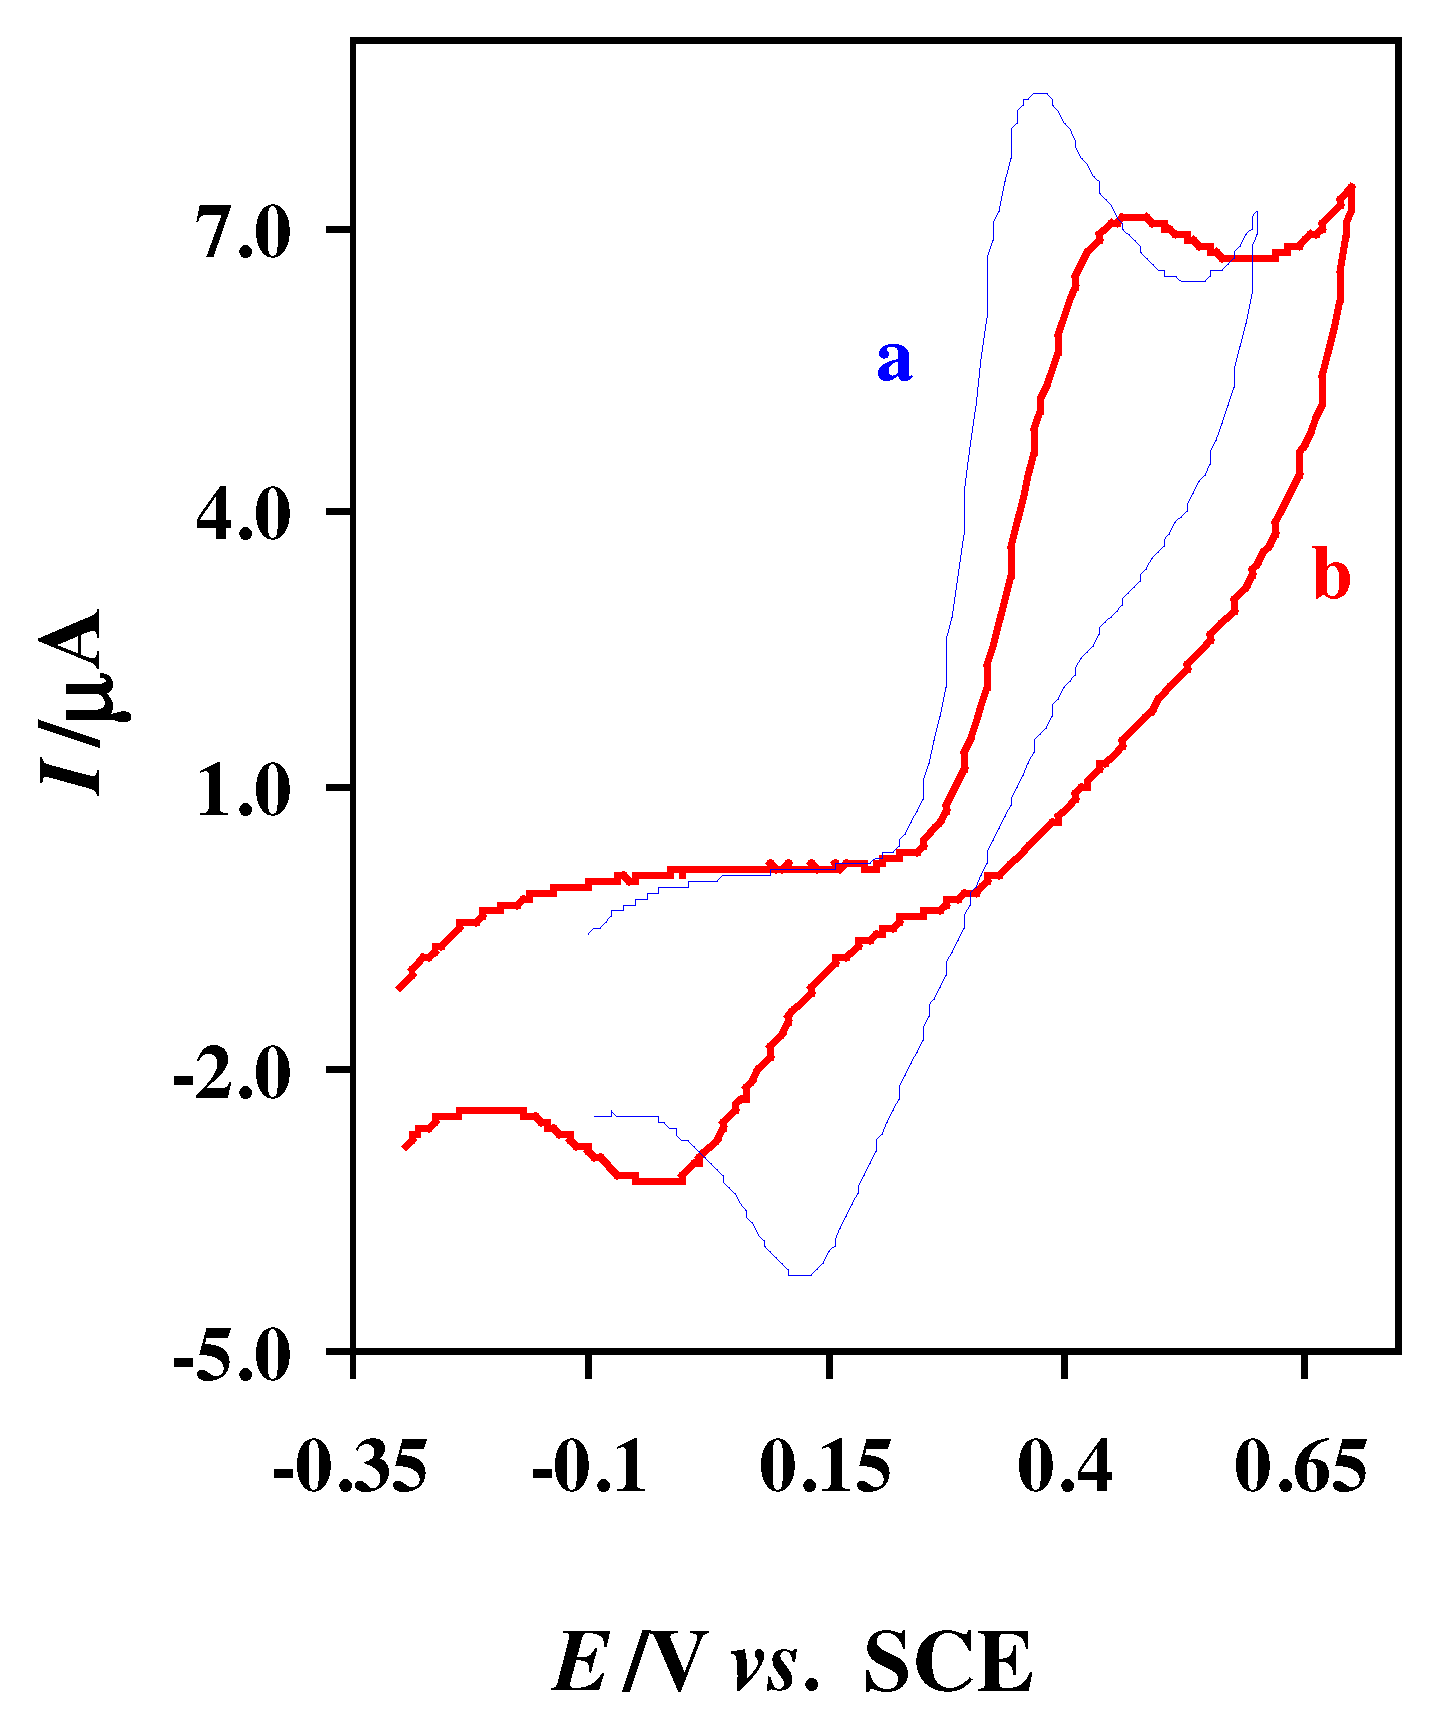
Fig. 3, curve a). A pair of redox peaks of thiourea was observed comparing with small peaks on bare Pt electrode. The oxidation potential shifted to the negative direction and the peak current increased compared with the cyclic voltammograms at the unmodified electrode (Fig. 3, curve b), because the modified electrode accelerated the rate of electron transfer of thiourea. Moreover, the peak separation (ΔEp) decreased about 250 mV (Epa= 0.37, Epc=0.12 V vs. SCE).
Figure 3. Cyclic voltammograms of thiourea at modified (curve a) and unmodified (curve b) Pt electrode in acetate buffer solution (C = 0.15 M, pH = 4.5). Scan rate, 50 mV/s. Thiourea concentration, 0.75 mM.
Sensors 03 00534 g003
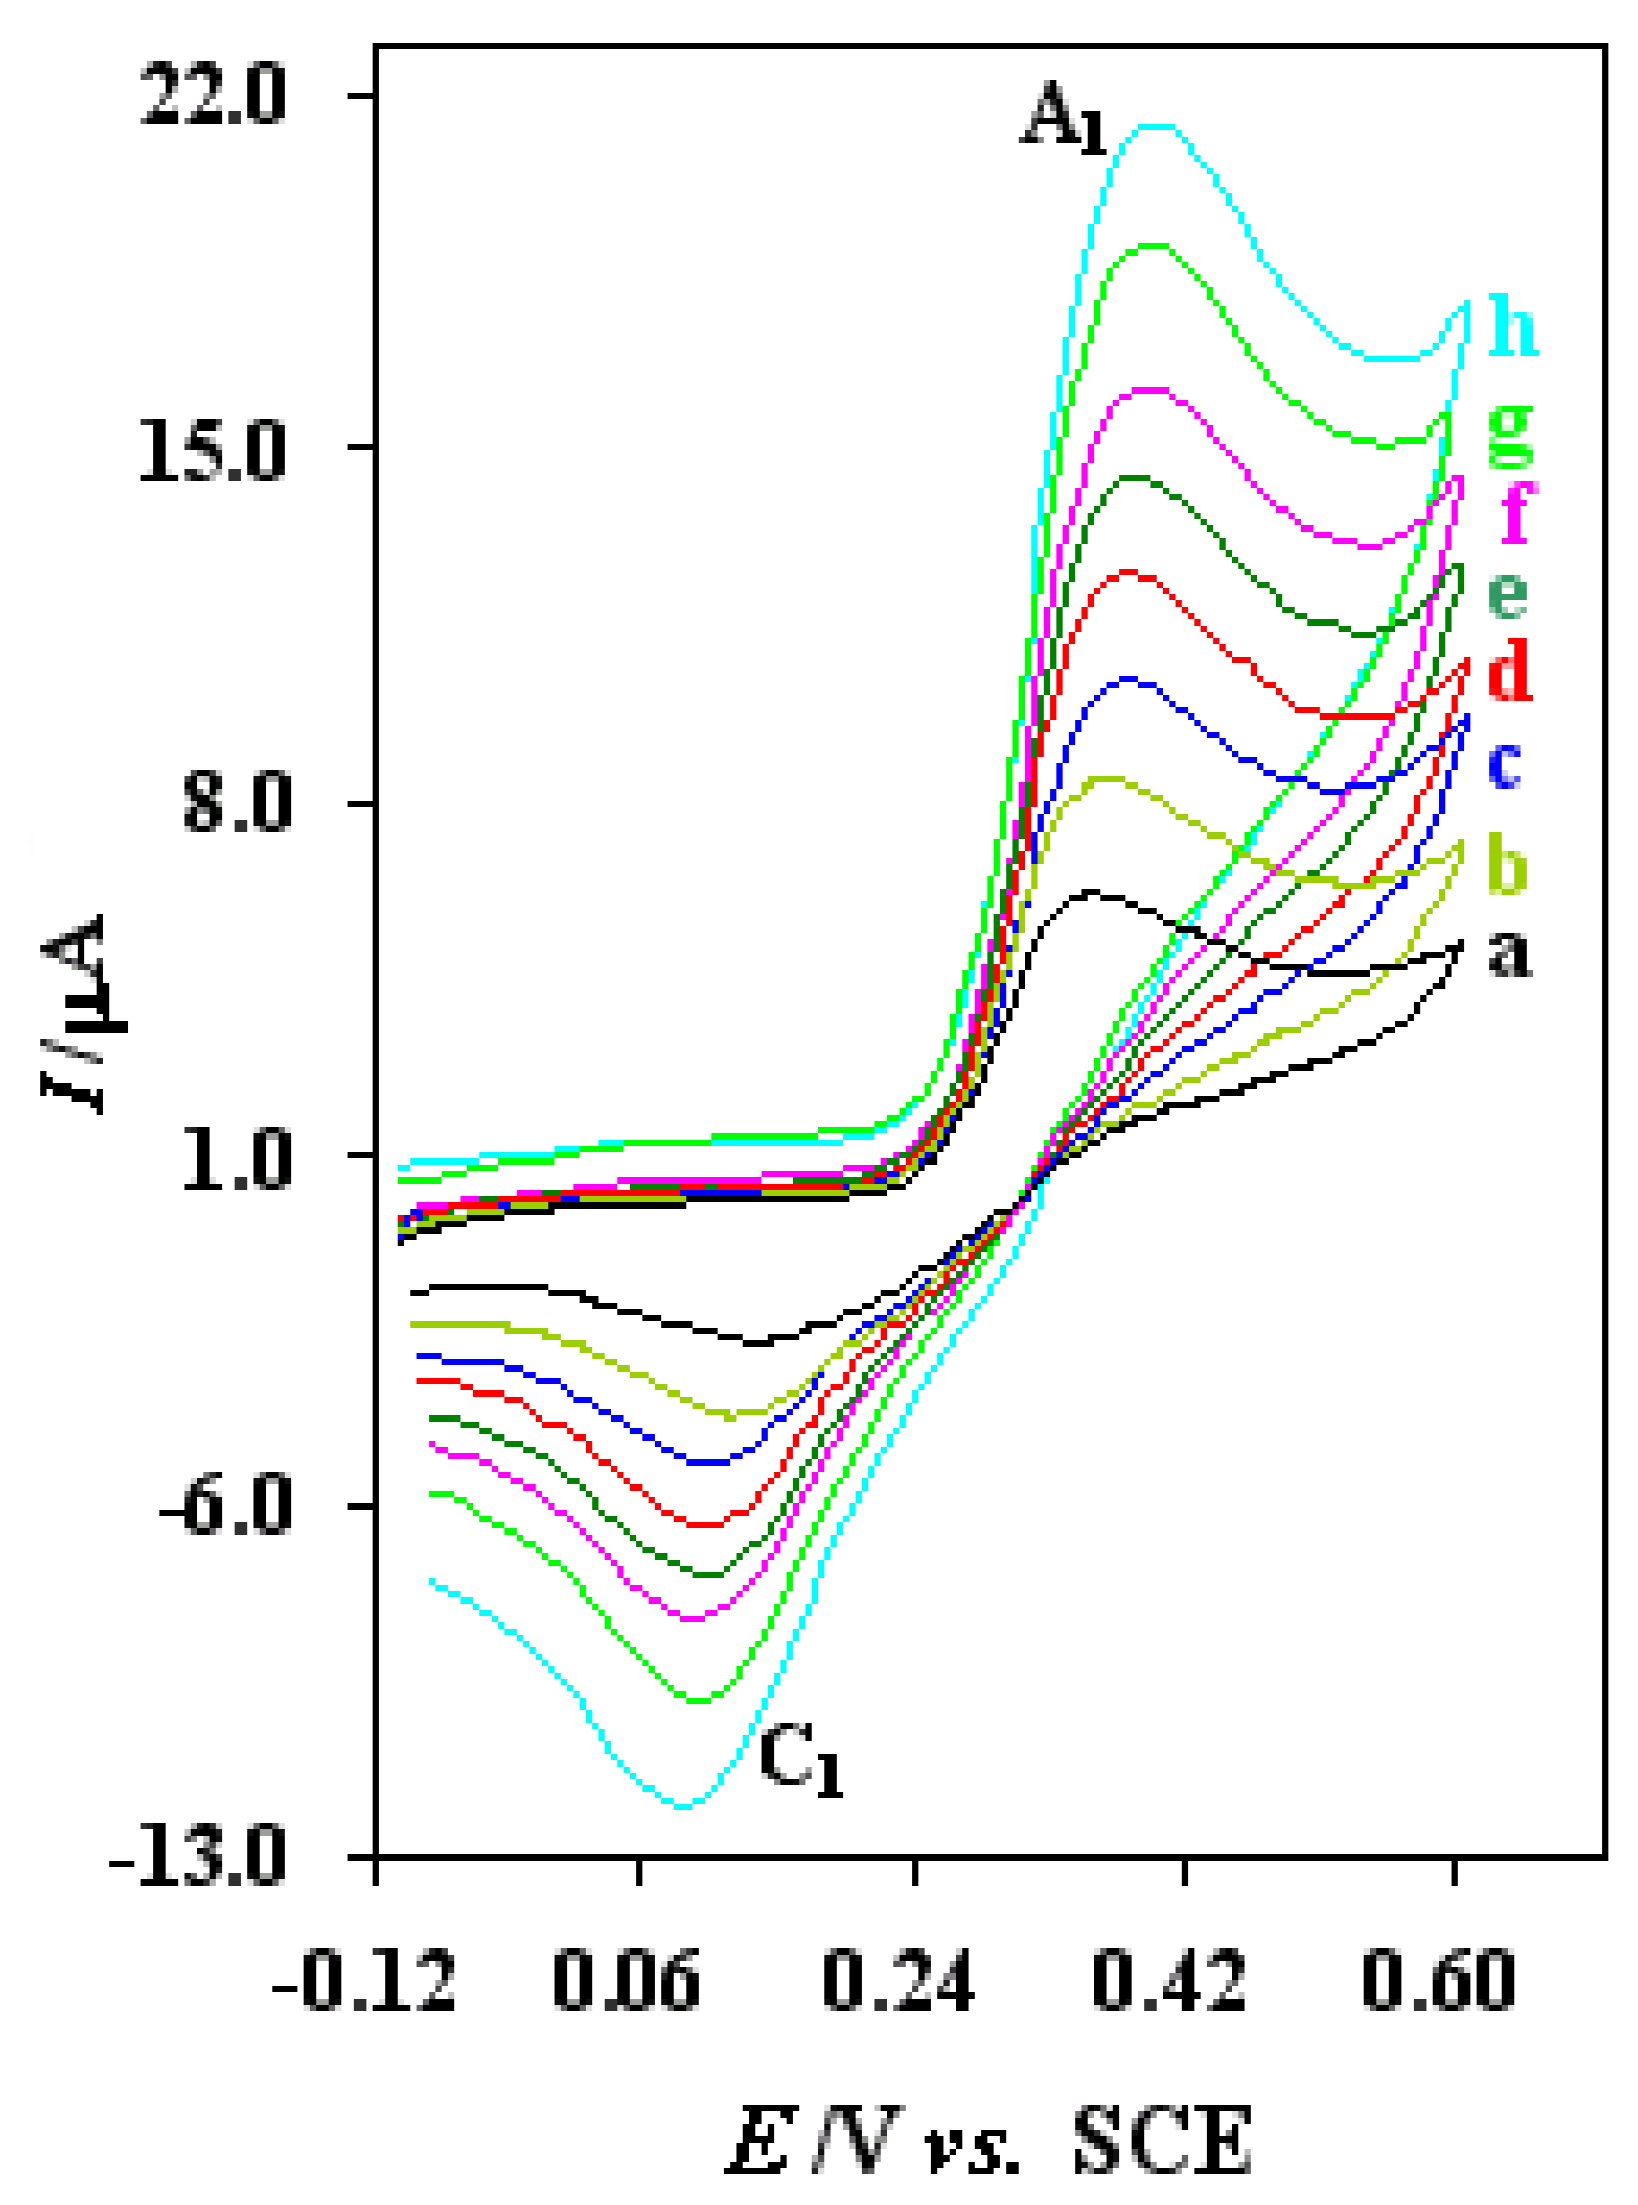
In addition, the scan rate dependence of modified electrode in 0.75 mM thiourea was also studied (Fig. 5). As the scan rate increased, the anodic peak current (Ipa) increased linearly with the square root of scan rate in the range from 25 to 400 mV/s, with the regression equation of Ip=1.597 + 0.911v1/2 (Ip: μA, v: mV/s, r = 0.999) (Fig. 2, inset). It demonstrates that this electrode reaction is concerned with the diffusion process. The slope is proportional to the standard rate constant and indicates the significant improvements in oxidation of thiourea at alumina modified Pt electrode surface. The electrochemical oxidation of thiourea at modified Pt electrode tested by digital simulation, and the heterogeneous electron transfer rate constant has been estimated by comparison of the simulation result with experimental cyclic voltamogram (
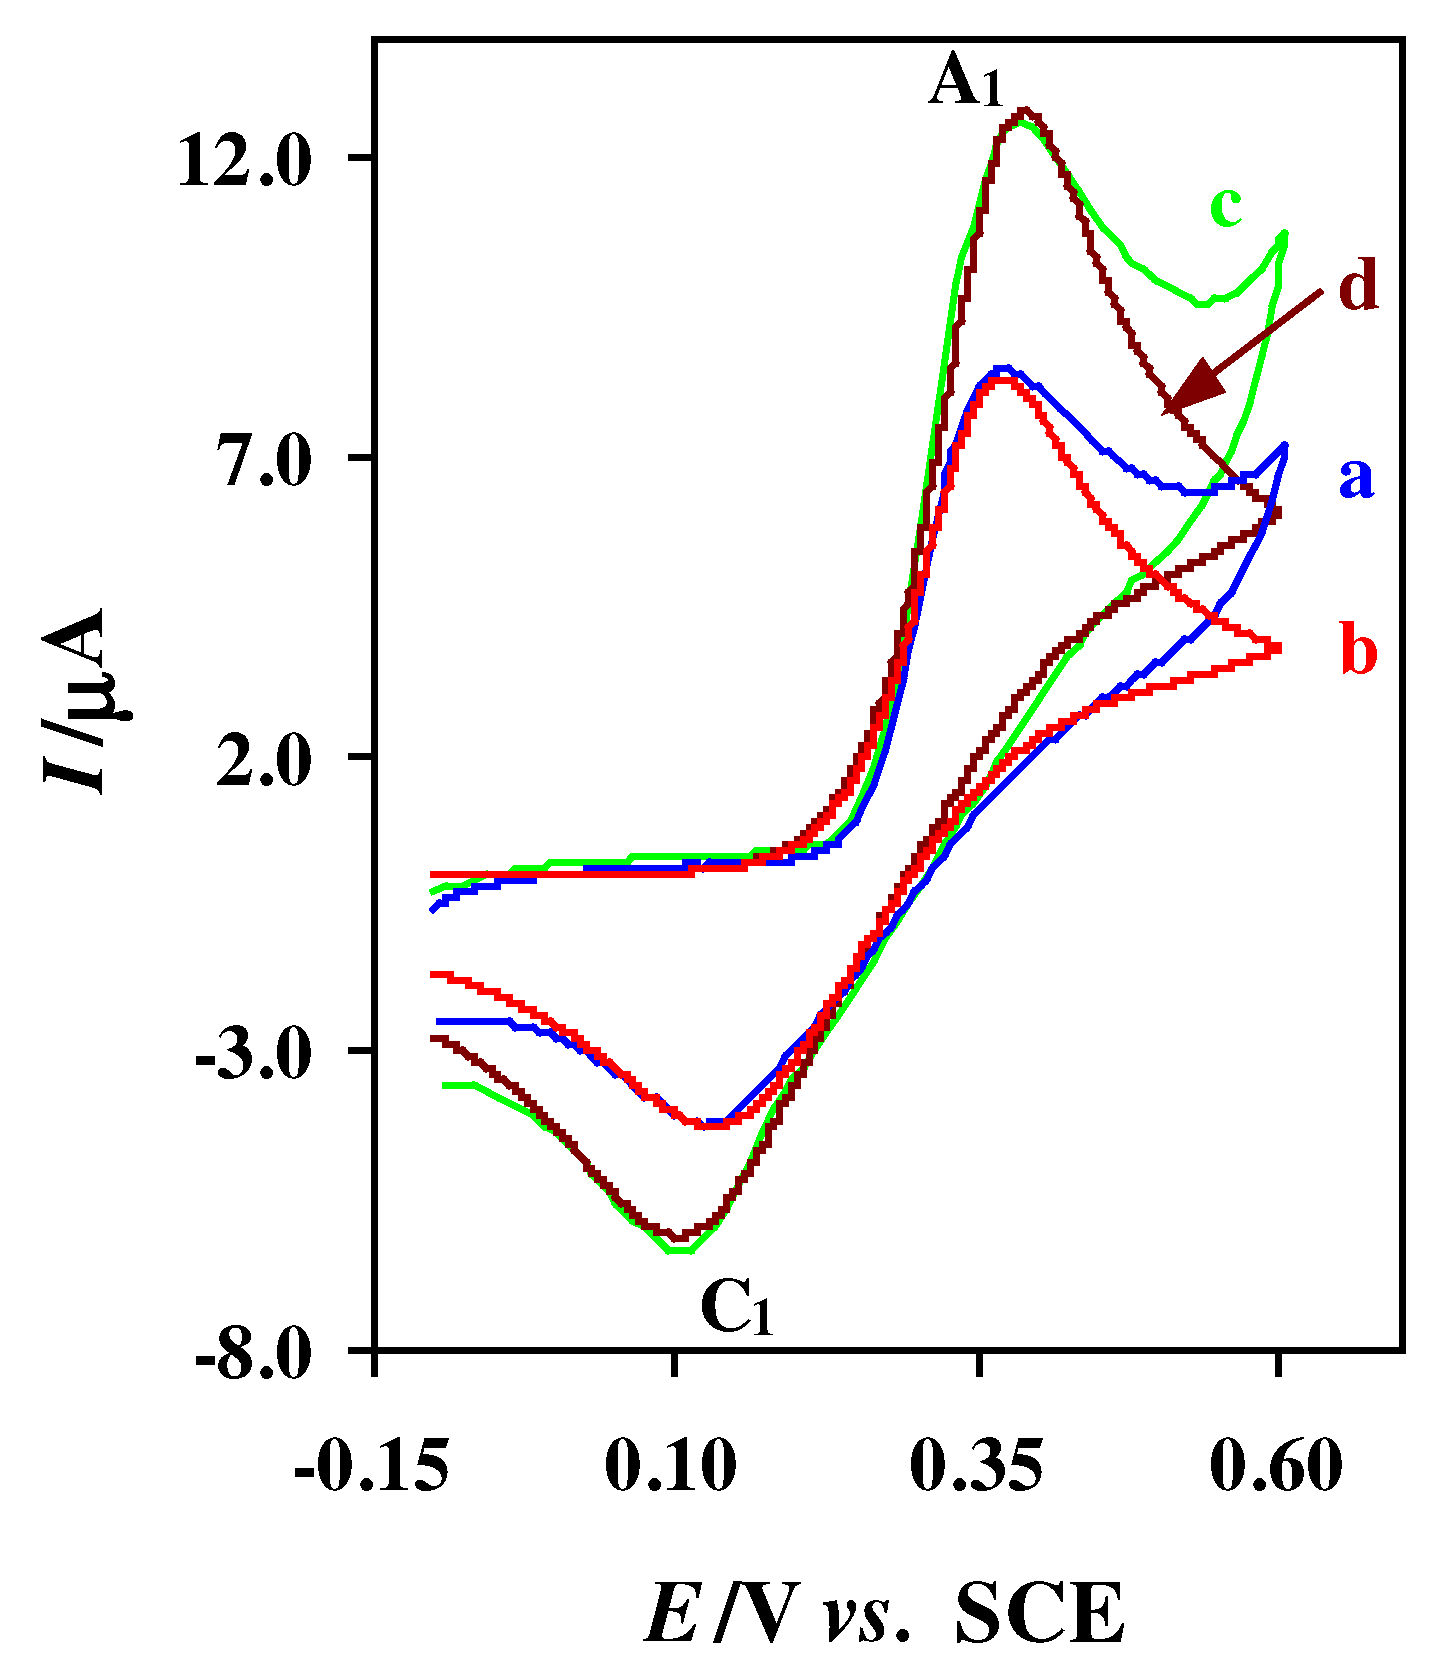
Fig. 4). The transfer coefficient (α) was assumed to be 0.6, and the formal potentials were obtained experimentally as the average of the two peak potentials observed in cyclic voltammetry. In this case, the calculated heterogeneous electron transfer rate constant is 6.0 × 10⁻⁴ cm/s. Fig. 4, curve d, is simulated cyclic voltamogram according to transfer coefficient, 0.6 and heterogeneous rate constant is 6.0 × 10⁻⁴ cm/s at 120 mV/s. The heterogeneous rate constant increased compared with the rate constant obtained at unmodified electrode, because of the acceleration of the rate of electron transfer at the surface of modified electrode.
Figure 4. Experimental and simulated cyclic voltammograms of thiourea at alumina modified Pt electrode in acetate buffer solution (C = 0.15 M, pH = 4.5). (a) and (c): experimental, (b) and (d): simulated cyclic voltammograms. (a) and (b) scan rate 50 mV/s, (c) and (d) scan rate 120 mV/s. Thiourea concentration, 0.75 mM.
Sensors 03 00534 g004
Figure 5. Typical voltammograms of 0.75 mM of thiourea at alumina modified Pt electrode (2 mm diameter) in acetate buffer solution (C = 0.15 M, pH = 4.5) at various scan rates. Scan rates from (a) to (h) are: 25, 50, 80, 120, 170, 225, 306 and 400 mV/s, respectively T= 25 ± 1 °C.
Sensors 03 00534 g005

Determination of thiourea

The electrochemical pretreatment procedure used for catalyzing the voltammetric response for thiourea. The linear sweep voltammogrames (LSV) of thiourea at modified Pt electrode in various concentrations has been shown in Fig. 6. In this method scan rate of 50 mV/s was preferable. The calibration graph was linear in the range 2.5 × 10⁻⁵ – 7.0 × 10⁻³ M thiourea with correlation coefficient of 0.9994. The regression equation for determination of thiourea is Ip=0.0976+13.949C, where Ip is peak current in μA and C is thiourea concentration in mM. The detection limit, of thiourea defined as CLod= 3SB/m, where Cl is limit of detection, SB is the standard deviation of the blank signal and m is the slop of calibration graph [25] was 4.8 × 10⁻⁶ M. The precision of the method was established by repeated assays (n=10) using 5.0 × 10⁻⁴ M solution of thiourea. The relative standard deviation was 0.5%.

Optimization of the solution pH

The catalytic oxidation of thiourea was studied at various pH. The catalytic effect evaluated from two values, one is the increment in catalytic current, and the other is the value of decrease in overpotential. The voltammograms particularly in acidic (pH>2) and neutral media exhibit an increase in peak current and decrease in overpotential. In basic solutions (pH>8), cyclic voltammogram shows an irreversible process and increase in anodic peak current is negligible. In acidic solutions (pH<2), a diminution observed in catalytic behavior of modified electrode. A pH of 4.5 was finally chosen for determination of thiourea because it had a relatively better catalytic effect when both high catalytic current and low detection potential were considered.

Interference study

In order to assess the possible analytical application of the described method, the effect of concomitant species on the determination of thiourea was studied by analyzing synthetic sample solutions containing 5.0 × 10⁻⁴ of thiourea and various excess amounts of some organic and inorganic substances. The results are shown in Table 1. As Table 1 shows, most of the ions did not interfere, even present in 400-fold excess over thiourea.
Figure 6. 
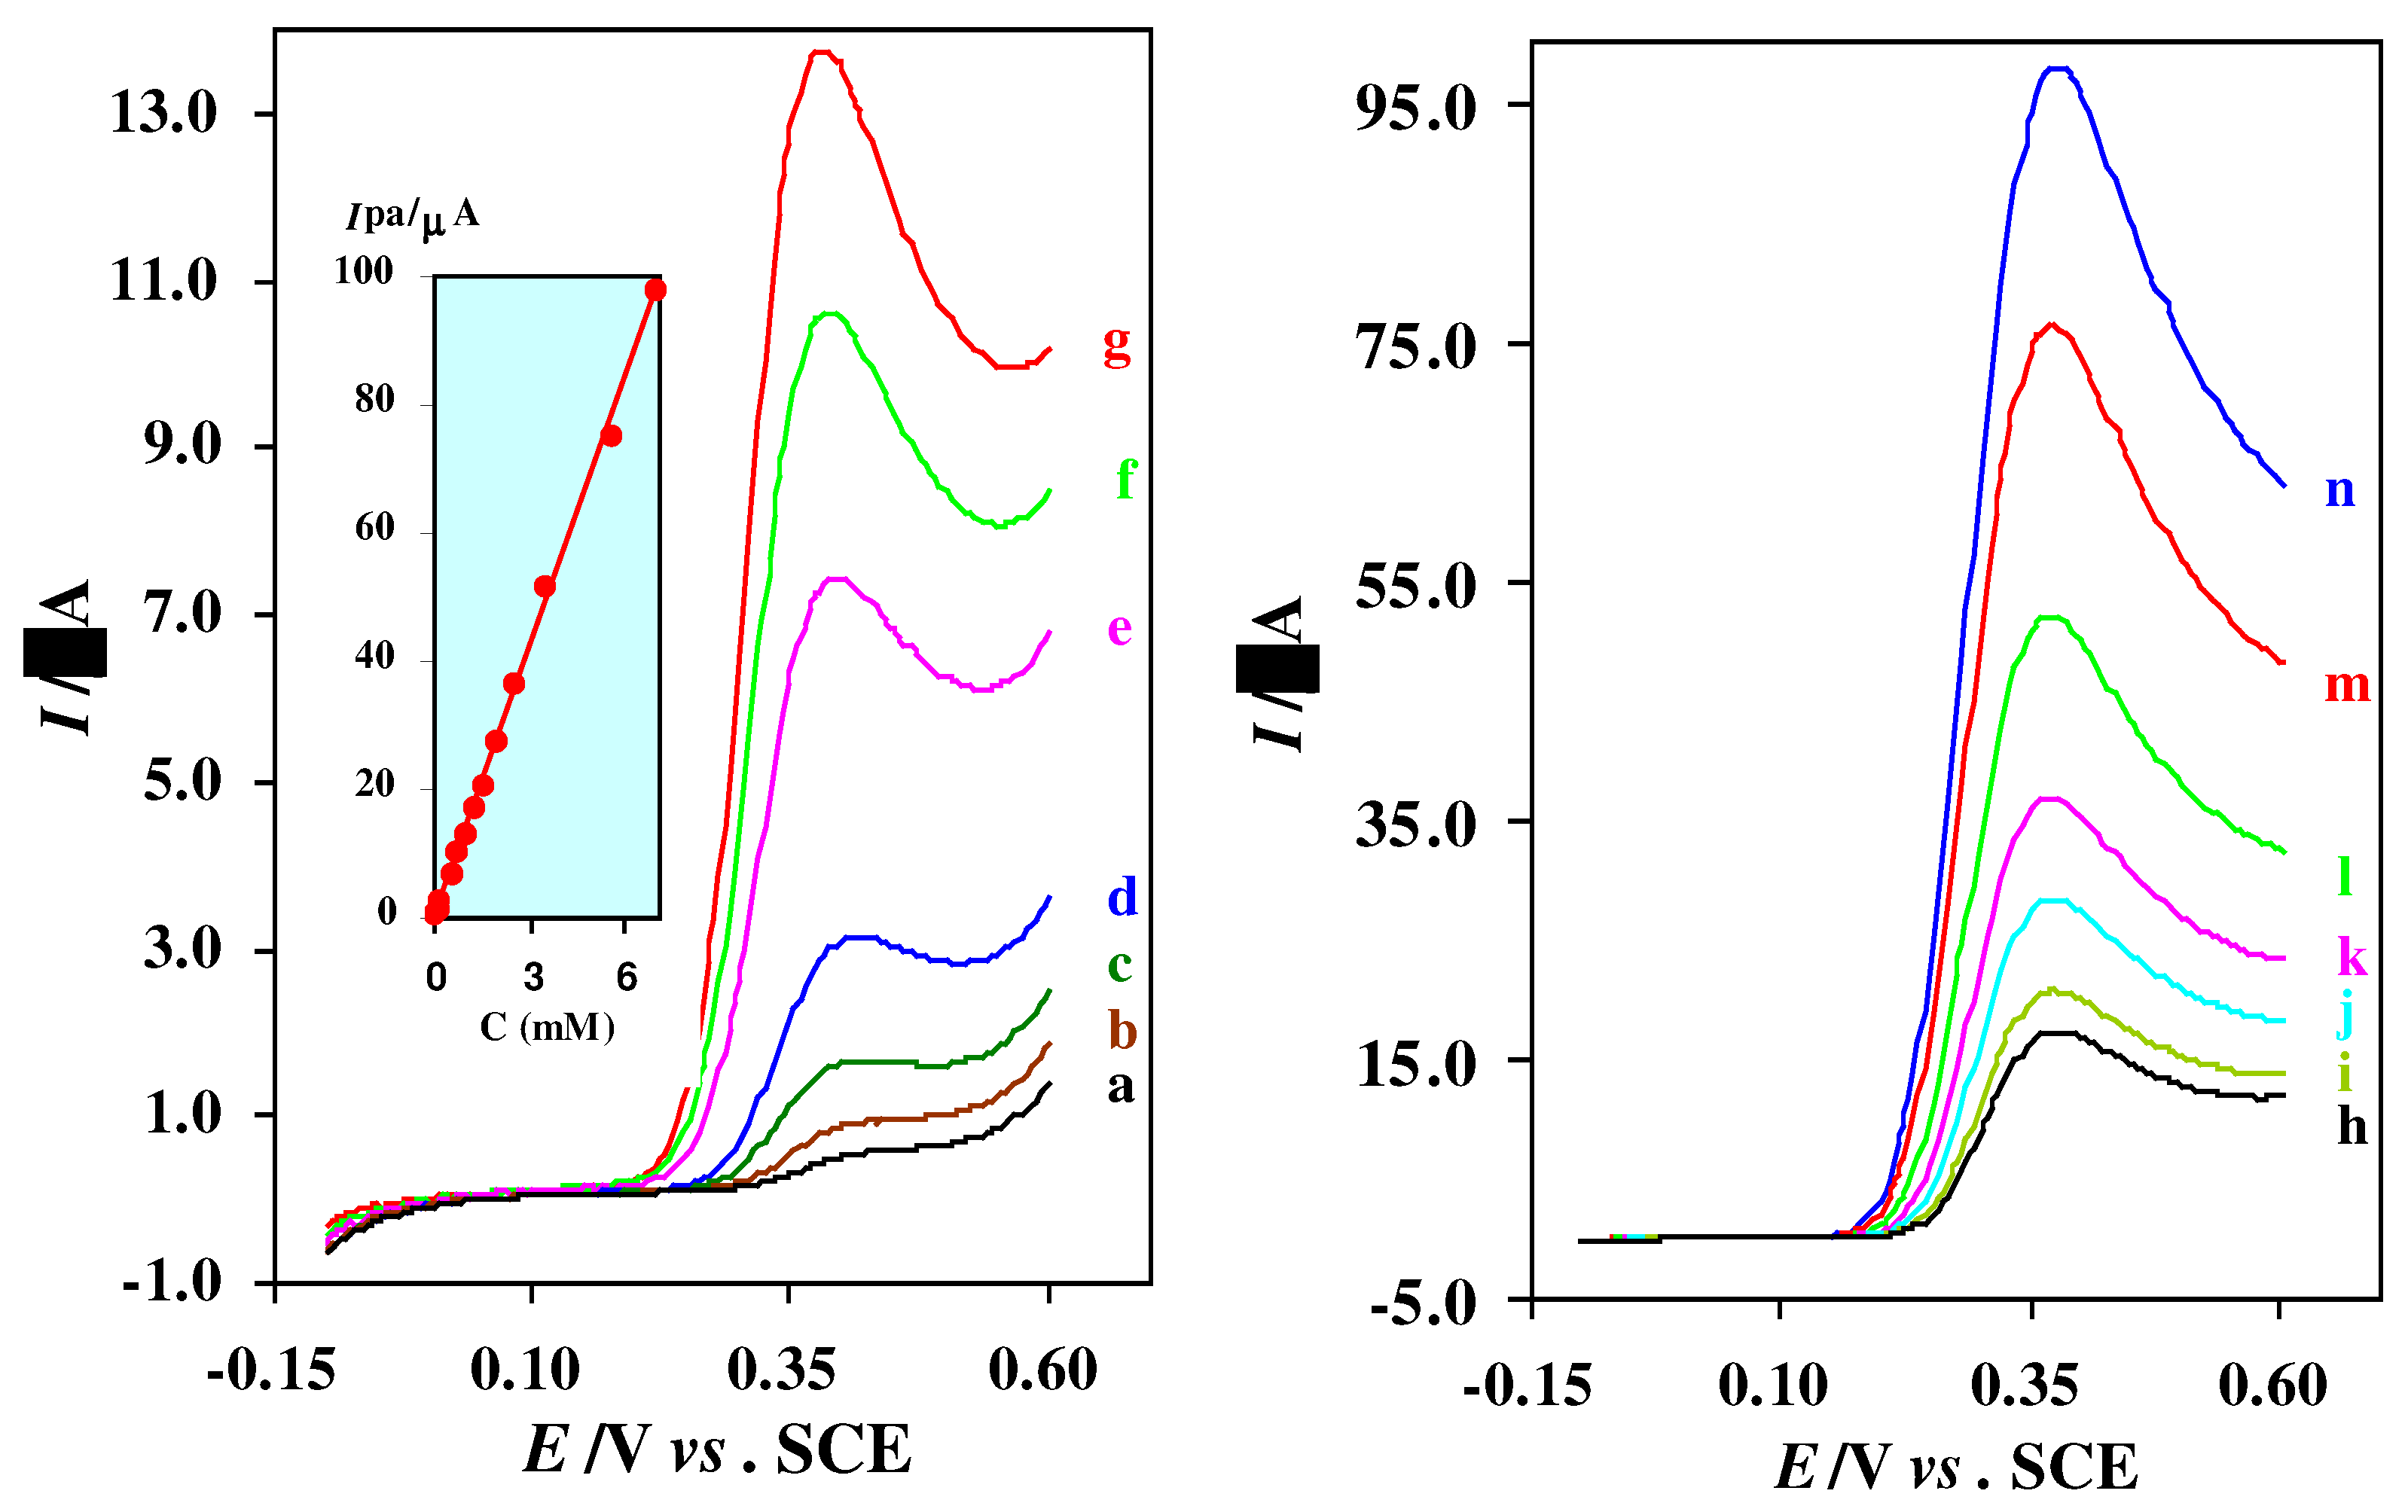
Linear sweep voltammograms of thiourea at alumina modified Pt electrode (2 mm diameter) in acetate buffer solution (C = 0.15 M, pH = 4.5). Thiourea concentrations from (a) to (n) are: 2.5 × 10⁻⁵, 5.0 × 10⁻⁵, 1.0 × 10⁻⁴, 2.0 × 10⁻⁴, 5.0 × 10⁻⁴, 7.5 × 10⁻⁴, 1.0 × 10⁻³, 1.25 × 10⁻³, 1.5 × 10⁻³, 2.0 × 10⁻³, 2.5 × 10⁻³, 3.5 × 10⁻³, 5.5 × 10⁻³ and 7.0 × 10⁻³ M. Scan rate: 50 mV/s. Inset, calibration curve for the determination of thiourea.
Sensors 03 00534 g006
Table 1. Tolerance of different species in the determination of thiourea*
Species addedMaximum tolerable Molar ratio
Na+, K+, Cl, Br, F, Mg2+, Ca2+, Al3+ NO3 SO4 2-, ClO4 , Co2+, Ni2+, Zn2+, Cr3+400
MoO4 2-, Mn2+, Fe2+20
I, Hydroquinone, Catechol, Ag+4
S2O3 2-, Hg2+, Cu2+0.2
*Thiourea concentration, 5.0 × 10⁻⁴ M.Maximum ratio tested.

Analytical applications

The proposed method was applied to determination of thiourea in real samples. Thiourea was determined after addition to different samples. The recoveries from the samples spiked with different amounts of thiourea are shown in Table 2. As Table 2 shows, the maximum deviation in recovery and the maximum relative error were 2.5% and 0.6% respectively. As observed, the method is applicable to determination of thiourea in various solutions.
Table 2. Recovery of thiourea
SampleThiourea added (mM)Thiourea found* (mM)Average recovery (%)
Bleaching solution7.9008.100 ± 0.024102.5
Washing solution0.3150.321 ± 0.002101.9
Toning solution††0.4000.402 ± 0.002100.5
Drinking water0.5000.506 ± 0.003101.2
*Average values of four determinations ± SD. In photography, potassium ferricynide (50 g), Potassium bromide (10 g), sodium carbonate (20 g), thiourea (30 g),water (1000 ml).In silver electroplating, thiourea (12 g), sodium citrate (15 g), water (1000 ml).††In photography, thiourea (3 g), sodium hydroxide (2 g) or sodium carbonate (20 g), water (1000 ml).

Conclusions

The experiments described clearly indicate a very simple catalytic method of analysis for thiourea based on its oxidation at the surface of alumina modified platinum electrode. The results indicate that, the alumina modified platinum electrode can provide easy to prepare, inexpensive catalytic sensor, possessing sensitivity, selectivity and stability. In addition, this method provides the possibility of the detection of thiourea in highly contaminated industrial wastewaters and natural samples. The obtained results were in good agreement with the values for nominal contents of thiourea in tested real samples. Moreover, in this work the heterogeneous electron transfer rate constants of thiourea at the surface of modified and unmodified platinum electrodes were estimated by comparing the experimental cyclic voltammetric responses with the digital simulated results. The simulated cyclic voltammograms show good agreement with those obtained experimentally and the results indicate that, the modified electrode accelerated the rate of electron transfer of thiourea

References

  1. Snel, F. D. Photometric and Fluorimetric Methods of Analysis; Parts I and II, John Wiley: New York, 1978. [Google Scholar]
  2. Giri, S. N.; Combs, A. B. Toxicol. Appl. Pharmacol. 1967, 16, 706.
  3. U.S. Department of Health and Human Services. Fourth Annual Report on Carcinogens, GPO; Washington, D.C., 1985; p. 423. [Google Scholar]
  4. Paillai, C. P. K. Indrasema, P. Talanta 1980, 27, 751. [Google Scholar]
  5. Srivastava, A. Talanta 1979, 26, 917.
  6. Amin, D. Analyst 1985, 110, 215.
  7. Yatsimirsky, K. B.; Artasheva, A. A. Zh. Anal. Khim. 1956, 11, 442.
  8. Bowley, H. J.; Carthorne, E. A.; Gerrard, D. L. Analyst 1989, 111, 539.
  9. Association of Official Analytical Chemists. Official methods of Analysis, 15th ed.; Arlington, 1990; pp. 1160–1163. [Google Scholar]
  10. Smyth, M. R.; Osteryoung, J. G. Anal. Chem. 1977, 49, 2310.
  11. Fedorenko, M.; Manousek, O.; Zuman, P. Chem. Listy 1953, 49, 1494.
  12. Stara, V.; Kopanica, M. Anal. Chim. Acta 1984, 159, 105.
  13. Trojanck, A.; Kopanica, M. J. Chromatogr. 1985, 328, 127.
  14. Rethmeier, J.; Neumann, G.; Stumpf, C.; Rabenstein, A.; Vogt, C. J. Chromatogr. 2001, 934, 129. [CrossRef]
  15. Richmond, J.; Rainey, C.; Meloan, C. E. Anal. Lett. 1976, 19, 119.
  16. Weiss, H.; Pantel, S.; Marquardt, G. Anal. Chim. Acta 1982, 143, 177.
  17. Kargosha, K.; Khanmohamadi, M.; Ghadiri, M. Anal. Chim. Acta 2001, 437, 139. [CrossRef]
  18. Murray, R. W. Acc. Chem. Res. 1980, 13, 135. [CrossRef]
  19. Heineman, W. R.; Kissiner, P. T. Anal. Chem. 1980, 52, 138R.
  20. Ryan, M. D.; Wilson, G. R. Anal. Chem. 1982, 54, 20R.
  21. Zak, J.; Kuwana, T. J. Am. Chem. Soc. 1982, 104, 5514. [CrossRef]
  22. Zak, J.; Kuwana, T. J Electroanal Chem. 1983, 150, 645.
  23. Gosser, D. K., Jr. Cyclic Voltammetry: Simulation and Analysis of Reaction Mechanisms; VCH: New York, 1993. [Google Scholar]
  24. Kirchnerova, J.; Purdy, W. C. Anal. Chim. Acta 1981, 123, 83.
  25. Perez-Bendito, D.; Silva, M. Kinetic Methods in Analytical Chemistry; Ellis Horwood: Chichester, 1988. [Google Scholar]
  • Sample Availability: Available from the authors.

