
Enhanced Mask R-CNN Incorporating CBAM and Soft-NMS for Identification and Monitoring of Offshore Aquaculture Areas


Abstract
1. Introduction
2. Materials and Methods
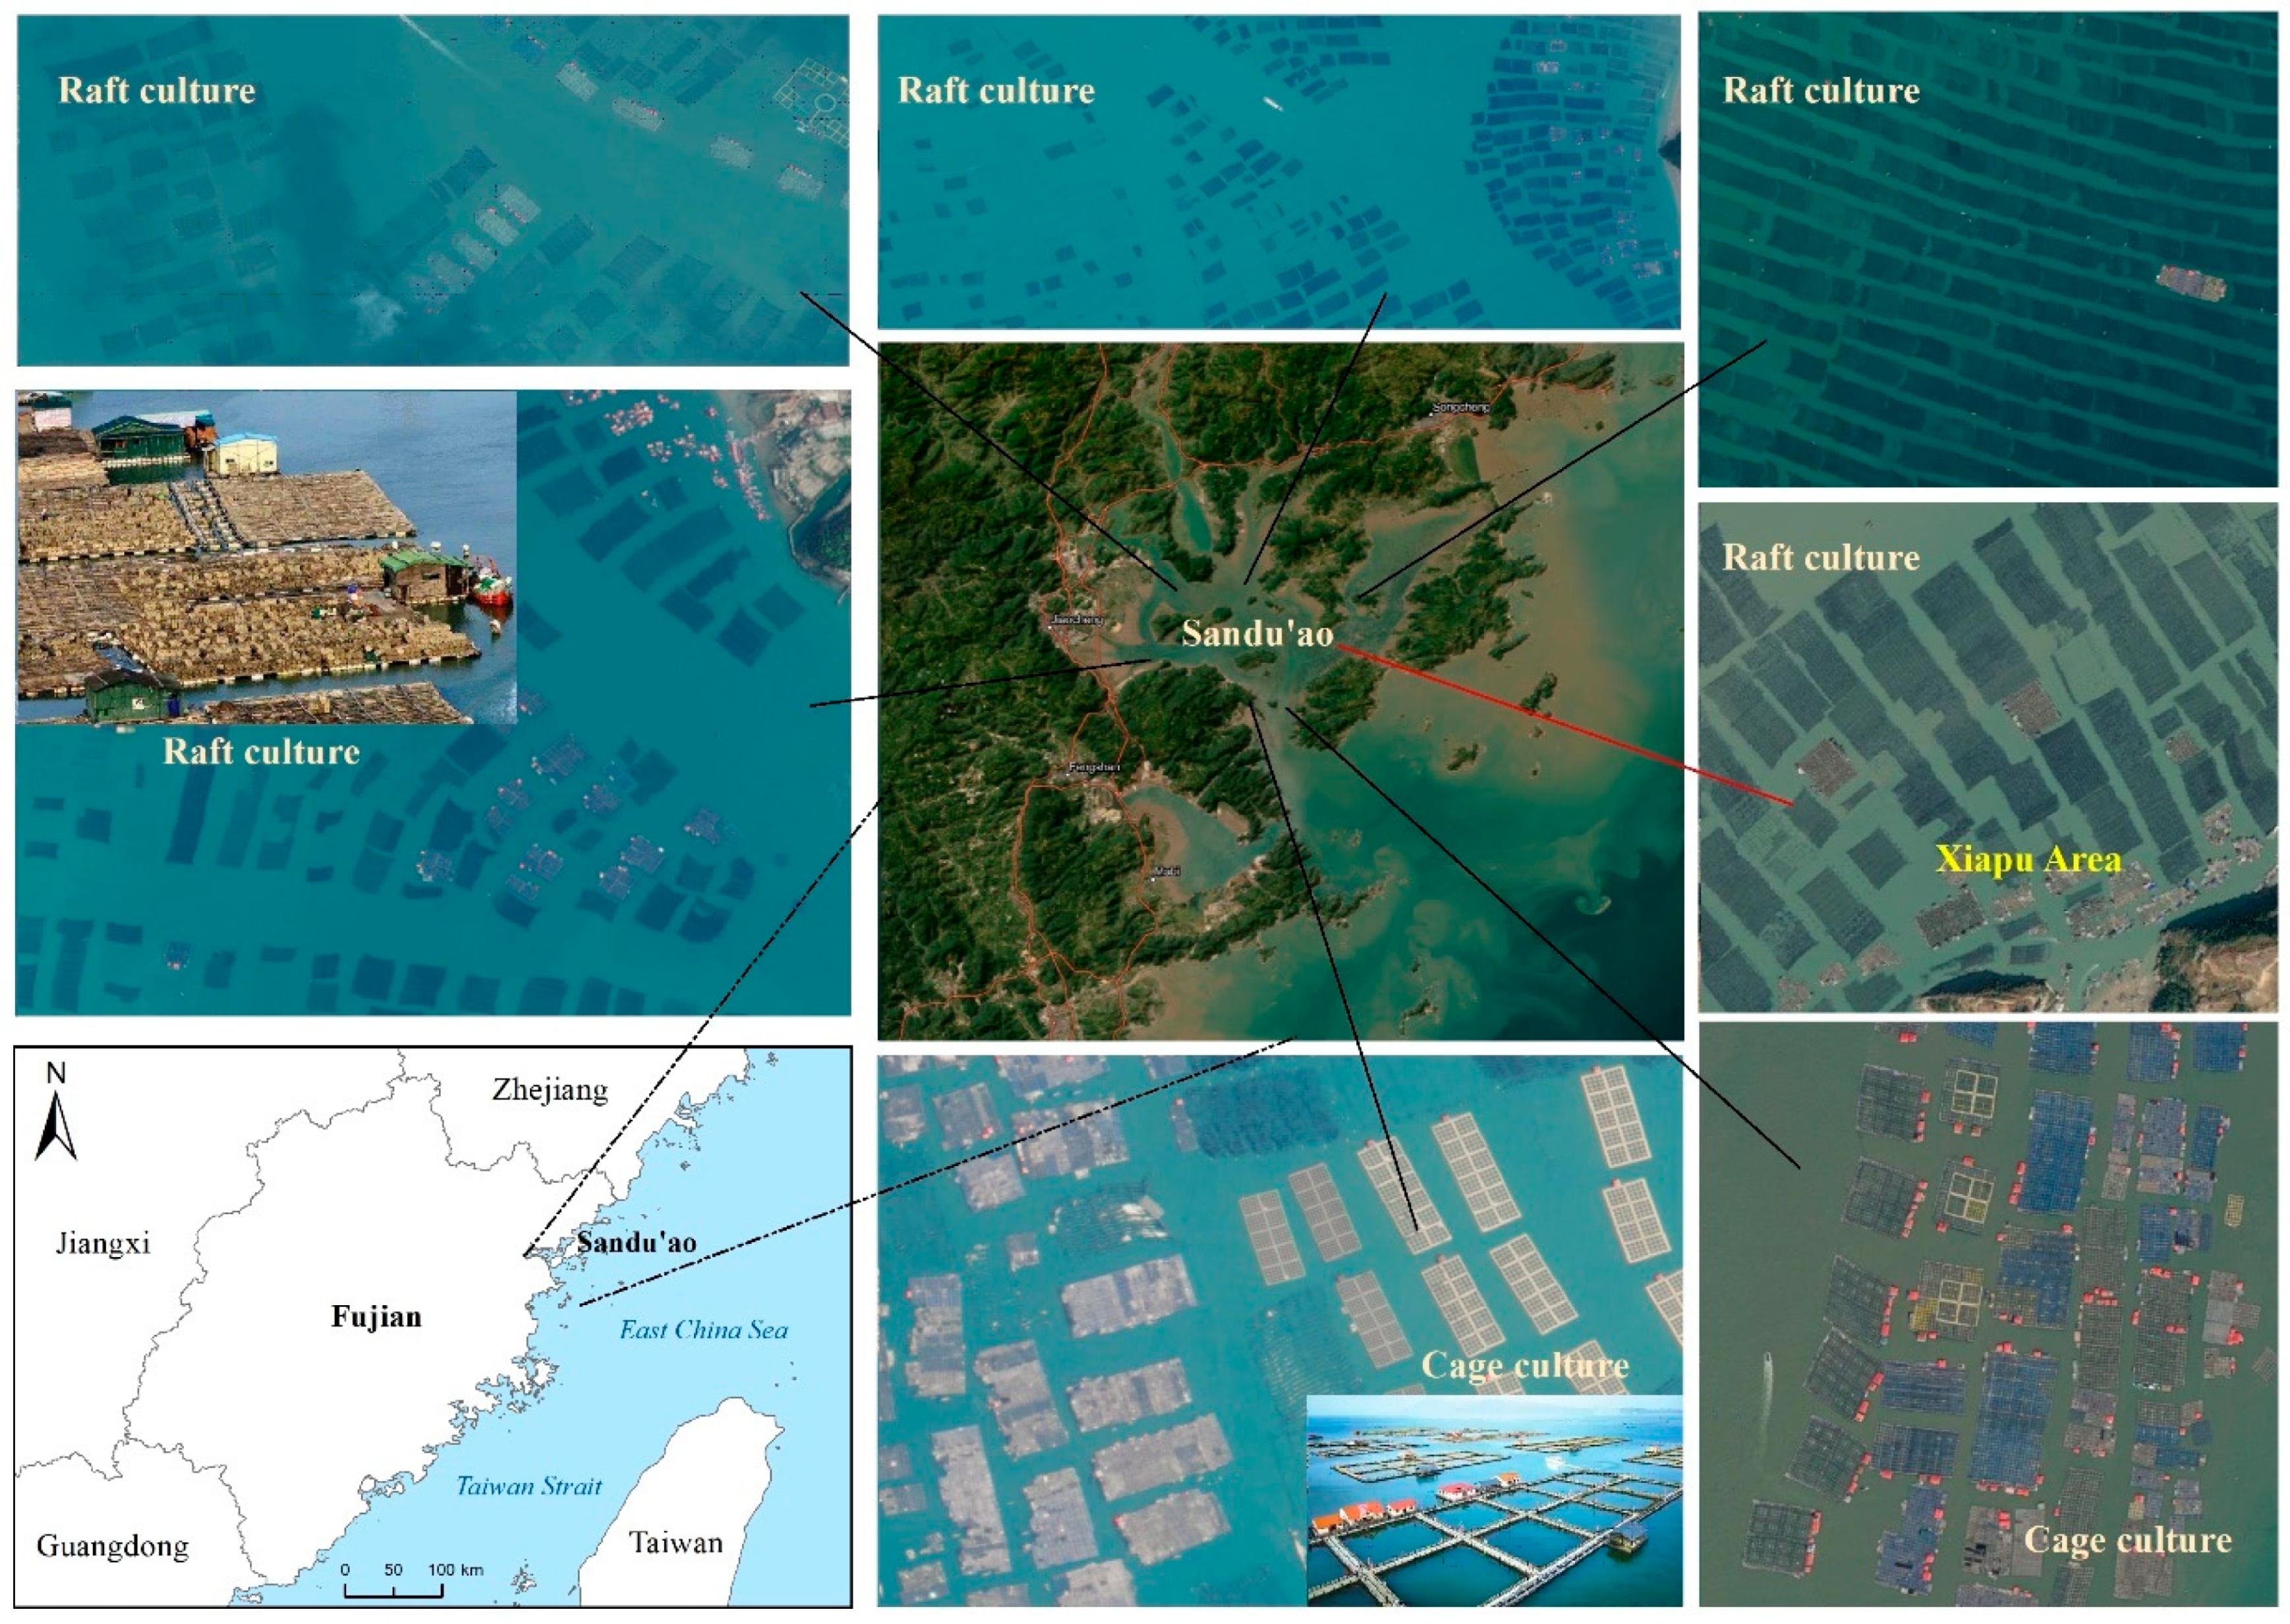
2.1. Study Area and Data Sources
- (1)
- Study area
- (2)
- Data sources
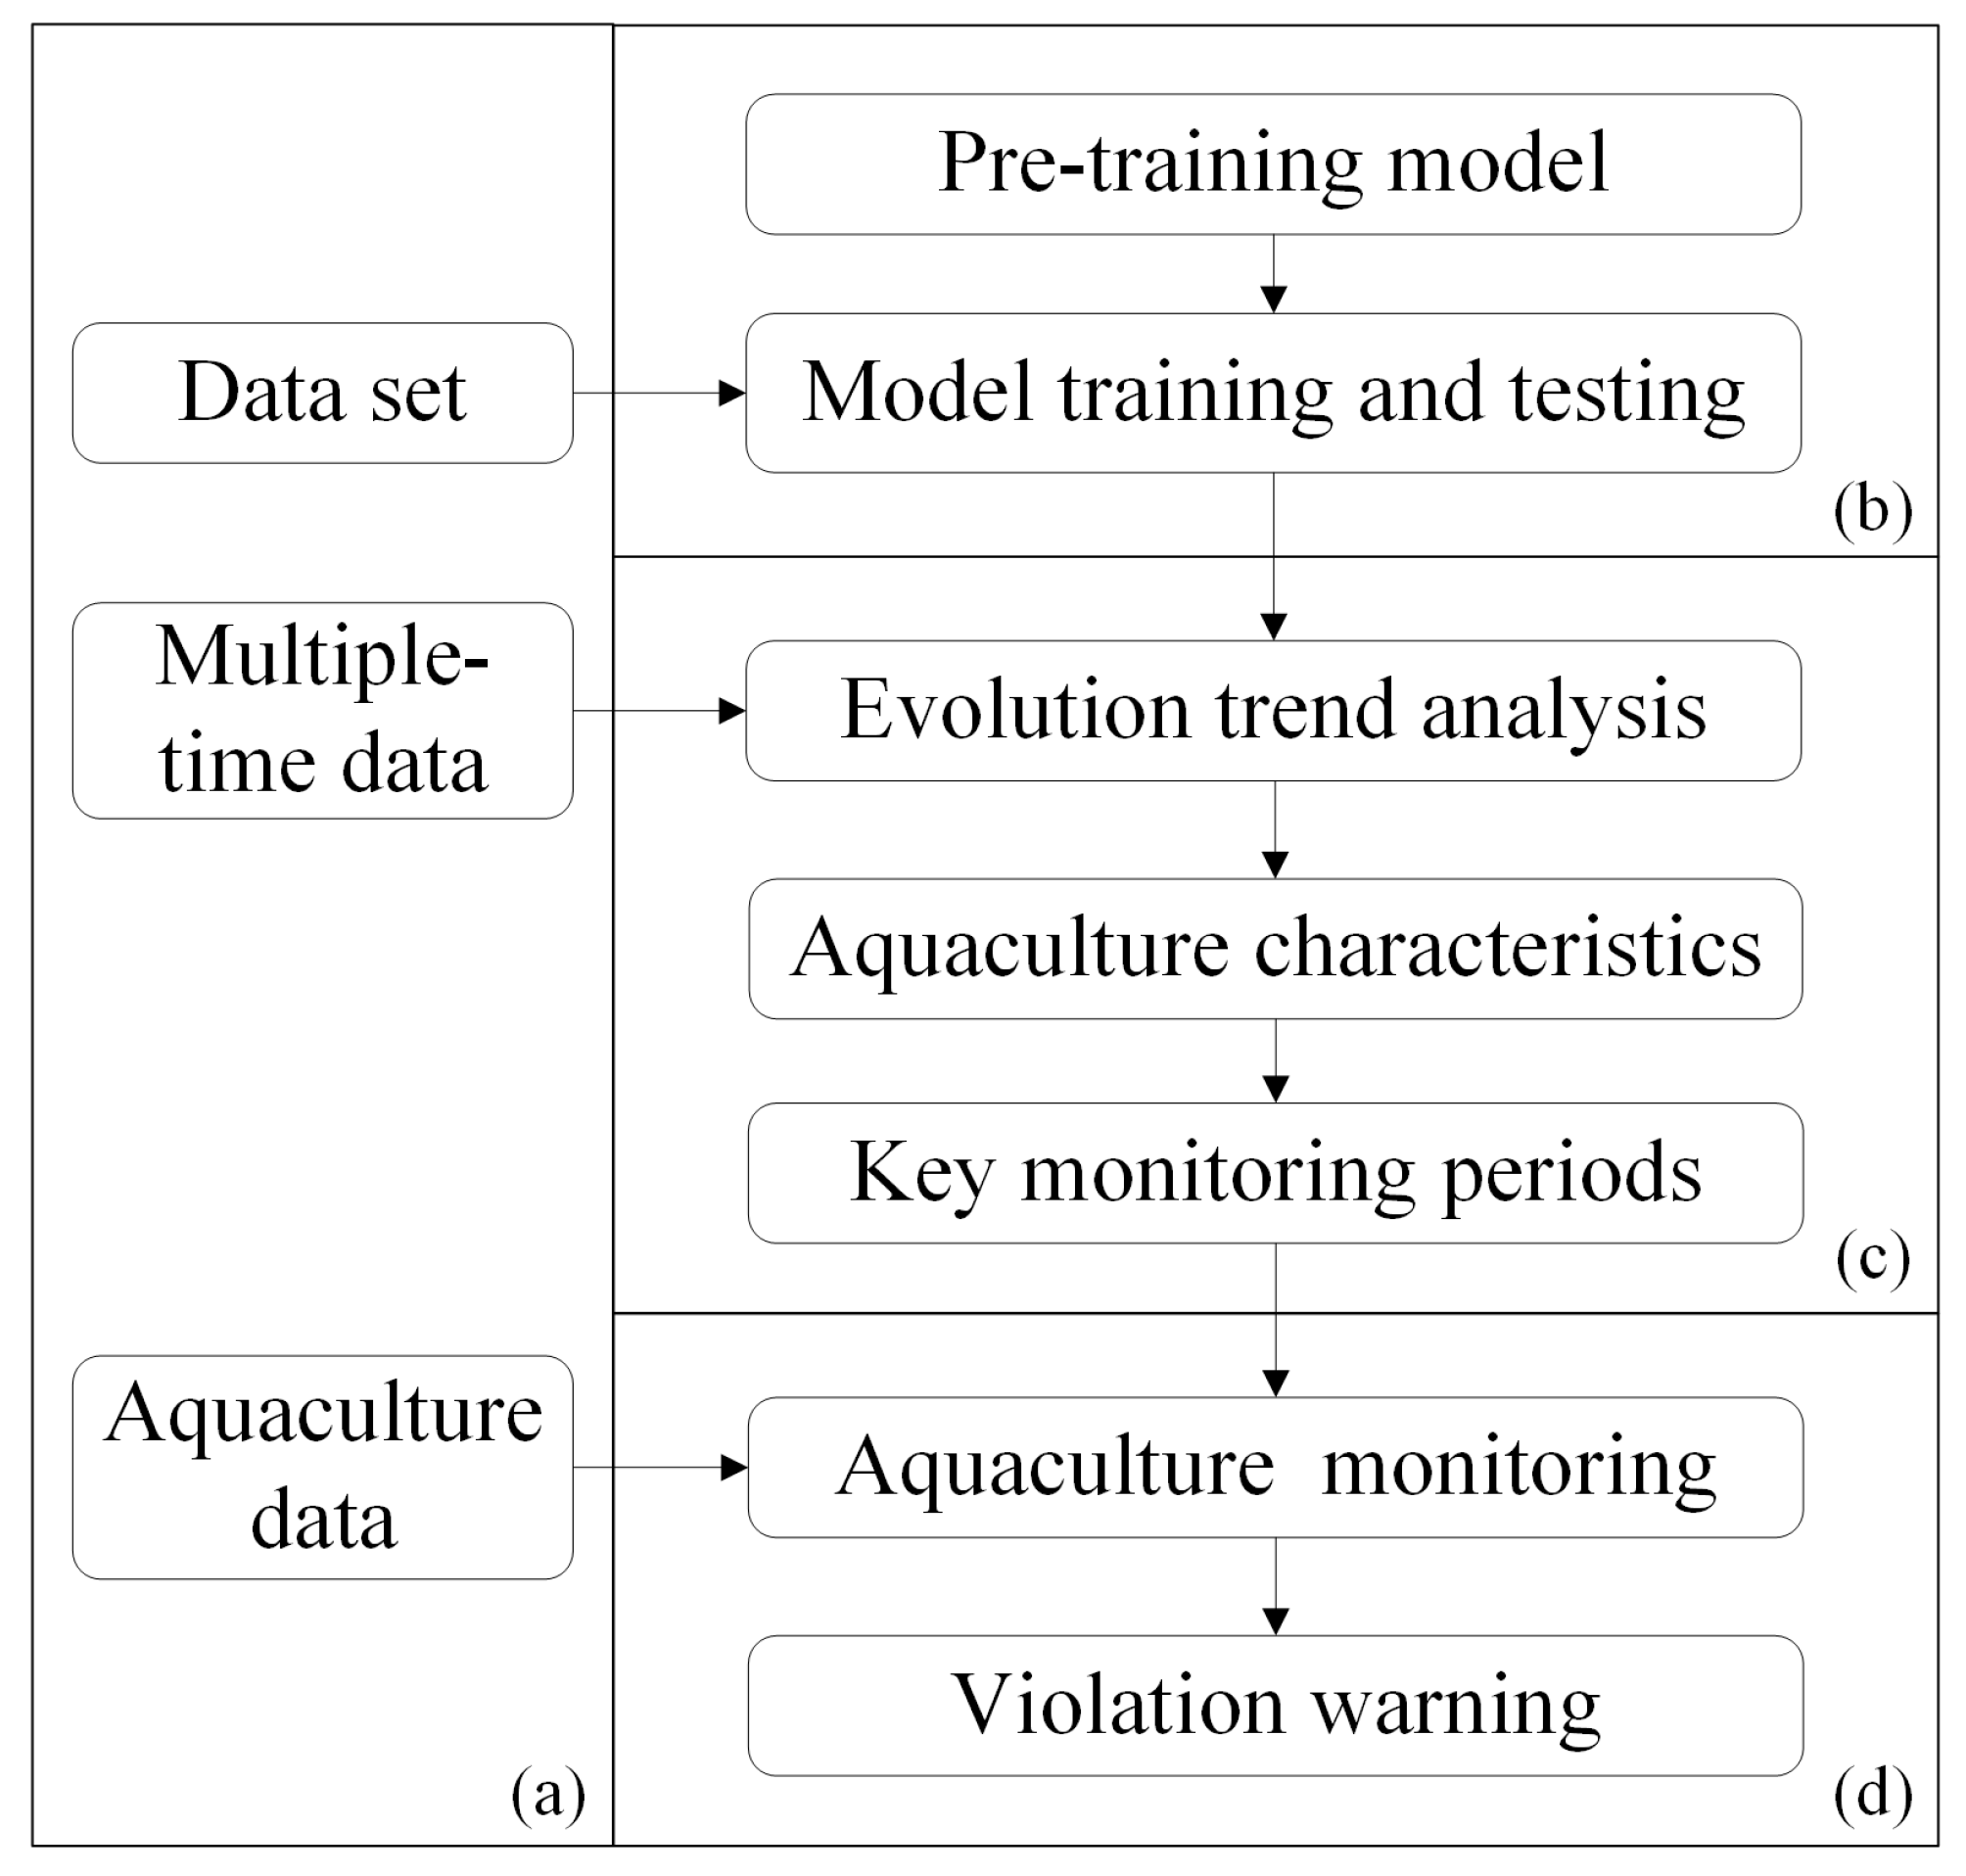
2.2. Method
2.2.1. Data Pre-Processing
2.2.2. Model Development
- (1)
- Water area extracting model based on the NDWI
- (2)
- The Mask R-CNN model
- (3)
- Model improvement with CBAM and Soft-NMS
- (4)
- Model combination
2.3. Implementation Details
3. Results and Discussion
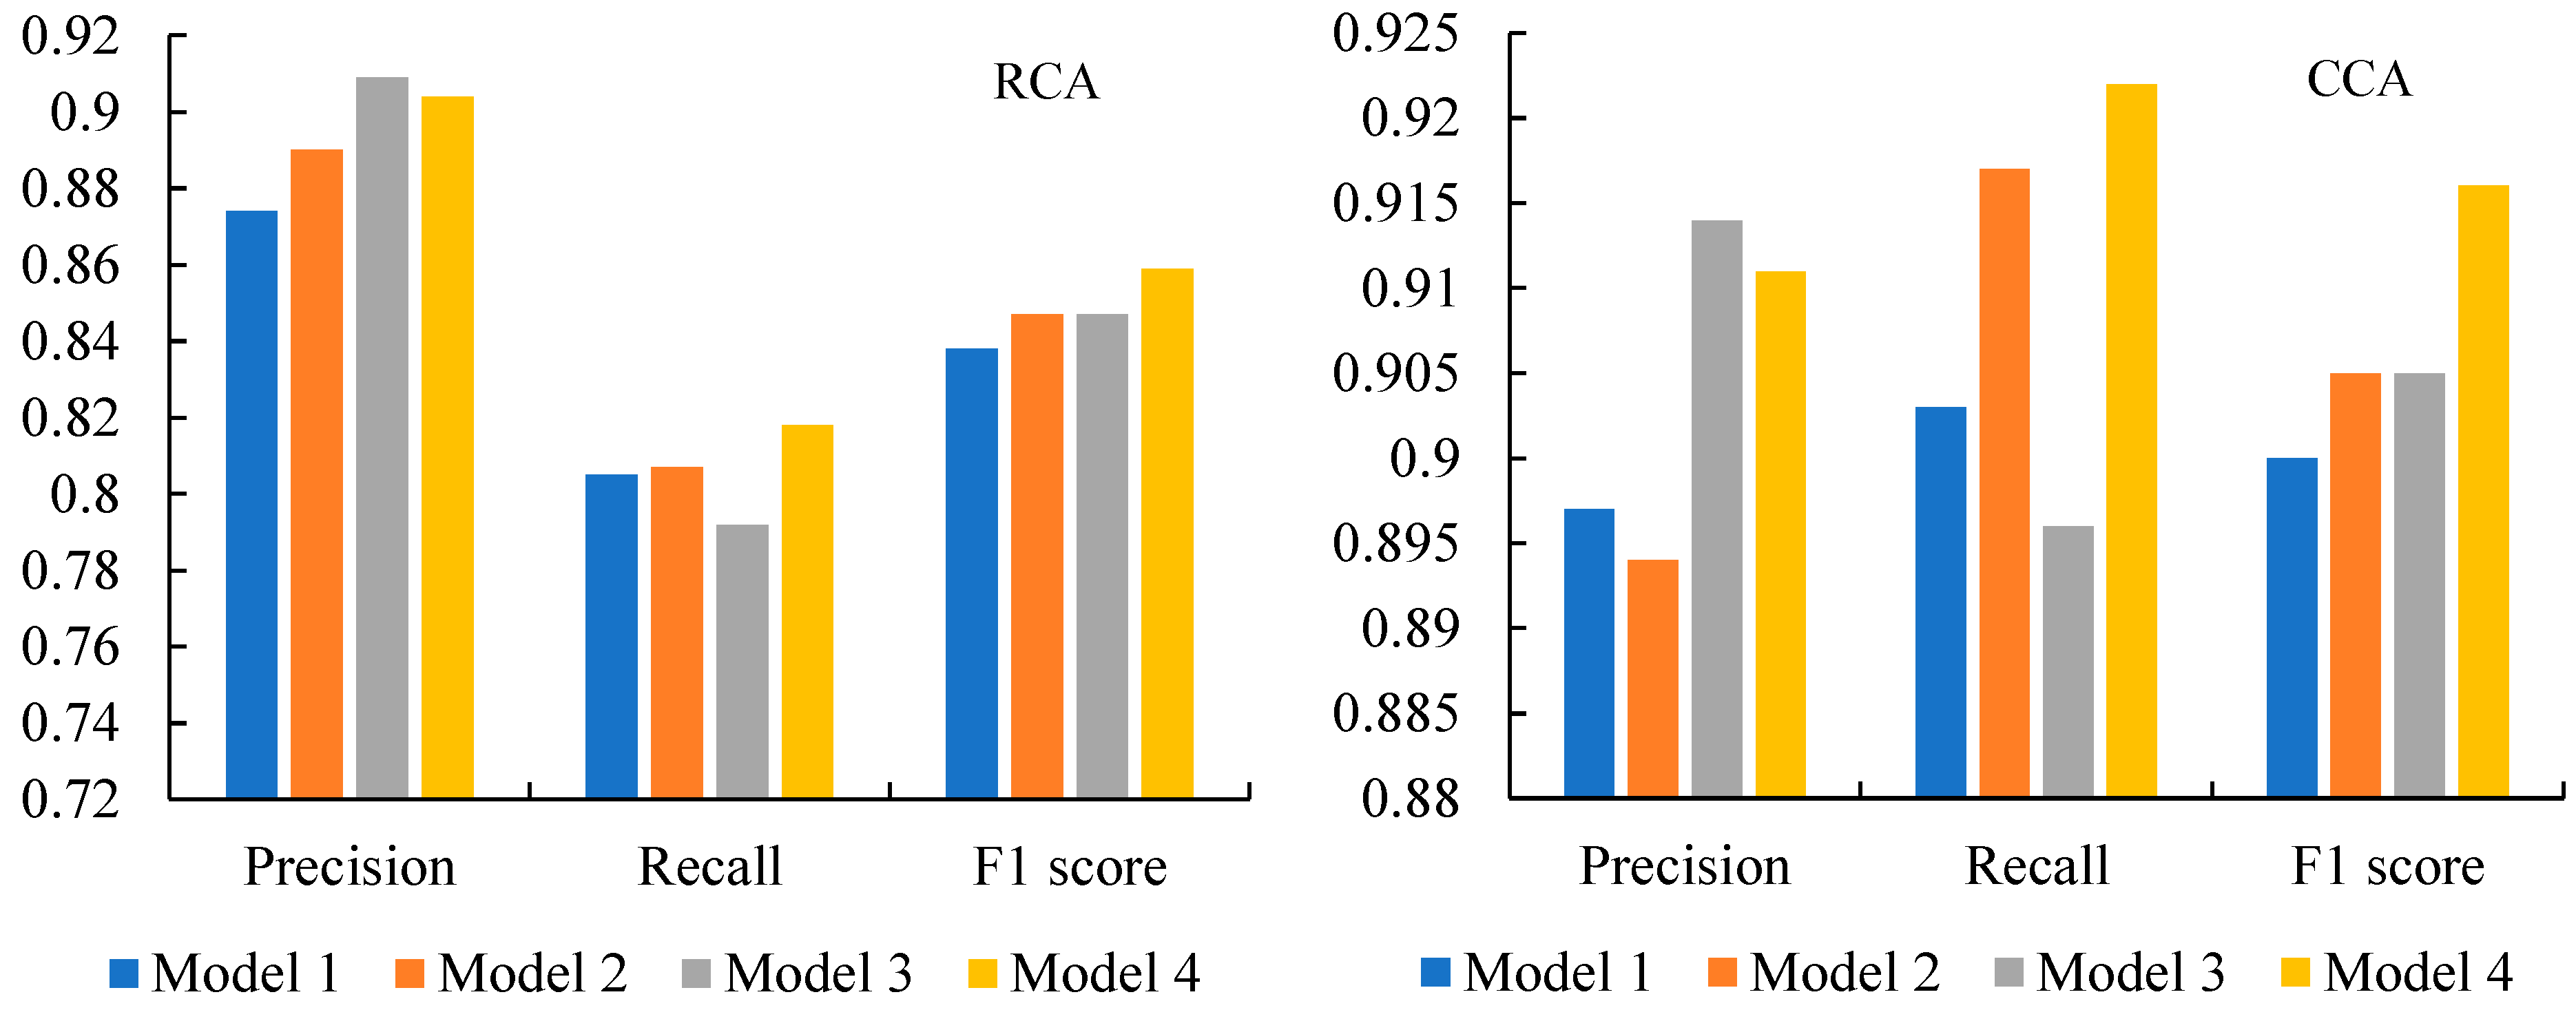
3.1. Performance Analysis of the Improved Model
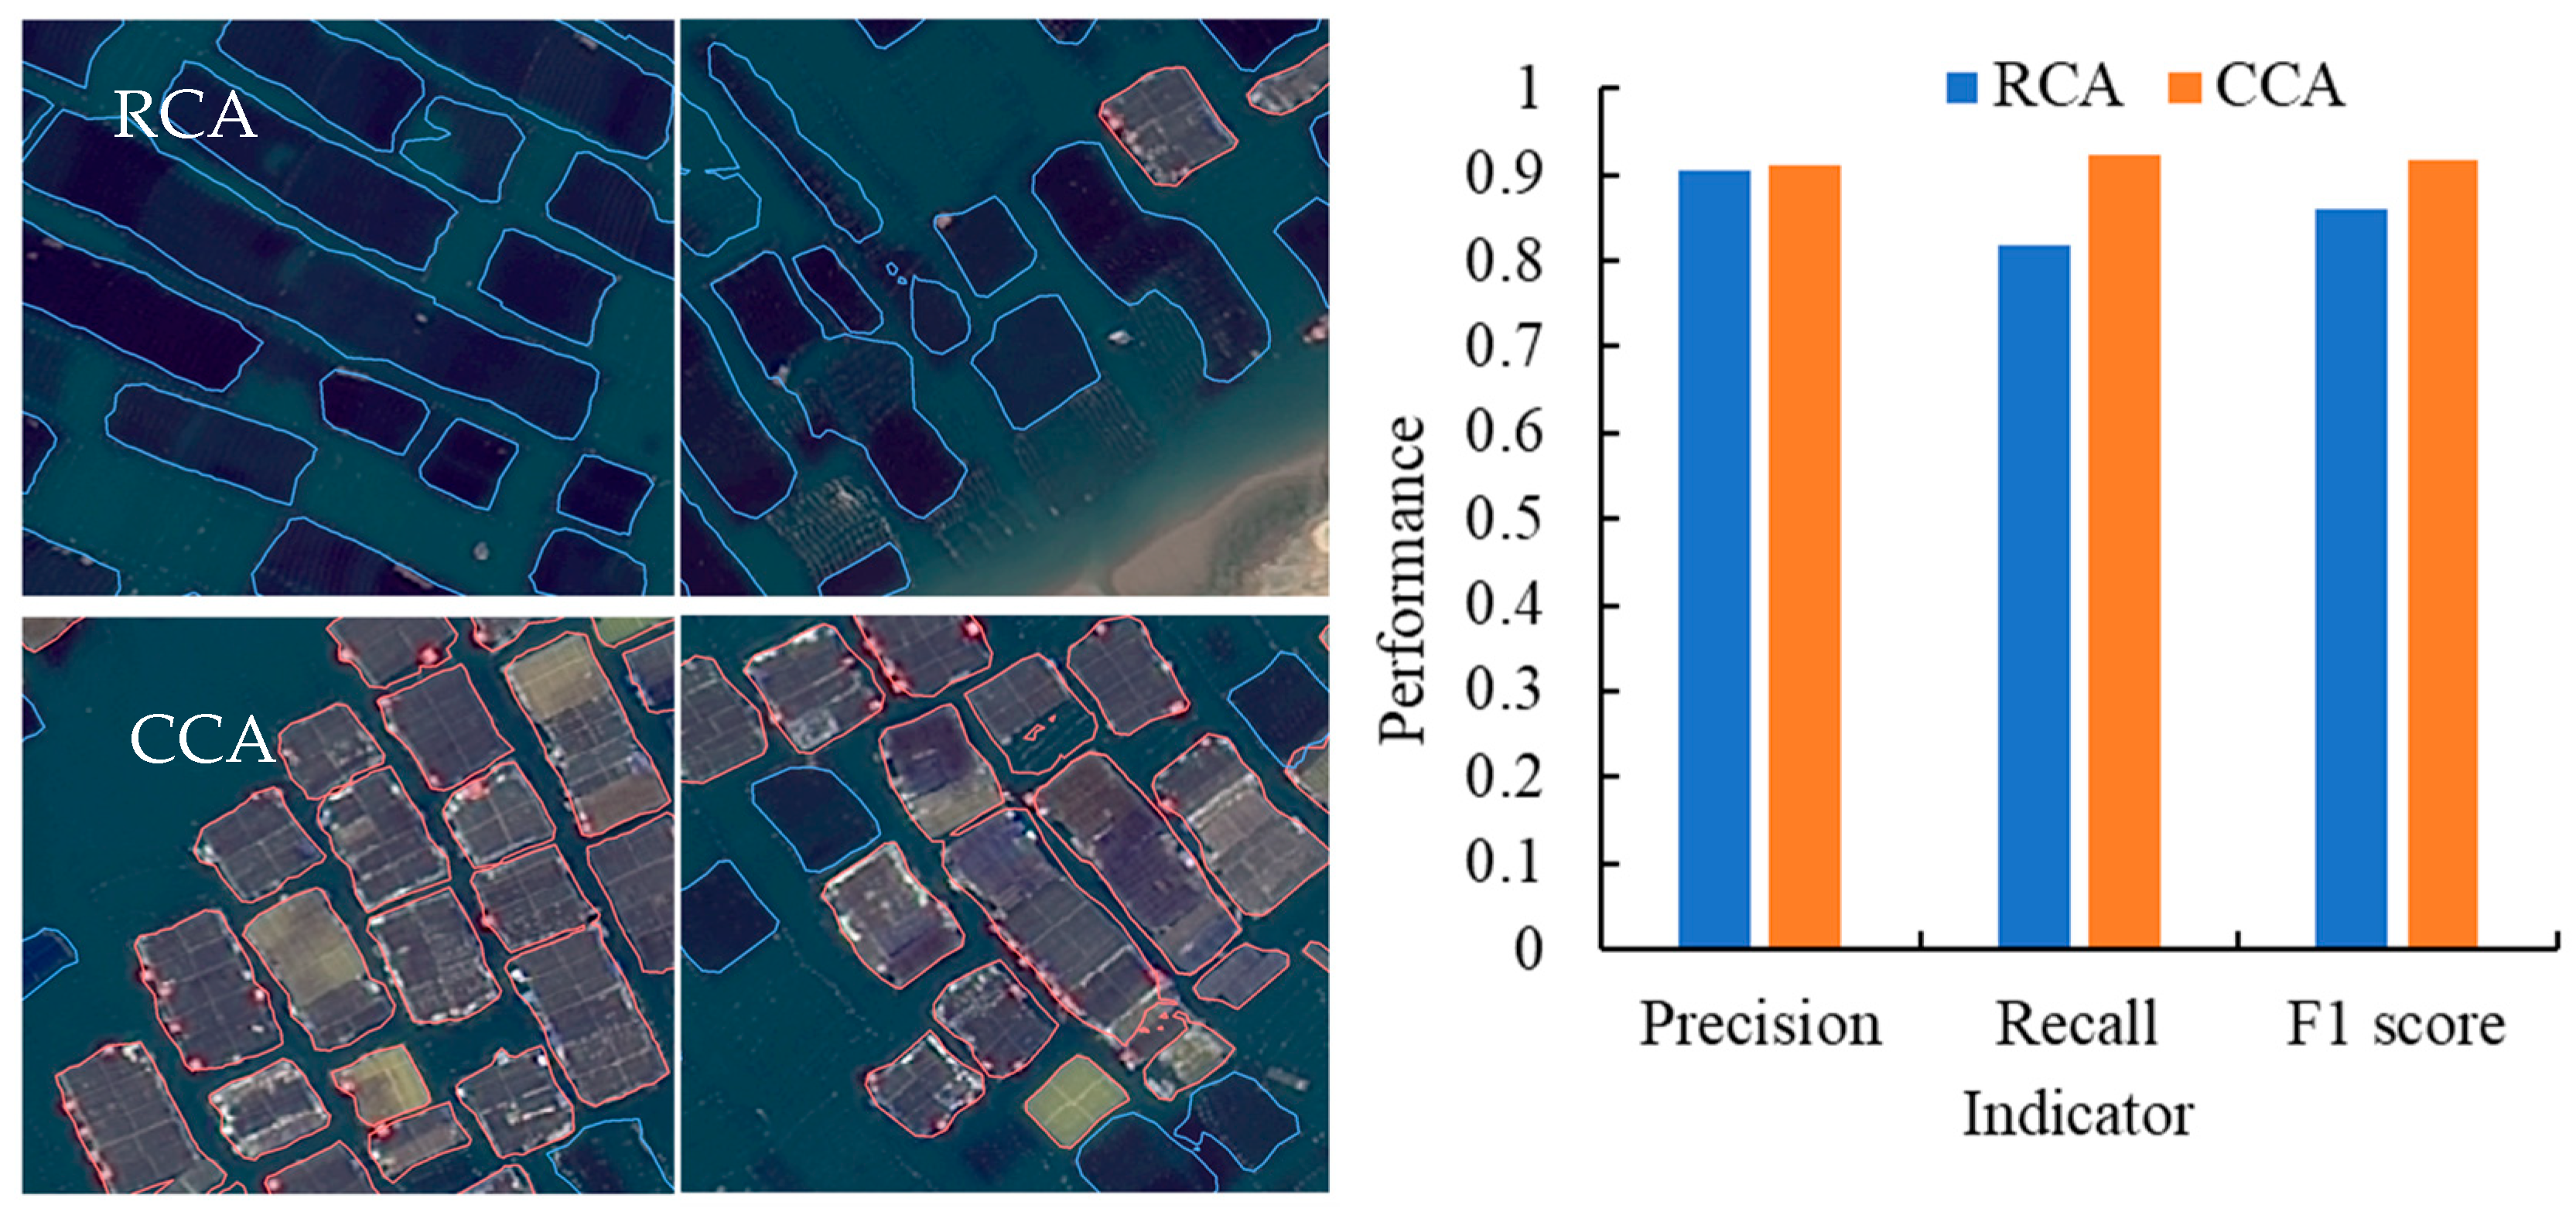
3.2. Model Validation of Modified Mask R-CNN
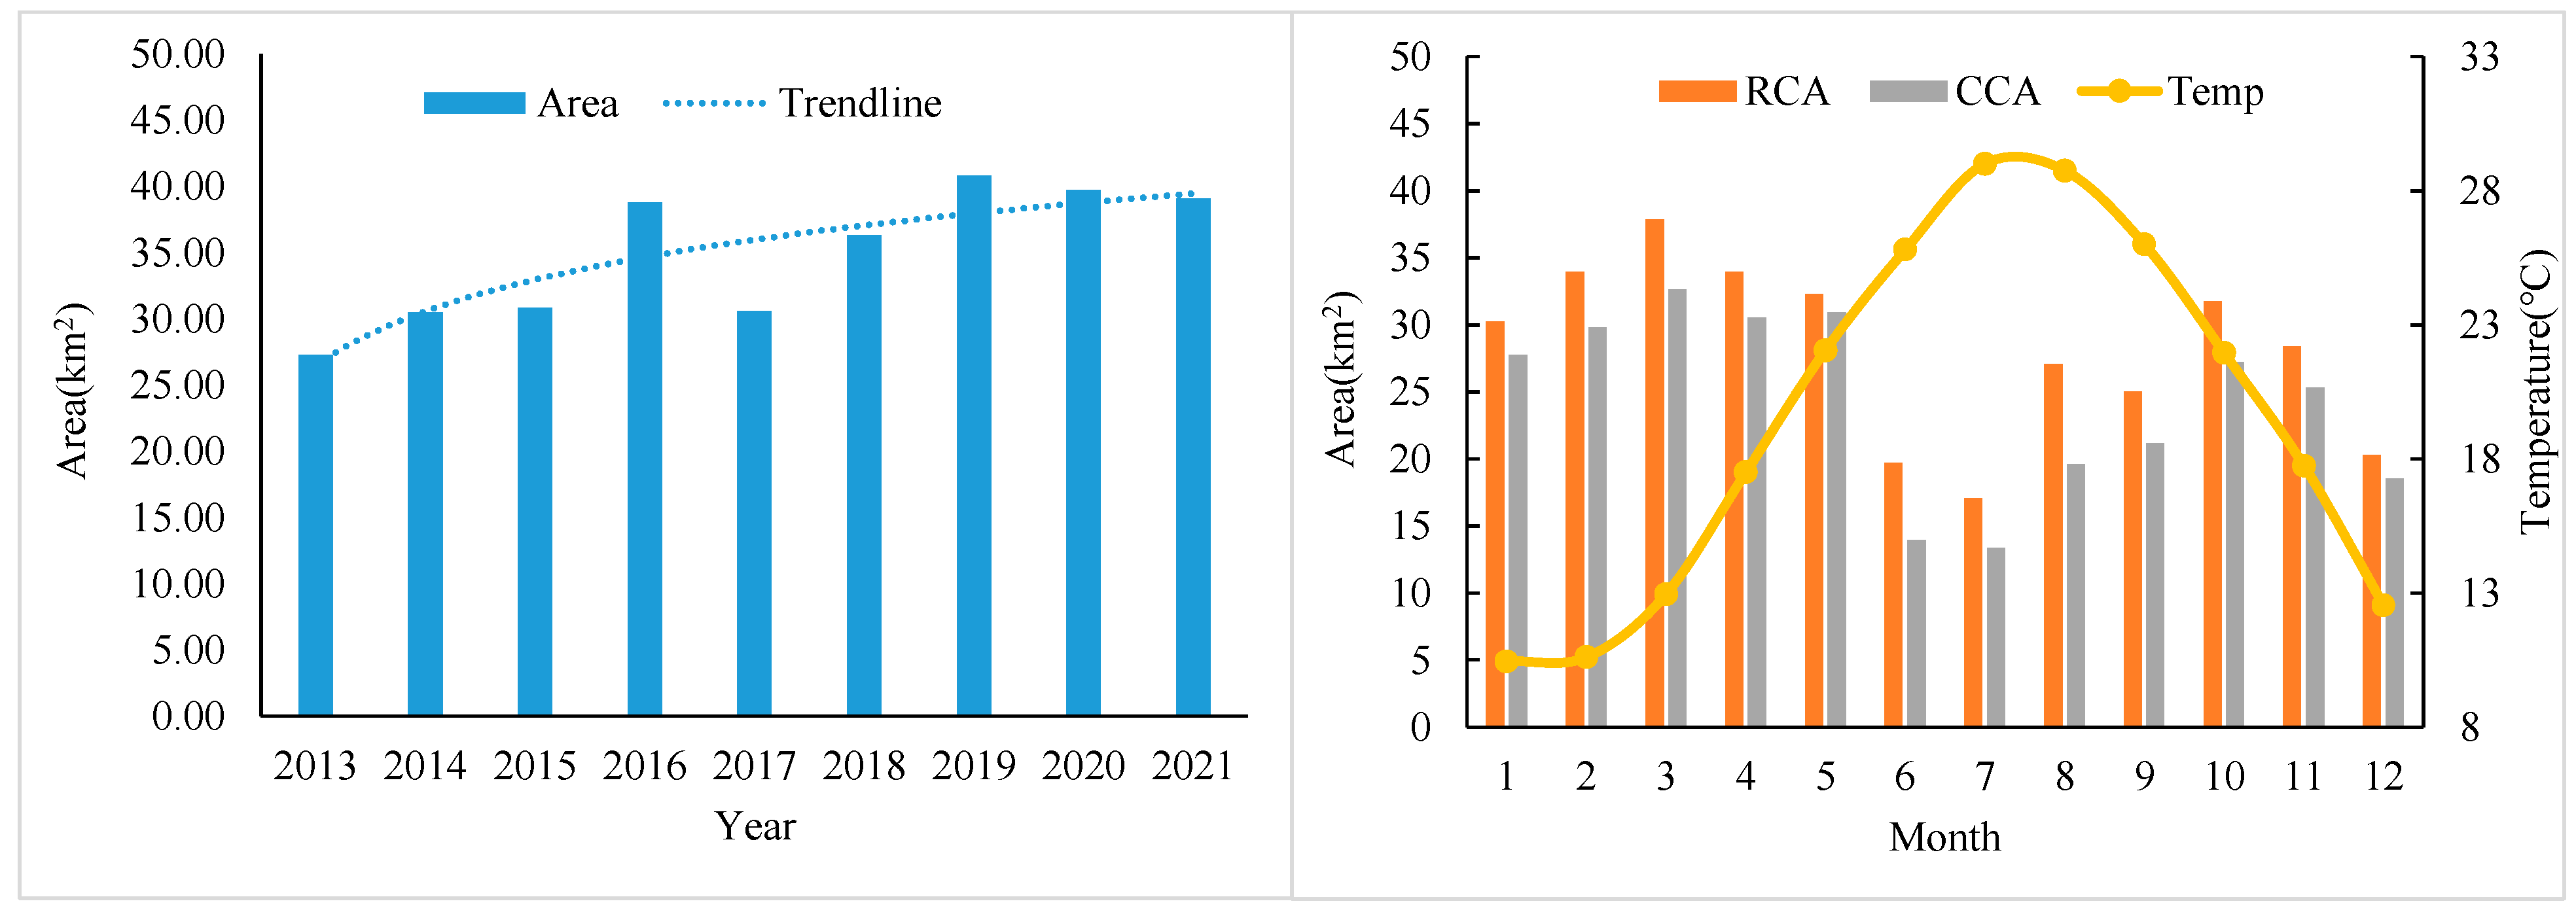
3.3. Trend Analysis of Aquaculture Area Changes
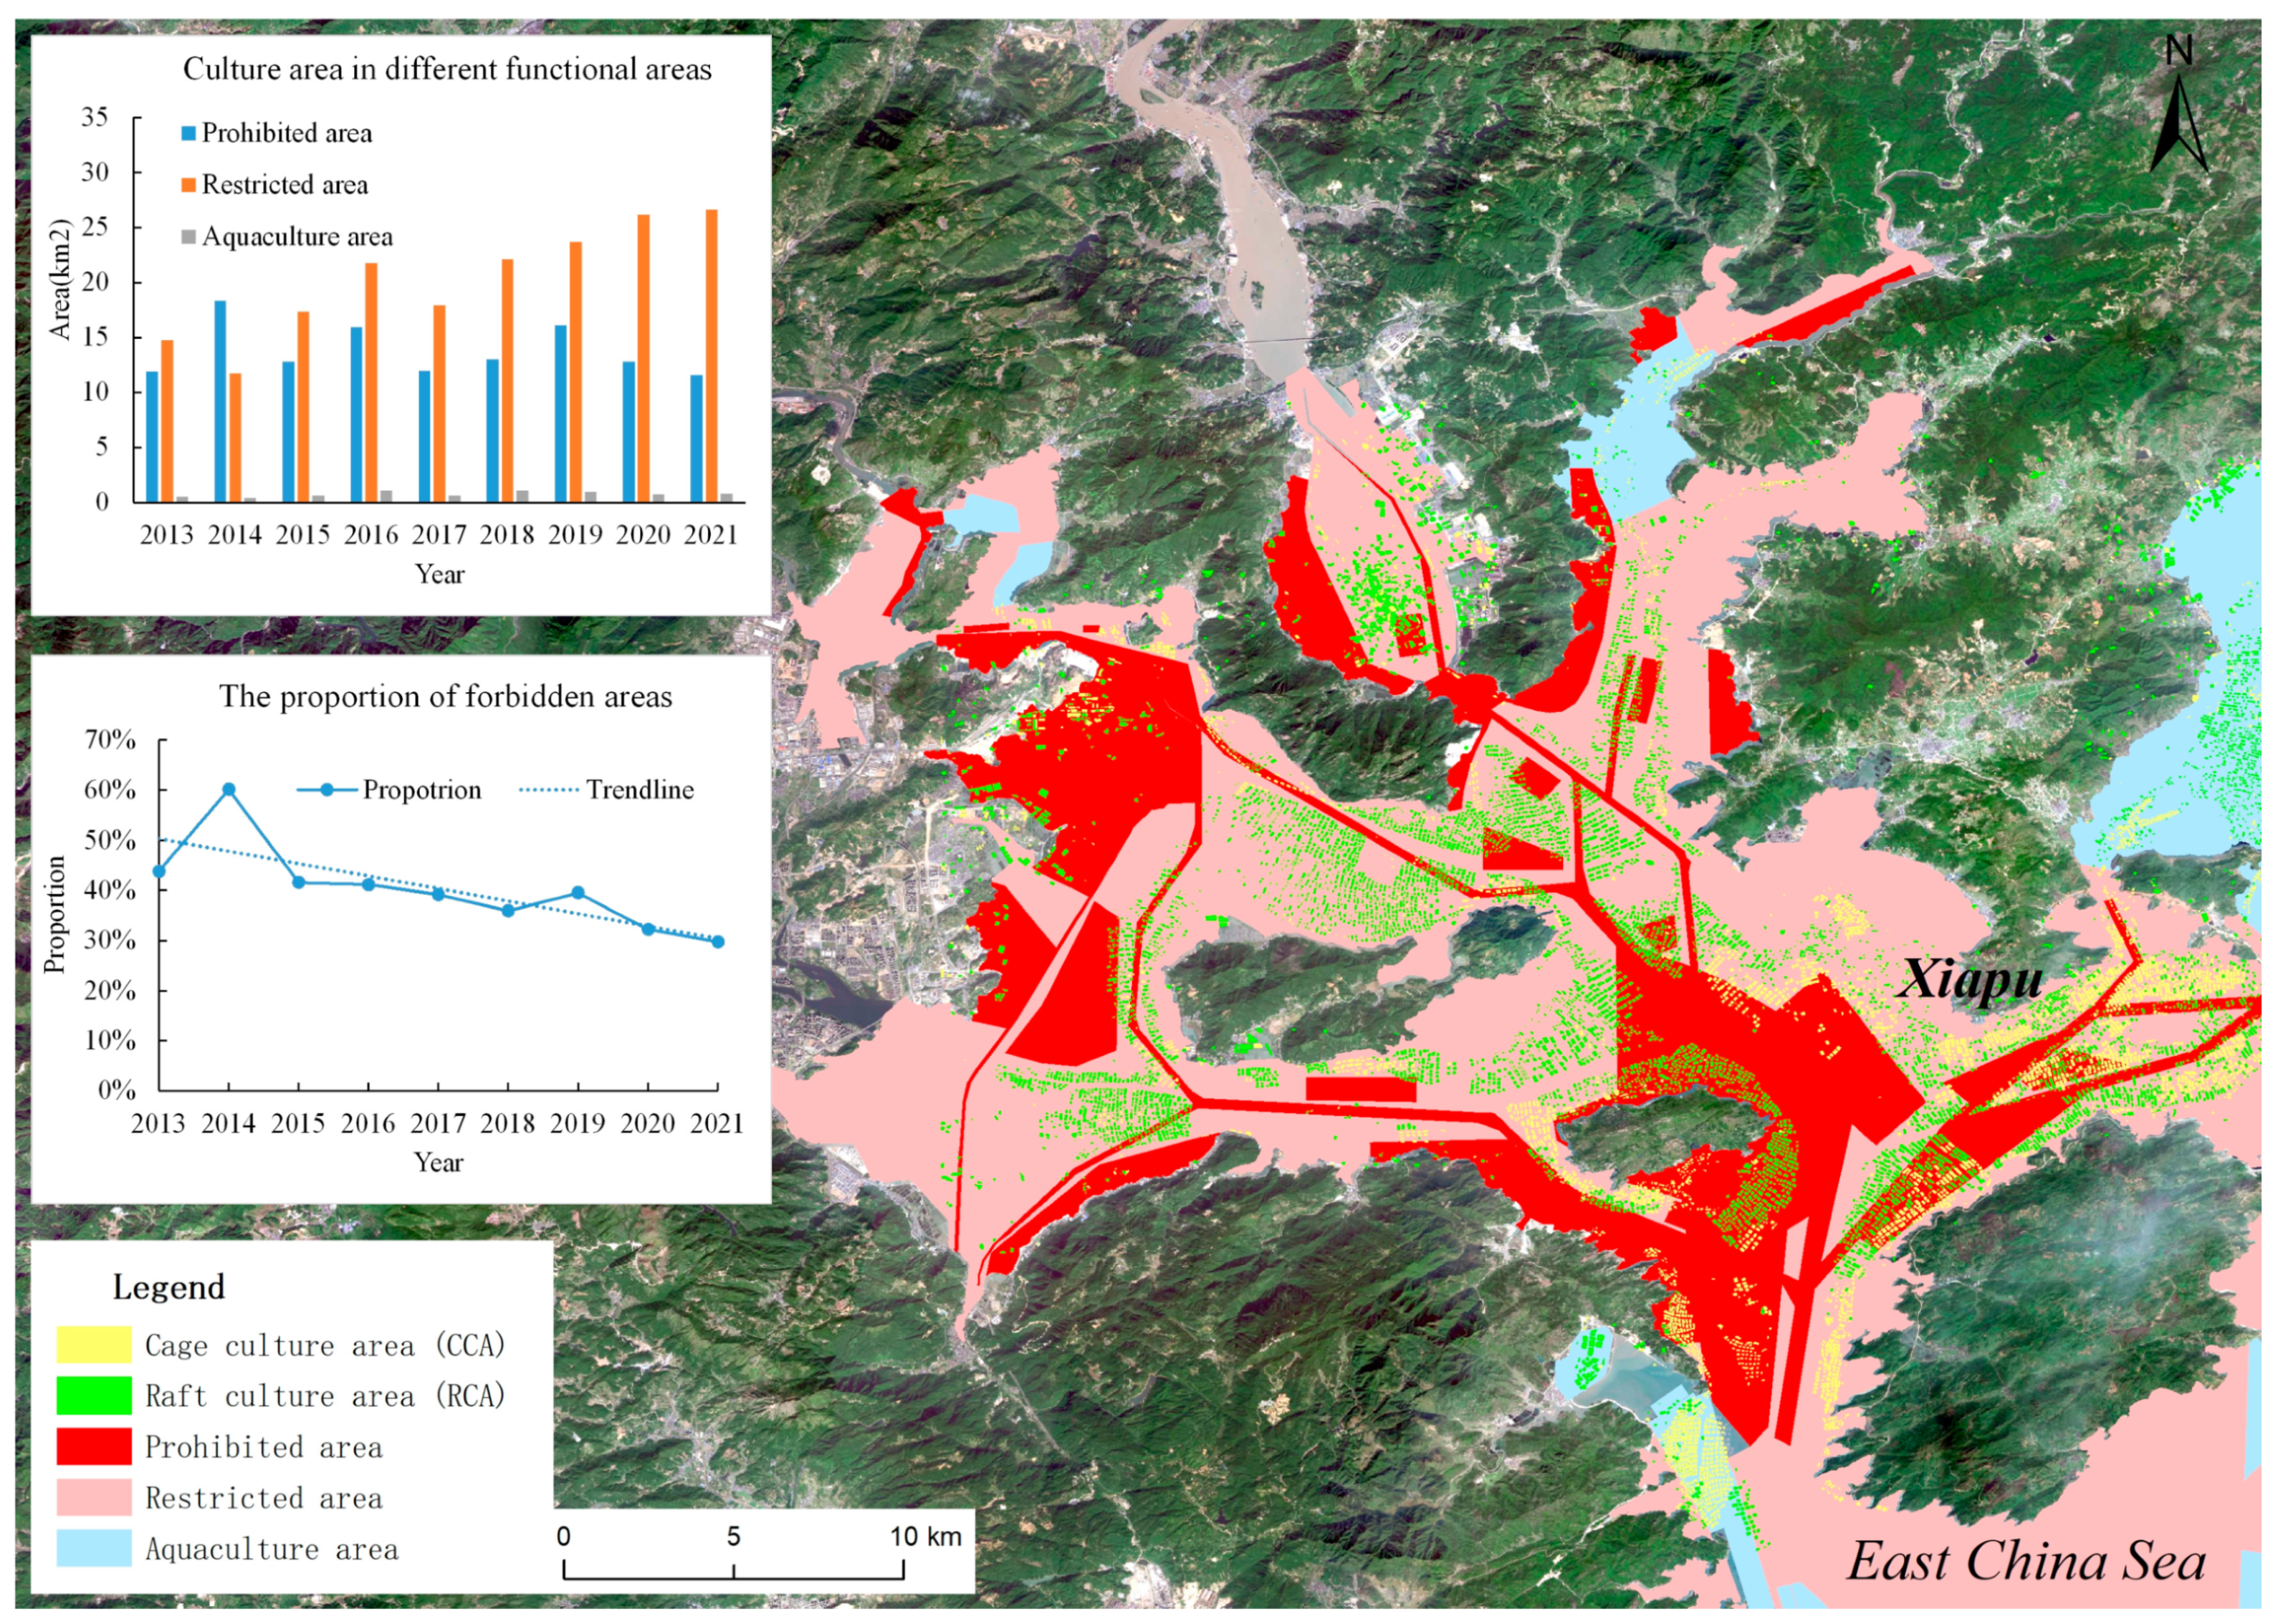
3.4. Violation Monitoring of Aquaculture Areas
4. Conclusions
Author Contributions
Funding
Informed Consent Statement
Data Availability Statement
Conflicts of Interest
References
- Mcginnis, M.V.; Collins, M. A Race for Marine Space: Science, Values, and Aquaculture Planning in New Zealand. Coast. Manag. 2013, 41, 401–419. [Google Scholar]
- Liu, Y.; Wang, Z.; Yang, X.; Zhang, Y.; Yang, F.; Liu, B.; Cai, P. Satellite-based monitoring and statistics for raft and cage aquaculture in China’s offshore waters. Int. J. Appl. Earth Obs. Geoinf. 2020, 91, 102118. [Google Scholar] [CrossRef]
- Demirak, A.; Balci, A.; Tuefekci, M. Environmental impact of the marine aquaculture in Güllük Bay, Turkey. Environ. Monit. Assess. 2006, 123, 1. [Google Scholar] [PubMed]
- Fustes, D.; Cantorna, D.; Dafonte, C.; Varela, B.A.; Iglesias, A.; Manteiga, M. A cloud-integrated web platform for marine monitoring using GIS and remote sensing. Application to oil spill detection through SAR images. Future Gener. Comput. Syst. 2014, 34, 155–160. [Google Scholar]
- Le Van Trung Le Ngoc Lam Tam, D.M. Web Gis and Remote Sensing Solutions for Monitoring and Thematic Mapping in the Mekong Delta Region. IOP Conf. Ser. Earth Environ. Sci. 2021, 652, 012023. [Google Scholar]
- Konko, Y.; Bagaram, B.M.; Julien, F.E.D.E.; Akpamou, K.G.E.T.; Kokou, K. Multitemporal Analysis of Coastal Erosion Based on Multisource Satellite Images in the South of the Mono Transboundary Biosphere Reserve in Togo (West Africa). Open Access Libr. J. 2018, 5, 1–21. [Google Scholar]
- Maslov, K.A.; Tokareva, O.S. System for automated environmental monitoring using remote sensing data of the Earth from open data sources. IOP Conf. Ser. Mater. Sci. Eng. 2021, 1019, 012100. [Google Scholar] [CrossRef]
- Liu, Y.; Yang, X.; Wang, Z.; Lu, C.; Li, Z.; Yang, F. Aquaculture area extraction and vulnerability assessment in Sanduao based on richer convolutional features network model. J. Oceanol. Limnol. 2019, 37, 1941–1954. [Google Scholar]
- Lu, Y.; Li, Q.; Du, X.; Wang, H.; Liu, J. A Method of Coastal Aquaculture Area Automatic Extraction with High Spatial Resolution Images. Remote Sens. Technol. Appl. 2015, 30, 486–494. [Google Scholar]
- Wang, F.; Xia, L.; Chen, Z.; Cui, W.; Liu, Z.; Pan, C. Remote sensing identification of coastal zone mariculture modes based on association-rules object-oriented method. Trans. Chin. 2018, 34, 210–217. [Google Scholar]
- Chun-ying, R.; Zongming, W.; Bai, Z.; Lin, L.; Lin, C.; Kaishan, S.; Mingming, J. Remote Monitoring of Expansion of Aquaculture Ponds Along Coastal Region of the Yellow River Delta from 1983 to 2015. Chin. Geogr. Sci. 2018, 28, 430–442. [Google Scholar]
- Kang, J.; Sui, L.; Yang, X.; Liu, Y.; Wang, Z.; Wang, J.; Yang, F.; Liu, B.; Ma, Y. Sea Surface-Visible Aquaculture Spatial-Temporal Distribution Remote Sensing: A Case Study in Liaoning Province, China from 2000 to 2018. Sustainability 2019, 11, 7186. [Google Scholar] [CrossRef]
- Lu, X.; Gu, Y.; Wang, X.; Lin, Y.; Zhao, Q.; Wang, K.; Liu, X.; Fei, X. The identification of Porphyra culture area by remote sensing and spatial distribution change and driving factors analysis. Mar. Sci. 2018, 42, 87–96. [Google Scholar]
- Stiller, D.; Ottinger, M.; Leinenkugel, P. Spatio-Temporal Patterns of Coastal Aquaculture Derived from Sentinel-1 Time Series Data and the Full Landsat Archive. Remote Sens. 2019, 11, 1707. [Google Scholar] [CrossRef]
- Xu, H.; Zhang, Y.; Chen, Z.; Chu, J. The Remote Sensing Monitoring and Analysis of Porphyra Cultivation in Lianyungang in Recent 10 Years. Mod. Surv. Mapp. 2019, 42, 10–14. [Google Scholar]
- Xue, M.; Chen, Y.; Tian, X.; Yan, M.; Zhang, Z. Detection the Expansion of Marine Aquaculture in Sansha Bay by Remote Sensing. In Proceedings of the IGARSS 2018—2018 IEEE International Geoscience and Remote Sensing Symposium, Valencia, Spain, 22–27 July 2018; pp. 7866–7869. [Google Scholar]
- Wang, Y.; Zhang, Y.; Chen, Y.; Wang, J.; Bai, H.; Wu, B.; Zheng, T. The Assessment of More Suitable Image Spatial Resolutions for Offshore Aquaculture Areas Automatic Monitoring Based on Coupled NDWI and Mask R-CNN. Remote Sens. 2022, 14, 3079. [Google Scholar] [CrossRef]
- Hu, Y.; Ma, Y.; An, J. Research on high accuracy detection of red tide hyperspecrral based on deep learning cnn. The International Archives of the Photogrammetry. Remote Sens. Spat. Inf. Sci. 2018, 42, 573–577. [Google Scholar]
- Li, Y.; Wang, J. A Fast Postprocessing Algorithm for the Overlapping Problem in Wafer Map Detection. J. Sens. 2021, 2021, 2682286. [Google Scholar]
- Wang, K.; Liu, M. A feature-optimized Faster regional convolutional neural network for complex background objects detection. IET Image Process. 2021, 15, 378–392. [Google Scholar]
- Zhao, J.; Hao, S.; Dai, C.; Zhang, H.; Zhao, L.; Ji, Z.; Ganchev, I. Improved vision-based vehicle detection and classification by optimized YOLOv4. IEEE Access 2022, 10, 8590–8603. [Google Scholar]
- He, K.; Zhang, X.; Ren, S.; Sun, J. Deep residual learning for image recognition. In Proceedings of the IEEE Conference on Computer Vision and Pattern Recognition, Las Vegas, NV, USA, 27–30 June 2016; pp. 770–778. [Google Scholar]
- Wu, Q.; Feng, D.; Cao, C.; Zeng, X.; Feng, Z.; Wu, J.; Huang, Z. Improved mask R-CNN for aircraft detection in remote sensing images. Sensors 2021, 21, 2618. [Google Scholar] [CrossRef] [PubMed]
- Wang, Z.; Cui, C.; Sui, J.; Zhang, Y.; Guo, C. A temperature monitoring method for sensor arrays based on temperature mapping and improved Mask R-CNN. IEEE Sens. J. 2024, 24, 24483–24497. [Google Scholar] [CrossRef]
- Ren, S.; He, K.; Girshick, R.; Sun, J. Faster R-CNN: Towards Real-Time Object Detection with Region Proposal Networks. IEEE Trans. Pattern Anal. Mach. Intell. 2017, 39, 1137–1149. [Google Scholar] [PubMed]
- Xu, X.; Zhao, M.; Shi, P.; Ren, R.; He, X.; Wei, X.; Yang, H. Crack detection and comparison study based on faster R-CNN and mask R-CNN. Sensors 2022, 22, 1215. [Google Scholar] [CrossRef]
- Guirado, E.; Blanco-Sacristan, J.; Rodriguez-Caballero, E.; Tabik, S.; Alcaraz-Segura, D.; Martinez-Valderrama, J.; Cabello, J. Mask R-CNN and OBIA fusion improves the segmentation of scattered vegetation in very high-resolution optical sensors. Sensors 2021, 21, 320. [Google Scholar] [CrossRef]
- Woo, S.; Park, J.; Lee, J.Y.; Kweon, I.S. Cbam: Convolutional block attention module. In Proceedings of the European Conference on Computer Vision (ECCV), Munich, Germany, 8–14 September 2018; pp. 3–19. [Google Scholar]
- Chen, F.; Zhang, L.; Kang, S.; Chen, L.; Dong, H.; Li, D.; Wu, X. Soft-NMS-enabled YOLOv5 with SIOU for small water surface floater detection in UAV-captured images. Sustainability 2023, 15, 10751. [Google Scholar] [CrossRef]
- Li, Y.; Li, S.; Du, H.; Chen, L.; Zhang, D.; Li, Y. YOLO-ACN: Focusing on small target and occluded object detection. IEEE Access 2020, 8, 227288–227303. [Google Scholar]
- Sui, L.; Mu, F.; Li, Y. NMS Threshold matters for Ego4D Moment Queries--2nd place solution to the Ego4D Moment Queries Challenge 2023. arXiv 2023, arXiv:2307.02025. [Google Scholar]
- Fu, Y.; Ye, Z.; Deng, J.; Zheng, X.; Huang, Y.; Yang, W.; Wang, K. Finer resolution mapping of marine aquaculture areas using worldView-2 imagery and a hierarchical cascade convolutional neural network. Remote Sens. 2019, 11, 1678. [Google Scholar] [CrossRef]
- Liu, P.; Wei, Y.; Wang, Q.; Xie, J.; Chen, Y.; Li, Z.; Zhou, H. A research on landslides automatic extraction model based on the improved mask R-CNN. ISPRS Int. J. Geo-Inf. 2021, 10, 168. [Google Scholar] [CrossRef]
- Cui, B.; Fei, D.; Shao, G.; Lu, Y.; Chu, J. Extracting Raft Aquaculture Areas from Remote Sensing Images via an Improved U-Net with a PSE Structure. Remote Sens. 2019, 11, 2053. [Google Scholar] [CrossRef]
- Chen, Z.; Xu, M.; Zhang, H.; Wang, J.; Liu, Y.; Fang, J. Selection of mariculture sites based on ecological zoning—Nantong, China. Aquaculture 2024, 578, 740039. [Google Scholar] [CrossRef]
- Meng, D.; Yang, X.; Wang, Z.; Liu, Y.; Zhang, J.; Liu, X.; Liu, B. Spatial Distribution and Differentiation Analysis of Coastal Aquaculture in China Based on Remote Sensing Monitoring. Remote Sens. 2024, 16, 1585. [Google Scholar] [CrossRef]

| Research Phase | Source | Format | Time Range | Space Range | Spatial Resolution | Number of Images |
|---|---|---|---|---|---|---|
| Model training and validation | GF-1 | .tif | 13 June 2020 | 119°28′8″–120°9′44″ E, 26°21′34″–27°0′24″ N | 2 m | 1 |
| Aquaculture area monitoring | Landsat-8 | .tif | 2013–2021 | 119°49′13″–119°57′3″ E, 26°36′38″–26°41′34″ N | 15 m | 36 |
| Source | Spatial Resolution | Total Number of Image Samples | Training Samples | Validation Samples | Splitting Ratios |
|---|---|---|---|---|---|
| GF-1 | 2 m | 80 | 64 | 16 | 4:1 |
| Expanded GF-1 | 2 m | 272 | 256 | 16 | 16:1 |
| Bilinear down-sampling based on GF-1 | 4 m | 272 | 256 | 16 | 16:1 |
| 10 m | 272 | 256 | 16 | 16:1 | |
| 15 m | 272 | 256 | 16 | 16:1 | |
| 20 m | 272 | 256 | 16 | 16:1 | |
| 30 m | 272 | 256 | 16 | 16:1 | |
| 50 m | 272 | 256 | 16 | 16:1 | |
| Landsat-8 | 15 m | 2880 | 2160 | 720 | 4:1 |
Disclaimer/Publisher’s Note: The statements, opinions and data contained in all publications are solely those of the individual author(s) and contributor(s) and not of MDPI and/or the editor(s). MDPI and/or the editor(s) disclaim responsibility for any injury to people or property resulting from any ideas, methods, instructions or products referred to in the content. |
© 2025 by the authors. Licensee MDPI, Basel, Switzerland. This article is an open access article distributed under the terms and conditions of the Creative Commons Attribution (CC BY) license (https://creativecommons.org/licenses/by/4.0/).
Share and Cite
Zhang, J.; Wang, Y.; Zhang, Y.; Zhao, Y. Enhanced Mask R-CNN Incorporating CBAM and Soft-NMS for Identification and Monitoring of Offshore Aquaculture Areas. Sensors 2025, 25, 2792. https://doi.org/10.3390/s25092792
Zhang J, Wang Y, Zhang Y, Zhao Y. Enhanced Mask R-CNN Incorporating CBAM and Soft-NMS for Identification and Monitoring of Offshore Aquaculture Areas. Sensors. 2025; 25(9):2792. https://doi.org/10.3390/s25092792
Chicago/Turabian StyleZhang, Jiajun, Yonggui Wang, Yaxin Zhang, and Yanxin Zhao. 2025. "Enhanced Mask R-CNN Incorporating CBAM and Soft-NMS for Identification and Monitoring of Offshore Aquaculture Areas" Sensors 25, no. 9: 2792. https://doi.org/10.3390/s25092792
APA StyleZhang, J., Wang, Y., Zhang, Y., & Zhao, Y. (2025). Enhanced Mask R-CNN Incorporating CBAM and Soft-NMS for Identification and Monitoring of Offshore Aquaculture Areas. Sensors, 25(9), 2792. https://doi.org/10.3390/s25092792