5.1. Experimental Set Up
According to how the feature vector
was defined in
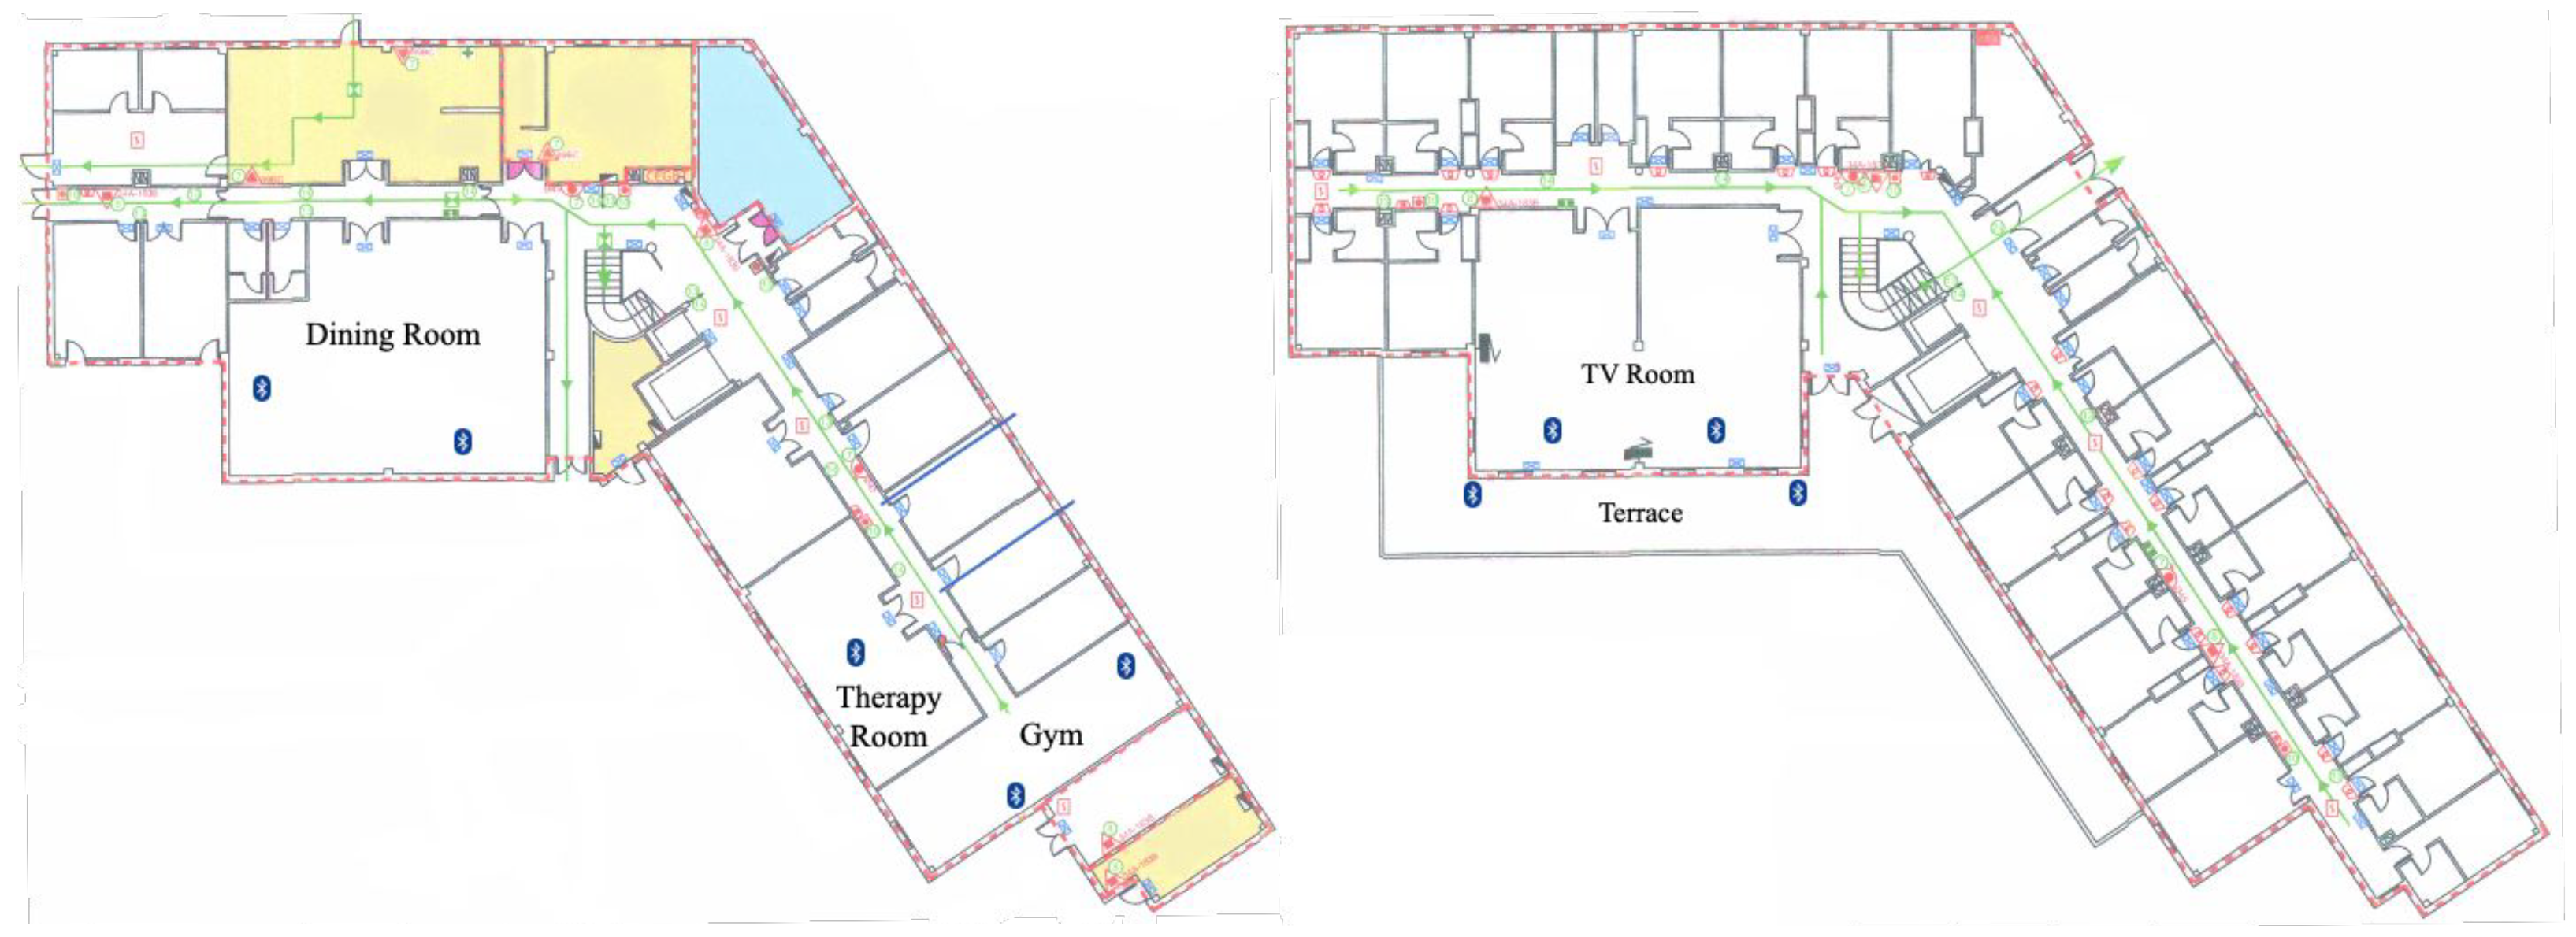
Section 3.3 and considering where the beacons were deployed in the dataset used,
: Physically_M and
: Physically_A activities were defined as the one performed in the gym and the therapy room. On the other hand,
: Passive_M and
: Passive_M activities were the ones carried out on the terrace and in the TV room.
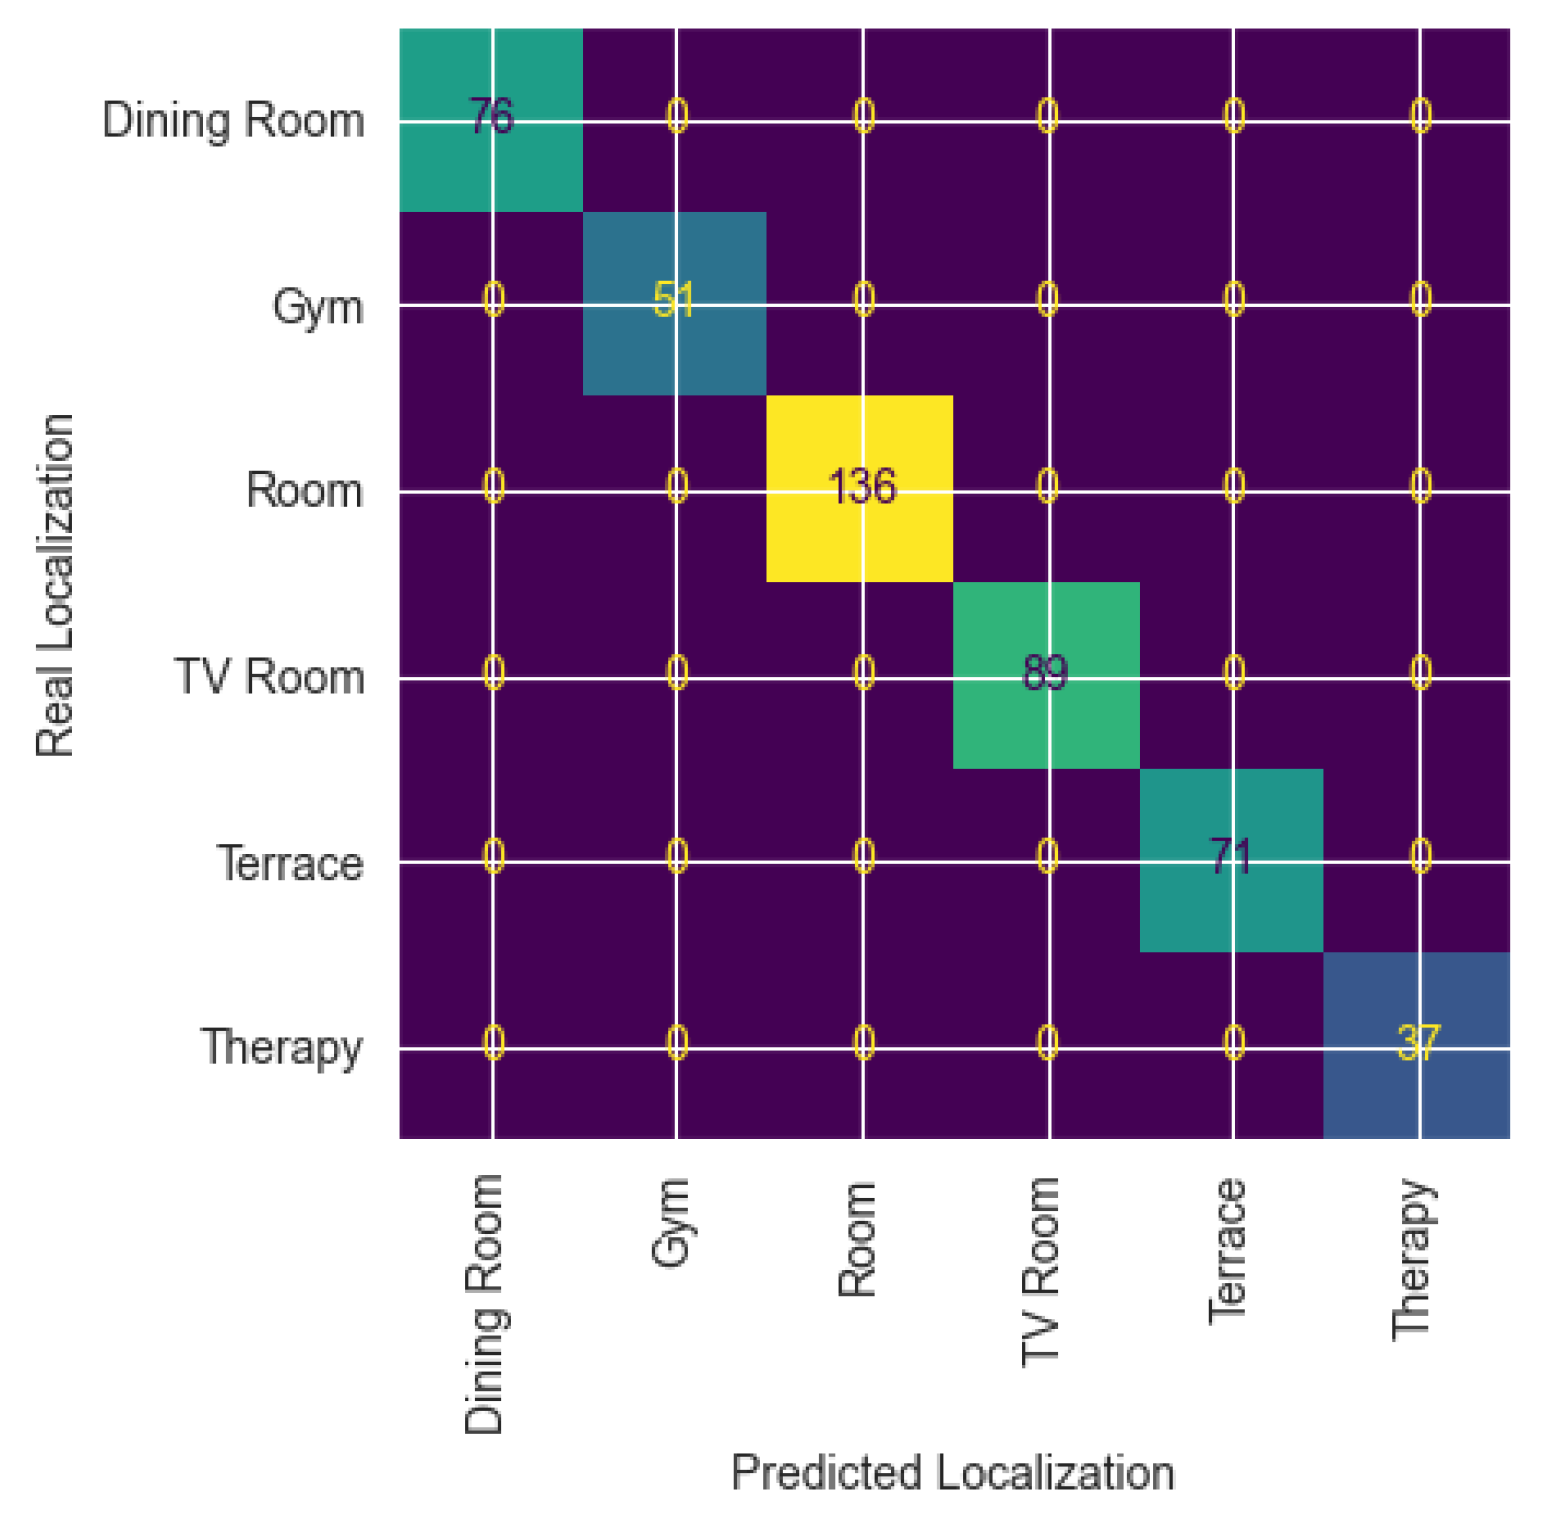
The dataset included a radio map produced by the dataset creators by staying several minutes at each location to capture RSSI data. We tested the quality of the radio map by randomly dividing the samples included in the radio map into 70% for training and 30% for validation, obtaining an accuracy of 100% when using a 1NN supervised classifier.
Figure 5 shows the confusion matrix obtained in this particular configuration, where 76, 51, 136, 89, 71, and 37 test fingerprints were obtained in the dining room, gym, users’ rooms, TV room, terrace, and therapy room, respectively.
To extract the feature vectors , we tested several values for the parameters , , and . The best results were obtained for the values , , and , but there were no significant differences when using other values such as , , or . This means that the activity is considered complete only if a window of 60 min can be found during which the user stayed at least 10 min in the location of the activity.
To determine whether the routines generated for each user accurately reflect their actual behavior, the ground truth information provided to caregivers in text format was transformed into probabilities through human interpretation. These resulting matrices denoted as
are shown in the left part of
Table 2 and have the same dimensions as the matrices
to be estimated. To compare the corresponding pairs of probability matrices, the Mean Squared Error (MSE) metric was utilized.
5.2. Localization Results
Figure 6 shows the localization results for the six volunteers. On the right of each subfigure, the weekdays are indicated. The
x axis represents the hour of the day. Each row of the subfigures represents a day in the life of the volunteer where there are data available. Each of the following colors represents a different location where the user stayed:
White: Not possible to estimate the location;
Blue: Volunteer’s room;
Red: Dining room;
Yellow: A place where the volunteer performed a passive activity;
Green: A place where the volunteer performed an active activity.
Due to battery limitations, no data were obtained from the late afternoon until the next day. Volunteers always stayed in their rooms during those periods. The results obtained showed that all users returned to the dining room at approximately the same time to have breakfast, lunch, an afternoon snack, and dinner.
According to the results obtained with the proposed approach (see
Figure 6a), user 9FE9 tends to perform active activities after having breakfast, although they may perform passive activities on some days. Almost every day, they perform passive activities after having lunch. Some days, they stay in their room for a while. After having dinner, the user tends to participate in active activities. User 9FE9 represents a very active volunteer. In contrast, user 52EA (see
Figure 6c) almost always stays in their room. Notably, user 402E (see
Figure 6d) had a strong change in routine in the middle of the study period. They used to perform active activities, but there was a point at which the routine shifted to passive ones. This could be due to some health problem of the volunteer or that they decided to pass the time after having lunch on the terrace since, during this period, the weather was good enough to permit this activity, in contrast to the colder days before.
These results demonstrate the effectiveness of our methods in accurately detecting the location of users in a real-world scenario with actual participants. Despite the inherent challenges, such as limited data collection due to battery constraints, the approach successfully identifies key patterns of movement and location transitions throughout the day. This includes detecting periods of activity in shared spaces, such as the dining room, and extended stays in personal rooms. Such precision in localization is very important for applications in real scenarios, where understanding user behavior and routine is essential, particularly in contexts like elderly care, health monitoring, or personalized assistance systems. The ability to work effectively with real people under realistic conditions highlights the practical viability and robustness of the proposed approach.
5.3. Routines Extraction Results
The left part of
Table 2 shows how the text files providing explanations about the volunteers’ behavior (as observed by the caregivers) have been transformed into routines, i.e., the matrices
. The right part of
Table 2 shows the results obtained using the proposed approach, i.e., the matrices
. The automatically extracted
is expected to be similar to the ground truth information
.
The routine estimated for user 02A8 (see
Table 3) using the proposed methodology reveals a highly stable pattern in the mornings, consistently showing a strong tendency to stay in the room across all weekdays. In the afternoon, the behavior is also mostly sedentary, with high probabilities of staying in the room, but with slightly more variation. On some days, particularly Monday, Wednesday, and Friday, there is a moderate likelihood of engaging in physical activity, while on Tuesday and Thursday, there is a small chance of performing non-physical (calm) activities. Overall, the routine suggests a low-activity profile, especially in the morning, with limited but slightly more diverse behavior in the afternoon.
The estimated routine for user 9FE9 (see
Table 4) shows a high consistency across all weekdays, with high probabilities for
. Additionally, there is some variation in the morning routine, with occasional involvement in non-physical activities. In the afternoon, the user regularly participates in physical and non-physical activities, especially later in the week (Wednesday to Friday), with high probabilities for both
and
. The afternoon routine appears more balanced and active compared to the morning, suggesting a user who maintains a relatively high level of activity throughout the week, especially as the week progresses.
The estimated routine for user 52EA (see
Table 5) shows a highly consistent and stable behavior pattern throughout the week. In the morning, the user almost always stays in the room, with very high probabilities for
and negligible likelihood of doing any other activities. In the afternoon, the user also tends to stay in the room, with
consistently having the highest probability across all weekdays. The probabilities for engaging in either physical or calm activities in the afternoon are extremely low or zero, indicating a very sedentary routine both in the morning and afternoon.
User 402E (see
Table 6) displays a clear preference for physical activities in the morning, with very high probabilities for
across all weekdays. There is also occasional participation in calm morning activities (e.g., Tuesday and Thursday) but never a preference for staying in the room in the morning. In the afternoon, the routine is more varied but consistently includes physical activity (
), often combined with calm activities (
). The routine suggests a user with a physically active lifestyle, especially during the early part of the day, and who maintains a high level of engagement in both types of activities in the afternoon.
User 682A (see
Table 7) shows a very consistent routine in the morning, where they almost always stay in the room (
), with probabilities near or equal to one across all weekdays. There is some variability with minor probabilities for physical and calm activities, but they are never dominant. In the afternoon, the user consistently engages in a calm activity (
), again with high probabilities throughout the week. The probabilities for physical activity or staying in the room during the afternoon are very low or zero. Overall, the routine suggests a stable pattern with quiet mornings and structured, calm engagement in the afternoons.
Finally, user F176 (see
Table 8) has a routine that is both active and diverse. In the morning, the user predominantly engages in physical activities (
), with high probabilities from Monday to Friday. On some days, especially Tuesday and Wednesday, there is also moderate participation in calm activities (
), indicating a varied morning pattern. In the afternoon, the user is highly active, with consistent engagement in calm activities (
) and physical activities (
). Occasionally, other types of activities are also observed (e.g.,
on Monday). Overall, F176 follows a rich and balanced routine involving both physical and calm engagement throughout the week.
Figure 7 shows, using bar diagrams, the difference for each user between the estimated probability of a given activity on a weekday and the behavioral information provided by the caregivers. The taller the bar, the higher the discrepancy between the estimated value and the one provided by caregivers. For some users, for instance, user 52EA (see
Figure 7c), the probabilities obtained by the proposed approach are very close to the ones derived from the information provided by the caregivers. For some of the other users, for instance, user 682A (see
Figure 7e), there is a strong difference in estimating the activity
. This discrepancy can be the result of the following two possible factors: (1) The proposed system was not able to detect this activity since the user performed it at the end of the day when the smartwatch battery was completely drained. (2) The information provided by the caregiver was not entirely accurate, since he/she did not remember the user’s routine well. In this particular case, the localization results shown in
Figure 6e suggest that the problem is the first one. Upon analyzing the localization results of user 402E (see
Figure 6d), an abrupt change in routine is found, as the user changed from performing active activities after lunch to engaging in passive ones. This change in routine is not reflected in the data provided by the caregivers (see
Table 2), which indicate that user 402E always performs active activities after lunch (
).
To compare the results obtained for each user with the probabilities obtained from the behavioral descriptions provided by the caregivers, the MSE between the two matrices is estimated and presented in
Table 9.
Figure 8 shows a boxplot with the values obtained. In general, the proposed method produces a set of probabilities for performing an activity on a given weekday that aligns with the information provided by the caregivers.


 ,
, 


