1. Introduction
In the last decade, the growing interest in the implementation of multimodal X-ray imaging related to absorption, small-angle scattering and refraction phenomena has focused on speckle-based imaging (SBI) methods [
1,
2,
3]. This is due to their relative simplicity, their cost effectiveness and the availability of the required experimental setup, in contrast to interferometric methods, as well as the potential transferability of the results to various applications [
4,
5,
6]. SBI methods consist in analyzing the modulation of the near-field speckle pattern produced by a diffuser when a sample is incorporated into the X-ray beam. There are several methods for retrieving transmission (T), dark-field (DF) and phase contrast (PC) images associated with absorption, small-angle scattering and refraction events, respectively, from diffuser alone (reference image) and diffuser with sample (speckled image) image pairs. The X-ray speckle tracking method (XST), X-ray speckle scanning method (XSS) [
1,
7,
8,
9] and the unified modulated pattern analysis method (UMPA) [
10] are the most used ones for multimodal imaging. XST and XSS perform cross-correlation analysis between the reference and speckled sample images, while UMPA is based on the minimization of a cost function. XSS and UMPA are used in a diffuser scanning modality, while XST is applied for the single-shot case (only one pair of images is required). All these methods have their own set of pros and cons. On the one hand, while XST requires only two acquisitions to provide multimodal images, it suffers from low spatial resolution and excessive noise. On the other hand, XSS and UMPA have an increased spatial resolution, but they require the acquisition of several reference and speckled sample images (usually up to 10–20), which increases both acquisition and processing times, as well as the incorporation of a motorized translation stage. In addition, these methods can result in higher radiation doses than in the case of XST. The advantages of one-dimensional (1D) diffuser scanning methods in comparison with 2D diffuser scanning in a plane transverse to the beam direction are their easy implementation in a cost-efficient laboratory setup as well as less acquisition time. These advantages may compensate for the demonstrated superior performance of 2D methods [
11].
Multimodal imaging becomes useful when it offers additional insights about a sample beyond its conventional X-ray image, which is referred to hereafter as the bright-field (BF) image. BF images contain mixed information about different physical processes involved in radiation–matter interactions (absorption, scattering and refraction) that cannot be directly separated. The aforementioned methods (XST, XSS and UMPA) enable the recovery of PC, T and DF images. However, the phase information can be recovered from single-shot defocused BF images [
12,
13]. A comparison of this approach with SBI methods for PC imaging using a laboratory X-ray source was conducted in our recent work [
14]. This study is specifically focused on the analysis of T and DF images. The former provides information about sample absorption, whereas the latter gives insights into sample features that fall below the system’s resolution. DF, T and BF images will be compared based on quantitative analysis instead of visual inspection, as in earlier publications. In recent speckle-based imaging studies, like the one in reference [
15], linear attenuation and diffusion coefficients are used for material characterization. The linear diffusion coefficient has been previously introduced for material scattering characterization for quantitative X-ray DF computed tomography using a grating interferometer [
16] and edge illumination [
17]. In particular, in [
16], it has been shown experimentally that the DF signal decreases with sample thickness, as does the T signal. However, the variation in such signals with the ODD has not been addressed. Here, we additionally employ the contrast-to-noise ratio for the quantitative analysis of DF, T and BF images.
The goal of this paper is to demonstrate the benefits of speckle-based multimodal (T and DF) imaging for material analysis compared to BF imaging. This research was conducted using a standard laboratory X-ray setup with a polychromatic incoherent source and an imaging system with a detector with approximately 10 µm resolution. Furthermore, the study aims to analyze the differences in T and DF image recovery using different methods (XST, XSS and UMPA) and analysis windows, as well as to verify the results of numerical simulations reported in reference [
18]. Measurements at two different object-detector-distances were performed with this objective.
This paper is organized as follows. In
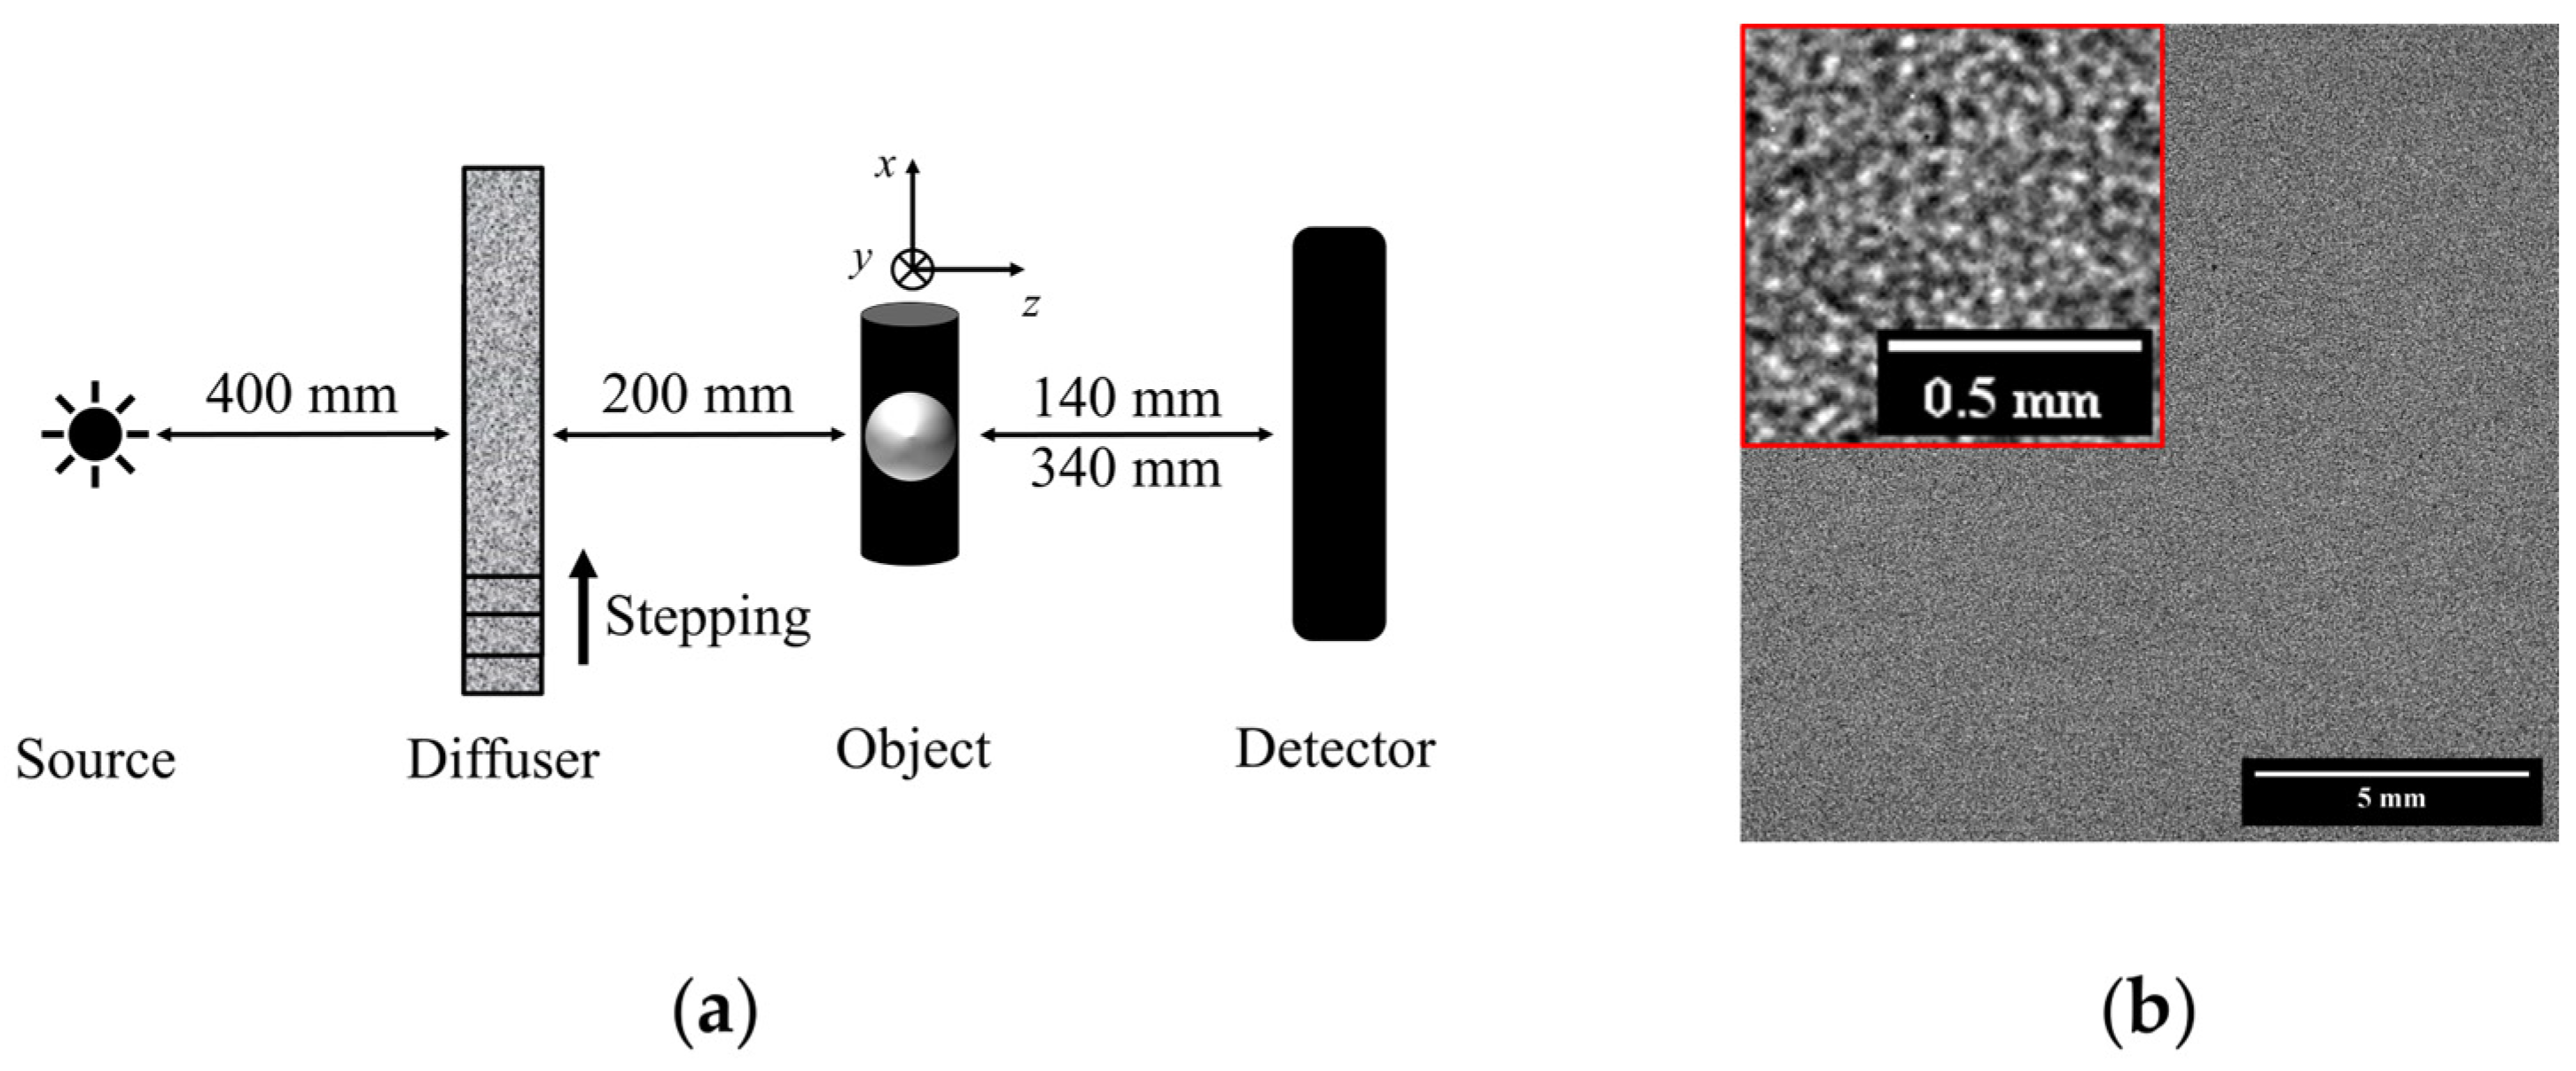
Section 2, we describe the characteristics of the used X-ray setup, the image acquisition conditions and the sample and briefly discuss the fundamentals behind and implementation of XST, XSS and UMPA methods. In
Section 3, we present and discuss the experimental results. The article concludes with
Section 4, which summarizes the main findings derived from the analysis.
3. Experimental Results and Discussion
First, we explore the information that is readily available in the BF images for the ODDs of 140 mm and 340 mm shown in
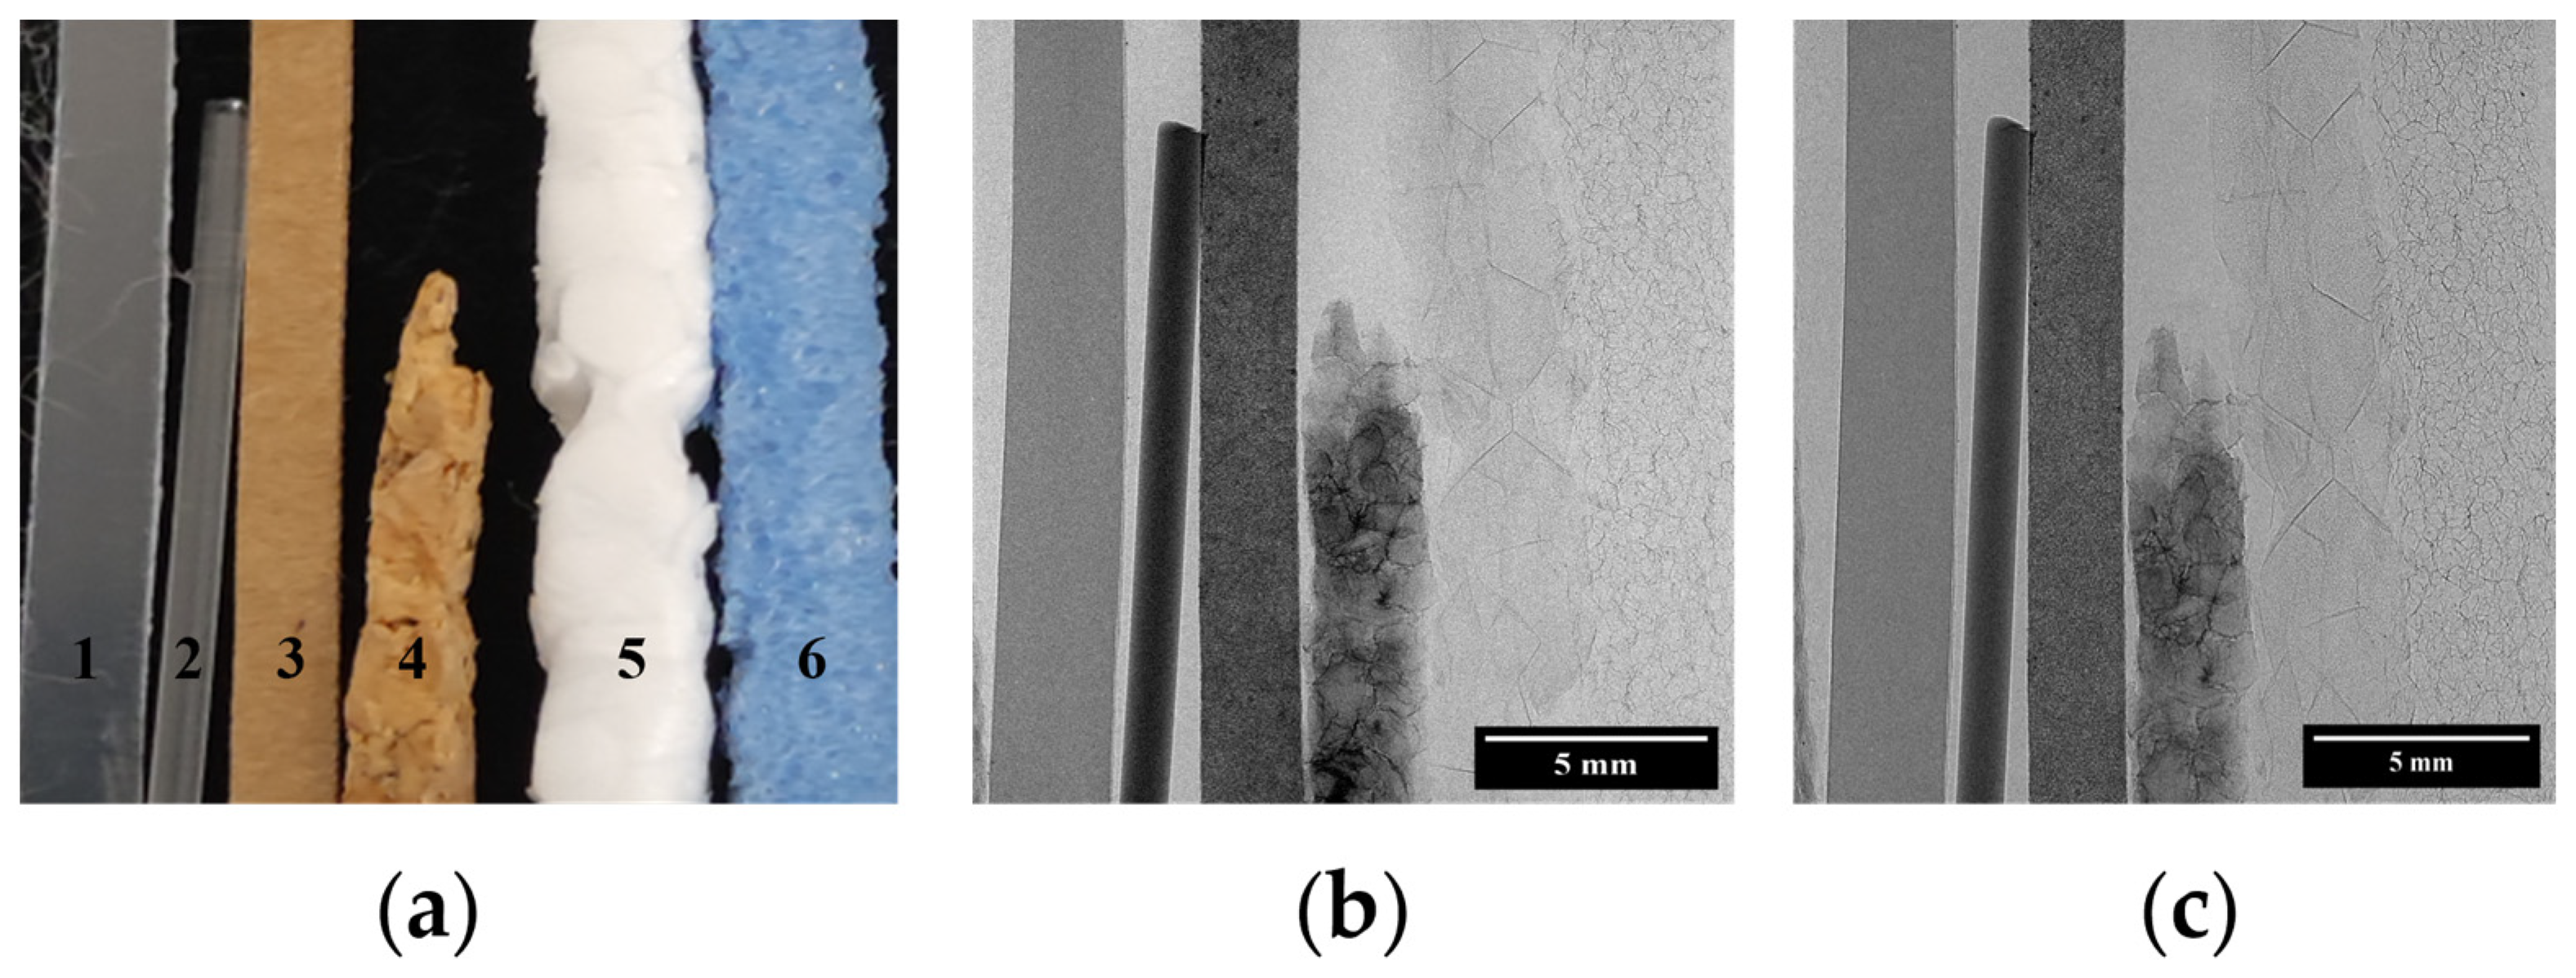
Figure 2. A simple observation of these images allows us to easily distinguish materials 1 to 4 (see
Figure 2b,c) due to their different attenuation properties, whereas objects 5 and 6 are barely visible. After flat-field and dark-current correction, differences in normalized BF images at both ODD are linked to variations in flat-field and dark-field images. The air STD for the BF image at 140 mm ODD is 0.7 times smaller than at 340 mm ODD.
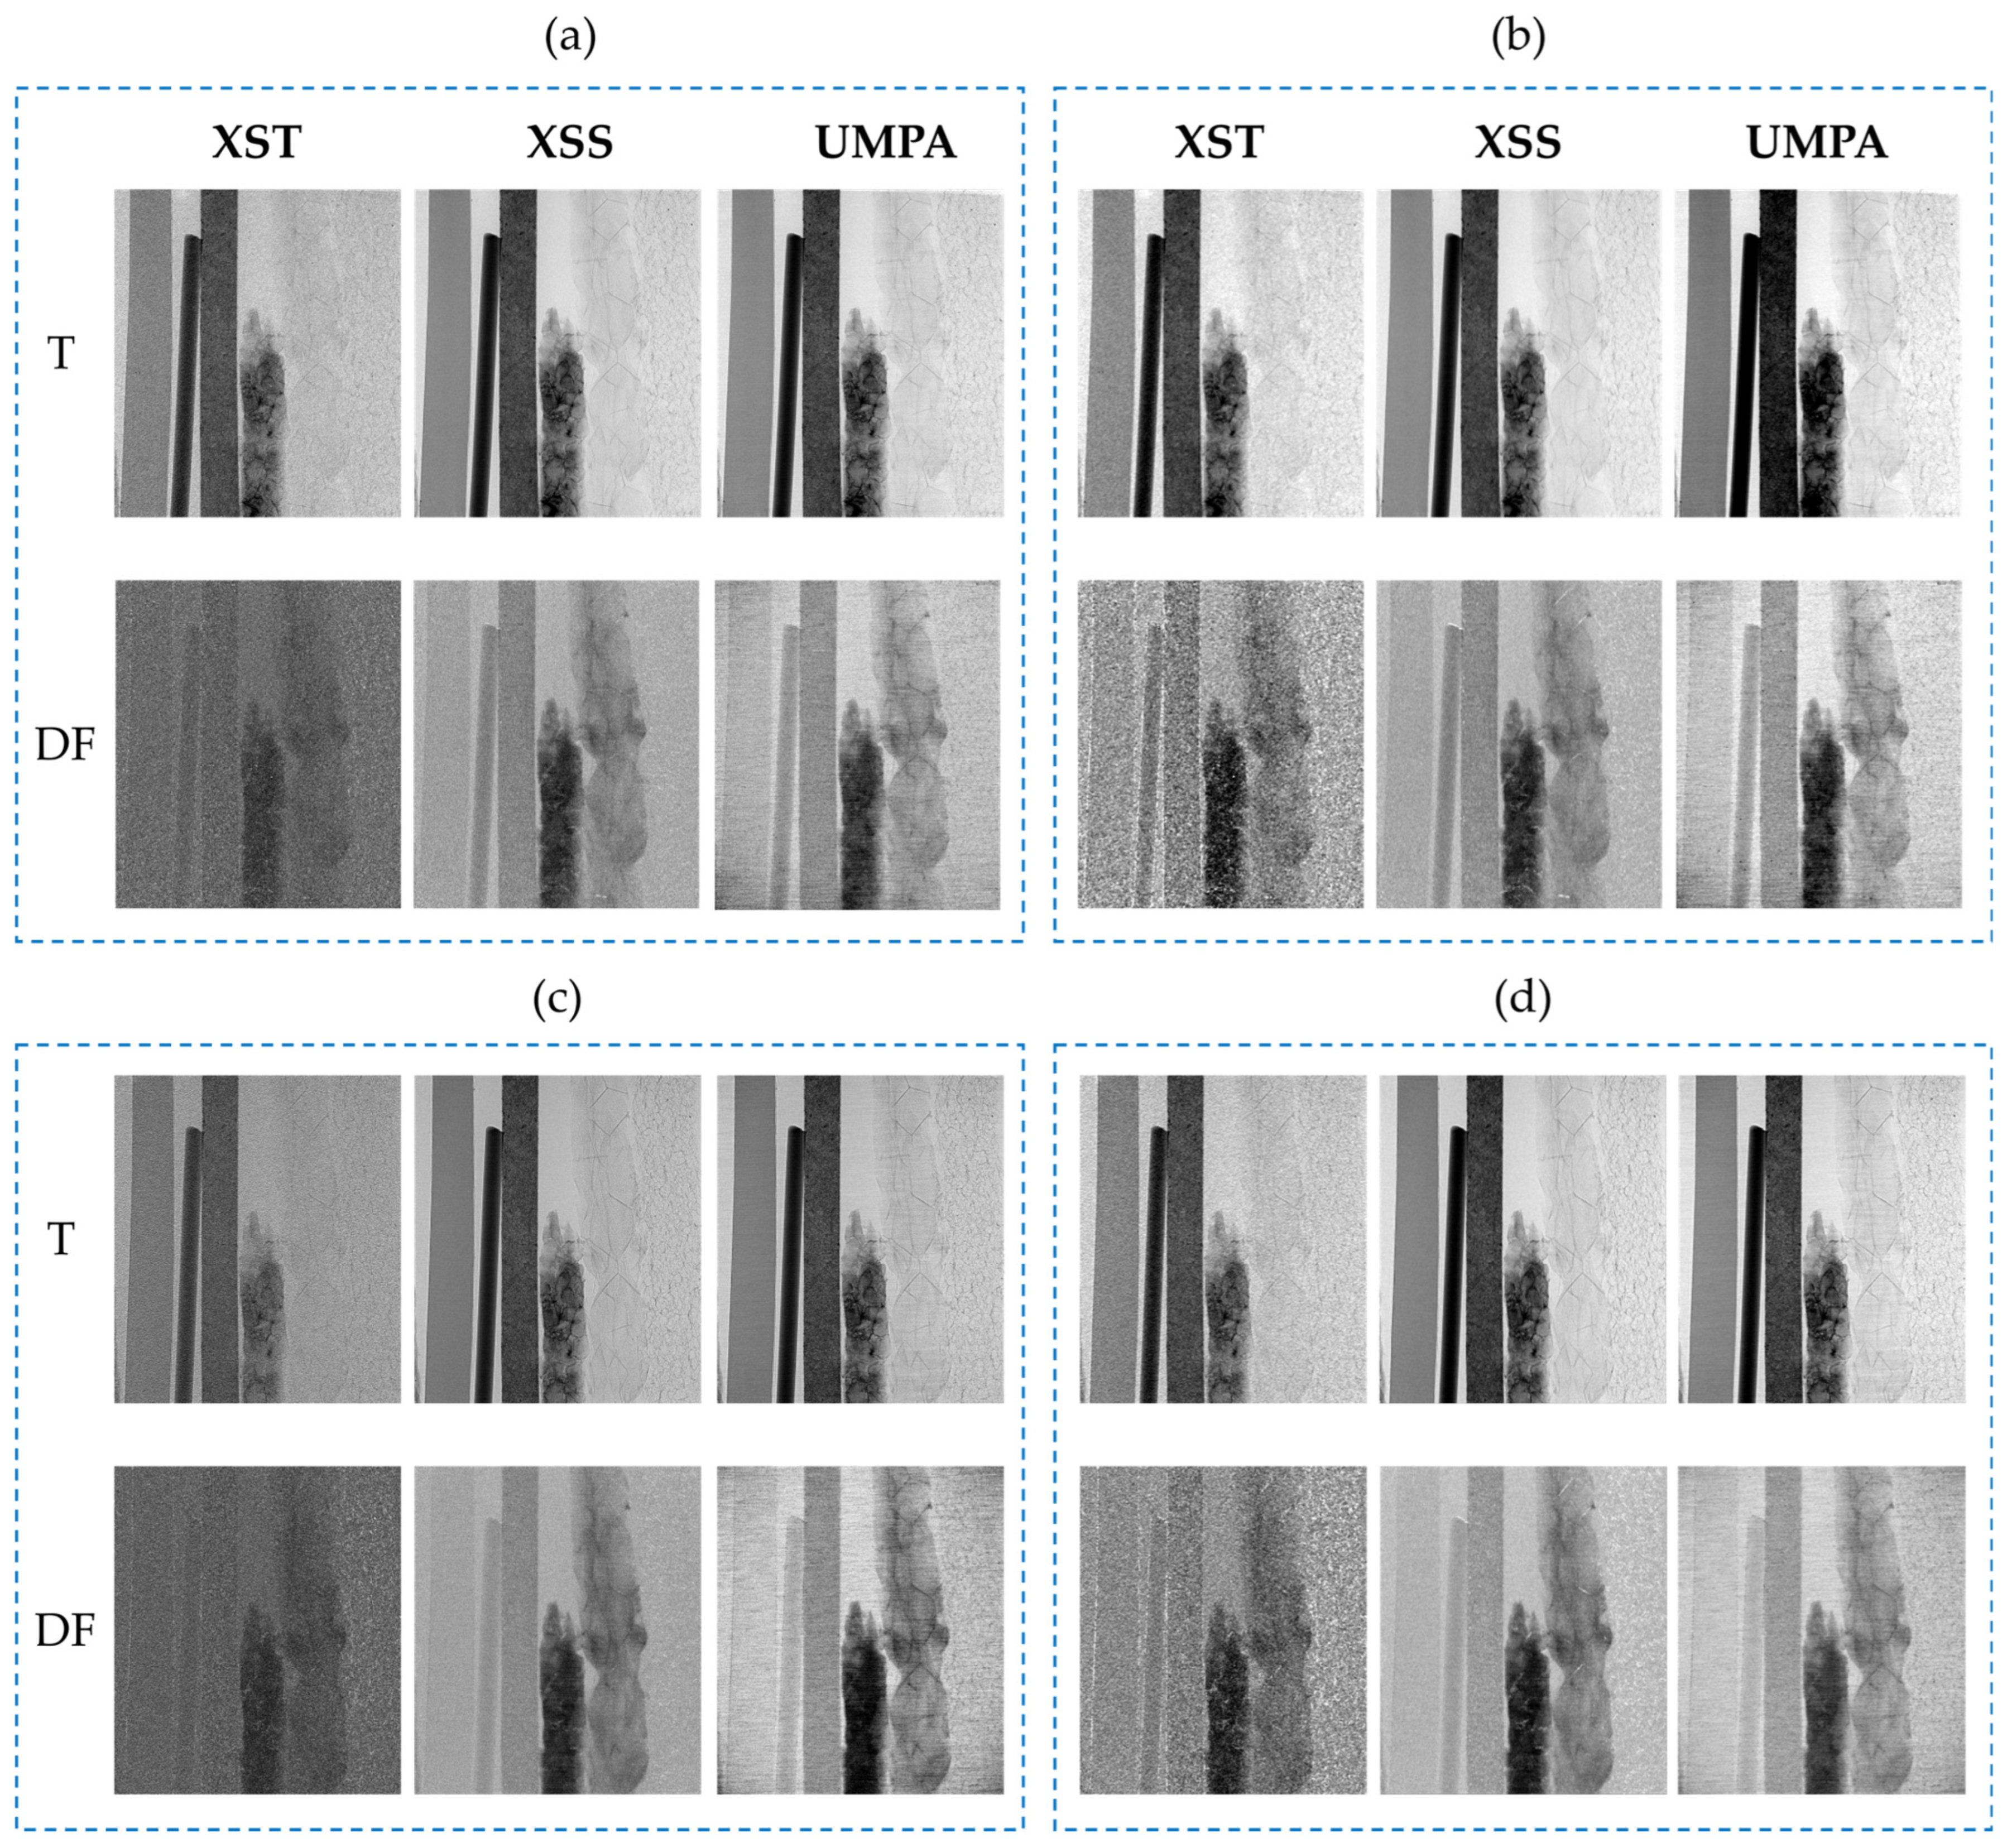
Figure 3 displays the T and DF images recovered by the XST, XSS and UMPA using analysis window with
M = 5 (
Figure 3a,c) and
M = 11 (
Figure 3b,d). The images in
Figure 3a,b correspond to ODD = 140 mm, while in
Figure 3c,d, the images correspond to ODD = 340 mm. For simplicity, images and data obtained from them will be further referred to as T-XST, T-XSS and T-UMPA for the transmission modality and DF-XST, DF-XSS and DF-UMPA for the dark-field modality. As can be observed, T images, which are related to the materials’ absorption properties, follow the same trend as the BF images. In DF images, materials 4 and 5 (cork and expanded polystyrene) are well depicted with all the recovery methods, analysis windows and ODD. It can be seen that the single-shot method produces noisier T and DF images than the scanning methods. The images exhibit similar characteristics for both ODDs; however, they are noisier for ODD = 340 mm. The increase in the size of the analysis window reduces image noise, as observed when comparing
Figure 3a–d, albeit at the cost of reduced resolution. The dependence of noise on these parameters will be clarified later.
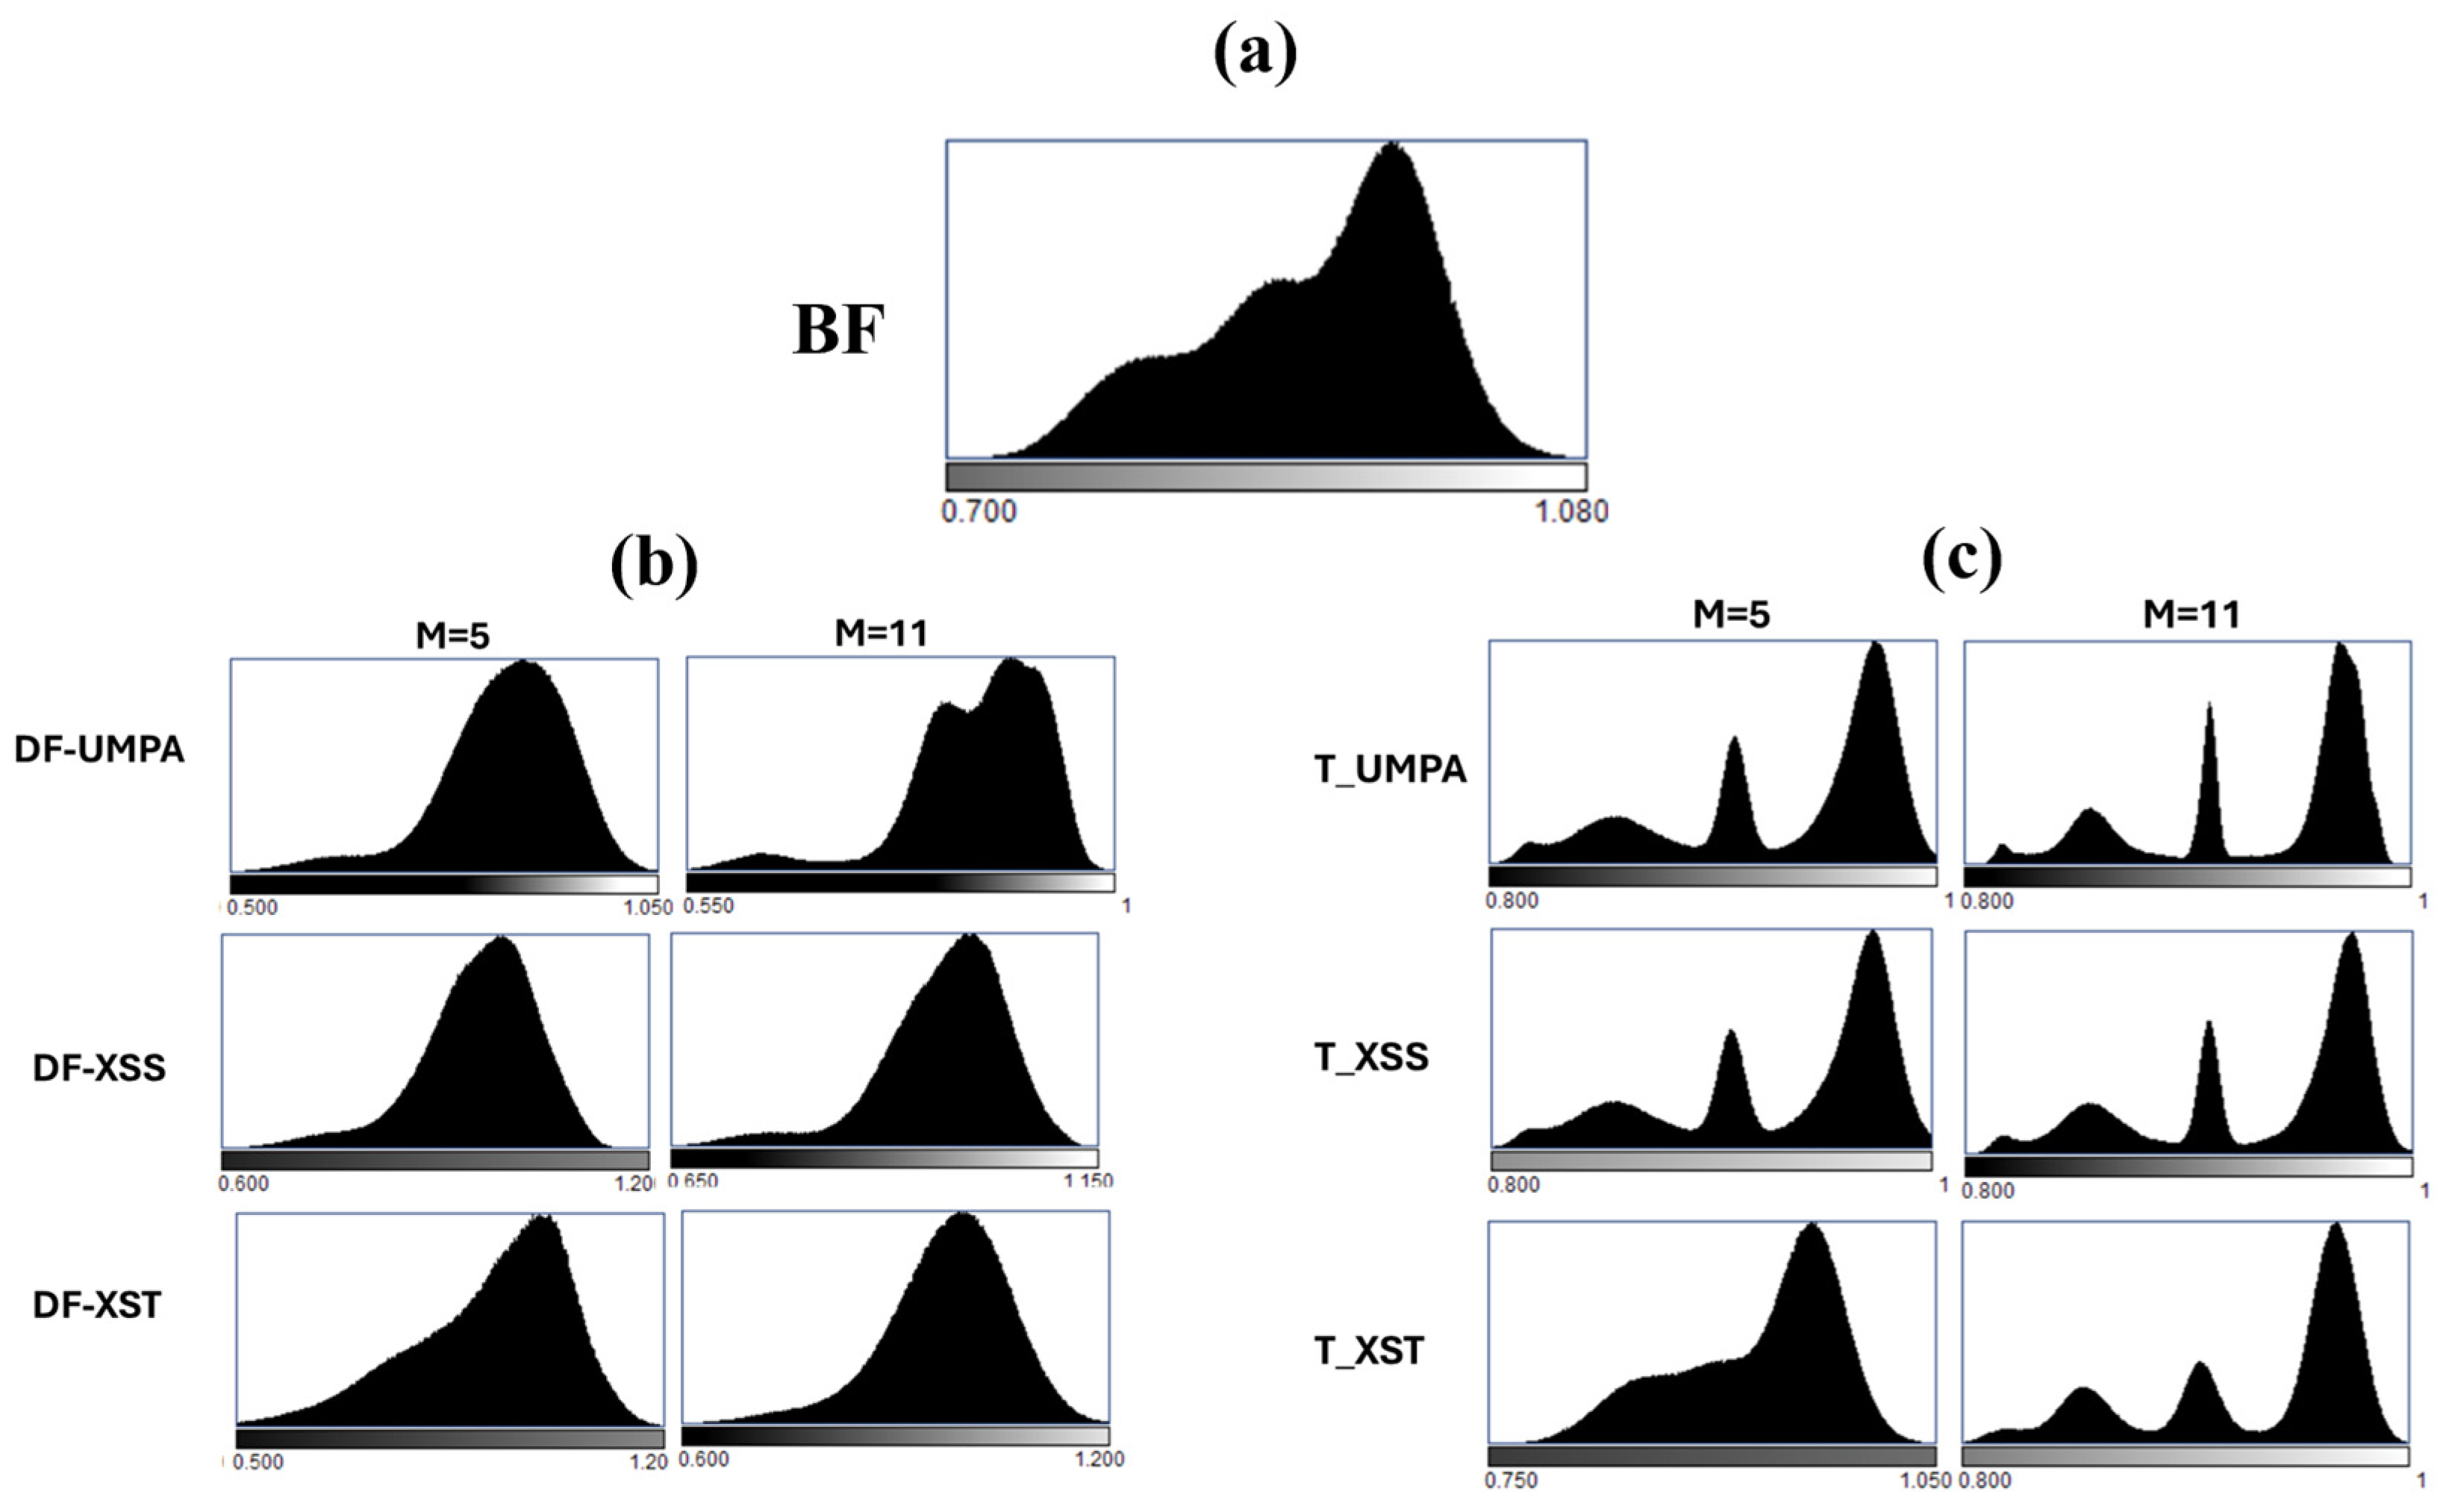
The histograms in
Figure 4 show that T images provide larger separation between pixel values than BF and DF images overall for the scanning methods due to the multiple images involved in the recovery (
Figure 4c). In addition, the histograms clearly demonstrate the superior discrimination capabilities of the techniques using a large analysis window. This is particularly evident for T images across all methods, as well as for DF images in the scanning modalities. The increase in the window is also beneficial for XST. However, this increase has less impact on DF images except for the UMPA technique (
Figure 4b).
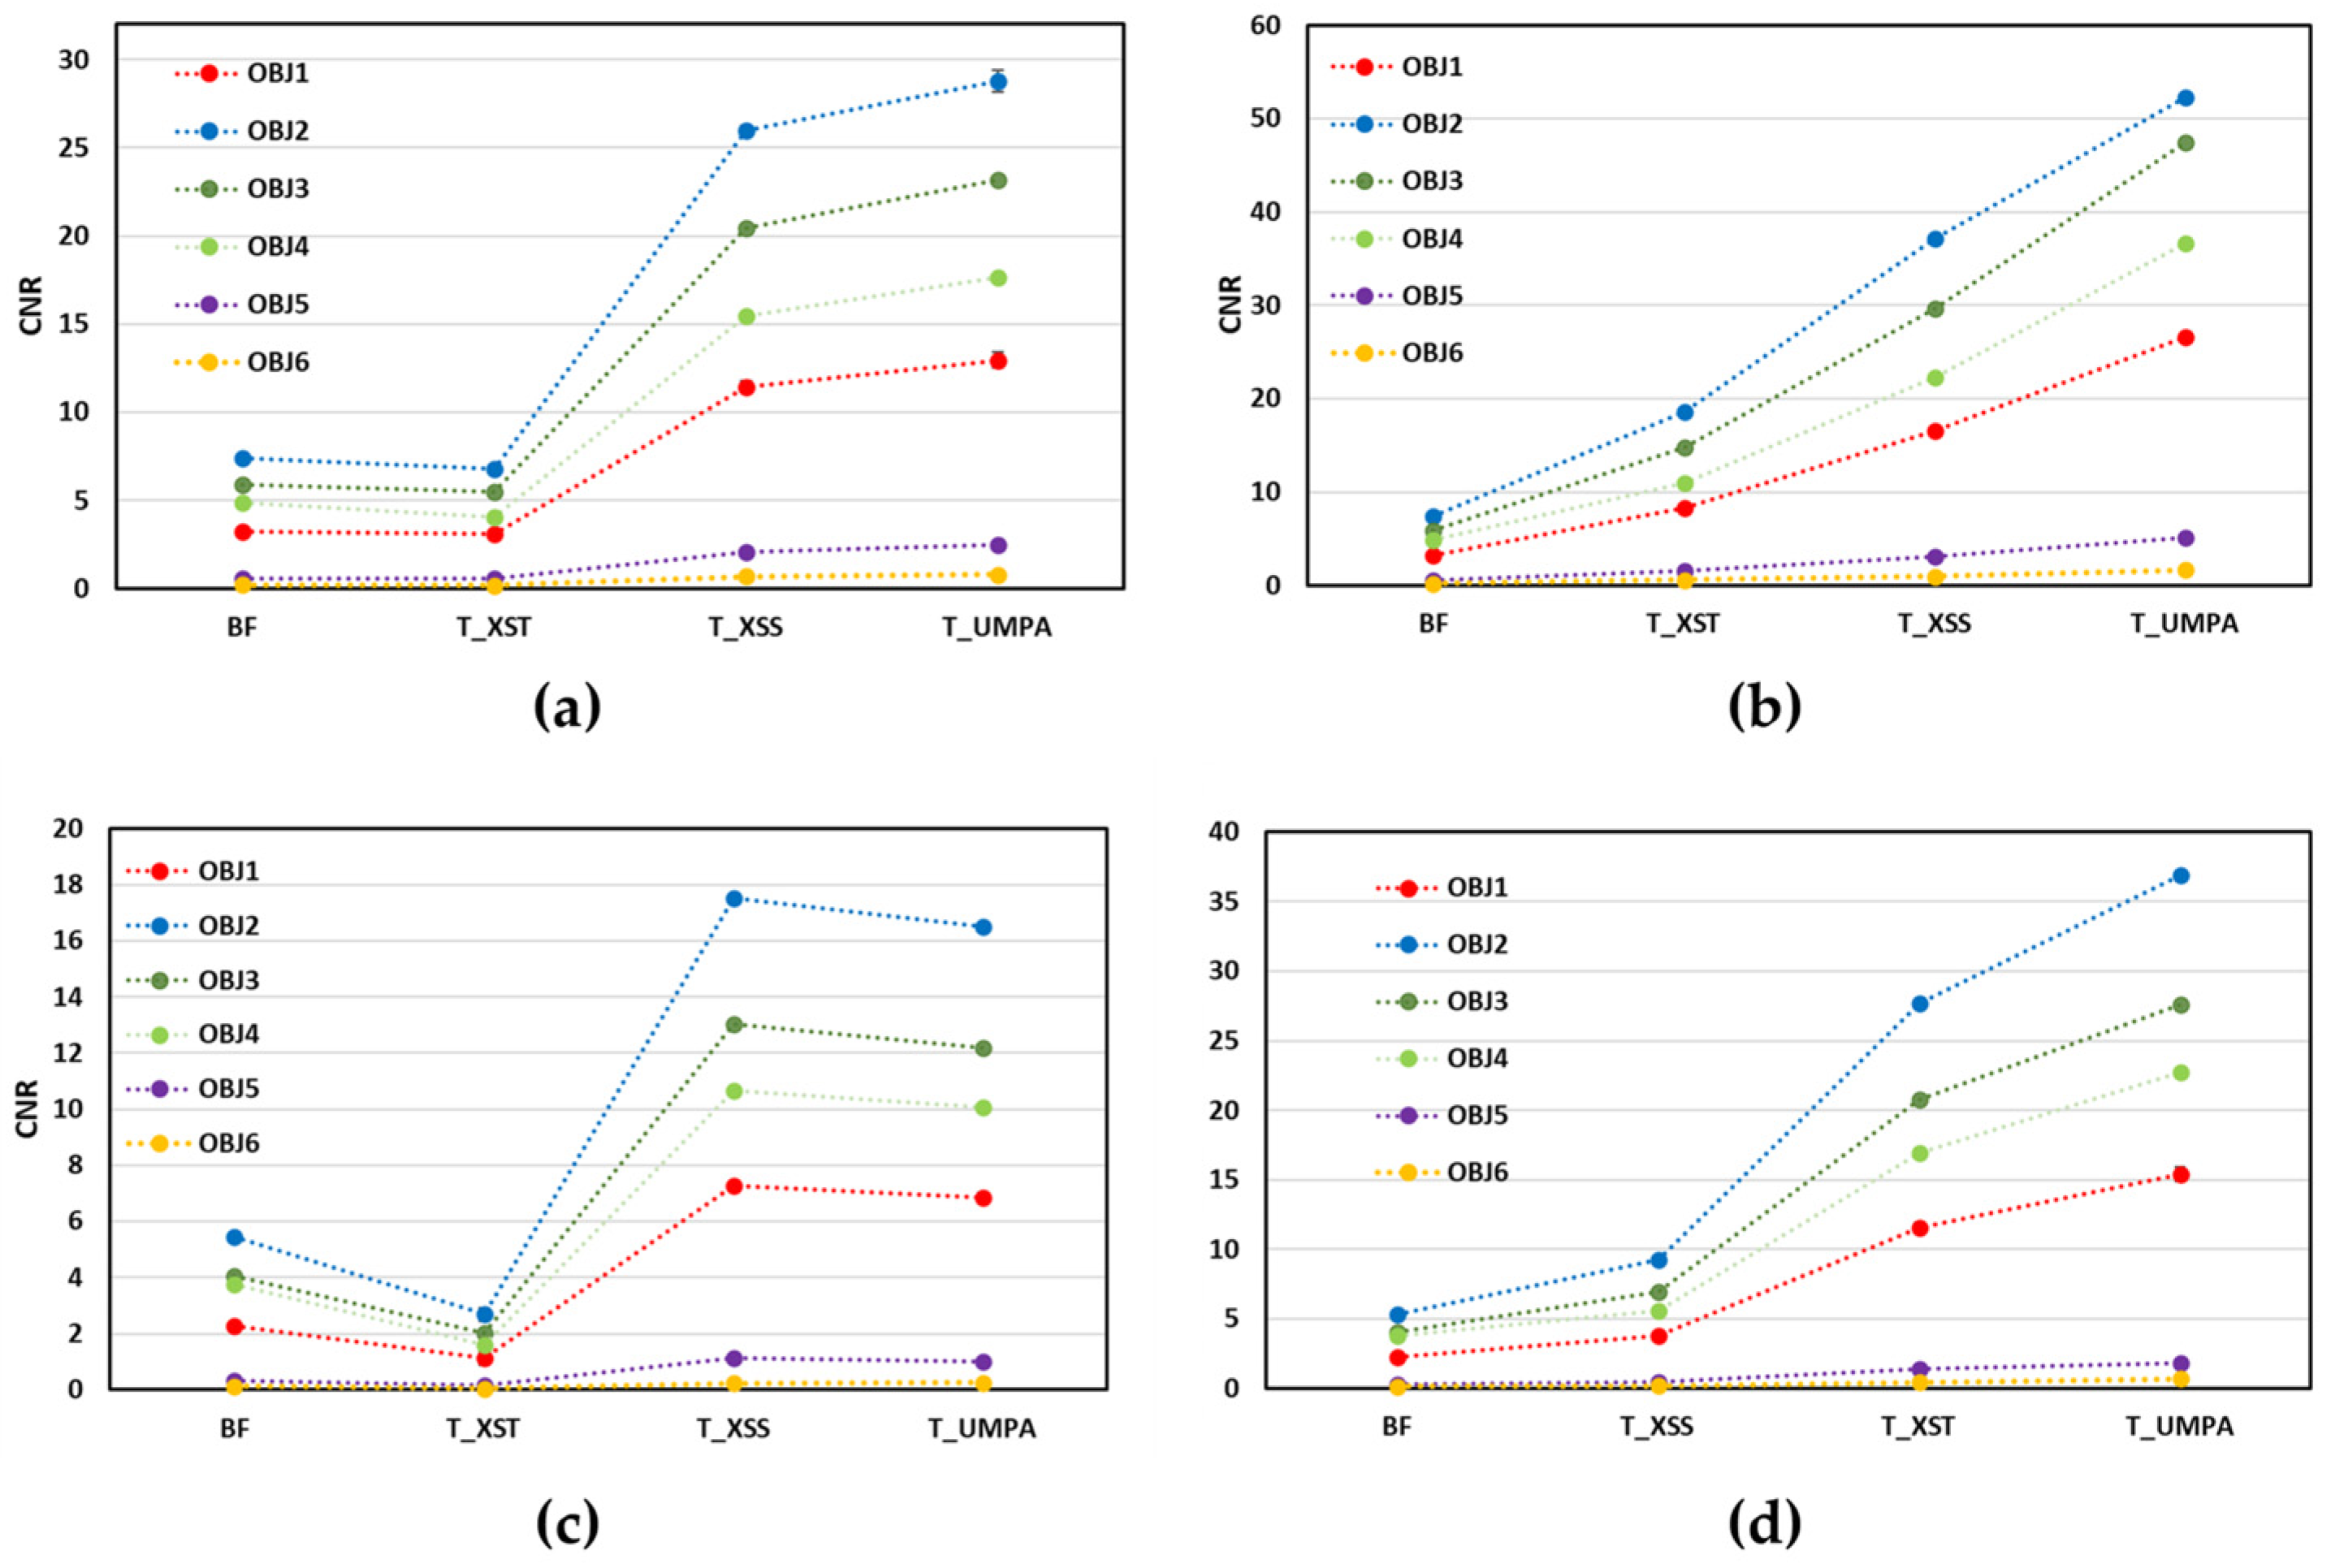
For the quantitative characterization of the different objects in the sample, the average CNR values obtained from BF and T images are plotted versus the applied methods for both considered ODDs and analysis windows in
Figure 5. It is observed that independently of the ODD and
M, the magnitude of the CNR value follows the same trend for the objects in T and BF images. The largest CNR values correspond to nylon, followed by cardboard, cork, plastic, expanded polystyrene and foam for both. The results also show that the scanning methods (XSS and UMPA) clearly demonstrate superior material discrimination capabilities for T images for both considered ODDs and
M. It is worth underlining that the CNRs in T-XSS and T-UMPA images are significantly larger than in T-XST and BF images. For all materials, the CNR values of the BF and T images for ODD = 340 mm are about twice smaller than the corresponding values obtained for ODD = 140 mm. The CNR significantly increases with
M.
To explain the CNR behaviour we assume, as in reference [
22], that the noise in T and DF images principally depends on the noise of raw data. We found that the CNR of T and DF images varies depending on the recovery method employed and the ODD. Specifically, the CNR of T images obtained via the single-shot method is comparable to that of BF images, whereas it is approximately four times higher for T images recovered using scanning methods. In this case, the noise is lower as more images (more photons) are used to recover the T images. Scanning methods utilize
N = 15 images of the sample, which explains the approximately
N1/2 times higher CNR compared to the XST and BF images. On the other hand, as ODD, and therefore magnification, increases, the X-ray fluence is distributed over a larger area and the CNR decreases approximately as SDD
−2 (where SDD is the source–detector distance), which we approximately observe in
Figure 5a–d. The CNRs of the T images obtained using a larger analysis window are almost twice as high and thus correlate with the ratio of the window sizes (11/5), which is approximately twice as high (see
Figure 5a–d).
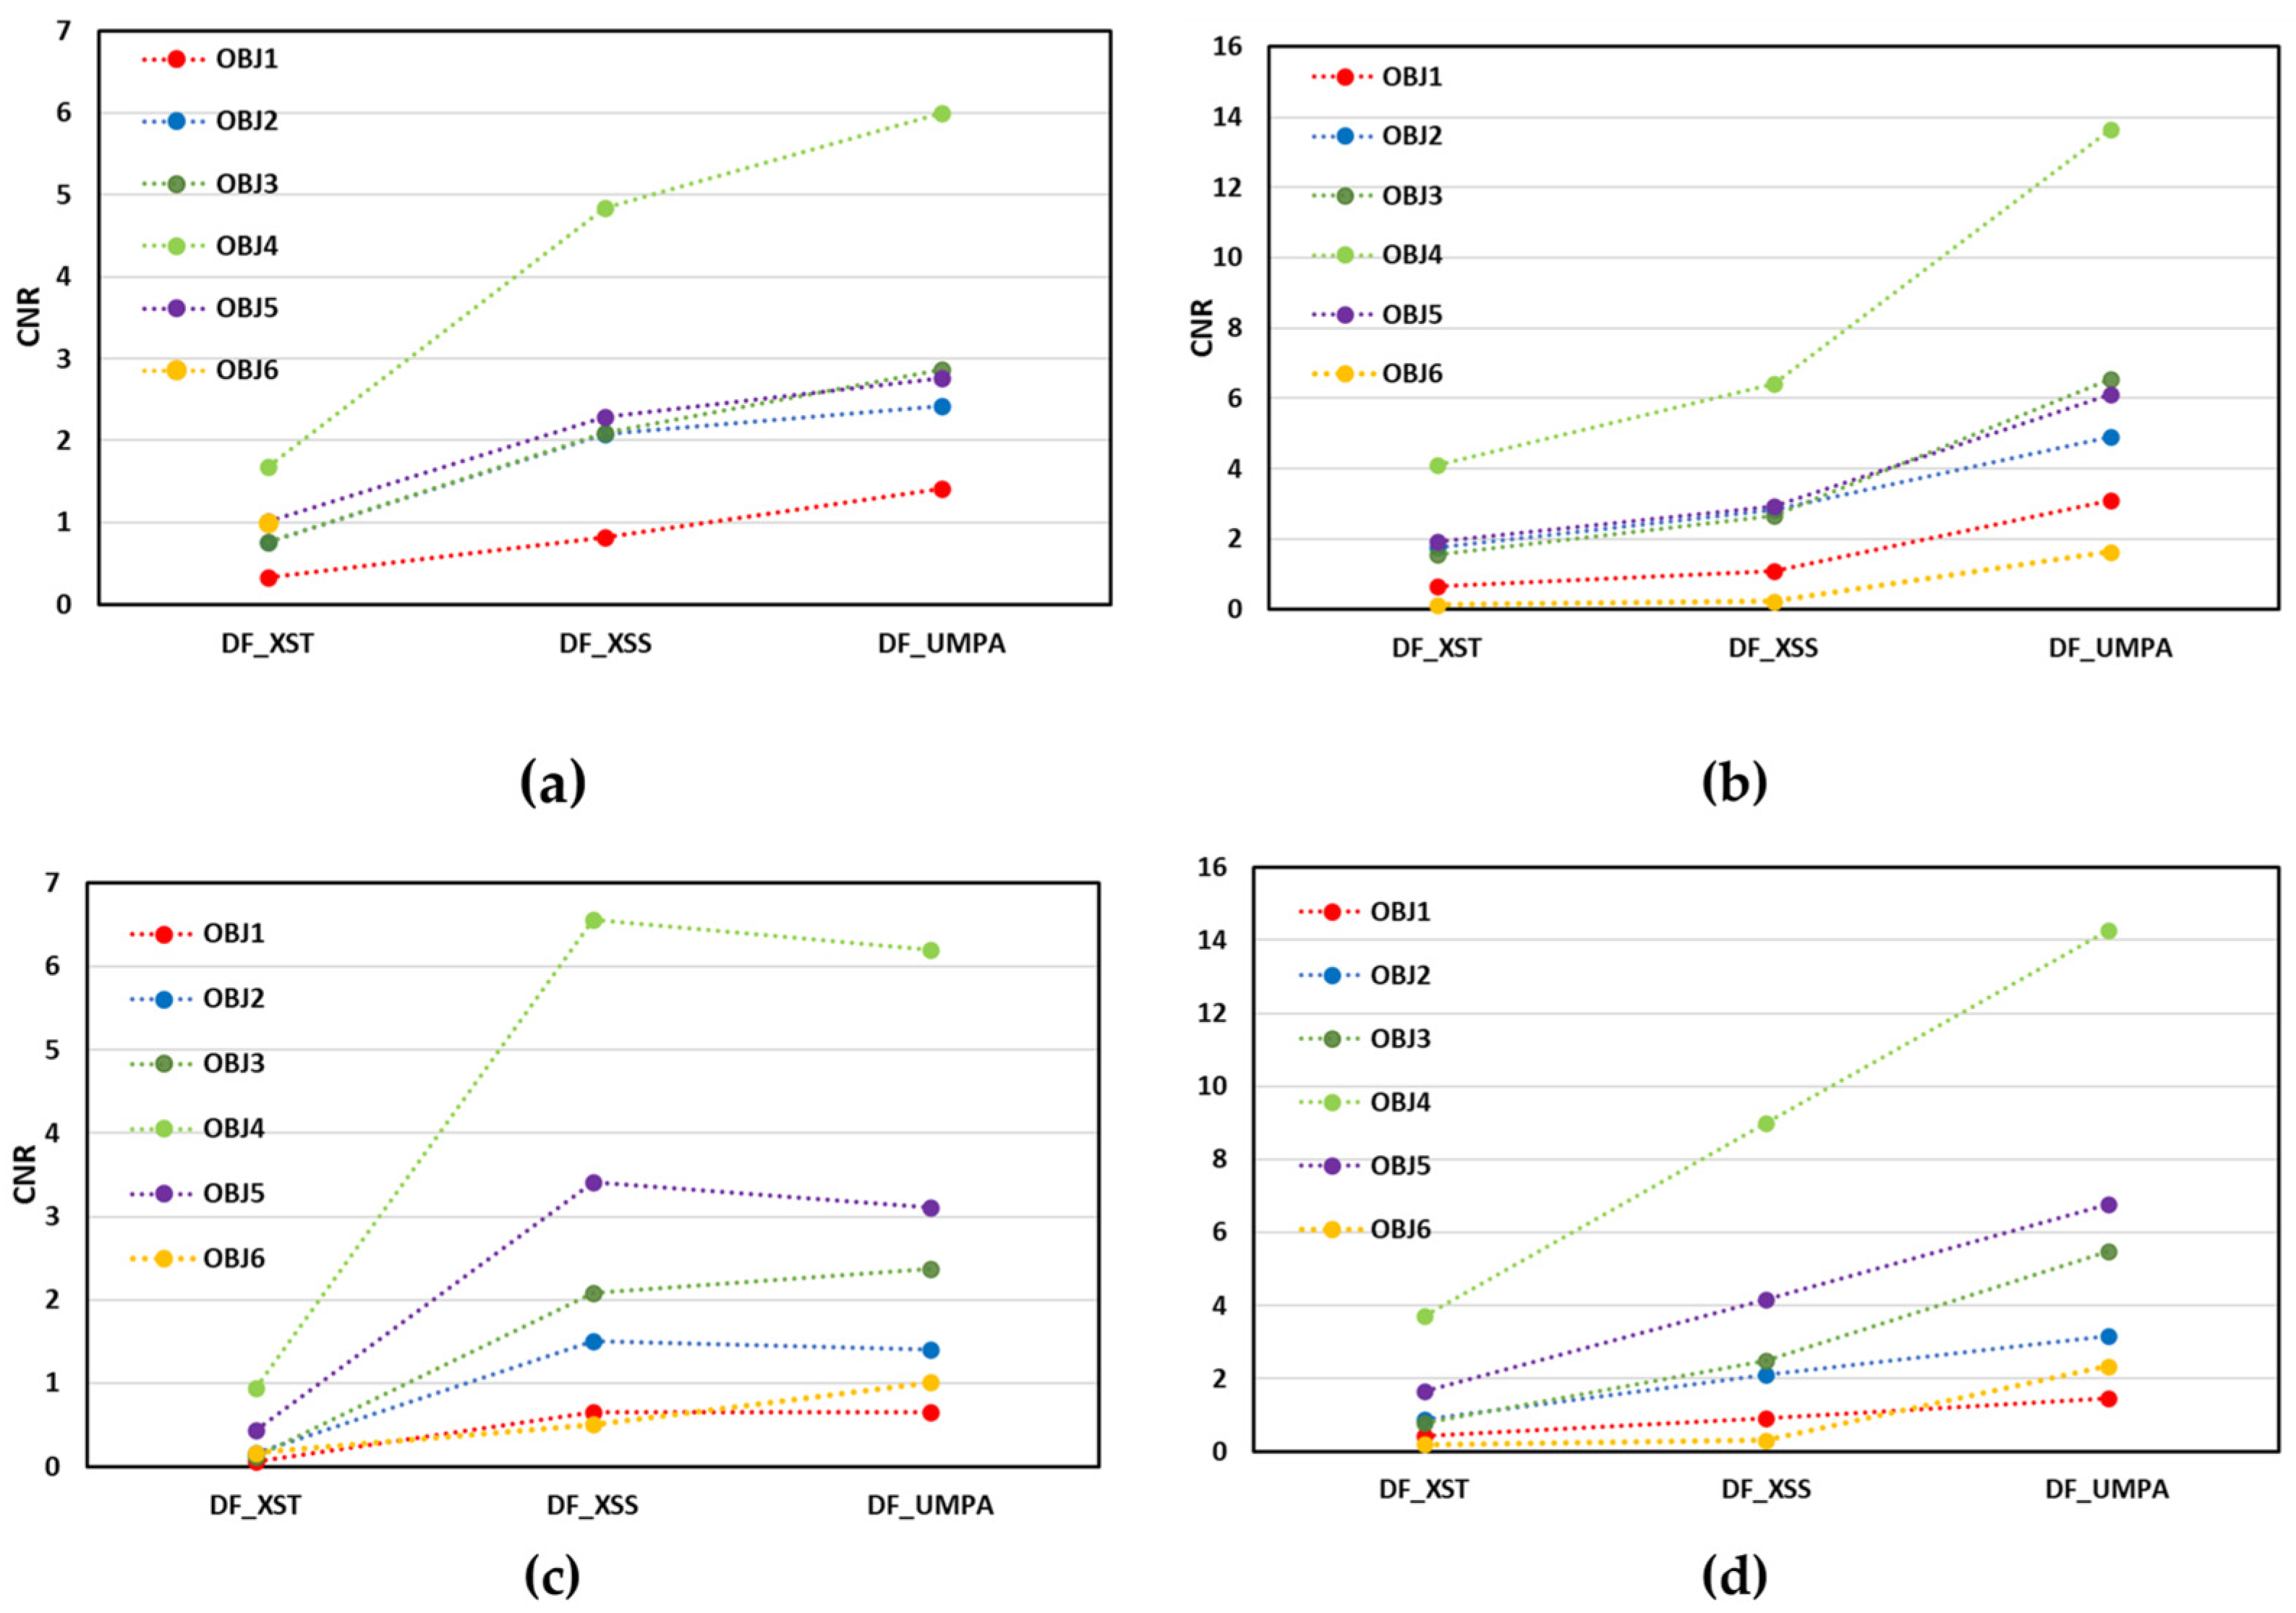
CNR values for the DF images presented in
Figure 6 follow a different order than for the T images regarding their magnitude with lower values (see ordinate axis) due to the higher image noise (about 10% higher
). DF images obtained by scanning methods present larger CNR values, as do T images. The largest CNR values in DF images correspond to cork (object 4) in all cases and the smallest ones to plastic (object 1) and foam (object 6). However, its variation with the ODD remains insignificant with a slight increase with ODD for low attenuating objects (5 and 6) and decrease for the other ones (like objects 1 and 2). We attribute this fact to the increase in the noise and to the decrease in the DF signal with the distance, as demonstrated in [
18]. This decrease in the DF signal is material-dependent, providing different CNR behaviour with the ODD. While the scanning methods demonstrate the same CNR tendency, the values of the CNR for XSS and UMPA are slightly different, with better results for the UMPA method for
M = 11.
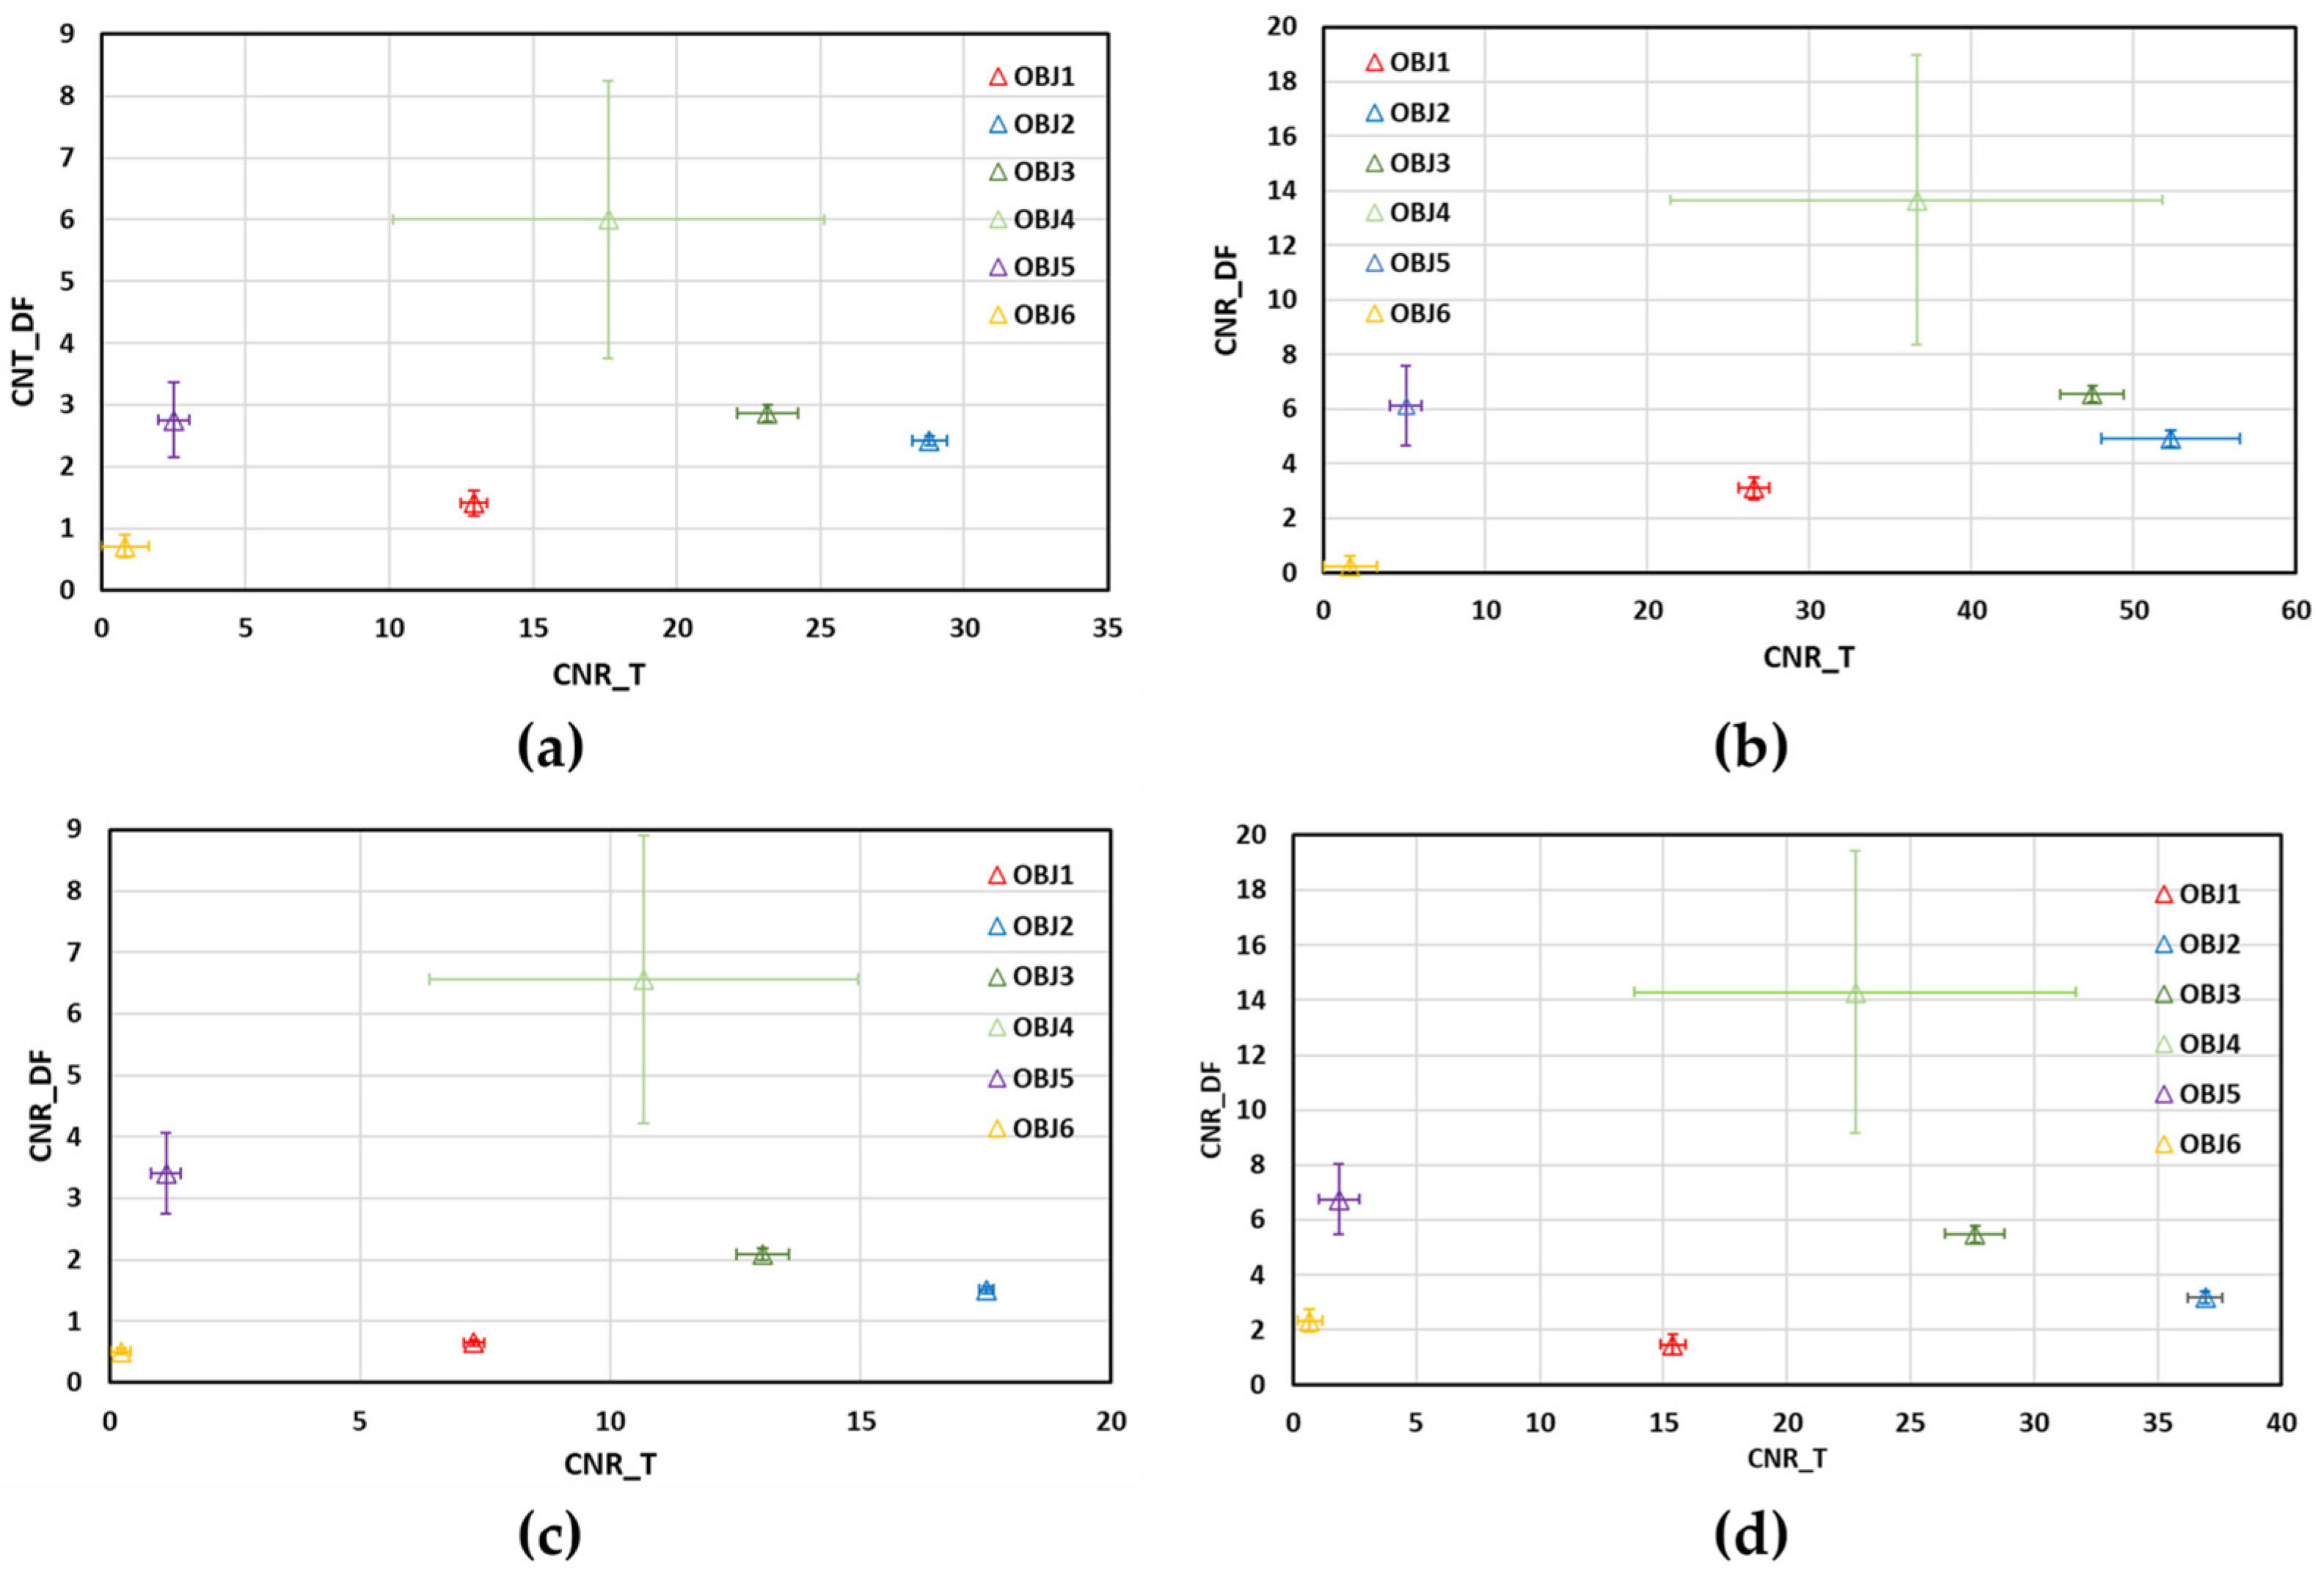
Let us now analyze the uncertainties associated with the CNR estimations for the more reliable scanning method: UMPA.
Figure 7 shows the plots of CNR values of DF images versus those of T images for the two different distances, (a,b) ODD = 140 mm and (c,d) ODD = 340 mm, and analysis windows, (a,c)
M = 5 and (b,d)
M = 11. For both distances, the CNRs of objects 3 and 4 in the DF images have very different values, in contrast to the corresponding values in the T images, which are very similar, as indicated by the error bars (standard deviation of the CNRs). On the other hand, the T images are crucial for discriminating materials with similar CNRs in the DF images, as is the case for objects 1, 2 and 3. In the case of the less attenuating objects (5 and 6), a difference in CNRs is observed for both distances, which is greater in the DF images than in the T images. Despite these inconsistencies, the discrimination capability of the combination of T and DF images is preserved for both ODDs, as follows from the analysis of the results in
Figure 7.
Statistical analysis shows that there are significant differences between the CNR values of the different materials in the T images. In the DF images, the differences between the CNRs of objects 4 and 6 and the rest of the objects are statistically significant.
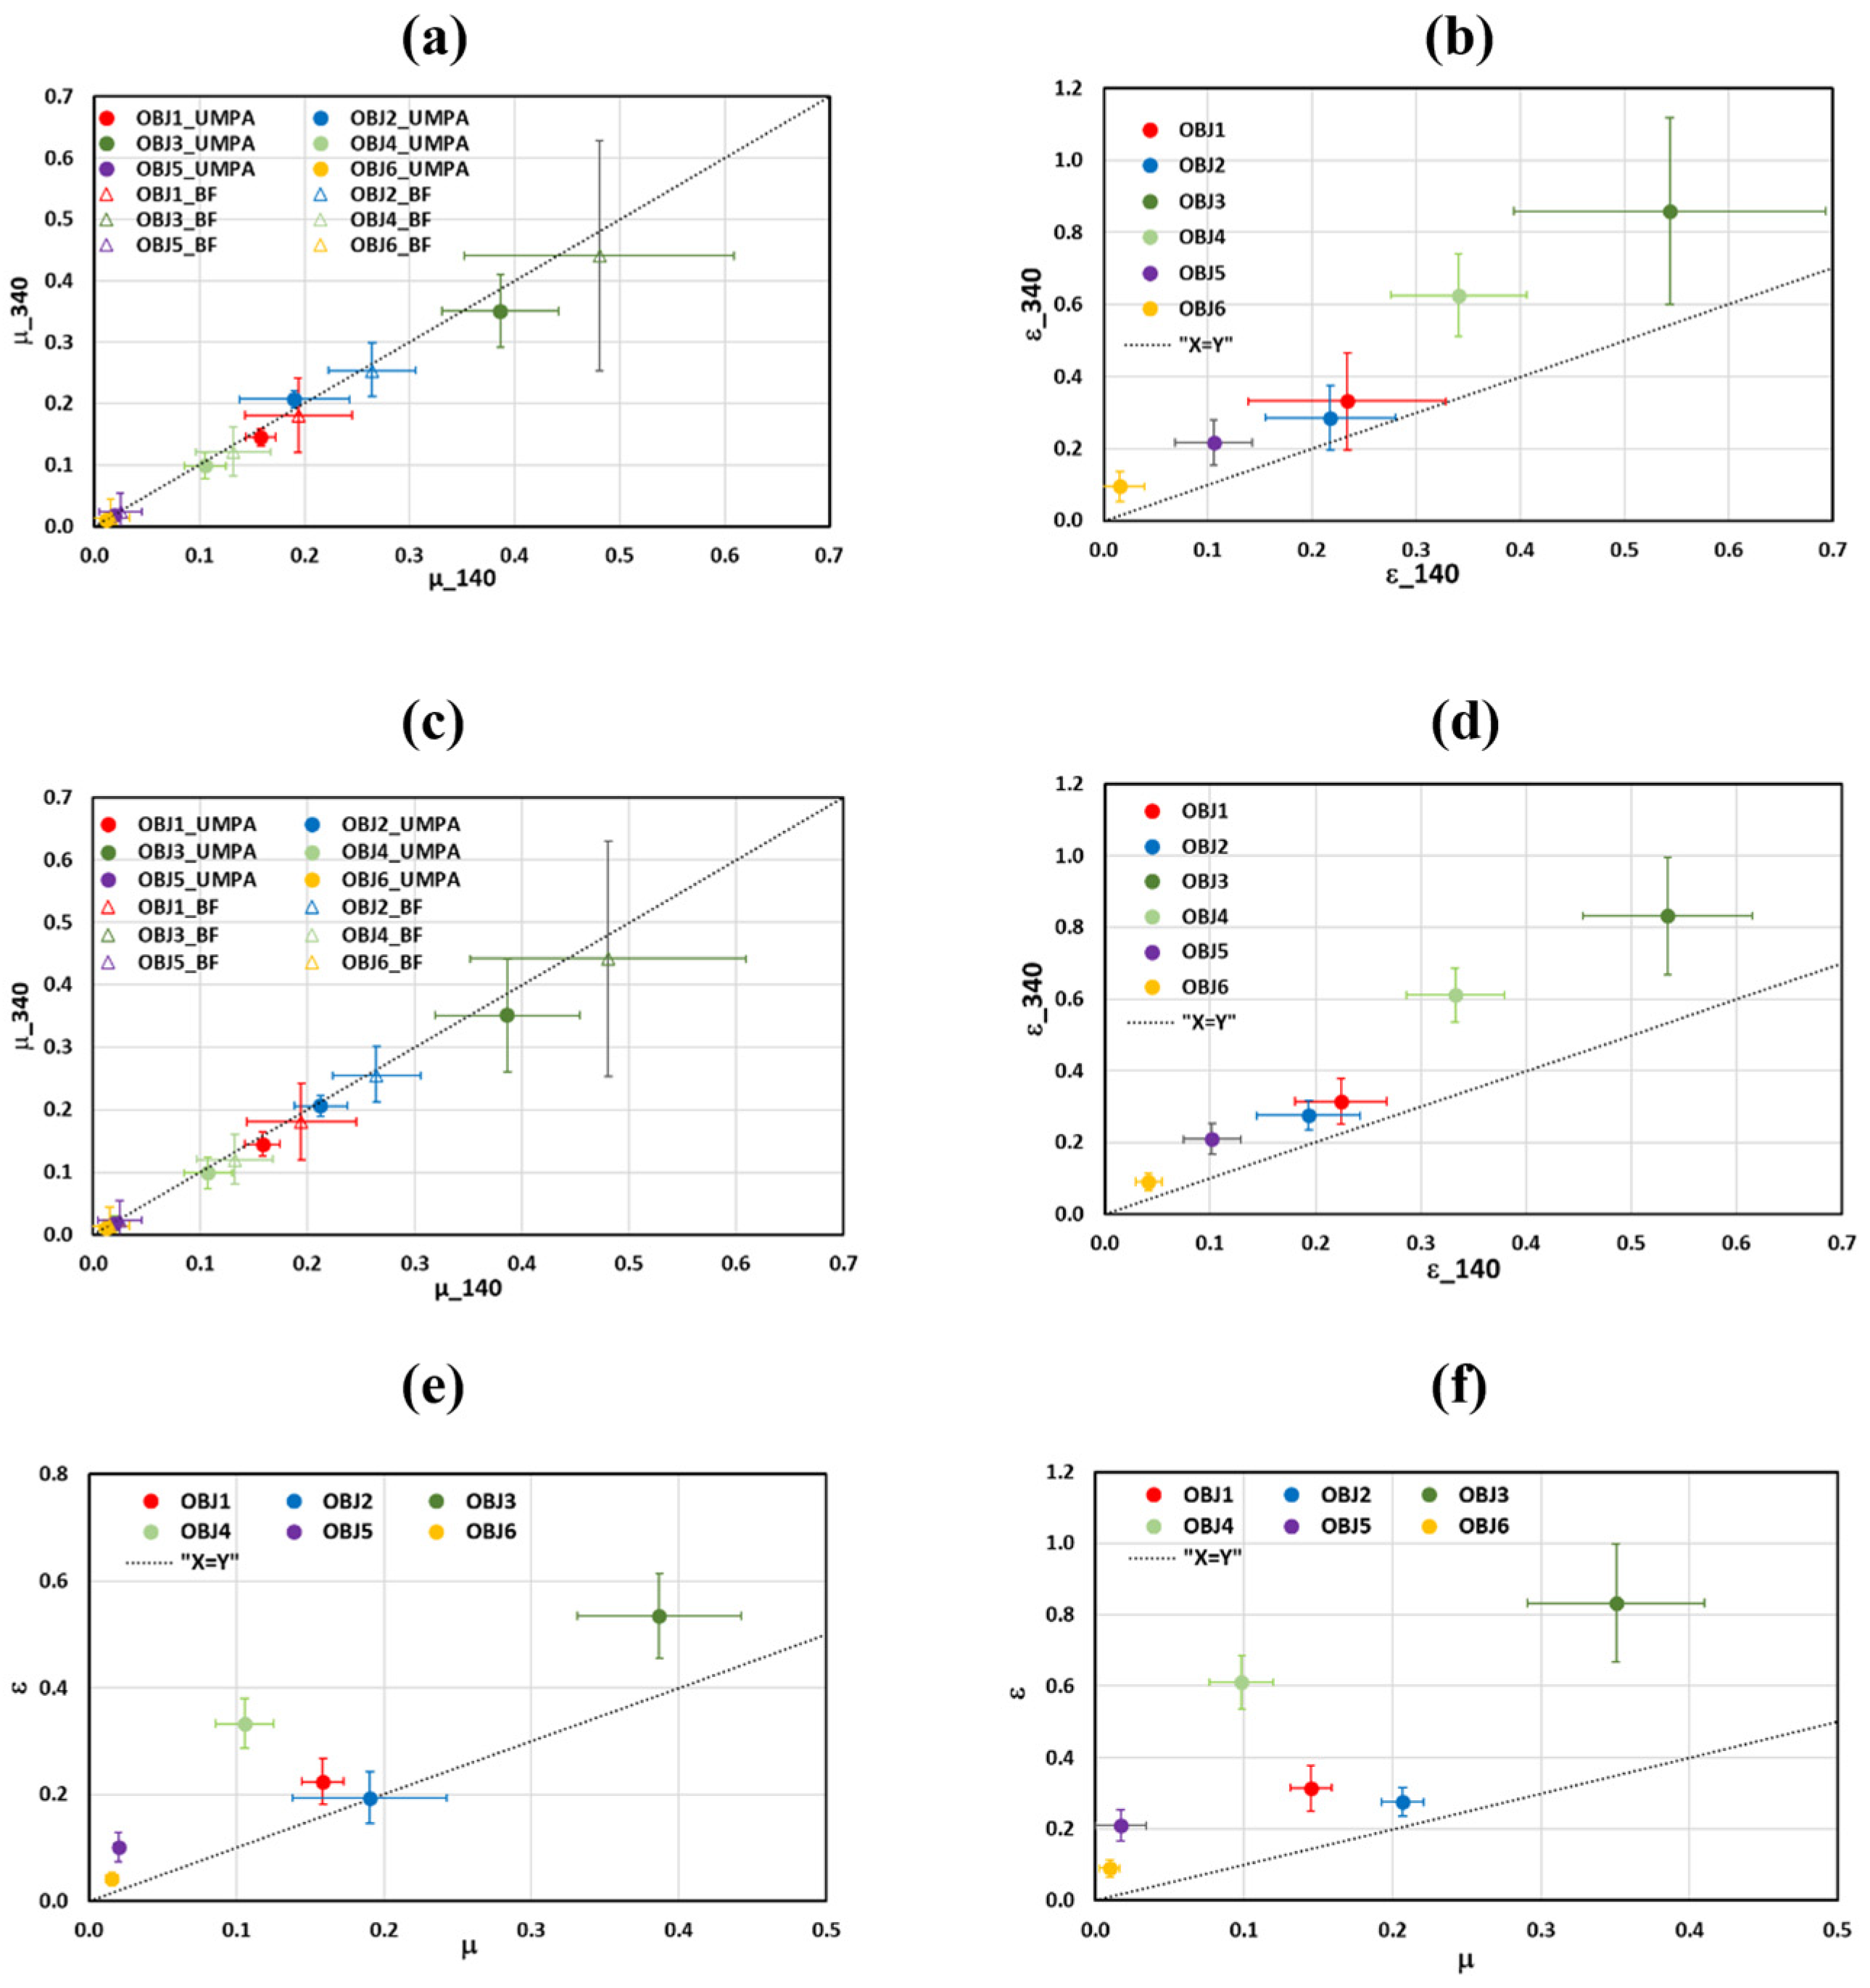
The linear absorption µ and diffusion ε coefficients are additional parameters that enable us to compare the effectiveness of the methods considered for material analysis.
Figure 8a,c show that the values of μ are well differentiated for all objects, with the exception of objects 5 and 6. Additionally, the values for each object show a high degree of consistency across all considered methods, differing by less than 2%. The values of coefficients are independent on the analysis window and slightly dependent on the ODD. Comparing these values with the ones of linear attenuation coefficients calculated from BF images, we found that the latter were always higher for all the objects. This could be attributed to the DF signal that is also encoded into the BF signal. The μ values recovered from the measurements for both distances and analysis windows do not present significant differences.
On the other hand, the diffusion coefficients for the same material show significantly different values depending on the recovery method and the ODD. Upon detailed analysis of the uncertainties of the ε values recovered with each method, we conclude that the UMPA method provides ε values that are well differentiated (as observed in
Figure 8b,d). The diffusion coefficient values are almost independent on the analysis window but significantly increase with the ODD.
Our findings partially corroborate the results of the simulations reported in reference [
18]. These simulations demonstrated that the DF signal decreases with increasing ODD, and this reduction is dependent on the object’s material. Conversely, the T signal remains almost independent of the ODD. Our experimental results further validate that the variations in μ, and therefore the T signal, with ODD are minimal. Additionally, ε increases (DF signal decreases) as ODD increases (see
Figure 8c,d). The variations in ε are indeed influenced by the object’s material.
In
Figure 8e,f, the diffusion coefficient is presented against the attenuation coefficient for M = 11 and for both ODDs. The graphs show more clearly the behaviour of μ and ε with ODD observed in the other figures: a significant increase in ε with distance while the variations in μ remain within the range of uncertainties. Furthermore, the values of ε are significantly higher compared to those of μ, especially for larger ODD values. This facilitates improved material discrimination through the analysis of DF images. However, while the obtained ε values provide better differentiation, they cannot be used as universal material characteristics, unlike μ, which exhibits only small changes with ODD.
4. Conclusions
The analysis of T and DF images obtained through the three speckle-based methods, XST, XSS and UMPA, in a laboratory X-ray setup with a polychromatic microfocus source reveals that these methods offer additional information compared to BF images. The analysis of the histograms of the reconstructed T and DF images, as well as the CNR of the considered objects, demonstrates that the UMPA method is the most reliable recovery method compared to the other two studied speckle–based methods.
For implementation of the recovery methods, two analysis windows with side of
M = 5 and
M = 11 pixels were considered. It was demonstrated that the CNR of T and DF images is almost twice larger for the larger window due to proportional noise reduction. However, the values of the linear absorption (μ) and diffusion coefficients (ε) obtained from T and DF images recovered with UMPA slightly depend on the window size (
Figure 8). This behaviour was found for all the applied methods. These results underline the robustness of the applied methods.
We found that the values of μ obtained from BF images were larger than ones recovered from T images (
Figure 8a,c). On the other words, the BF signal is smaller than the T signal that can be attributed to scattering included in the BF signal.
It is worth mentioning that while the CNR values derived from T images decrease with increasing ODD due to noise, the CNR values obtained from DF images exhibit a more complex behaviour. These values may increase or decrease depending on the specific object. Additionally, we found that the linear diffusion coefficients increase with ODD, due to a reduction in the DF signal. This phenomenon can be explained by considering the recent study reported in [
18], where numerical simulations of T and DF signals were conducted. The study demonstrated that the T signal remains unchanged, whereas the DF signal decreases with increasing ODD. Notably, the reduction in the DF signal was found to be material-dependent. Our findings align with these results. Specifically, the linear absorption coefficients are independent of ODD, while the linear diffusion coefficients increase with ODD in a material-dependent manner. Furthermore, the increase in noise associated with higher ODD can offset the decrease in the DF signal in terms of CNR for certain objects, which is consistent with our observations.
We conclude that linear absorption coefficients are more suitable for quantitative material characterization compared to linear diffusion coefficients, which are influenced by ODD. However, this does not diminish the usefulness of DF imaging. DF imaging enables the discrimination of materials with similar absorption properties through the comparison of CNR or ε values obtained at the same ODD. That said, determining an optimal ODD for this purpose is challenging due to the dependence of the DF signal on ODD, the materials being considered and the higher noise for larger ODD values.
We believe that our findings pave the way for wider applications of laboratory X-ray microfocus setups for material analysis.


