

Associations Between Physiological Determinants and GNSS-Derived Technical Characteristics in Cross-Country Roller Skiing

 , ,
, ,
Abstract
1. Introduction
2. Materials and Methods
2.1. Participants
2.2. Overall Design
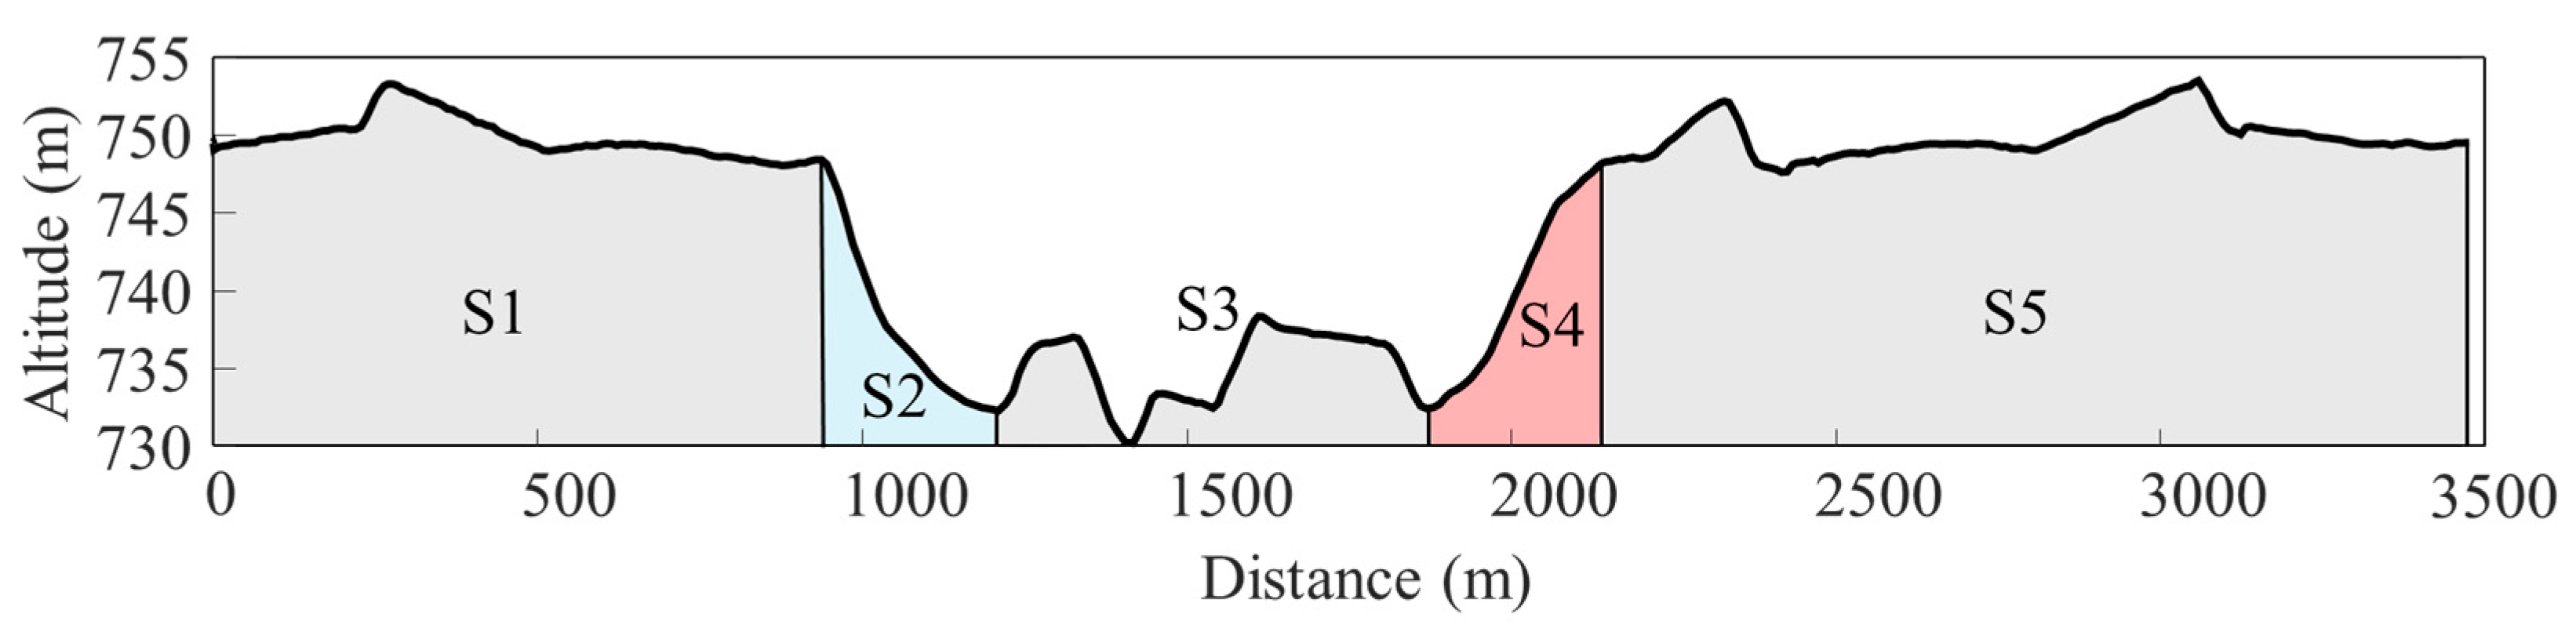
2.3. Timed Race
2.4. Sub−Technique Classification and Technical Characteristics
2.5. Laboratory Tests
2.6. Data Analysis
3. Results
3.1. The Association Between Race Time and Physiological Parameters
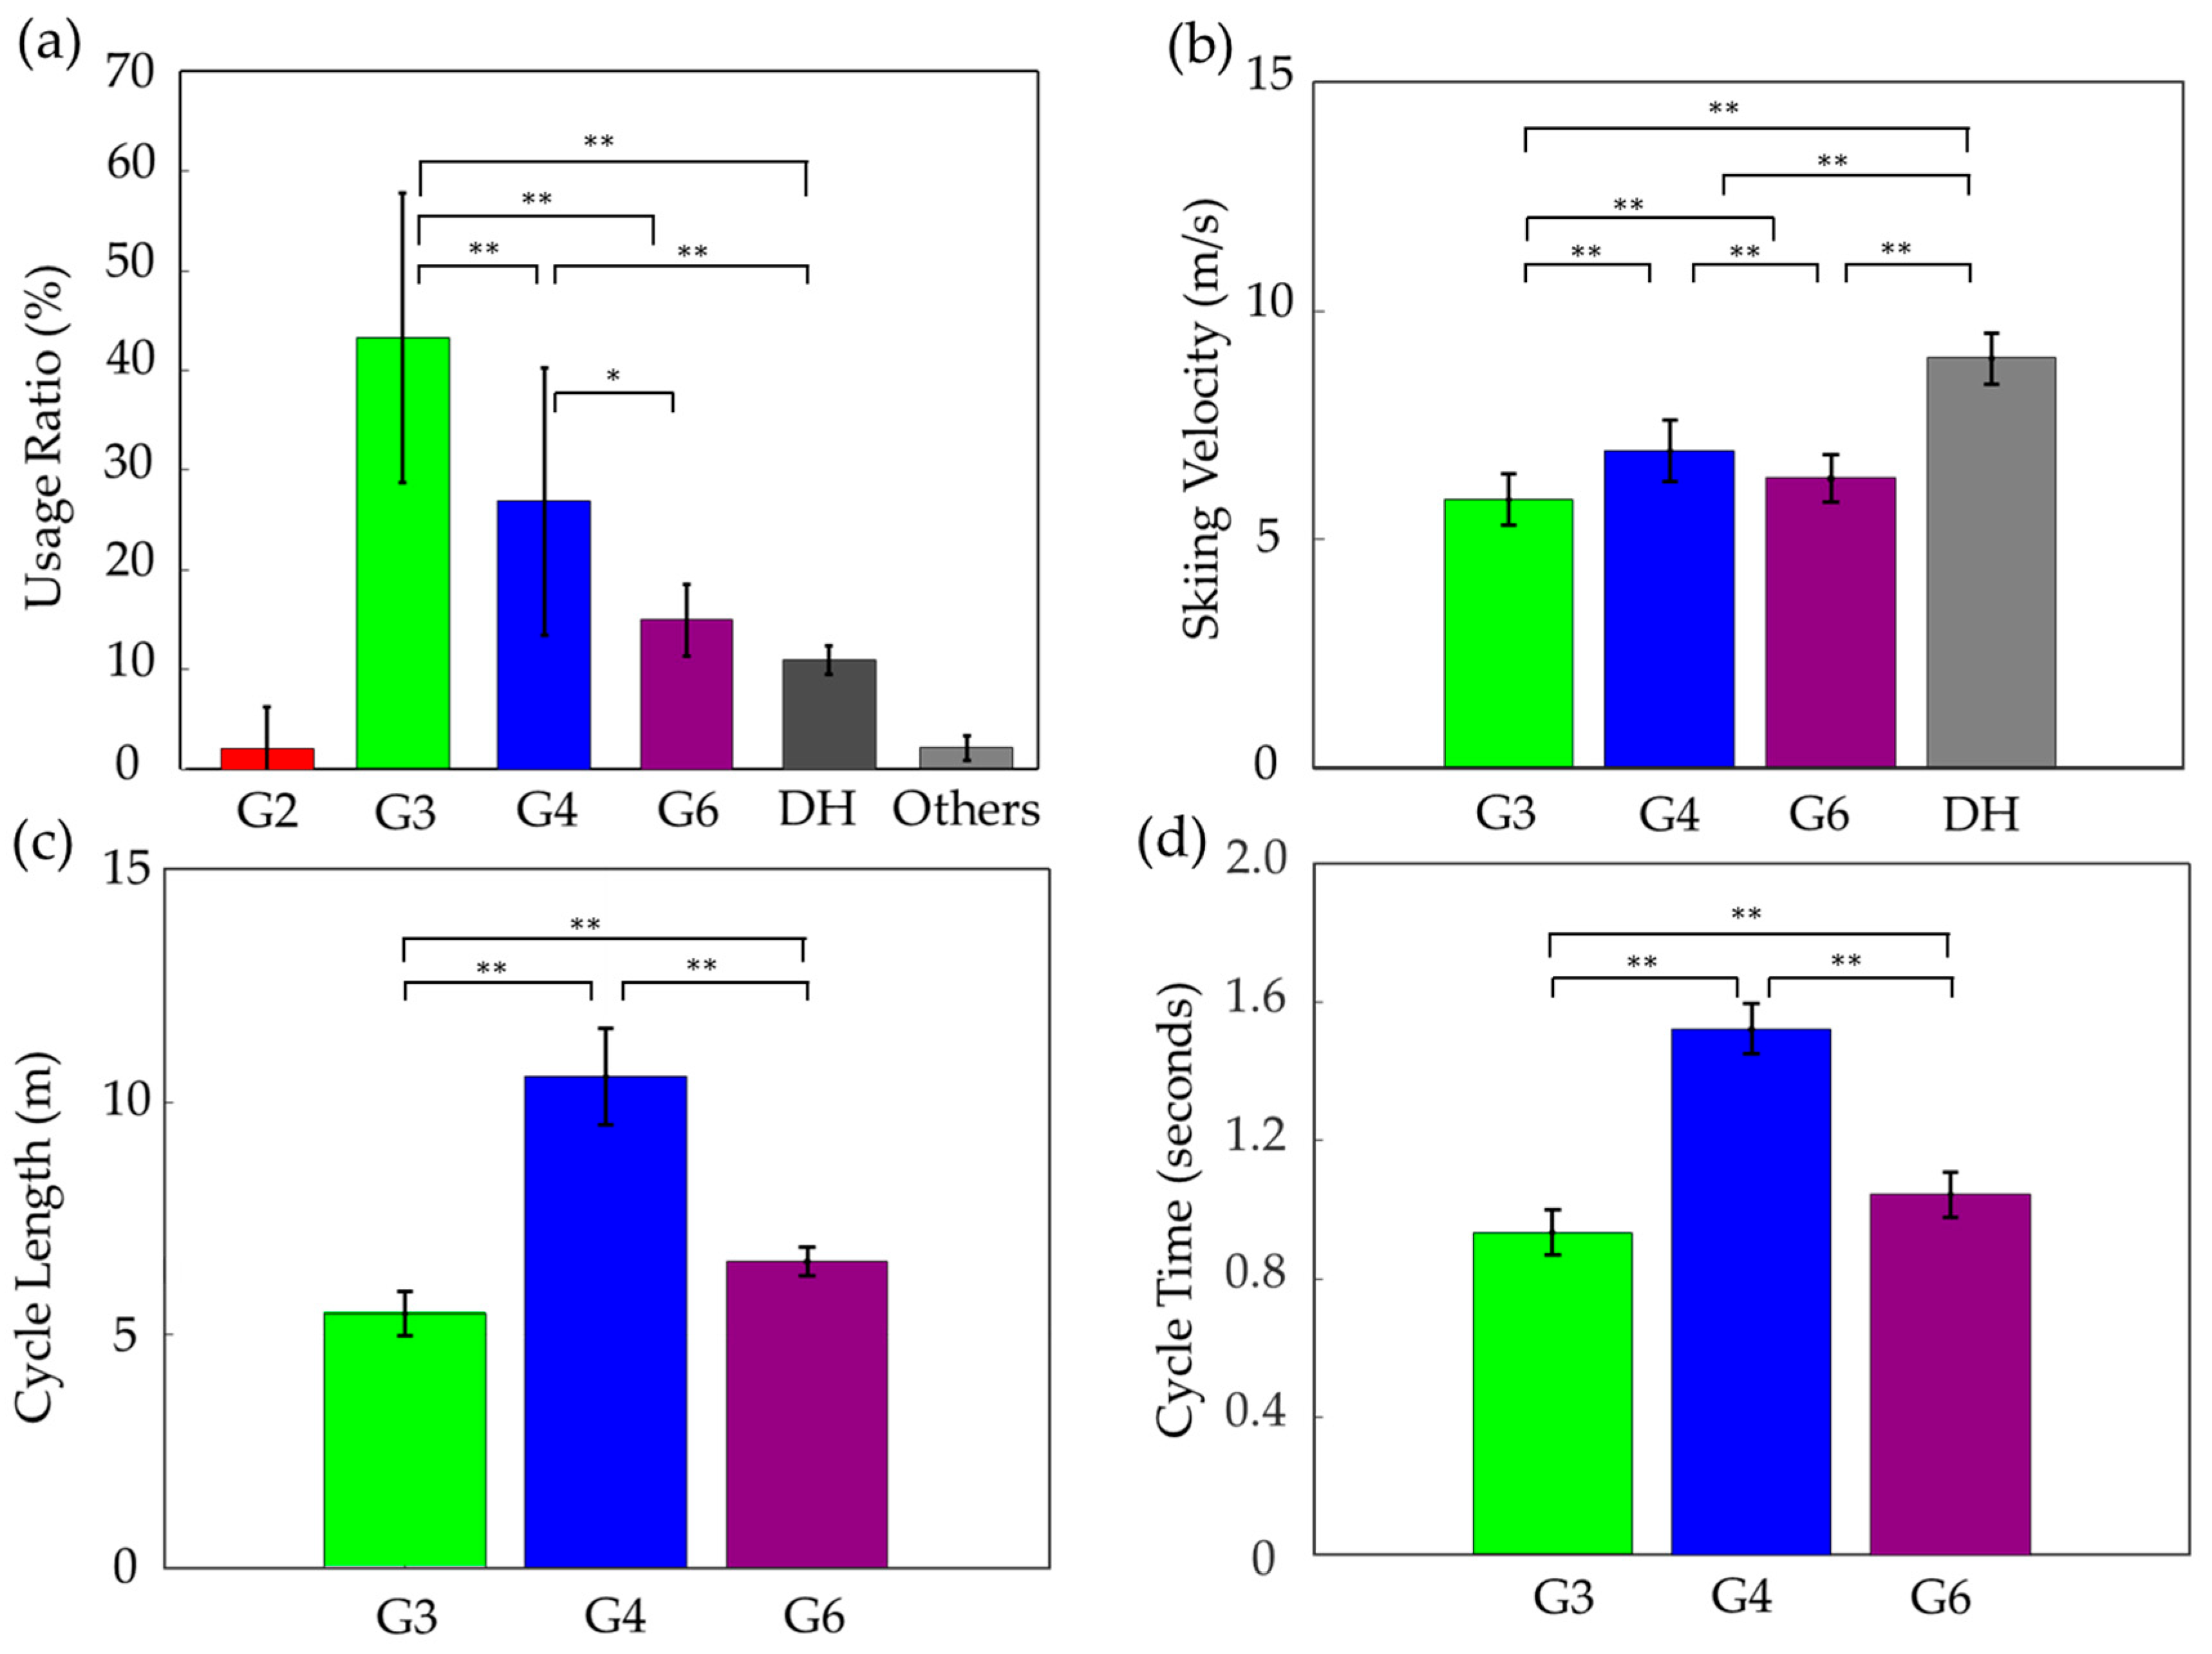
3.2. Technical Characteristics During the Roller Ski Timed Race
3.3. The Associations Between Technical Characteristics and Physiological Parameters
3.4. The Association Between G3 Technical Characteristics and Physiological Parameters Across Terrain
4. Discussion
5. Conclusions
Author Contributions
Funding
Institutional Review Board Statement
Informed Consent Statement
Data Availability Statement
Acknowledgments
Conflicts of Interest
Abbreviations
| FIS | International Ski Federation |
| DH | Downhill technique |
| DP | Double poling |
| DPT | Double pole test |
| GNSS | Global Navigation Satellite System |
| Mean power/kg | Relative mean power per body weight |
| PWT | Pole walk and run test |
| RCT | Respiratory compensation threshold |
| SD | Standard deviation |
| SET | Ski ergometer test |
| TTE-DPT | Time to exhaustion in the double pole test |
| TTE-PWT | Time to exhaustion in the pole walk and run test |
| VO2max | Absolute maximal oxygen uptake |
| VO2max/kg | Relative maximal oxygen uptake per body weight |
| VO2peak | Absolute peak oxygen uptake |
| VO2peak/kg | Relative peak oxygen uptake per body weight |
| VT | Ventilatory threshold |
References
- Tonnessen, E.; Haugen, T.A.; Hem, E.; Leirstein, S.; Seiler, S. Maximal aerobic capacity in the winter-Olympics endurance disciplines: Olympic-medal benchmarks for the time period 1990–2013. Int. J. Sports Physiol. Perform. 2015, 10, 835–839. [Google Scholar] [CrossRef] [PubMed]
- Sandbakk, O.; Hegge, A.M.; Losnegard, T.; Skattebo, O.; Tonnessen, E.; Holmberg, H.C. The Physiological Capacity of the World’s Highest Ranked Female Cross-country Skiers. Med. Sci. Sports Exerc. 2016, 48, 1091–1100. [Google Scholar] [CrossRef] [PubMed]
- Talsnes, R.K.; Solli, G.S.; Kocbach, J.; Torvik, P.O.; Sandbakk, O. Laboratory- and field-based performance-predictions in cross-country skiing and roller-skiing. PLoS ONE 2021, 16, e0256662. [Google Scholar] [CrossRef]
- Alsobrook, N.G.; Heil, D.P. Upper body power as a determinant of classical cross-country ski performance. Eur. J. Appl. Physiol. 2009, 105, 633–641. [Google Scholar] [CrossRef] [PubMed]
- Staib, J.L.; Im, J.; Caldwell, Z.; Rundell, K.W. Cross-Country Ski Racing Performance Predicted by Aerobic and Anaerobic Double Poling Power. J. Strength Cond. Res. 2000, 14, 282–288. [Google Scholar]
- Carlsson, M.; Carlsson, T.; Hammarström, D.; Tiivel, T.; Malm, C.; Tonkonogi, M. Validation of physiological tests in relation to competitive performances in elite male distance cross-country skiing. J. Strength Cond. Res. 2012, 26, 1496–1504. [Google Scholar] [CrossRef]
- Sunde, A.; Johansen, J.M.; Gjora, M.; Paulsen, G.; Braten, M.; Helgerud, J.; Storen, O. Stronger Is Better: The Impact of Upper Body Strength in Double Poling Performance. Front. Physiol. 2019, 10, 1091. [Google Scholar] [CrossRef]
- Torvik, P.O.; Sandbakk, O.; van den Tillaar, R.; Talsnes, R.K.; Danielsen, J. A Comparison of Double Poling Physiology and Kinematics Between Long-Distance and All-Round Cross-Country Skiers. Front. Sports Act. Living 2022, 4, 849731. [Google Scholar] [CrossRef]
- Andersson, E.; Supej, M.; Sandbakk, O.; Sperlich, B.; Stoggl, T.; Holmberg, H.C. Analysis of sprint cross-country skiing using a differential global navigation satellite system. Eur. J. Appl. Physiol. 2010, 110, 585–595. [Google Scholar] [CrossRef]
- Stoggl, T.L.; Hertlein, M.; Brunauer, R.; Welde, B.; Andersson, E.P.; Swaren, M. Pacing, Exercise Intensity, and Technique by Performance Level in Long-Distance Cross-Country Skiing. Front. Physiol. 2020, 11, 17. [Google Scholar] [CrossRef]
- Stoggl, T.; Holmberg, H.C. Force interaction and 3D pole movement in double poling. Scand. J. Med. Sci. Sports 2011, 21, e393–e404. [Google Scholar] [CrossRef] [PubMed]
- Takeda, M.; Miyamoto, N.; Endo, T.; Ohtonen, O.; Lindinger, S.; Linnamo, V.; Stoggl, T. Cross-Country Skiing Analysis and Ski Technique Detection by High-Precision Kinematic Global Navigation Satellite System. Sensors. 2019, 19, 4947. [Google Scholar] [CrossRef]
- Shang, L.; Sandbakk, O.; Shi, R.; Chen, X.; Talsnes, R.K. Analysis of a Skating Time-Trial Competition and Associated Performance-Determinants in Cross-Country Skiers. Int. J. Environ. Res. Public Health 2022, 19, 11580. [Google Scholar] [CrossRef]
- Uda, S.; Miyamoto, N.; Hirose, K.; Nakano, H.; Stöggl, T.; Linnamo, V.; Lindinger, S.; Takeda, M. Cross-Country Ski Skating Style Sub-Technique Detection and Skiing Characteristic Analysis on Snow Using High-Precision GNSS. Sensors 2024, 24, 6073. [Google Scholar] [CrossRef] [PubMed]
- Onodera, K.; Miyamoto, N.; Hirose, K.; Kondo, A.; Kajiwara, W.; Nakano, H.; Uda, S.; Takeda, M. Running Parameter Analysis in 400 m Sprint Using Real-Time Kinematic Global Navigation Satellite Systems. Sensors. 2025, 25, 1073. [Google Scholar] [CrossRef] [PubMed]
- FIS. International Ski Competition Rules (ICR), October 2023; International Ski and Snowboard Federation: Oberhofen am Thunersee, Switzerland, 2023. [Google Scholar]
- Nilsson, J.; Tveit, P.; Eikrehagen, O. Effects of speed on temporal patterns in classical style and freestyle cross-country skiing. Sports Biomech. 2004, 3, 85–107. [Google Scholar] [CrossRef]
- Pellegrini, B.; Sandbakk, Ø.; Stöggl, T.; Supej, M.; Ørtenblad, N.; Schürer, A.; Steiner, T.; Lunina, A.; Manhard, C.; Liu, H.; et al. Methodological Guidelines Designed to Improve the Quality of Research on Cross-Country Skiing. J. Sci. Sport Exerc. 2021, 3, 207–223. [Google Scholar] [CrossRef]
- Binder, R.K.; Wonisch, M.; Corra, U.; Cohen-Solal, A.; Vanhees, L.; Saner, H.; Schmid, J.P. Methodological approach to the first and second lactate threshold in incremental cardiopulmonary exercise testing. Eur. J. Cardiovasc. Prev. Rehabil. 2008, 15, 726–734. [Google Scholar] [CrossRef]
- Hopkins, W.G.; Marshall, S.W.; Batterham, A.M.; Hanin, J. Progressive Statistics for Studies in Sports Medicine and Exercise Science. Med. Sci. Sports Exerc. 2009, 41, 3–12. [Google Scholar] [CrossRef]
- Stoggl, T.; Lindinger, S.; Muller, E. Evaluation of an upper-body strength test for the cross-country skiing sprint. Med. Sci. Sports Exerc. 2007, 39, 1160–1169. [Google Scholar] [CrossRef]
- Carlsson, M.; Carlsson, T.; Knutsson, M.; Malm, C.; Tonkonogi, M. Oxygen uptake at different intensities and sub-techniques predicts sprint performance in elite male cross-country skiers. Eur. J. Appl. Physiol. 2014, 114, 2587–2595. [Google Scholar] [CrossRef] [PubMed]
- Luchsinger, H.; Talsnes, R.K.; Kocbach, J.; Sandbakk, O. Analysis of a Biathlon Sprint Competition and Associated Laboratory Determinants of Performance. Front. Sports Act. Living 2019, 1, 60. [Google Scholar] [CrossRef] [PubMed]
- Zoppirolli, C.; Hebert-Losier, K.; Holmberg, H.C.; Pellegrini, B. Biomechanical determinants of cross-country skiing performance: A systematic review. J. Sports Sci. 2020, 38, 2127–2148. [Google Scholar] [CrossRef] [PubMed]
- Losnegard, T. Energy system contribution during competitive cross-country skiing. Eur. J. Appl. Physiol. 2019, 119, 1675–1690. [Google Scholar] [CrossRef]

| Protocol for Pole Walk and Run Test (PWT) | Protocol for Double Poling Test (DPT) | ||||
|---|---|---|---|---|---|
|
Time (min) |
Inclination (degrees) | Speed (km/h) | Time (min) | Inclination (degrees) | Speed (km/h) |
| 0–2 | 4.2 | 6.0 | 0–1 | 2.0 | 10.0 |
| 2–4 | 5.3 | 6.5 | 1–2 | 3.0 | 10.0 |
| 4–6 | 6.3 | 7.0 | 2–3 | 4.0 | 10.0 |
| 6–8 | 7.9 | 7.0 | 3–4 | 5.0 | 10.0 |
| 8–10 | 9.5 | 7.0 | 4–5 | 6.0 | 10.0 |
| 10–12 | 11.1 | 7.0 | 5–6 | 7.0 | 10.0 |
| 12–14 | 12.7 | 7.0 | 6–7 | 8.0 | 10.0 |
| 14–15 | 14.0 | 7.6 | 7–8 | 9.0 | 10.0 |
| 15–16 | 14.0 | 8.2 | 8–9 | 10.0 | 10.0 |
| From 15 min onward, the incline remains the same, and the speed increases by 0.6 km/h every minute. | The incline increases by 1 degree every minute, and the speed remains constant. | ||||
| Mean ± SD (n = 19) | Correlation with Race Time | ||
|---|---|---|---|
| Timed Race | Race Time (s) | 1539.7 ± 153.2 | |
| PWT | TTE (s) | 1046.5 ± 81.6 | −0.75 ** |
| VO2max (mL·min−1) | 4455.9 ± 517.1 | −0.72 ** | |
| VO2max/kg (mL·kg−1·min−1) | 69.6 ± 4.9 | −0.32 | |
| %VO2max at VT (%) | 58.3 ± 7.2 | −0.56 * | |
| %VO2max at RCT (%) | 78.2 ± 5.3 | −0.51 * | |
| DPT | TTE (s) | 371.9 ± 55.6 | −0.84 ** |
| VO2peak (mL·min−1) | 3761.6 ± 549.2 | −0.76 ** | |
| VO2peak/kg (mL·kg−1·min−1) | 58.8 ± 5.4 | −0.59 ** | |
| %VO2peak/VO2max (%) | 84.4 ± 6.0 | −0.39 | |
| SET | Mean power (W) | 369.3 ± 63.8 | −0.53 * |
| Mean power/kg (W·kg−1) | 5.7 ± 0.9 | −0.26 |
| Time-Based Usage Ratios (%) | Skiing Velocity (m/s) | Cycle Length (m) | Cycle Time (s) | ||||||||||||
|---|---|---|---|---|---|---|---|---|---|---|---|---|---|---|---|
| G3 | G4 | G6 | DH | G3 | G4 | G6 | DH | G3 | G4 | G6 | G3 | G4 | G6 | ||
| Timed Race | Race Time (s) | −0.13 | 0.05 | −0.62 ** | −0.20 | −0.89 ** | −0.88 ** | −0.97 ** | −0.92 ** | −0.53 * | −0.75 ** | −0.70 ** | 0.62 ** | 0.28 | 0.83 ** |
| PWT | TTE (s) | 0.25 | −0.14 | 0.43 | −0.14 | 0.70 ** | 0.76 ** | 0.78 ** | 0.79 ** | 0.30 | 0.59 ** | 0.42 | −0.64 ** | −0.33 | −0.77 ** |
| VO2max (mL·min−1) | 0.41 | −0.34 | 0.35 | 0.05 | 0.79 ** | 0.75 ** | 0.73 ** | 0.76 ** | 0.58 ** | 0.58 ** | 0.53 * | −0.39 | −0.36 | −0.61 ** | |
| VO2max/kg (mL·kg−1·min−1) | 0.04 | −0.02 | 0.28 | −0.22 | 0.32 | 0.29 | 0.32 | 0.39 | −0.06 | 0.05 | 0.01 | −0.54 * | −0.48 * | −0.43 | |
| %VO2max at VT (%) | 0.07 | −0.05 | 0.20 | 0.36 | 0.59 ** | 0.51 * | 0.57 * | 0.43 | 0.54 * | 0.48 * | 0.44 | −0.14 | −0.05 | −0.43 | |
| %VO2max at RCT (%) | 0.17 | −0.06 | 0.08 | 0.26 | 0.45 | 0.48 * | 0.50 * | 0.42 | 0.25 | 0.34 | 0.18 | −0.33 | −0.27 | −0.55 * | |
| DPT | TTE (s) | 0.14 | −0.07 | 0.50 * | 0.00 | 0.81 ** | 0.81 ** | 0.85 ** | 0.85 ** | 0.47 * | 0.64 ** | 0.54 * | −0.55 * | −0.34 | −0.76 ** |
| VO2peak (mL·min−1) | 0.34 | −0.29 | 0.46 * | −0.05 | 0.81 ** | 0.82 ** | 0.78 ** | 0.81 ** | 0.58 ** | 0.68 ** | 0.55 * | −0.42 | −0.29 | −0.66 ** | |
| VO2peak/kg (mL·kg−1·min−1) | 0.04 | −0.02 | 0.52 * | −0.30 | 0.56 * | 0.61 ** | 0.59 ** | 0.67 ** | 0.15 | 0.39 | 0.20 | −0.62 ** | −0.45 | −0.66 ** | |
| %VO2peak/VO2max (%) | −0.03 | 0.04 | 0.38 | −0.15 | 0.33 | 0.44 | 0.40 | 0.42 | 0.19 | 0.43 | 0.22 | −0.25 | −0.02 | −0.38 | |
| SET | Mean power (W) | −0.06 | 0.03 | 0.54 * | 0.03 | 0.51 * | 0.47 * | 0.53 * | 0.59 ** | 0.40 | 0.29 | 0.48 * | −0.20 | −0.33 | −0.36 |
| Mean power/kg (W·kg−1) | −0.37 | 0.27 | 0.54 * | −0.07 | 0.19 | 0.19 | 0.27 | 0.34 | 0.08 | 0.00 | 0.18 | −0.17 | −0.36 | −0.21 | |
| Skiing Velocity (m/s) | Cycle Length (m) | Cycle Time (s) | |||||
|---|---|---|---|---|---|---|---|
| Intermediate | Uphill | Intermediate | Uphill | Intermediate | Uphill | ||
| Timed Race | Race Time (s) | −0.92 ** | −0.87 ** | −0.57 * | −0.56 * | 0.56 * | 0.65 ** |
| PWT | TTE (s) | 0.72 ** | 0.68 ** | 0.31 | 0.35 | −0.61 ** | −0.62 ** |
| VO2max (mL·min−1) | 0.76 ** | 0.67 ** | 0.55 * | 0.49 * | −0.33 | −0.42 | |
| VO2max/kg (mL·min−1·kg−1) | 0.31 | 0.37 | −0.08 | −0.01 | −0.53 * | −0.54 * | |
| %VO2max at VT (%) | 0.62 ** | 0.59 ** | 0.54 * | 0.58 ** | −0.14 | −0.19 | |
| %VO2max at RCT (%) | 0.45 | 0.44 | 0.22 | 0.22 | −0.34 | −0.37 | |
| DPT | TTE (s) | 0.83 ** | 0.81 ** | 0.45 | 0.58 ** | −0.56 * | −0.53 * |
| VO2peak (mL·min−1) | 0.79 ** | 0.72 ** | 0.53 * | 0.54 * | −0.40 | −0.43 | |
| VO2peak/kg (mL·min−1·kg−1) | 0.56 * | 0.62 ** | 0.10 | 0.29 | −0.64 ** | −0.58 ** | |
| %VO2peak/VO2max (%) | 0.35 | 0.35 | 0.16 | 0.28 | −0.29 | −0.21 | |
| SET | Mean power (W) | 0.52 * | 0.55 * | 0.43 | 0.54 * | −0.16 | −0.19 |
| Mean power/kg (W·kg−1) | 0.24 | 0.37 | 0.12 | 0.36 | −0.17 | −0.13 | |
Disclaimer/Publisher’s Note: The statements, opinions and data contained in all publications are solely those of the individual author(s) and contributor(s) and not of MDPI and/or the editor(s). MDPI and/or the editor(s) disclaim responsibility for any injury to people or property resulting from any ideas, methods, instructions or products referred to in the content. |
© 2025 by the authors. Licensee MDPI, Basel, Switzerland. This article is an open access article distributed under the terms and conditions of the Creative Commons Attribution (CC BY) license (https://creativecommons.org/licenses/by/4.0/).
Share and Cite
Uda, S.; Miyamoto, N.; Kajiwara, W.; Nakano, H.; Onodera, K.; Horimoto, R.; Okada, T.; Takeda, M. Associations Between Physiological Determinants and GNSS-Derived Technical Characteristics in Cross-Country Roller Skiing. Sensors 2025, 25, 2521. https://doi.org/10.3390/s25082521
Uda S, Miyamoto N, Kajiwara W, Nakano H, Onodera K, Horimoto R, Okada T, Takeda M. Associations Between Physiological Determinants and GNSS-Derived Technical Characteristics in Cross-Country Roller Skiing. Sensors. 2025; 25(8):2521. https://doi.org/10.3390/s25082521
Chicago/Turabian StyleUda, Shunya, Naoto Miyamoto, Wako Kajiwara, Hiroshi Nakano, Keisuke Onodera, Ryoji Horimoto, Takato Okada, and Masaki Takeda. 2025. "Associations Between Physiological Determinants and GNSS-Derived Technical Characteristics in Cross-Country Roller Skiing" Sensors 25, no. 8: 2521. https://doi.org/10.3390/s25082521
APA StyleUda, S., Miyamoto, N., Kajiwara, W., Nakano, H., Onodera, K., Horimoto, R., Okada, T., & Takeda, M. (2025). Associations Between Physiological Determinants and GNSS-Derived Technical Characteristics in Cross-Country Roller Skiing. Sensors, 25(8), 2521. https://doi.org/10.3390/s25082521