
Using Optical Coherence Tomography in Plant Biology Research: Review and Prospects


Abstract
1. Coming of Age
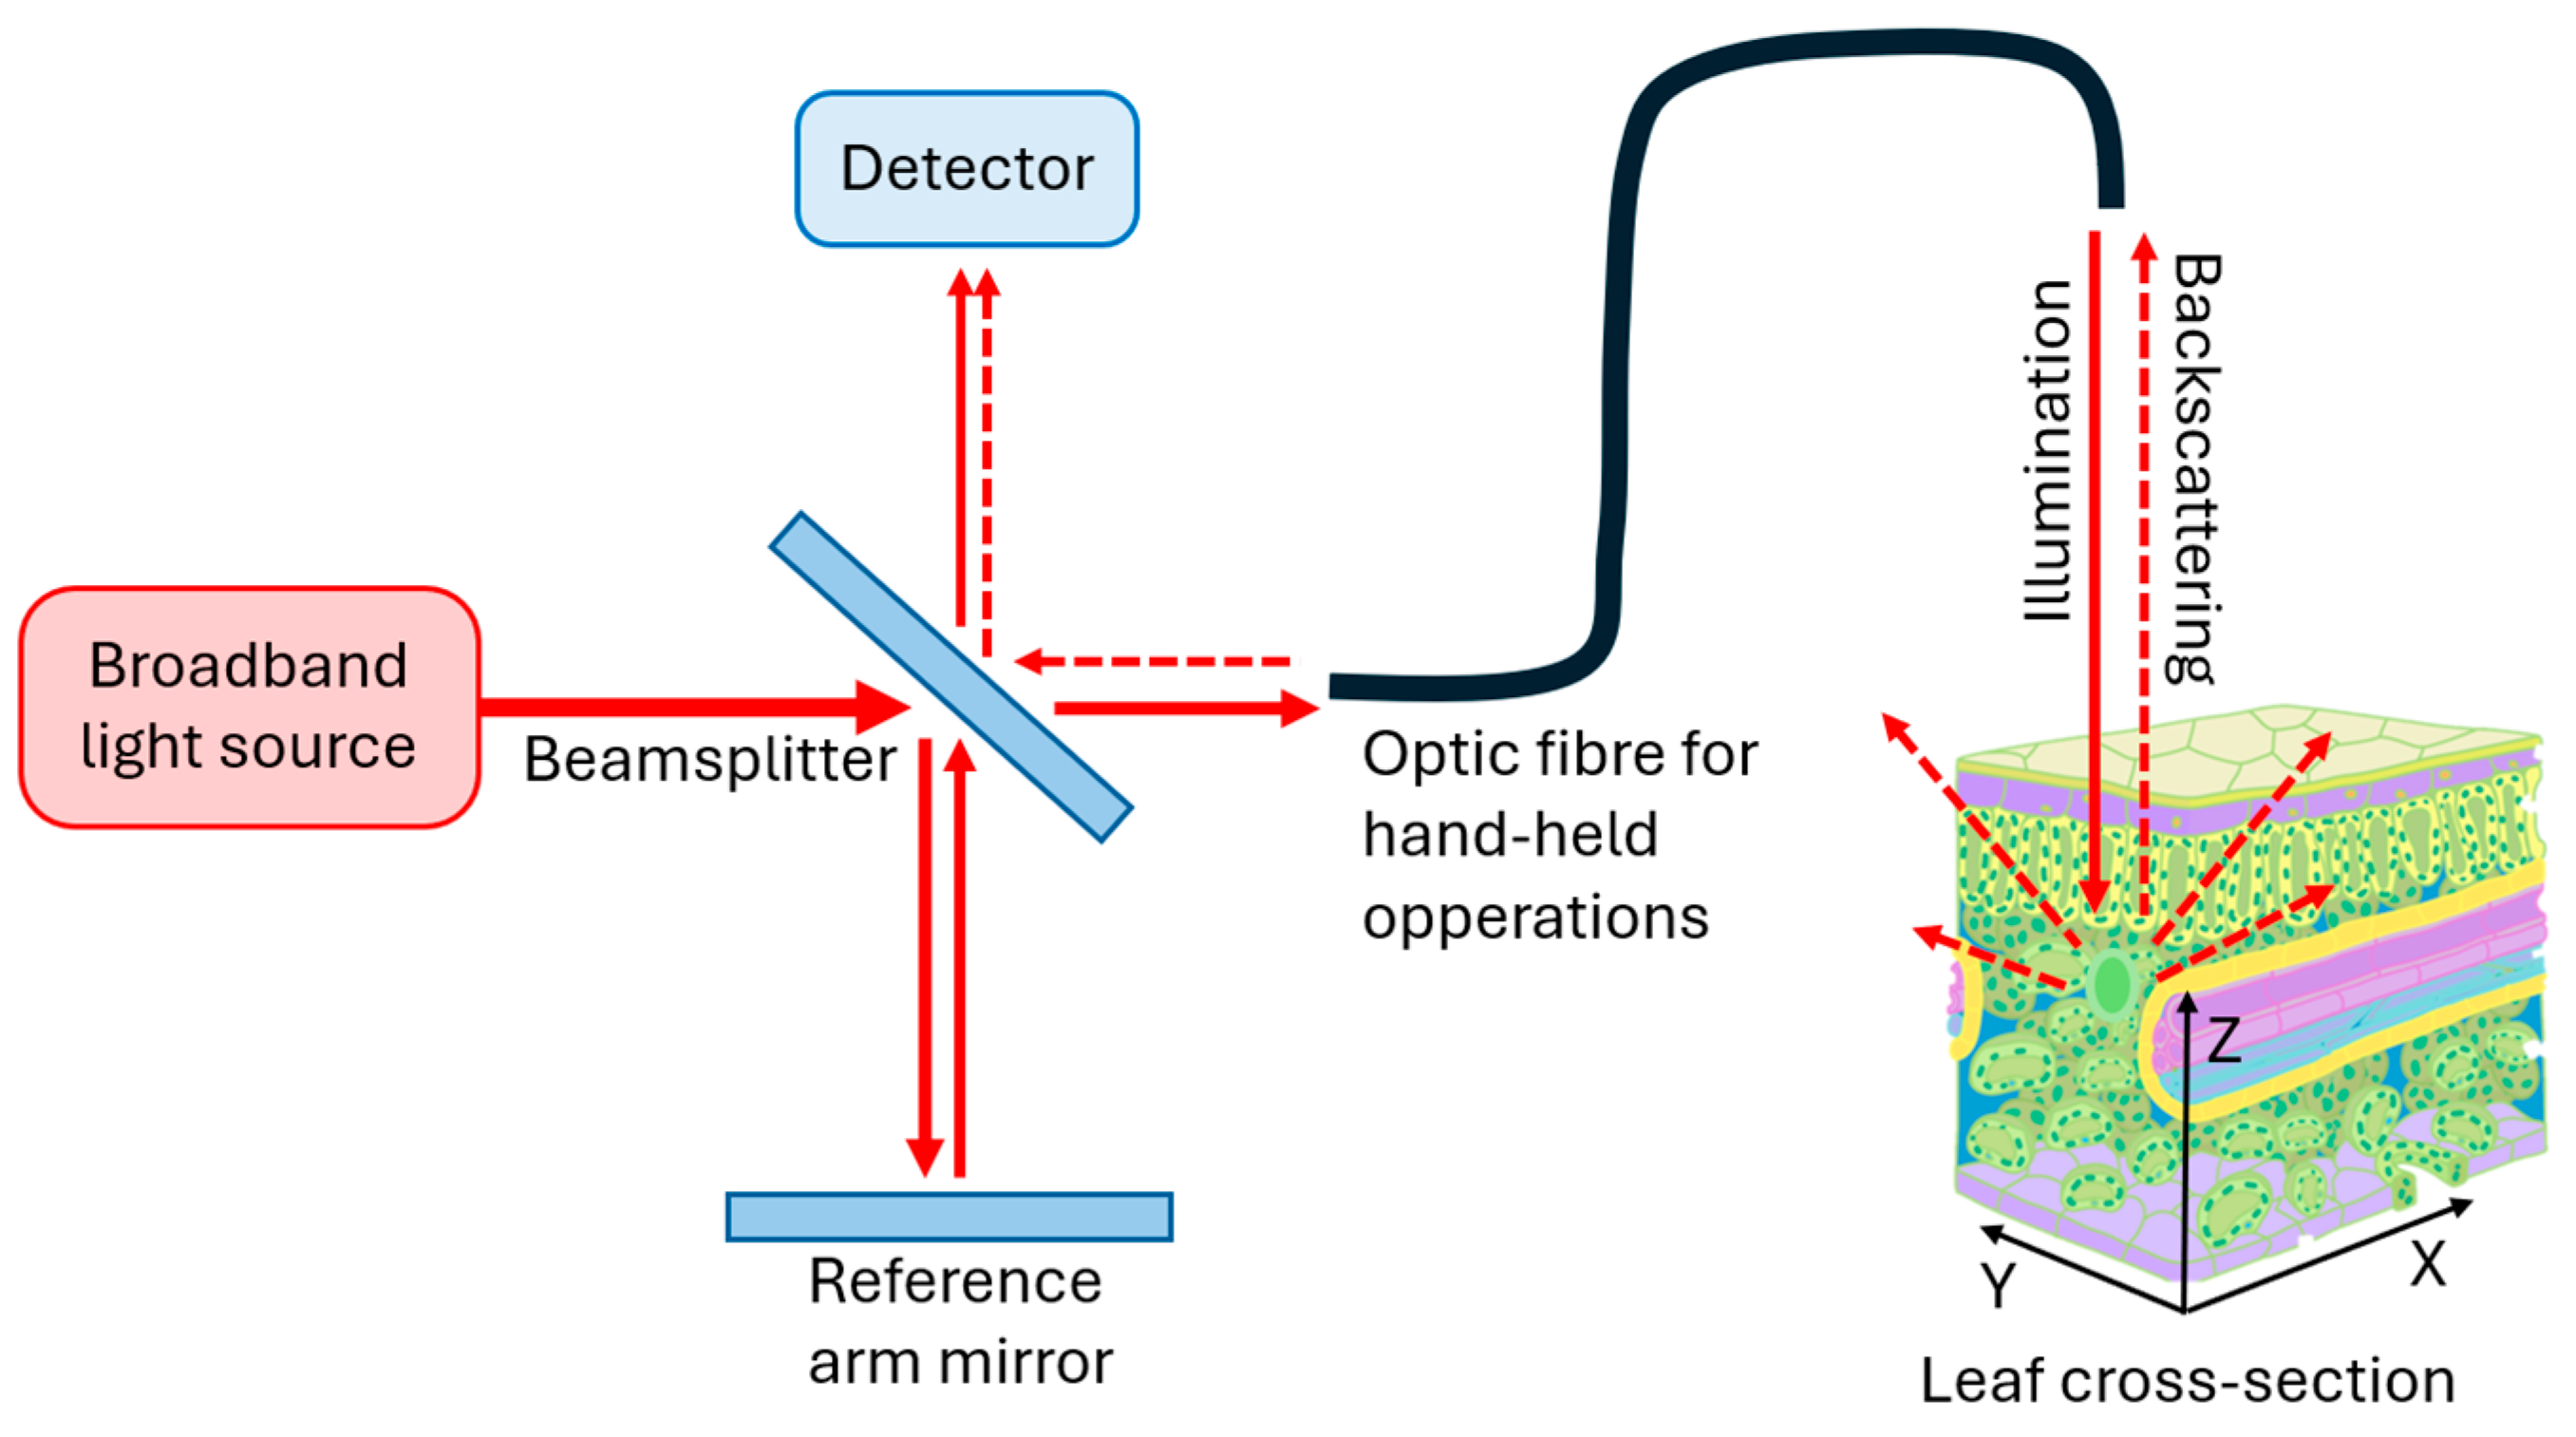
2. Concepts and Characteristics of OCT
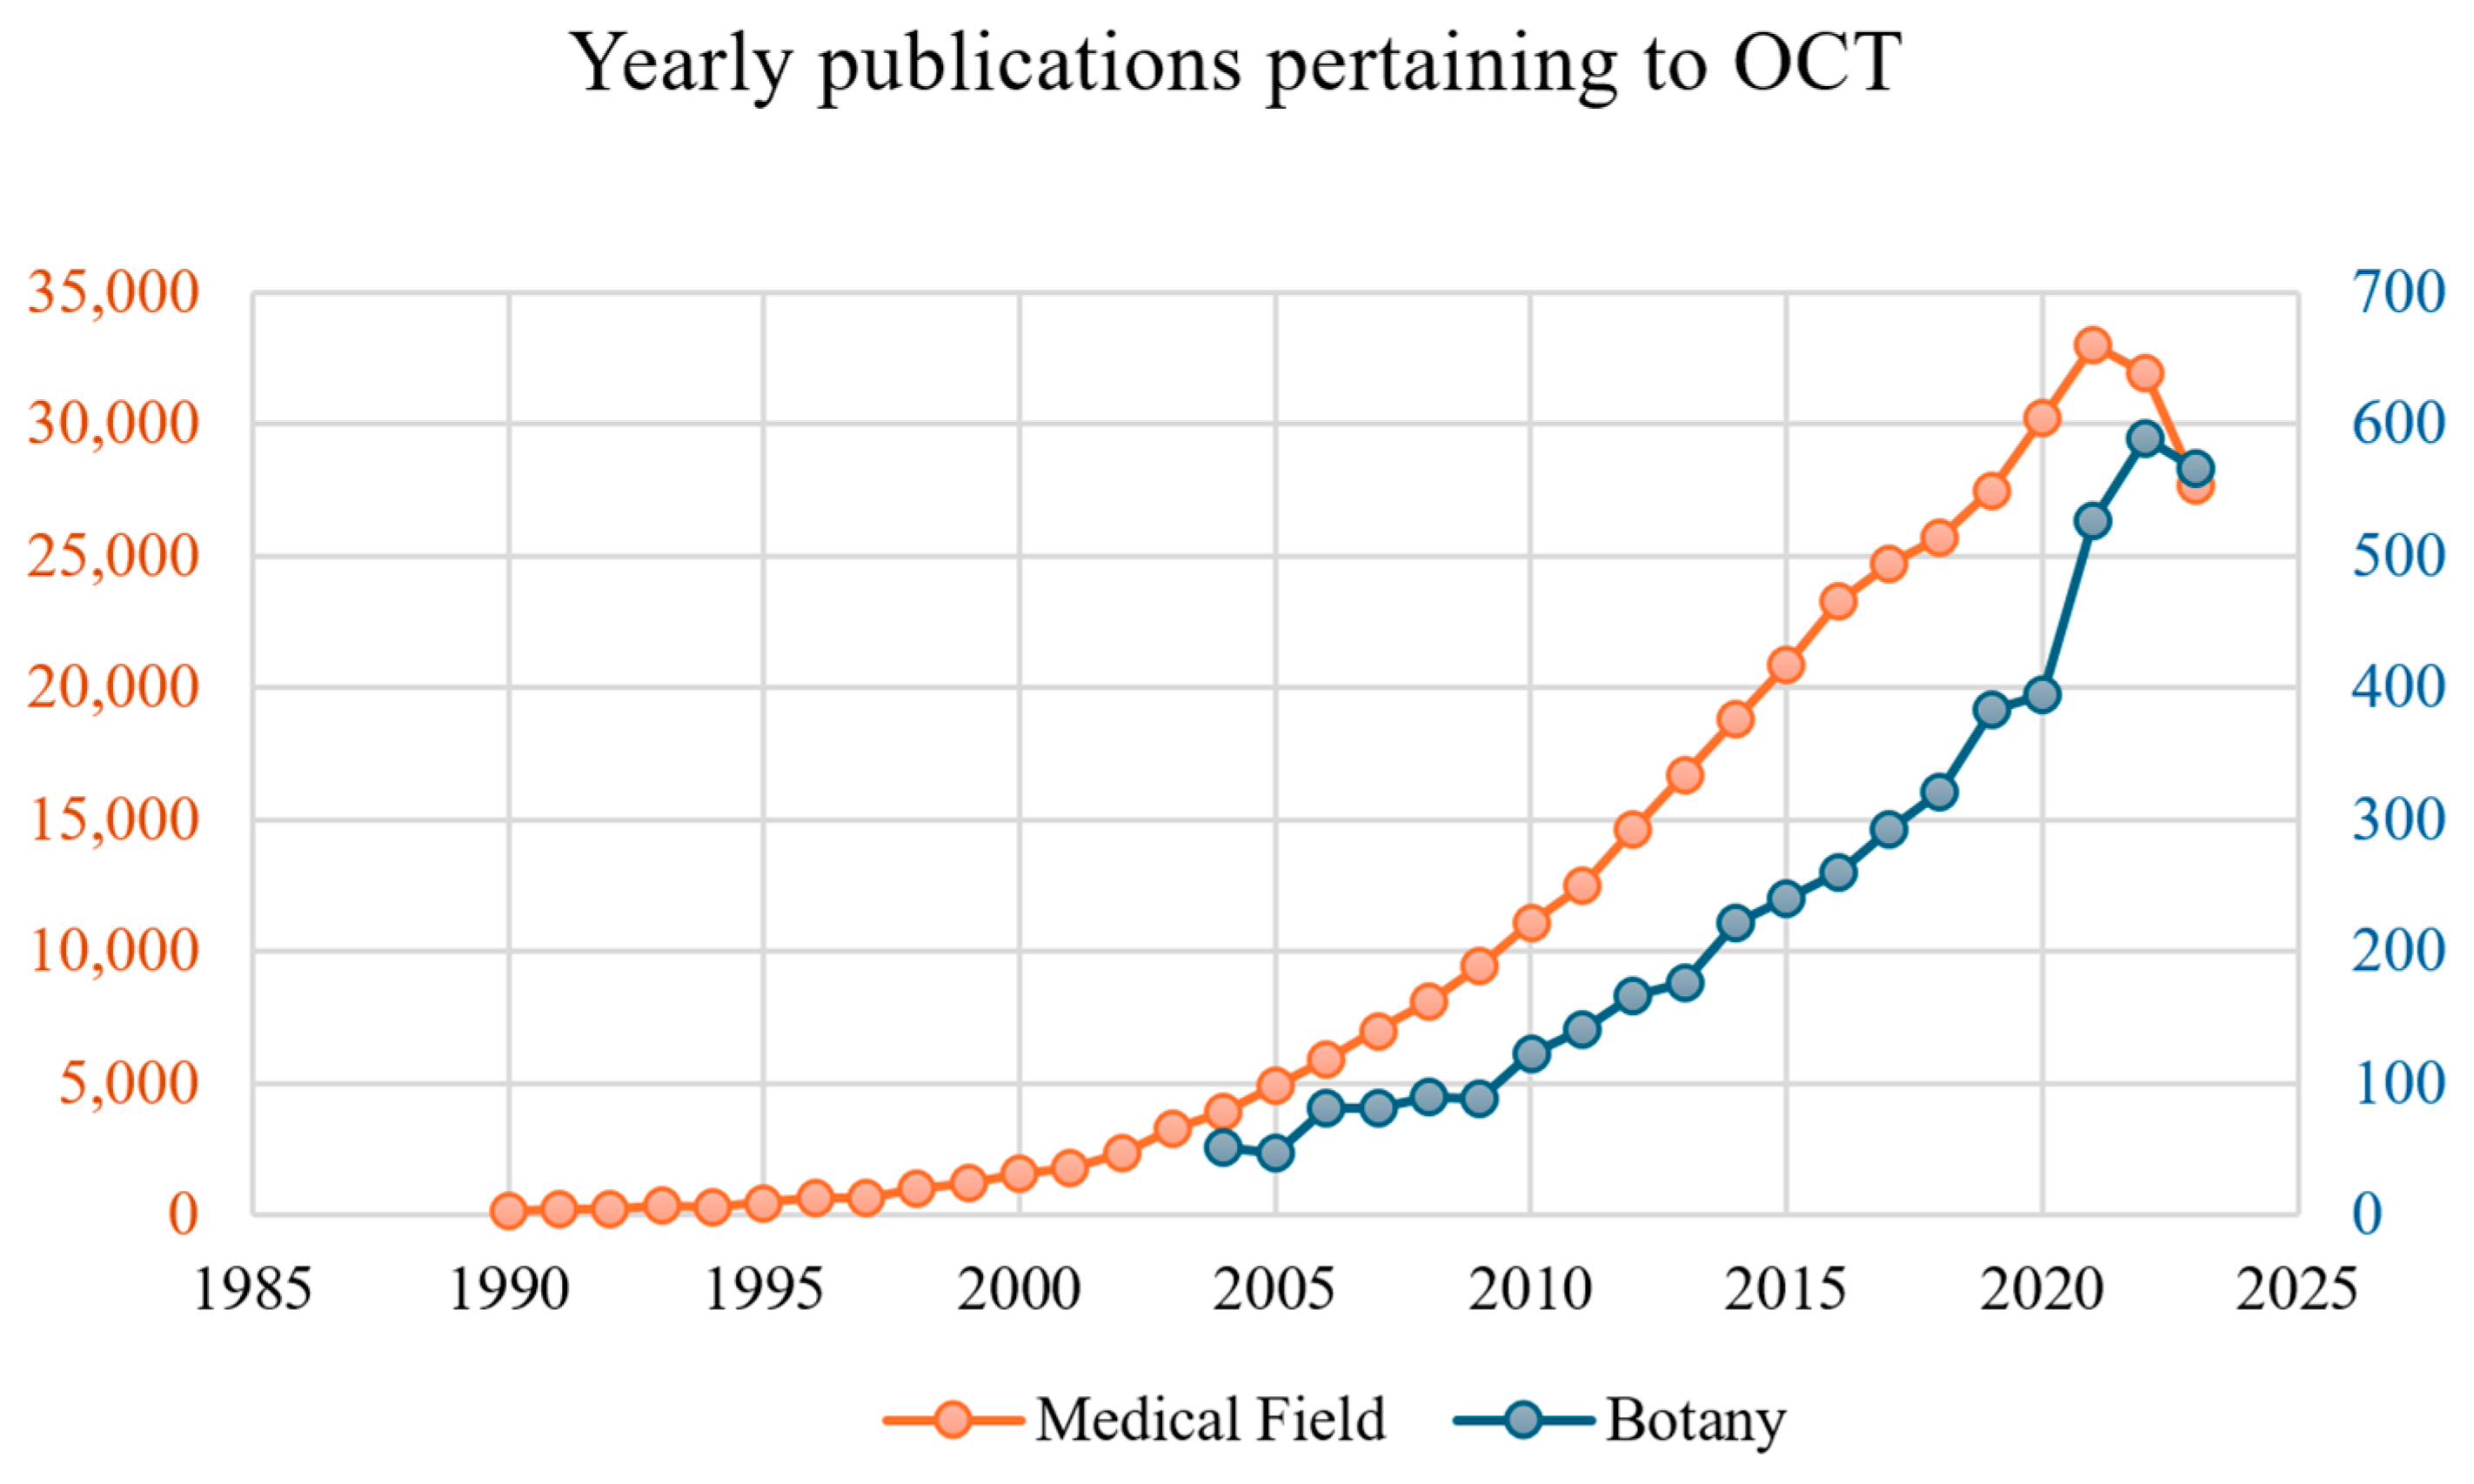
3. Popularity of OCT in Botany
4. Comparison with Alternative Techniques
- The highest resolution technique available is X-ray tomography (XCT). This system provides 3D rendering of the internal structures of plant tissue with nanometric resolution [30,31]. Samples can be as large as a whole plant (e.g., 40 cm tall), depending on the size of the sample chamber, but it is not field-applicable [32]. Furthermore, high X-ray dose causes ionization, which disrupts and damages the plant [33,34,35].
- Hyperspectral imaging (HIS), which includes UV reflectance imaging [36,37], serves as a non-invasive and efficient tool for studying plants and whole crops. Although such spectroscopic method is in theory diffraction limited, HIS’ resolution is typically low given the sensor size and its distance from the object [38]. Although HIS typically has the lowest spatial resolution [39], it is the most practical for field application, offering insights into the health, physiology, and interactions of plants with their environment.
- Raman microscopy is often used as a convenient and non-invasive way to monitor the presence of specific molecules in tissues. Molecules are categorized by the vibrational signature of their functional groups [40]. For this technique, no sample preparation is needed; it is non-destructive and is highly sensitive, which makes it field-applicable. The past decade has seen the development of universal multiple angle Raman spectroscopy (UMRAS) for monitoring functional groups of embedded molecules, thus paving the way for 3D Raman imaging [41,42]. But to characterize tissues solely based on the functional groups of its constituting molecules is not at all trivial, and variations among research teams makes it difficult to obtain replicate measurements [43].
- Laser-induced fluorescence (LIF) is commonly used, like HIS, to remotely assess whole leaves, plants, and even crops [44]. It allows for real-time imaging and is non-invasive [45]. LIF typically gives information about the presence of chlorophyll via its induced fluorescence [45]. Consequently, LIF is restricted to monitoring chlorophyll and other highly fluorescent molecules within tissues, without revealing direct information about the tissue’s internal structure.
- Magnetic resonance imaging (MRI) is another non-invasive, non-destructive imaging technique, which also provides three-dimensional images. It also allows for whole plant investigation [46] and is non-invasive [47]. However, MRI has a typical axial resolution of 1.5–2.0 mm [18,48] and is not field-applicable.
- Ultrasound imaging is another 3D imaging technique which uses sound instead of radiation. It can be used to investigate plant tissue and water movement within it [49]. Ultrasound imaging benefits from a significantly higher penetration depth compared to OCT, typically up to several centimeters depending on the frequency used. However, it has lower axial and lateral resolution compared to OCT [50], often around 10 to 100 times lower, ranging from about 50 µm to 500 µm [51] while OCT’s axial resolutions typically range from 1 to 15 µm [49,50,51]. Ultrasounds have been shown to directly affect plants, albeit in a positive way [52].
5. The Various Variants of OCT
5.1. Polarization-Sensitive OCT
5.2. Full-Field Optical Coherence Tomography (FF-OCT)
5.3. Spectroscopic Optical Coherence Tomography (S-OCT)
5.4. Biospeckle OCT (bOCT)
5.5. Inverse Spectroscopic OCT (ISOCT)
6. Use of OCT in Botany
6.1. OCT for Non-Invasive Investigation of Crop Types
6.2. OCT to Study Plant’s Responses to Biotic Stresses
6.3. OCT to Study Plant’s Responses to Abiotic Stresses
6.4. OCT for Investigation of Live Responses
7. The Future of OCT
Funding
Acknowledgments
Conflicts of Interest
References
- Fercher, A.; Roth, E. Ophthalmic Laser Interferometry. In Proceedings of the 1986 International Symposium, Innsbruck, Austria, 6–12 July 1986; Volume 0658. [Google Scholar]
- Drexler, W.; Liu, M.; Kumar, A.; Kamali, T.; Unterhuber, A.; Leitgeb, R.A. Optical coherence tomography today: Speed, contrast, and multimodality. J. Biomed. Opt. 2014, 19, 071412. [Google Scholar] [CrossRef] [PubMed]
- Fujimoto, J.G.; Puliafito, C.A.; Margolis, R.; Oseroff, A.; De Silvestri, S.; Ippen, E.P. Femtosecond optical ranging in biological systems. Opt. Lett. 1986, 11, 150–152. [Google Scholar] [CrossRef] [PubMed]
- Huang, D.; Swanson, E.A.; Lin, C.P.; Schuman, J.S.; Stinson, W.G.; Chang, W.; Hee, M.R.; Flotte, T.; Gregory, K.; Puliafito, C.A.; et al. Optical coherence tomography. Science 1991, 254, 1178–1181. [Google Scholar] [CrossRef] [PubMed]
- Fujimoto, J.G. Optical coherence tomography for ultrahigh resolution In Vivo imaging. Nat. Biotechnol. 2003, 21, 1361–1367. [Google Scholar] [CrossRef]
- Drexler, W. Optical Coherence Tomography. In Encyclopedia of the Eye; Dartt, D.A., Ed.; Academic Press: Oxford, UK, 2010; pp. 194–204. [Google Scholar]
- Scholtz, S.; MacMorris, L.; Langenbucher, A. The 30-Year History of Optical Coherence Tomography of the Human Eye. Ophthalmol. Times Eur. 2021, 17, 06. [Google Scholar]
- Li, M.; Landahl, S.; East, A.R.; Verboven, P.; Terry, L.A. Optical coherence tomography—A review of the opportunities and challenges for postharvest quality evaluation. Postharvest Biol. Technol. 2019, 150, 9–18. [Google Scholar] [CrossRef]
- Sapozhnikova, V.V.; Kamensky, V.A.; Kuranov, R.V.; Kutis, I.; Snopova, L.B.; Myakov, A.V. In Vivo visualization of Tradescantia leaf tissue and monitoring the physiological and morphological states under different water supply conditions using optical coherence tomography. Planta 2004, 219, 601–609. [Google Scholar] [CrossRef]
- Bouma, B.E.; de Boer, J.F.; Huang, D.; Jang, I.-K.; Yonetsu, T.; Leggett, C.L.; Leitgeb, R.; Sampson, D.D.; Suter, M.; Vakoc, B.J.; et al. Optical coherence tomography. Nat. Rev. Methods Primers 2022, 2, 79. [Google Scholar] [CrossRef]
- Gabriele, M.L.; Wollstein, G.; Ishikawa, H.; Kagemann, L.; Xu, J.; Folio, L.S.; Schuman, J.S. Optical coherence tomography: History, current status, and laboratory work. Investig. Ophthalmol. Vis. Sci. 2011, 52, 2425–2436. [Google Scholar] [CrossRef]
- de Amorim Garcia Filho, C.A.; Yehoshua, Z.; Gregori, G.; Puliafito, C.A.; Rosenfield, P.J. Chapter 3—Optical Coherence Tomography. In Retina, 5th ed.; W.B. Saunders: London, UK, 2013; pp. 82–110. [Google Scholar]
- Nanda, T.; Liang, M.C.; Duker, J.S. Optical Coherence Tomography. 2021. Available online: https://retinahistory.asrs.org/milestones-developments/history-of-oct?utm_source=chatgpt.com (accessed on 1 April 2025).
- Zeppieri, M.; Marsili, S.; Enaholo, E.S.; Shuaibu, A.O.; Uwagboe, N.; Salati, C.; Spadea, L.; Musa, M. Optical Coherence Tomography (OCT): A Brief Look at the Uses and Technological Evolution of Ophthalmology. Medicina 2023, 59, 2114. [Google Scholar] [CrossRef]
- Fujimoto, J.; Swanson, E. The Development, Commercialization, and Impact of Optical Coherence Tomography. Investig. Ophthalmol. Vis. Sci. 2016, 57, OCT1–OCT13. [Google Scholar] [CrossRef] [PubMed]
- Fercher, A.F.; Drexler, W.; Hitzenberger, C.K.; Lasser, T. Optical coherence tomography—Principles and applications. Rep. Prog. Phys. 2003, 66, 239. [Google Scholar] [CrossRef]
- Gao, W.; Wu, X. Differences between time domain and Fourier domain optical coherence tomography in imaging tissues. J. Microsc. 2017, 268, 119–128. [Google Scholar] [CrossRef]
- Popescu, D.P.; Choo-Smith, L.-P.; Flueraru, C.; Mao, Y.; Chang, S.; Disano, J.; Sherif, S.; Sowa, M.G. Optical coherence tomography: Fundamental principles, instrumental designs and biomedical applications. Biophys. Rev. 2011, 3, 155–169. [Google Scholar] [CrossRef]
- Comsa, G. The Coherence Length in Molecular and Electron Beam Diffraction. In Dynamics of Gas-Surface Interaction; Springer Series in Chemical Physics; Benedek, G., Valbusa, U., Eds.; Springer: Berlin/Heidelberg, Germany, 1982; Volume 21. [Google Scholar]
- Nassif, N.; Cense, B.; Park, B.H.; Pierce, M.C.; Yun, S.H.; Bouma, B.E.; Tearney, G.J.; Chen, T.C.; de Boer, J.D. In Vivo high-resolution video-rate spectral-domain optical coherence tomography of the human retina and optic nerve. Opt. Express 2004, 12, 367–376. [Google Scholar] [CrossRef]
- Leitgeb, R.; Hitzenberger, C.K.; Fercher, A.F. Performance of fourier domain vs. time domain optical coherence tomography. Opt. Express 2003, 11, 889–894. [Google Scholar] [CrossRef]
- de Boer, J.F.; Cense, B.; Park, B.H.; Pierce, M.C.; Tearney, G.J.; Bouma, B.E. Improved signal-to-noise ratio in spectral-domain compared with time-domain optical coherence tomography. Opt. Lett. 2003, 28, 2067–2069. [Google Scholar] [CrossRef]
- Aumann, S.; Donner, S.; Fischer, J.; Müller, F. Optical Coherence Tomography (OCT): Principle and Technical Realization. In High Resolution Imaging in Microscopy and Ophthalmology: New Frontiers in Biomedical Optics; Bille, J.F., Ed.; Springer International Publishing: Cham, Switzerland, 2019; pp. 59–85. [Google Scholar]
- Torre-Ibarra, M.H.D.l.; Ruiz, P.D.; Huntley, J.M. Double-shot depth-resolved displacement field measurement using phase-contrast spectral optical coherence tomography. Opt. Express 2006, 14, 9643–9656. [Google Scholar] [CrossRef]
- Teramura, Y.; Suekuni, M.; Kannari, F. Two-dimensional optical coherence tomography using spectral domain interferometry. J. Opt. A Pure Appl. Opt. 2000, 2, 21–26. [Google Scholar] [CrossRef]
- Lumedica OQ Labscope 2.0. Available online: https://www.lumedicasystems.com/oq-labscope/ (accessed on 1 April 2025).
- Sahyoun, C.C.; Subhash, H.M.; Peru, D.; Ellwood, R.P.; Pierce, M.C. An Experimental Review of Optical Coherence Tomography Systems for Noninvasive Assessment of Hard Dental Tissues. Caries Res. 2019, 54, 43–54. [Google Scholar] [CrossRef]
- Fercher, A. Optical coherence tomography-development, principles, applications. Z. Für Med Phys. 2010, 20, 251–276. [Google Scholar] [CrossRef] [PubMed]
- Fujimoto, J.G. Optical Coherence Tomography: Principles and Applications. Rev. Laser Eng. 2003, 31, 635–642. [Google Scholar] [CrossRef]
- Fayad, L.M. CT Scan Versus MRI Versus X-Ray: What Type of Imaging Do I Need? Available online: https://www.hopkinsmedicine.org/health/treatment-tests-and-therapies/ct-vs-mri-vs-xray#:~:text=A%20CT%20scan%2C%20or%20computed,fast%20(about%20one%20minute) (accessed on 1 April 2025).
- Staedler, Y.M.; Masson, D.; Schönenberger, J. Plant tissues in 3D via X-ray tomography: Simple contrasting methods allow high resolution imaging. PLoS ONE 2013, 8, e75295. [Google Scholar] [CrossRef] [PubMed]
- Cnudde, V.; Boone, M.N. High-resolution X-ray computed tomography in geosciences: A review of the current technology and applications. Earth-Sci. Rev. 2013, 123, 1–17. [Google Scholar] [CrossRef]
- Zappala, S.; Helliwell, J.R.; Tracy, S.R.; Mairhofer, S.; Sturrock, C.J.; Pridmore, T.; Bennett, M.; Mooney, S.J. Effects of X-Ray Dose on Rhizosphere Studies Using X-Ray Computed Tomography. PLoS ONE 2013, 8, e67250. [Google Scholar] [CrossRef]
- Sasi, G.S. Responses of some plants to treatment with industrial ceramic—Waste water sludge. In Botany; Ain Shams University, Egyptian Universities Libraries Consortium (EULC): Cairo, Egypt, 2019; pp. 62–147. [Google Scholar]
- Chaturvedi, A.; Jain, V. Effect of Ionizing Radiation on Human Health. Int. J. Plant Environ. 2019, 5, 200–205. [Google Scholar] [CrossRef]
- Heath, M.; St-Onge, D.; Hausler, R. UV reflectance in crop remote sensing: Assessing the current state of knowledge and extending research with strawberry cultivars. PLoS ONE 2024, 19, e0285912. [Google Scholar] [CrossRef]
- Liu, H.; Lee, S.-H.; Chahl, J.S. An evaluation of the contribution of ultraviolet in fused multispectral images for invertebrate detection on green leaves. Precis. Agric. 2016, 18, 667–683. [Google Scholar] [CrossRef]
- Hyperspectral Imaging in Agriculture and Vegetation. Available online: https://www.specim.com/hyperspectral-imaging-applications/agriculture-and-vegetation/#:~:text=Crop%20Health%20Assessment,nutrient%20deficiencies%2C%20or%20water%20scarcity (accessed on 1 April 2025).
- Wang, X.; Hu, Q.; Cheng, Y.; Ma, J. Hyperspectral Image Super-Resolution Meets Deep Learning: A Survey and Perspective. IEEE/CAA J. Autom. Sin. 2023, 10, 1668–1691. [Google Scholar] [CrossRef]
- Rostron, P.; Gaber, S.; Gaber, D. Raman Spectroscopy, Review. Int. J. Eng. Tech. Res. (IJETR) 2016, 6. [Google Scholar]
- Kuhar, N.; Sil, S.; Verma, T.; Umapathy, S. Challenges in application of Raman spectroscopy to biology and materials. RSC Adv. 2018, 8, 25888–25908. [Google Scholar] [CrossRef] [PubMed]
- Sil, S.; Umapathy, S. Umapathy, Raman spectroscopy explores molecular structural signatures of hidden materials in depth: Universal Multiple Angle Raman Spectroscopy. Sci. Rep. 2014, 4, 5308. [Google Scholar] [CrossRef] [PubMed]
- Dong, D.; Zhao, C. Limitations and challenges of using Raman spectroscopy to detect the abiotic plant stress response. Proc. Natl. Acad. Sci. USA 2017, 114, E5486–E5487. [Google Scholar] [CrossRef] [PubMed]
- Saito, Y.; Saito, R.; Kawahara, T.D.; Nomura, A.; Takeda, S. Development and performance characteristics of laser-induced fluorescence imaging lidar for forestry applications. For. Ecol. Manag. 2000, 128, 129–137. [Google Scholar] [CrossRef]
- Wan, W.; Su, J. Study of laser-induced plant fluorescence lifetime imaging technology for plant remote sensing monitor. Measurement 2018, 125, 564–571. [Google Scholar] [CrossRef]
- Peelle, J. Introduction to MRI. Available online: http://jpeelle.net/mri/general/preliminaries.html (accessed on 1 April 2025).
- Van As, H.; Scheenen, T.; Vergeldt, F.J. MRI of intact plants. Photosynth. Res 2009, 102, 213–222. [Google Scholar] [CrossRef]
- Zhang, S.; Uecker, M.; Voit, D.; Merboldt, K.-D.; Frahm, J. Real-time cardiovascular magnetic resonance at high temporal resolution: Radial FLASH with nonlinear inverse reconstruction. J. Cardiovasc. Magn. Reson. 2010, 12, 39. [Google Scholar] [CrossRef]
- Toma, M.; Vinatoru, M.; Paniwnyk, L.; Mason, T. Investigation of the effects of ultrasound on vegetal tissues during solvent extraction. Ultrason. Sonochem. 2001, 8, 137–142. [Google Scholar] [CrossRef]
- Fujimoto, J.G.; Pitris, C.; Boppart, S.A.; Brezinski, M.E. Optical coherence tomography: An emerging technology for biomedical imaging and optical biopsy. Neoplasia 2000, 2, 9–25. [Google Scholar] [CrossRef]
- Laschke, M.W.; Körbel, C.; Rudzitis-Auth, J.; Gashaw, I.; Reinhardt, M.; Hauff, P.; Zollner, T.M.; Menger, M.D. High-resolution ultrasound imaging: A novel technique for the noninvasive in vivo analysis of endometriotic lesion and cyst formation in small animal models. Am. J. Pathol. 2010, 176, 585–593. [Google Scholar] [CrossRef]
- El-Sattar, A.M.A.; Tawfik, E. Effects of ultrasonic waves on seedling growth, biochemical constituents, genetic stability of fenugreek (Trigonella foenum-graecum) under salinity stress. Vegetos 2022, 36, 1427–1436. [Google Scholar] [CrossRef]
- Pircher, M.; Hitzenberger, C.K.; Schmidt-Erfurth, U. Polarization sensitive optical coherence tomography in the human eye. Prog. Retin. Eye Res. 2011, 30, 431–451. [Google Scholar] [CrossRef] [PubMed]
- Cense, B.; Chen, T.C.; Park, B.H.; Pierce, M.C.; de Boer, J.F. In Vivo depth-resolved birefringence measurements of the human retinal nerve fiber layer by polarization-sensitive optical coherence tomography. Opt. Lett. 2002, 27, 1610–1612. [Google Scholar] [CrossRef] [PubMed]
- Aguirre, A.D.; Fujimoto, J.G. Optical Coherence Microscopy. In Optical Coherence Tomography: Technology and Applications; Drexler, W., Fujimoto, J.G., Eds.; Springer International Publishing: Cham, Switzerland, 2015; pp. 865–911. [Google Scholar]
- Leitgeb, R.A. En face optical coherence tomography: A technology review [Invited]. Biomed. Opt. Express 2019, 10, 2177–2201. [Google Scholar] [CrossRef]
- Dubois, A.; Boccara, A.C. Full-Field Optical Coherence Tomography. In Optical Coherence Tomography: Technology and Applications; Drexler, W., Fujimoto, J.G., Eds.; Springer: Berlin/Heidelberg, Germany, 2008; pp. 565–591. [Google Scholar]
- Morgner, U.; Drexler, W.; Kärtner, F.X.; Li, X.D.; Pitris, C.; Ippen, E.P.; Fujimoto, J.G. Spectroscopic optical coherence tomography. Opt. Lett. 2000, 25, 111–113. [Google Scholar] [CrossRef]
- Oldenburg, A.L.; Xu, C.; Boppart, S.A. Spectroscopic Optical Coherence Tomography and Microscopy. IEEE J. Sel. Top. Quantum Electron. 2007, 13, 1629–1640. [Google Scholar] [CrossRef]
- Fujii, H.; Nohira, K.; Shintomi, Y.; Asakura, T.; Ohura, T. Blood flow observed by time-varying laser speckle. Opt. Lett. 1985, 10, 104–106. [Google Scholar] [CrossRef]
- Azzollini, S.; Monfort, T.; Thouvenin, O.; Grieve, K. Dynamic optical coherence tomography for cell analysis [Invited]. Biomed. Opt. Express 2023, 14, 3362–3379. [Google Scholar] [CrossRef]
- Spaide, R.F.; Fujimoto, J.G.; Waheed, N.K.; Sadda, S.R.; Staurenghi, G. Optical coherence tomography angiography. Prog Retin. Eye Res. 2018, 64, 1–55. [Google Scholar] [CrossRef]
- Hope, J.; Goodwin, M.; Vanholsbeeck, F. Inverse spectroscopic optical coherence tomography (IS-OCT) for characterization of particle size and concentration. OSA Contin. 2021, 4, 2260–2274. [Google Scholar] [CrossRef]
- Gong, P.; Almasian, M.; Van Soest, G.; De Bruin, D.M.; Van Leeuwen, T.G.; Sampson, D.D.; Faber, D.J. Parametric imaging of attenuation by optical coherence tomography: Review of models, methods, and clinical translation. J. Biomed. Opt. 2020, 25, 040901. [Google Scholar] [CrossRef] [PubMed]
- Hettinger, J.; Mattozzi, M.d.l.P.; Myers, W.R.; Williams, M.E.; Reeves, A.; Parsons, R.L.; Haskell, R.C.; Petersen, D.C.; Wang, R.; Medford, J.I. Optical Coherence Microscopy. A Technology for Rapid, in Vivo, Non-Destructive Visualization of Plants and Plant Cells. Plant Physiol. 2000, 123, 3–16. [Google Scholar] [CrossRef] [PubMed]
- Magwaza, L.; Ford, H.D.; Cronje, P.J.; Opara, U.L.; Landahl, S.; Tatam, R.P.; Terry, L.A. Application of optical coherence tomography to non-destructively characterise rind breakdown disorder of ‘Nules Clementine’ mandarins. Postharvest Biol. Technol. 2013, 84, 16–21. [Google Scholar] [CrossRef]
- Loeb, G.; Barton, J. Imaging botanical subjects with optical coherence tomography: A feasibility study. Trans. Am. Soc. Agric. Eng. 2003, 46, 1751–1757. [Google Scholar] [CrossRef]
- Kutis, I.; Sapozhnikova, V.V.; Kuranov, R.V.; Kamenskii, V.A. Study of the Morphological and Functional State of Higher Plant Tissues by Optical Coherence Microscopy and Optical Coherence Tomography. Russ. J. Plant Physiol. 2005, 52, 559–564. [Google Scholar] [CrossRef]
- Clements, J.C.; Zvyagin, A.V.; Silva, K.K.M.B.D.; Wanner, T.; Sampson, D.D.; Cowling, W.A. Optical coherence tomography as a novel tool for non-destructive measurement of the hull thickness of lupin seeds. Plant Breed. 2004, 123, 266–270. [Google Scholar] [CrossRef]
- Ullah, H.; Hussain, F.; Ahmad, E.; Ikram, M. A rapid and non-invasive bio-photonic technique to monitor the quality of onions. Opt. Spectrosc. 2015, 119, 295–299. [Google Scholar] [CrossRef]
- Wedding, B.B.; Wright, C.; Grauf, S.; White, R.D. Wavelength variation of the depth of penetration of near infrared radiation in’Hass’ avocado fruit. Technol. Hortic. 2024, 4, e008. [Google Scholar] [CrossRef]
- Veraverbeke, E.; Van Bruaene, N.; Van Oostveldt, P.; Nicolaï, B.M. Non destructive analysis of the wax layer of apple (Malus domestica Borkh.) by means of confocal laser scanning microscopy. Planta 2001, 213, 525–533. [Google Scholar] [CrossRef]
- Reeves, A.; Parsons, R.L.; Hettinger, J.W.; Medford, J.I. In Vivo three-dimensional imaging of plants with optical coherence microscopy. J. Microsc. 2002, 208 Pt 3, 177–189. [Google Scholar] [CrossRef]
- Anna, T.; Chakraborty, S.; Cheng, C.-Y.; Srivastava, V.; Chiou, A.; Kuo, W.-C. Elucidation of microstructural changes in leaves during senescence using spectral domain optical coherence tomography. Sci. Rep. 2019, 9, 1167. [Google Scholar] [CrossRef] [PubMed]
- Spicer, G.L.C.; Eid, A.; Wangpraseurt, D.; Swain, T.D.; Winkelmann, J.A.; Yi, J.; Kühl, M.; Marcelino, L.A.; Backman, V. Measuring light scattering and absorption in corals with Inverse Spectroscopic Optical Coherence Tomography (ISOCT): A new tool for non-invasive monitoring. Sci. Rep. 2019, 9, 14148. [Google Scholar] [CrossRef] [PubMed]
- Wijesinghe, R.E.; Lee, S.-Y.; Ravichandran, N.K.; Shirazi, M.F.; Moon, B.; Jung, H.-Y.; Jeon, M.; Kim, J. Bio-photonic detection method for morphological analysis of anthracnose disease and physiological disorders of Diospyros kaki. Opt. Rev. 2017, 24, 199–205. [Google Scholar] [CrossRef]
- Anthracnose Plant Disease. Science & Tech. Available online: https://www.britannica.com/science/anthracnose (accessed on 1 April 2025).
- Wijesinghe, R.; Lee, S.-Y.; Ravichandran, N.K.; Shirazi, M.F.; Kim, P.; Jung, H.-Y.; Jeon, M.; Kim, J. Optical screening of Venturianashicola caused Pyruspyrifolia (Asian pear) scab using optical coherence tomography. Int. J. Appl. Eng. Res. 2016, 11, 7728–7731. [Google Scholar]
- Wijesinghe, R.E.; Lee, S.-Y.; Kim, P.; Jung, H.-Y.; Jeon, M.; Kim, J. Optical sensing method to analyze germination rate of Capsicum annum seeds treated with growth-promoting chemical compounds using optical coherence tomography. J. Biomed. Opt. 2017, 22, 91502. [Google Scholar] [CrossRef]
- Wijesinghe, R.E.; Lee, S.-Y.; Ravichandran, N.K.; Shirazi, M.F.; Kim, P.; Jung, H.-Y.; Jeon, M.; Kim, J. Biophotonic approach for the characterization of initial bitter-rot progression on apple specimens using optical coherence tomography assessments. Sci. Rep. 2018, 8, 15816. [Google Scholar] [CrossRef]
- Ravichandran, N.K.; Wijesinghe, R.E.; Shirazi, M.F.; Park, K.; Lee, S.-Y.; Jung, H.-Y.; Jeon, M.; Kim, J. In Vivo Monitoring on Growth and Spread of Gray Leaf Spot Disease in Capsicum annuum Leaf Using Spectral Domain Optical Coherence Tomography. J. Spectrosc. 2016, 2016, 1–6. [Google Scholar] [CrossRef]
- Lee, D.-H.; Back, C.-G.; Win, N.K.K.; Choi, K.-H.; Kim, K.-M.; Kang, I.-K.; Choi, C.; Yoon, T.-M.; Uhm, J.Y.; Jung, H.-Y. Biological Characterization of Marssonina coronaria Associated with Apple Blotch Disease. Mycobiology 2011, 39, 200–205. [Google Scholar] [CrossRef]
- Lee, S.-Y.; Lee, C.; Kim, J.; Jung, H.-Y. Application of optical coherence tomography to detect Cucumber green mottle mosaic virus (CGMMV) infected cucumber seed. Hortic. Environ. Biotechnol. 2012, 53, 428–433. [Google Scholar] [CrossRef]
- Lee, C.; Lee, S.-Y.; Kim, J.-Y.; Jung, H.-Y.; Kim, J. Optical sensing method for screening disease in melon seeds by using optical coherence tomography. Sensors 2011, 11, 9467–9477. [Google Scholar] [CrossRef]
- Ford, H.; Tatam, R.; Landahl, S.; Terry, L. Investigation of disease in stored onions using optical coherence tomography. In Proceedings of the IV International Conference Postharvest Unlimited, Leavenworth, WA, USA, 22–26 May 2011; Volume 945, pp. 247–254. [Google Scholar]
- Yoon, T.; Lee, B.H. Identification of Fungus-infected Tomato Seeds Based on Full-Field Optical Coherence Tomography. Curr. Opt. Photonics 2019, 3, 571–576. [Google Scholar]
- Tzu Hao, C.; Tan, K.M.; Ng, B.K.; Razul, S.G.; Tay, C.M.; Chia, T.F.; Poh, W.T. Diagnosis of virus infection in orchid plants with high-resolution optical coherence tomography. J. Biomed. Opt. 2009, 14, 014006. [Google Scholar]
- Meglinski, I.; Buranachai, C.; Terry, L. Plant photonics: Application of optical coherence tomography to monitor defects and rots in onion. Laser Phys. Lett. 2010, 7, 307–310. [Google Scholar] [CrossRef]
- Sapozhnikova, V.; Kamensky, V.; Kuranov, R. Optical coherence tomography for visualization of plant tissues. In Proceedings of the International Conference on Lasers, Applications, and Technologies 2002, Moscow, Russia, 22–27 June 2002; Volume 5149. [Google Scholar]
- Srimal, L.K.T.; Rajagopalan, U.M.; Kadono, H. Optical Coherence Tomography biospeckle signal analysis to investigate response of plant leaves to ozone. In Proceedings of the 23rd Congress of International Commission for Optics (ICO23), Santiago de Compostela, Spain, 26–29 August 2014. [Google Scholar]
- Verboven, P.; Nemeth, A.; Abera, M.K.; Bongaers, E.; Daelemans, D.; Estrade, P.; Herremans, E.; Hertog, M.; Saeys, W.; Vanstreels, E.; et al. Optical coherence tomography visualizes microstructure of apple peel. Postharvest Biol. Technol. 2013, 78, 123–132. [Google Scholar] [CrossRef]
- Li, M.; Verboven, P.; Buchsbaum, A.; Cantre, D.; Nicolaï, B.; Heyes, J.; Mowat, A.; East, A. Characterising kiwifruit (Actinidia sp.) near skin cellular structures using optical coherence tomography. Postharvest Biol. Technol. 2015, 110, 247–256. [Google Scholar] [CrossRef]
- Wijesinghe, R.; Lee, S.-Y.; Ravichandran, N.K.; Han, S.; Jeong, H.; Han, Y.; Jung, H.-Y.; Kim, P.; Jeon, M.; Kim, J. Optical coherence tomography-integrated, wearable (backpack-type), compact diagnostic imaging modality for in situ leaf quality assessment. Appl. Opt. 2017, 56, D108–D114. [Google Scholar] [CrossRef]
- Larimer, C.J.; Denis, E.H.; Suter, J.D.; Moran, J.J. Optical coherence tomography imaging of plant root growth in soil. Appl. Opt. 2020, 59, 2474–2481. [Google Scholar] [CrossRef]
- Srimal, L.K.; Kadono, H.; Rajagopalan, U. Optical coherence tomography biospeckle imaging for fast monitoring varying surface responses of a plant leaf under ozone stress. In Proceedings of the 2013 SPIE, SPIE SeTBio, Yokohama, Japan, 23–26 April 2013; Volume 8881. [Google Scholar]
- Srimal, L.K.T.; Rajagopalan, U.M.; Kadono, H. Functional optical coherence tomography (fOCT) biospeckle imaging to investigate response of plant leaves to ultra-short term exposure of Ozone. J. Phys. Conf. Ser. 2015, 605, 012013. [Google Scholar] [CrossRef]
- Boccara, M.; Schwartz, W.; Guiot, E.; Vidal, G.; De Paepe, R.; Dubois, A.; Boccara, A. Early chloroplastic alterations analysed by optical coherence tomography during a harpin-induced hypersensitive response. Plant J. 2007, 50, 338–346. [Google Scholar] [CrossRef]
- Williams, J.; Lin, W.C.; Li, W.; Wang, S.; Matcher, S.J.; Chauvet, A.A.P. Translating Optical Coherence Tomography Technologies from Clinical Studies to Botany: Real Time Imaging of Long-Distance Signaling in Plants. In Proceedings of the Optical Coherence Tomography, Washington, DC, USA, 20–23 April 2020. [Google Scholar]
- Cheong, H.; Devalla, S.K.; Chuangsuwanich, T.; Tun, T.A.; Wang, X.; Aung, T.; Schmetterer, L.; Buist, M.L.; Boote, C.; Thiéry, A.H.; et al. OCT-GAN: Single step shadow and noise removal from optical coherence tomography images of the human optic nerve head. Biomed. Opt. Express 2021, 12, 1482–1498. [Google Scholar] [CrossRef]
- Ramachandiran, R.; Gayathri, K.; Ishwariya, A.; Roopa, G. A Survey on Speckle Removal for Optical Coherence Tomography Images. In Proceedings of the 2019 IEEE International Conference on System, Computation, Automation and Networking (ICSCAN), Pondicherry, India, 29–30 March 2019. [Google Scholar]
- Rueckert, D.; Schnabel, J.A. Registration and Segmentation in Medical Imaging. In Registration and Recognition in Images and Videos; Cipolla, R., Battiato, S., Farinella, G.M., Eds.; Springer: Berlin/Heidelberg, Germany, 2014; pp. 137–156. [Google Scholar]
- Rufai, S.R. Handheld optical coherence tomography removes barriers to imaging the eyes of young children. Eye 2022, 36, 907–908. [Google Scholar] [CrossRef]
- Handheld Optical Coherence Tomography. 2024. Available online: https://cordis.europa.eu/project/id/871312 (accessed on 1 April 2025).

Disclaimer/Publisher’s Note: The statements, opinions and data contained in all publications are solely those of the individual author(s) and contributor(s) and not of MDPI and/or the editor(s). MDPI and/or the editor(s) disclaim responsibility for any injury to people or property resulting from any ideas, methods, instructions or products referred to in the content. |
© 2025 by the authors. Licensee MDPI, Basel, Switzerland. This article is an open access article distributed under the terms and conditions of the Creative Commons Attribution (CC BY) license (https://creativecommons.org/licenses/by/4.0/).
Share and Cite
Sasi, G.S.; Chauvet, A.A.P. Using Optical Coherence Tomography in Plant Biology Research: Review and Prospects. Sensors 2025, 25, 2467. https://doi.org/10.3390/s25082467
Sasi GS, Chauvet AAP. Using Optical Coherence Tomography in Plant Biology Research: Review and Prospects. Sensors. 2025; 25(8):2467. https://doi.org/10.3390/s25082467
Chicago/Turabian StyleSasi, Ghada Salem, and Adrien Alexis Paul Chauvet. 2025. "Using Optical Coherence Tomography in Plant Biology Research: Review and Prospects" Sensors 25, no. 8: 2467. https://doi.org/10.3390/s25082467
APA StyleSasi, G. S., & Chauvet, A. A. P. (2025). Using Optical Coherence Tomography in Plant Biology Research: Review and Prospects. Sensors, 25(8), 2467. https://doi.org/10.3390/s25082467