

Monitoring Construction Workers’ Mental Workload Due to Heat Exposure Using Heart Rate Variability and Eye Movement: A Study on Pipe Workers


Abstract
1. Introduction
2. Materials and Methods
2.1. Experimental Design
2.1.1. Subjects and Apparatus
2.1.2. Experimental Conditions
2.1.3. Experimental Process
2.2. Data Collection and Pre-Processing
2.3. HRV Features Computation
2.4. Eye Tracking Features Computation
2.5. Prediction Model Development
3. Results
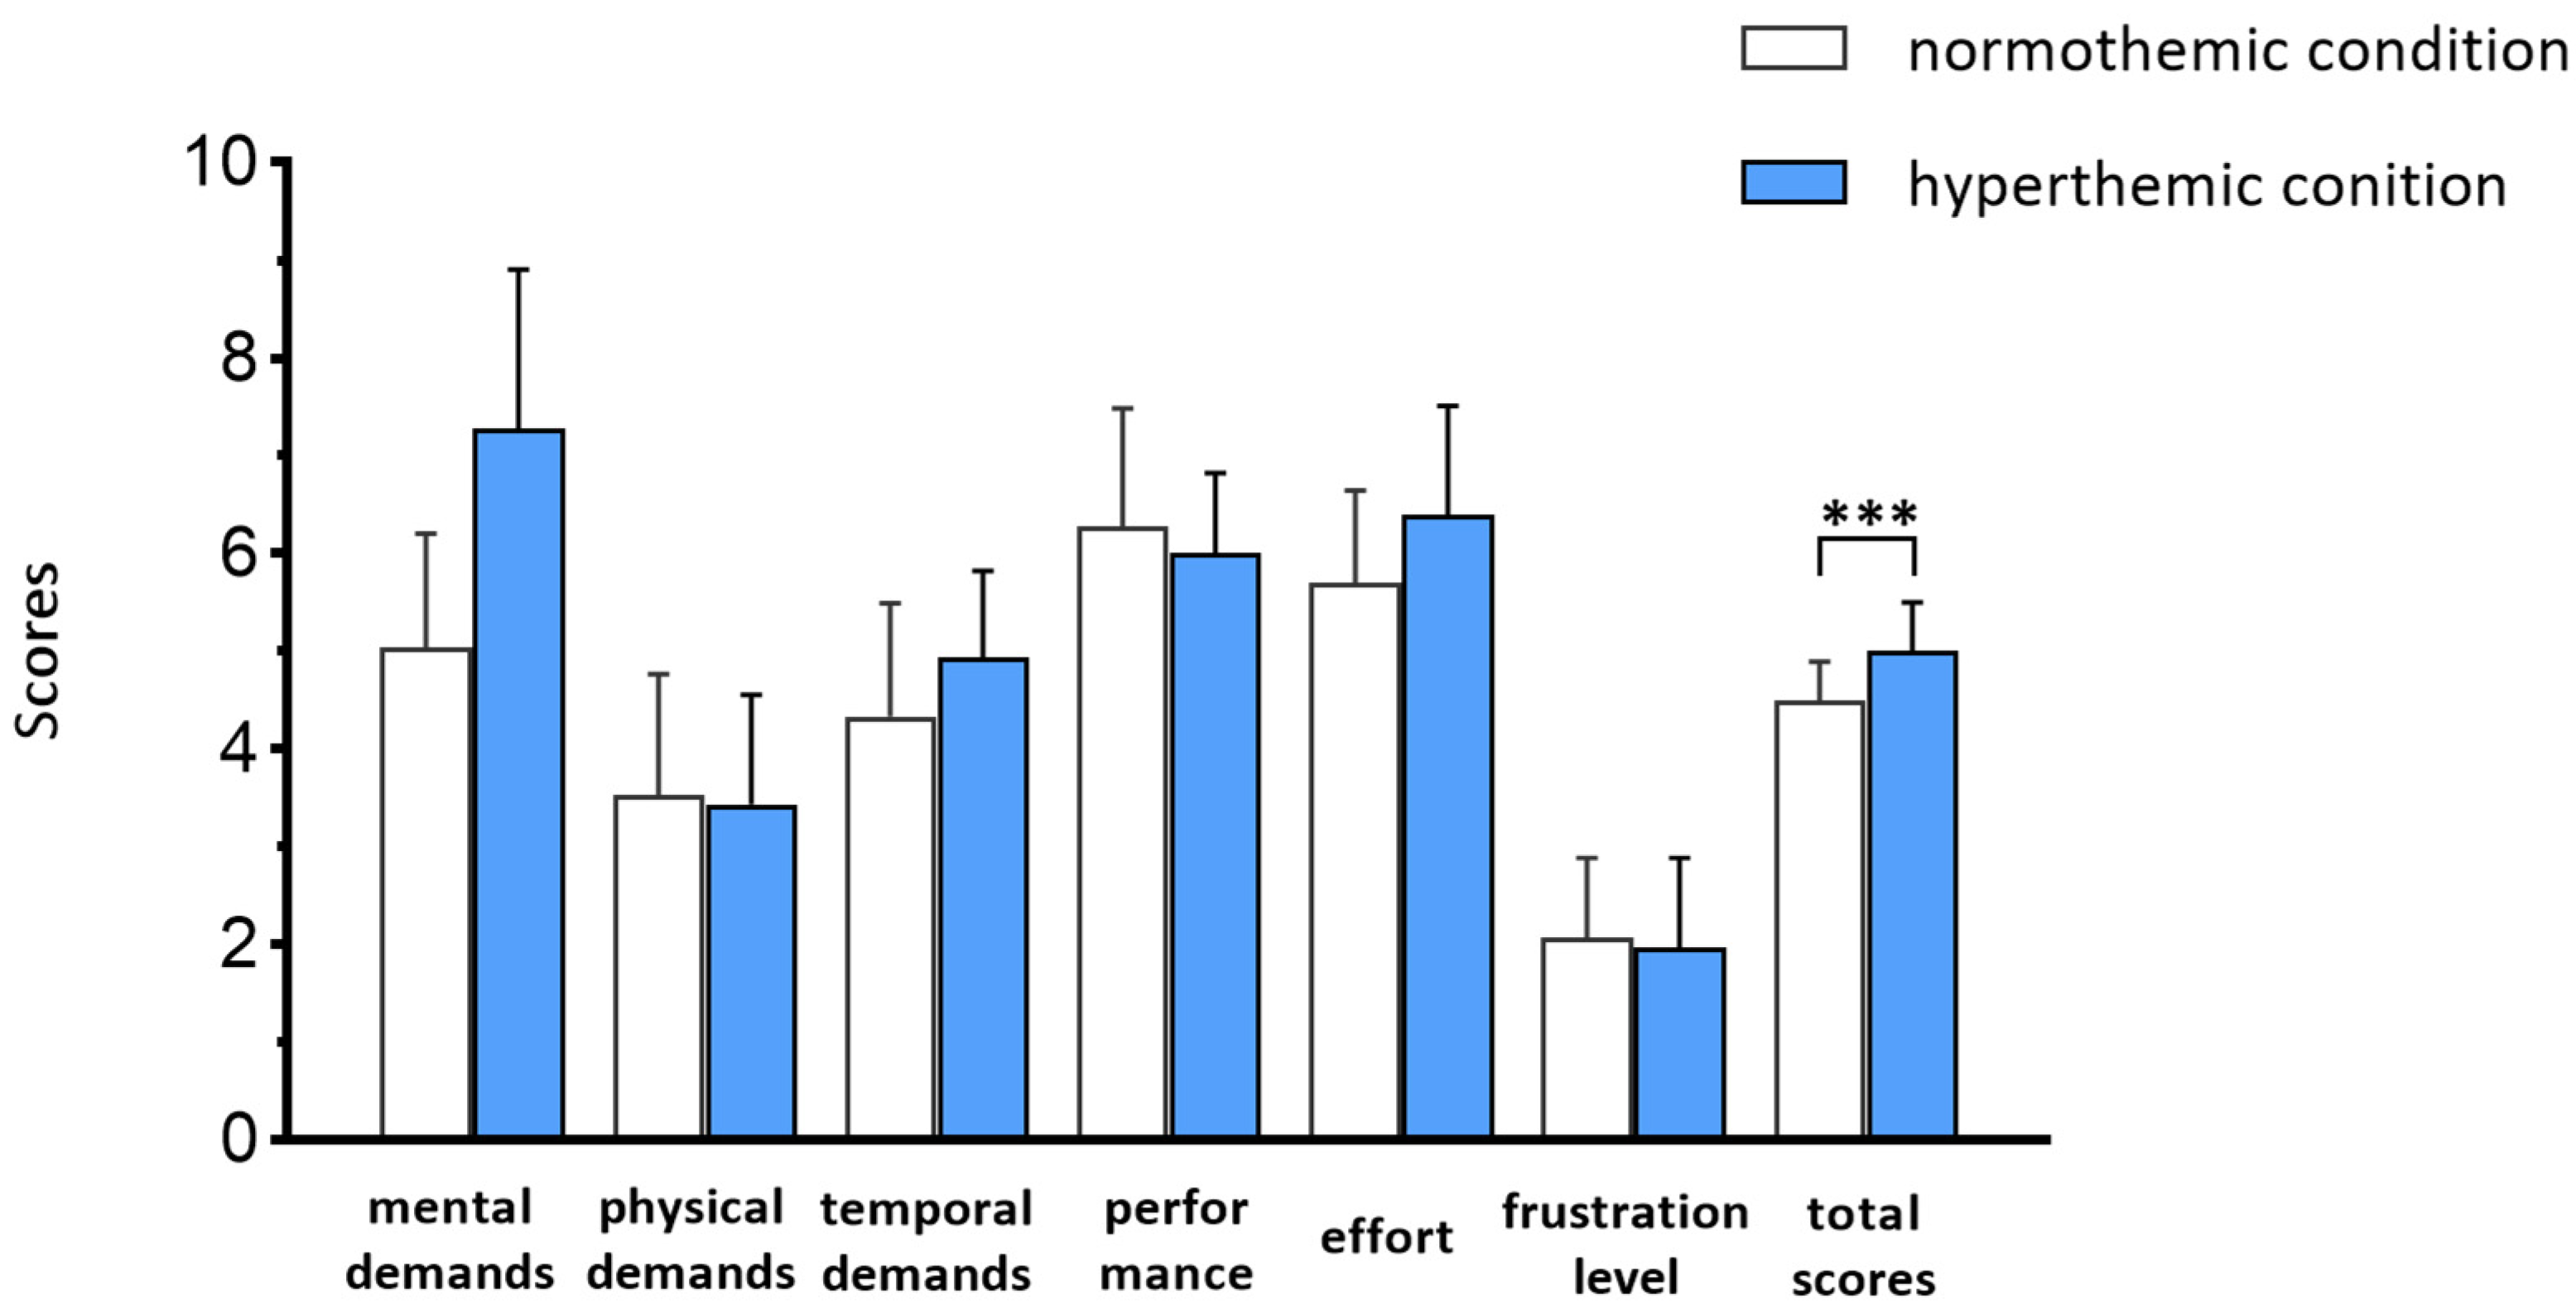
3.1. Task Performance and NASA-TLX
3.2. Statistical Results of HRV and Eye Movement Features
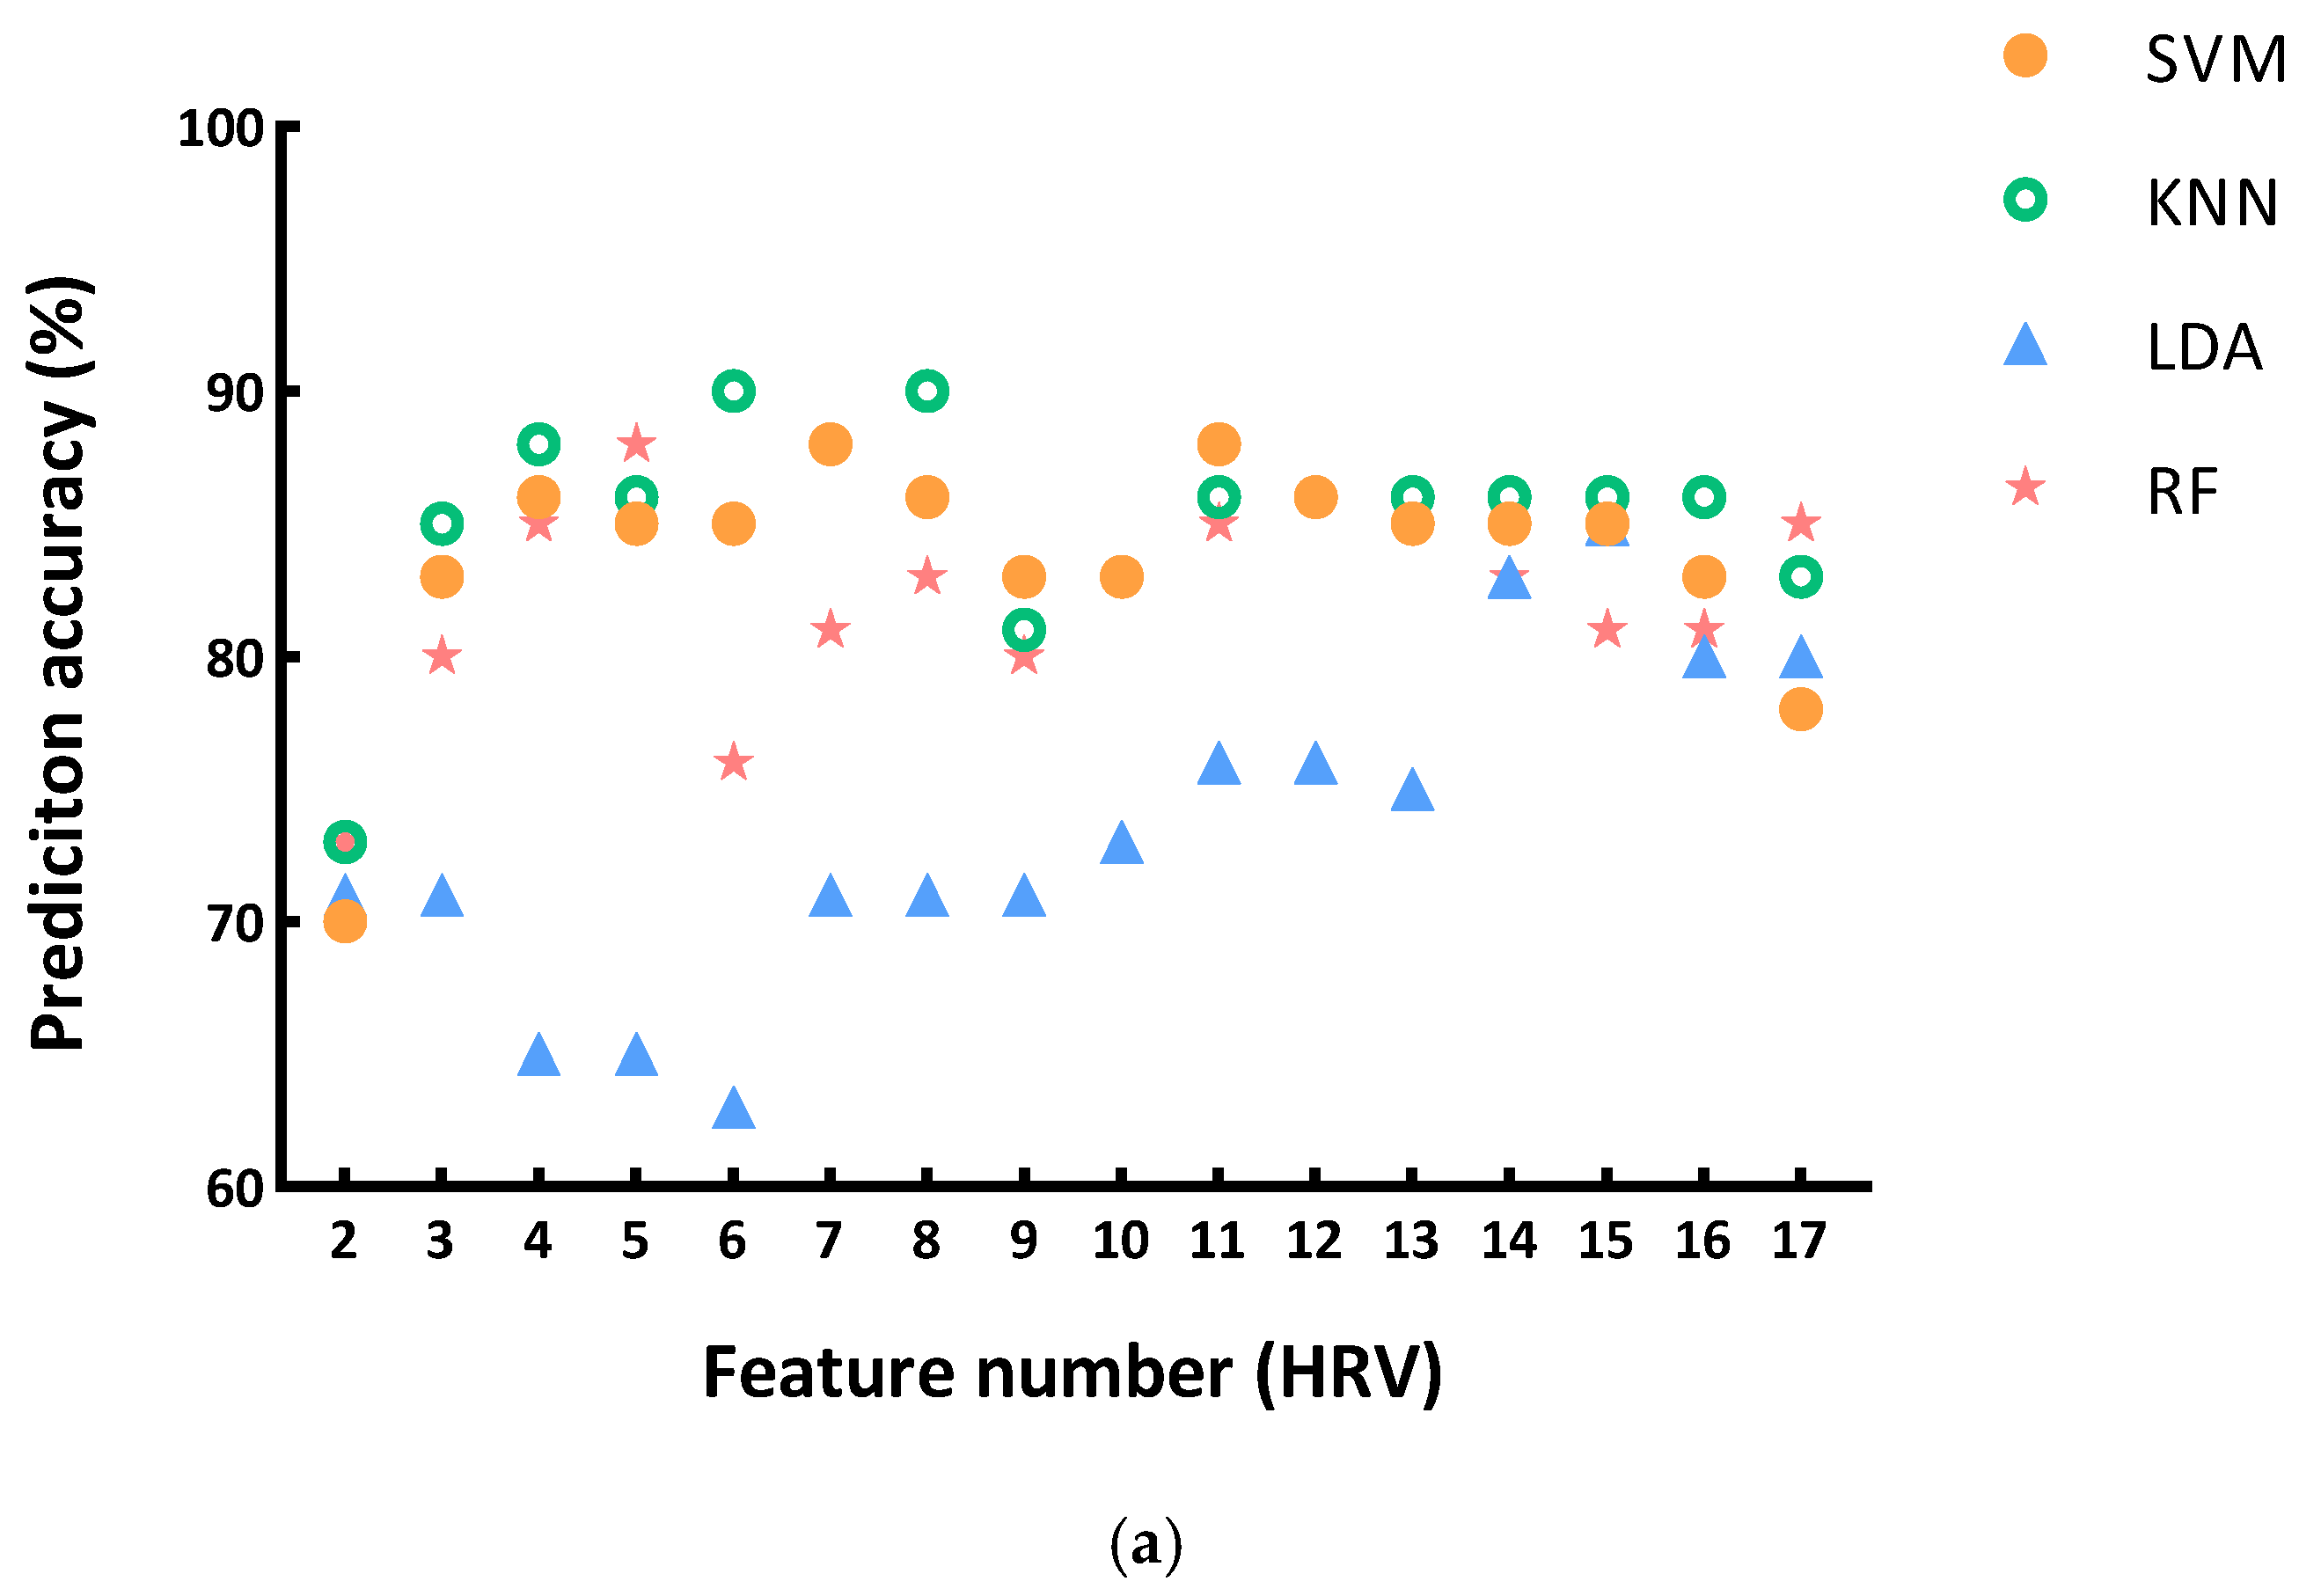
3.3. Model Evaluation
4. Discussion
4.1. Physiological Features and Mental Workload
4.2. Performance of Prediction Models
4.3. Implications
4.4. Limitations and Future Work
5. Conclusions
Author Contributions
Funding
Institutional Review Board Statement
Informed Consent Statement
Data Availability Statement
Conflicts of Interest
References
- Fang, D.; Zhao, C.; Zhang, M. A Cognitive Model of Construction Workers’ Unsafe Behaviors. J. Constr. Eng. Manag. Asce 2016, 142, 04016039. [Google Scholar] [CrossRef]
- Wickens, C.D. Multiple Resources and Mental Workload. Hum. Factors J. Hum. Factors Ergon. Soc. 2008, 50, 449–455. [Google Scholar] [CrossRef]
- Aghajani, H.; Garbey, M.; Omurtag, A. Measuring Mental Workload with EEG+fNIRS. Front. Hum. Neurosci. 2017, 11, 359. [Google Scholar] [CrossRef]
- Kim, S.; Heerim, L.; Sungjoo, H.; June-Seong, Y.; Son, J. Construction workers’ awareness of safety information depending on physical and mental load. J. Asian Archit. Build. Eng. 2022, 21, 1067–1077. [Google Scholar] [CrossRef]
- Chen, J.; Song, X.; Lin, Z. Revealing the “Invisible Gorilla” in construction: Estimating construction safety through mental workload assessment. Autom. Constr. 2016, 63, 173–183. [Google Scholar] [CrossRef]
- Gaoua, N.; Grantham, J.; El Massioui, F.; Girard, O.; Racinais, S. Cognitive decrements do not follow neuromuscular alterations during passive heat exposure. Int. J. Hyperth. 2011, 27, 10–19. [Google Scholar] [CrossRef] [PubMed]
- Sweller, J. Cognitive load theory, learning difficulty, and instructional design. Learn. Instr. 1994, 4, 295–312. [Google Scholar] [CrossRef]
- Hancock, P.A.; Vasmatzidis, I. Effects of heat stress on cognitive performance: The current state of knowledge. Int. J. Hyperth. 2003, 19, 355–372. [Google Scholar] [CrossRef]
- Han, Y.; Yin, Z.; Zhang, J.; Jin, R.; Yang, T. Eye-Tracking Experimental Study Investigating the Influence Factors of Construction Safety Hazard Recognition. J. Constr. Eng. Manag. 2020, 146, 04020091. [Google Scholar] [CrossRef]
- Rowlinson, S.; YunyanJia, A.; Li, B.; ChuanjingJu, C. Management of climatic heat stress risk in construction: A review of practices, methodologies, and future research. Accid. Anal. Prev. 2014, 66, 187–198. [Google Scholar] [CrossRef]
- Ke, J.; Liao, P.; Li, J.; Luo, X. Effect of information load and cognitive style on cognitive load of visualized dashboards for construction-related activities. Autom. Constr. 2023, 154, 105029. [Google Scholar] [CrossRef]
- Lohani, M.; Payne, B.R.; Strayer, D.L. A Review of Psychophysiological Measures to Assess Cognitive States in Real-World Driving. Front. Hum. Neurosci. 2019, 13, 57. [Google Scholar] [CrossRef] [PubMed]
- Hart, S.G.; Staveland, L.E. Development of NASA-TLX (Task Load Index): Results of Empirical and Theoretical Research. Adv. Psychol. 1988, 52, 139–183. [Google Scholar]
- Yurko, Y.Y.; Scerbo, M.W.; Prabhu, A.S.; Acker, C.E.; Stefanidis, D. Higher mental workload is associated with poorer laparoscopic performance as measured by the NASA-TLX tool. Simul. Health 2010, 5, 267–271. [Google Scholar] [CrossRef]
- Sahayadhas, A.; Sundaraj, K.; Murugappan, M. Detecting Driver Drowsiness Based on Sensors: A Review. Sensors 2012, 12, 16937–16953. [Google Scholar] [CrossRef]
- Caldwell, J.A.; Mallis, M.M.; Caldwell, J.L.; Paul, M.A.; Miller, J.C.; Neri, D.F. Fatigue countermeasures in aviation. Aviat. Space Environ. Med. 2009, 80, 29–59. [Google Scholar] [CrossRef]
- Hogervorst, M.A.; Brouwer, A.-M.; van Erp, J.B.F. Combining and comparing EEG, peripheral physiology and eye-related measures for the assessment of mental workload. Front. Neurosci. 2014, 8, 322. [Google Scholar] [CrossRef] [PubMed]
- Chen, J.; Taylor John, E.; Comu, S. Assessing Task Mental Workload in Construction Projects: A Novel Electroencephalography Approach. J. Constr. Eng. Manag. 2017, 143, 04017053. [Google Scholar] [CrossRef]
- Qin, Y.; Bulbul, T. Electroencephalogram-based mental workload prediction for using Augmented Reality head mounted display in construction assembly: A deep learning approach. Autom. Constr. 2023, 152, 104892. [Google Scholar] [CrossRef]
- LaRocco, J.; Le, M.D.; Paeng, D.G. A Systemic Review of Available Low-Cost EEG Headsets Used for Drowsiness Detection. Front. Neuroinform 2020, 14, 553352. [Google Scholar] [CrossRef]
- Shaffer, F.; Ginsberg, J.P. An Overview of Heart Rate Variability Metrics and Norms. Front. Public Health 2017, 5, 258. [Google Scholar] [CrossRef] [PubMed]
- Cohen, S.; Janicki-Deverts, D.; Miller, G.E. Psychological stress and disease. JAMA 2007, 298, 1685–1687. [Google Scholar] [CrossRef] [PubMed]
- Lown, B.; DeSilva, R.A. Roles of psychologic stress and autonomic nervous system changes in provocation of ventricular premature complexes. Am. J. Cardiol. 1978, 41, 979–985. [Google Scholar] [CrossRef] [PubMed]
- Mulder, T.; de Waard, D.; Brookhuis, K.A. Estimating mental effort using heart rate and heart rate variability. In Handbook of Human Factors and Ergonomics Methods; CRC Press: Boca Raton, FL, USA, 2004. [Google Scholar]
- Shao, S.; Wang, T.; Wang, Y.; Su, Y.; Song, C.; Yao, C. Research of HRV as a Measure of Mental Workload in Human and Dual-Arm Robot Interaction. Electronics 2020, 9, 2174. [Google Scholar] [CrossRef]
- Fallahi, M.; Motamedzade, M.; Heidarimoghadam, R.; Soltanian, A.R.; Miyake, S. Effects of mental workload on physiological and subjective responses during traffic density monitoring: A field study. Appl. Ergon. 2016, 52, 95–103. [Google Scholar] [CrossRef]
- The, A.F.; Reijmerink, I.; van der Laan, M.; Cnossen, F. Heart rate variability as a measure of mental stress in surgery: A systematic review. Int. Arch. Occup. Environ. Health 2020, 93, 805–821. [Google Scholar] [CrossRef]
- Zagermann, J.; Pfeil, U.; Reiterer, H. Measuring Cognitive Load using Eye Tracking Technology in Visual Computing. In Proceedings of the Proceedings of the Sixth Workshop on Beyond Time and Errors on Novel Evaluation Methods for Visualization, Baltimore, MD, USA, 24 October 2016; Association for Computing Machinery: Baltimore, MD, USA, 2016; pp. 78–85. [Google Scholar]
- Tao, D.; Tan, H.; Wang, H.; Zhang, X.; Qu, X.; Zhang, T. A Systematic Review of Physiological Measures of Mental Workload. Int. J. Environ. Res. Public Health 2019, 16, 2716. [Google Scholar] [CrossRef]
- Ministry of Human Resources and Social Security of the People’s Republic of China. Pipeline Worker Occupational Skill Standards; China Labor and Social Security Publishing House: Beijing, China, 2018. (In Chinese) [Google Scholar]
- Zhu, M.; Liu, W.; Wargocki, P. Changes in EEG Signals During the Cognitive Activity at Varying Air Temperature and Relative Humidity. J. Expo. Sci. Environ. Epidemiol. 2020, 30, 285–298. [Google Scholar] [CrossRef]
- Jin, L.; Zhang, Y.; Zhang, Z. Human responses to high humidity in elevated temperatures for people in hot-humid climates. Build. Environ. 2017, 114, 257–266. [Google Scholar] [CrossRef]
- Tarvainen, M.P.; Niskanen, J.P.; Lipponen, J.A.; Ranta-Aho, P.O.; Karjalainen, P.A. Kubios HRV--heart rate variability analysis software. Comput. Methods Programs Biomed. 2014, 113, 210–220. [Google Scholar] [CrossRef]
- Pan, J.; Tompkins, W.J. A Real-Time QRS Detection Algorithm. IEEE Trans. Biomed. Eng. 1985, BME-32, 230–236. [Google Scholar] [CrossRef] [PubMed]
- Chen, S.; Epps, J.; Ruiz, N.; Chen, F. Eye activity as a measure of human mental effort in HCI. In Proceedings of the Proceedings of the 16th International Conference on Intelligent User Interfaces, Palo Alto, CA, USA, 13–16 February 2011; Association for Computing Machinery: Palo Alto, CA, USA, 2011; pp. 315–318. [Google Scholar]
- Dong, W.; Zheng, L.; Liu, B.; Meng, L. Using Eye Tracking to Explore Differences in Map-Based Spatial Ability between Geographers and Non-Geographers. ISPRS Int. J. Geo Inf. 2018, 7, 337. [Google Scholar] [CrossRef]
- Heart rate variability: Standards of measurement, physiological interpretation and clinical use. Task Force of the European Society of Cardiology and the North American Society of Pacing and Electrophysiology. Circulation 1996, 93, 1043–1065. [CrossRef]
- Jarodzka, H.; Balslev, T.; Holmqvist, K.; Nyström, M.; Scheiter, K.; Gerjets, P.; Eika, B. Conveying clinical reasoning based on visual observation via eye-movement modelling examples. Instr. Sci. 2012, 40, 813–827. [Google Scholar] [CrossRef]
- Barrios, V.M.G.; Gütl, C.; Preis, A.; Pivec, M.; Trummer, C. AdELE: A Framework for Adaptive E-Learning through Eye Tracking. Proc. IKNOW 2004, 609–616. [Google Scholar]
- Appel, T.; Scharinger, C.; Gerjets, P.; Kasneci, E. Cross-subject workload classification using pupil-related measures. In Proceedings of the Proceedings of the 2018 ACM Symposium on Eye Tracking Research & Applications, Warsaw, Poland, 14–17 June 2018; Association for Computing Machinery: Warsaw, Poland, 2018; p. 4. [Google Scholar]
- Buettner, R. Cognitive Workload of Humans Using Artificial Intelligence Systems: Towards Objective Measurement Applying Eye-Tracking Technology. In Proceedings of the KI 2013: Advances in Artificial Intelligence, Koblenz, Germany, 16–20 September 2013; Timm, I.J., Thimm, M., Eds.; Springer: Berlin/Heidelberg, Germany, 2013; pp. 37–48. [Google Scholar]
- Huang, S.; Li, J.; Zhang, P.; Zhang, W. Detection of mental fatigue state with wearable ECG devices. Int. J. Med. Inform. 2018, 119, 39–46. [Google Scholar] [CrossRef]
- Esterman, M.; Tamber-Rosenau, B.J.; Chiu, Y.C.; Yantis, S. Avoiding non-independence in fMRI data analysis: Leave one subject out. Neuroimage 2010, 50, 572–576. [Google Scholar] [CrossRef]
- Hawkins, D.M. The Problem of Overfitting. J. Chem. Inf. Comput. Sci. 2004, 44, 1–12. [Google Scholar] [CrossRef]
- Zhang, Y.; Kaber, D. Evaluation of Strategies for Integrated Classification of Visual-Manual and Cognitive Distractions in Driving. Hum. Factors 2016, 58, 944–958. [Google Scholar] [CrossRef]
- Altman, N.S. An Introduction to Kernel and Nearest-Neighbor Nonparametric Regression. Am. Stat. 1992, 46, 175–185. [Google Scholar] [CrossRef]
- Webb, A.R.; Copsey, K.D. Statistical Pattern Recognition; Wiley: Hoboken, NJ, USA, 2002; pp. 459–490. [Google Scholar]
- Lotte, F.; Congedo, M.; Lécuyer, A.; Lamarche, F.; Arnaldi, B. A review of classification algorithms for EEG-based brain-computer interfaces. J. Neural Eng. 2007, 4, R1–R13. [Google Scholar] [CrossRef]
- Breiman, L. Random Forests. Mach. Learn. 2001, 45, 5–32. [Google Scholar] [CrossRef]
- Romine, W.L.; Schroeder, N.L.; Graft, J.; Yang, F.; Sadeghi, R.; Zabihimayvan, M.; Kadariya, D.; Banerjee, T. Using Machine Learning to Train a Wearable Device for Measuring Students’ Cognitive Load during Problem-Solving Activities Based on Electrodermal Activity, Body Temperature, and Heart Rate: Development of a Cognitive Load Tracker for Both Personal and Classroom Use. Sensors 2020, 20, 4833. [Google Scholar] [CrossRef]
- Melillo, P.; Bracale, M.; Pecchia, L. Nonlinear Heart Rate Variability features for real-life stress detection. Case study: Students under stress due to university examination. BioMedical Eng. OnLine 2011, 10, 96. [Google Scholar] [CrossRef]
- Heine, T.; Lenis, G.; Reichensperger, P.; Beran, T.; Doessel, O.; Deml, B. Electrocardiographic features for the measurement of drivers’ mental workload. Appl. Ergon. 2017, 61, 31–43. [Google Scholar] [CrossRef] [PubMed]
- Raptis, G.E.; Fidas, C.A.; Avouris, N.M. Using Eye Tracking to Identify Cognitive Differences: A Brief Literature Review. In Proceedings of the Proceedings of the 20th Pan-Hellenic Conference on Informatics, Patras, Greece, 10–12 November 2016; Association for Computing Machinery: Patras, Greece, 2016; p. 21. [Google Scholar]
- Ding, Z.; Xiong, Z.; Ouyang, Y. A Bibliometric Analysis of Neuroscience Tools Use in Construction Health and Safety Management. Sensors 2023, 23, 9522. [Google Scholar] [CrossRef]
- Deng, Z.; Zhu, X.; Cheng, D.; Zong, M.; Zhang, S. Efficient kNN classification algorithm for big data. Neurocomputing 2016, 195, 143–148. [Google Scholar] [CrossRef]
- Umer, W.; Yu, Y.; Antwi-Afari, M.F.; Jue, L.; Siddiqui, M.K.; Li, H. Heart rate variability based physical exertion monitoring for manual material handling tasks. Int. J. Ind. Ergon. 2022, 89, 103301. [Google Scholar] [CrossRef]
- Anwer, S.; Li, H.; Umer, W.; Antwi-Afari, M.F.; Mehmood, I.; Yu, Y.; Haas, C.; Wong, A.Y.L. Identification and Classification of Physical Fatigue in Construction Workers Using Linear and Nonlinear Heart Rate Variability Measurements. J. Constr. Eng. Manag. 2023, 149, 04023057. [Google Scholar] [CrossRef]
- Qin, H.; Zhou, X.; Ou, X.; Liu, Y.; Xue, C. Detection of mental fatigue state using heart rate variability and eye metrics during simulated flight. Hum. Factors Ergon. Manuf. Serv. Ind. 2021, 31, 637–651. [Google Scholar] [CrossRef]


| HRV Feature | Unit | Description (Equation) |
|---|---|---|
| Time-domain features | ||
| mRR | [ms] | The mean of RR intervals () |
| SDRR | [ms] | The standard deviation of RR intervals () |
| RMSSD | [ms] | The square root of the mean squared differences between successive RR intervals () |
| PNN50 | [%] | Number of interval differences in successive RR intervals greater than 50 ms () |
| Frequency-domain features | ||
| VLF | [ms2] | Absolute powers of very low frequency band (0–0.04 Hz) |
| LF | [ms2] | Absolute powers of low frequency band (0.04–0.15 Hz) |
| HF | [ms2] | Absolute powers of high frequency band (0.15–0.4 Hz) |
| TP | [ms2] | The total energy of RR intervals |
| pVLF | [%] | Relative powers of VLF (VLF [ms2]/TP [ms2] × 100%) |
| pLF | [%] | Relative powers of LF (LF [ms2]/TP [ms2] × 100%) |
| pHF | [%] | Relative powers of HF (HF [ms2]/TP [ms2] × 100%) |
| LF/HF | [n.u.] | The ratio between LF and HF band powers |
| nLF | [n.u.] | Normalized low frequency power |
| nHF | [n.u.] | Normalized high frequency power |
| Non-linear features | ||
| SD2/SD1 | - | Ratio between SD2 and SD1 |
| ApEn | - | Approximate entropy |
| SampEn | - | Sample entropy |
| HRV Feature | Unit | Description (Equation) |
|---|---|---|
| Fixation-based features | ||
| Total fixation duration (TFD) | [s] | The whole period of fixation time during the whole task |
| Average fixation duration (MFD) | [s] | The ratio of total fixation periods to the total number of fixations |
| Fixation count (TFC) | / | The whole number of fixations during the whole task |
| Saccade-based features | ||
| Saccade count (SC) | / | The number of saccade events during the task |
| Average velocity of saccades (MSV) | [degree/s] | The average angular velocity of all saccade events |
| Average amplitude of saccades (MSA) | [degree] | The average amplitude of all saccades |
| Pupil features | ||
| Mean pupil diameter (MPD) | [mm] | The values of mean pupil diameter during the whole task |
| Standard deviation of pupil diameter (SPD) | [mm] | The standard deviation of pupil diameter during the whole task |
| HRV Features | NT-Task (Mean ± SD) | HT-Task | t | p |
|---|---|---|---|---|
| (Mean ± SD) | ||||
| mRR | 799.47 ± 77.66 | 794.46 ± 82.38 | 0.716 | 0.480 |
| SDRR | 24.25 ± 7.91 | 26.97 ± 6.38 | −1.929 | 0.064 |
| RMSSD | 27.47 ± 10.78 | 28.29 ± 9.30 | −0.659 | 0.515 |
| PNN50 | 9.09 ± 1.80 | 9.26 ± 1.45 | −0.121 | 0.904 |
| VLF | 45.32 ± 11.14 | 26.55 ± 2.88 | 2.093 | 0.045 |
| LF | 205.04 ± 85.83 | 212.34 ± 189.43 | 0.195 | 0.847 |
| HF | 260.16 ± 147.62 | 234.10 ± 121.13 | 1.346 | 0.189 |
| TP | 510.52 ± 202.67 | 472.99 ± 223.92 | 1.521 | 0.139 |
| pVLF | 0.081 ± 0.082 | 0.058 ± 0.025 | 1.711 | 0.097 |
| pLF | 0.436 ± 0.167 | 0.421 ± 0.221 | 0.332 | 0.742 |
| pHF | 0.482 ± 0.185 | 0.521 ± 0.211 | −0.864 | 0.394 |
| LF/HF | 1.407 ± 1.55 | 1.456 ± 2.275 | −0.098 | 0.922 |
| nLF | 44.62 ± 20.88 | 48.34 ± 13.81 | −1.417 | 0.167 |
| nHF | 54.92 ± 21.41 | 51.07 ± 14.51 | 1.483 | 0.149 |
| SD2/SD1 | 1.54 ± 0.47 | 1.73 ± 0.65 | −2.073 | 0.047 |
| ApEn | 0.97 ± 0.18 | 0.99 ± 0.15 | −1.366 | 0.183 |
| SampEn | 1.76 ± 0.22 | 1.88 ± 0.15 | −3.371 | 0.002 |
| Eye Movement Features | NT-Task (Mean ± SD) | HT-Task | t | p |
|---|---|---|---|---|
| (Mean ± SD) | ||||
| Total fixation duration (TFD) | 19.69 ± 3.26 | 22.63 ± 6.88 | −2.266 | 0.031 |
| Average fixation duration (MFD) | 9.79 ± 3.90 | 5.99 ± 2.74 | 5.161 | <0.001 |
| Total fixation count (TFC) | 2381.33 ± 1222.07 | 4240.33 ± 1739.35 | −6.533 | <0.001 |
| Saccade count (SC) | 2217.33 ± 1151.18 | 3597.33 ± 1618.87 | −5.472 | <0.001 |
| Average velocity of saccades (MSV) | 552.79 ± 74.17 | 561.00 ± 74.94 | −0.555 | 0.583 |
| Average amplitudes of saccades (MSA) | 16.36 ± 2.79 | 16.57 ± 2.82 | −0.466 | 0.645 |
| Mean pupil diameter (MPD) | 3.319 ± 0.584 | 3.349 ± 0.441 | −0.370 | 0.714 |
| Standard deviation of pupil diameter (SPD) | 0.550 ± 0.180 | 0.630 ± 0.272 | −1.395 | 0.174 |
| Applied Features | Prediction Accuracy | Model Evaluations |
|---|---|---|
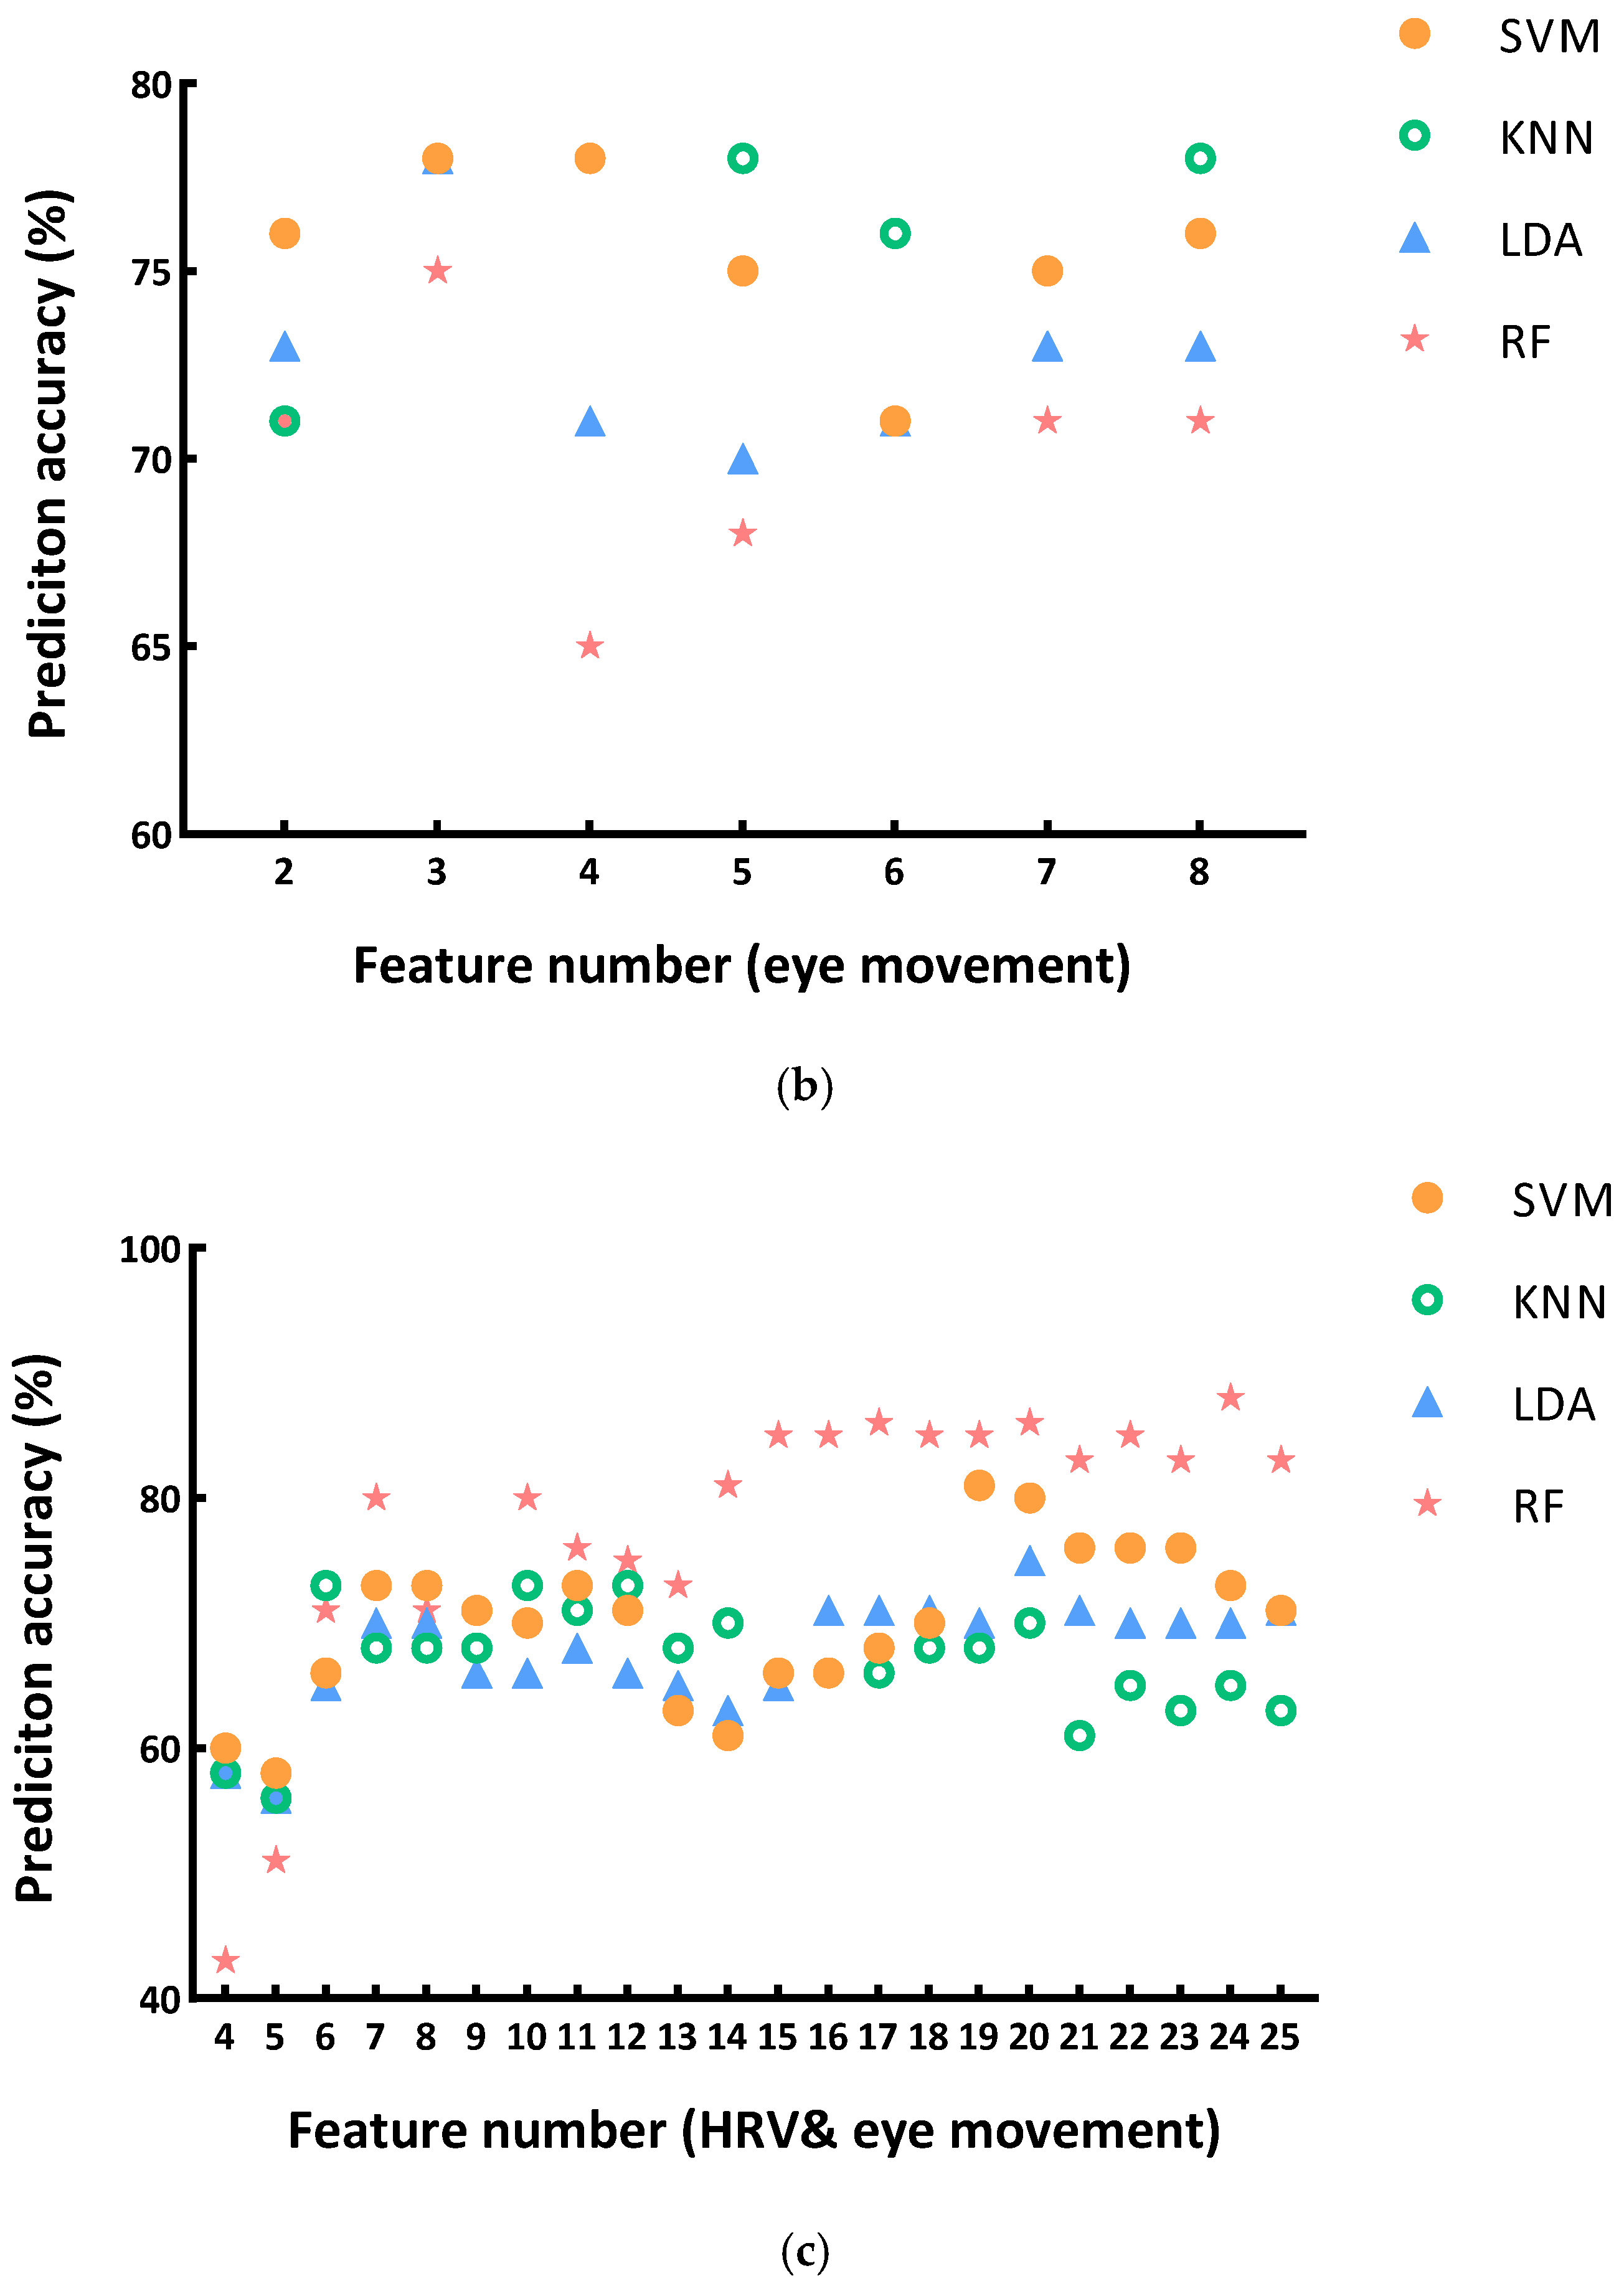
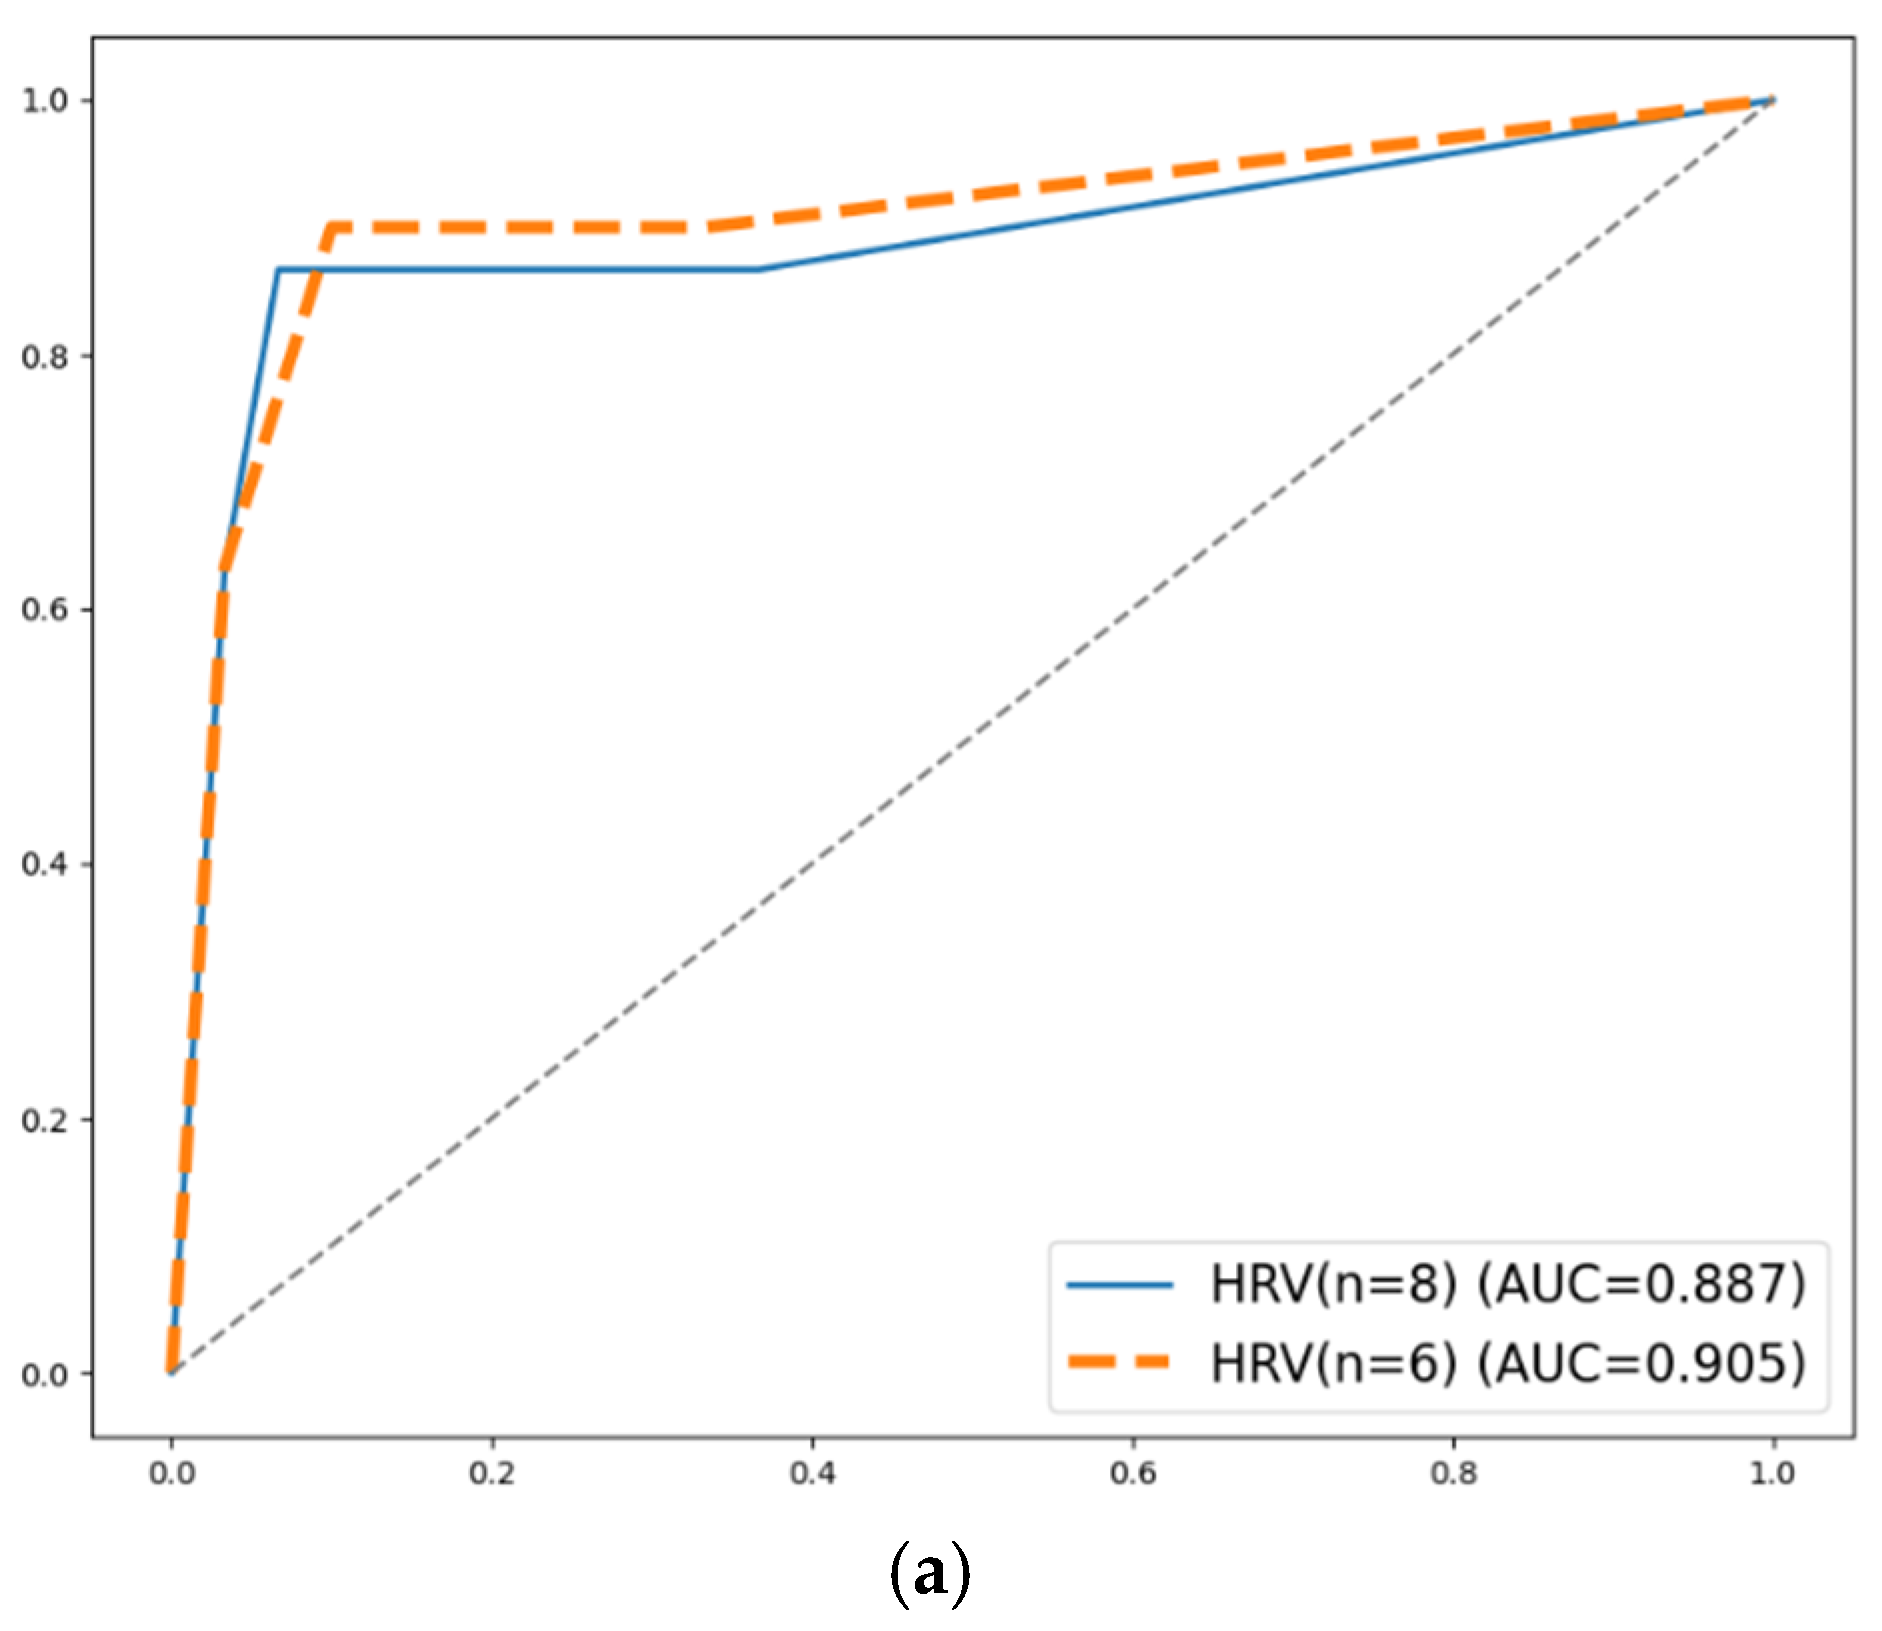
| HRV features (n = 6) | KNN, 90.00% | Recall = 0.900, Precision = 0.900, F1 = 0.900, AUC = 0.905 |
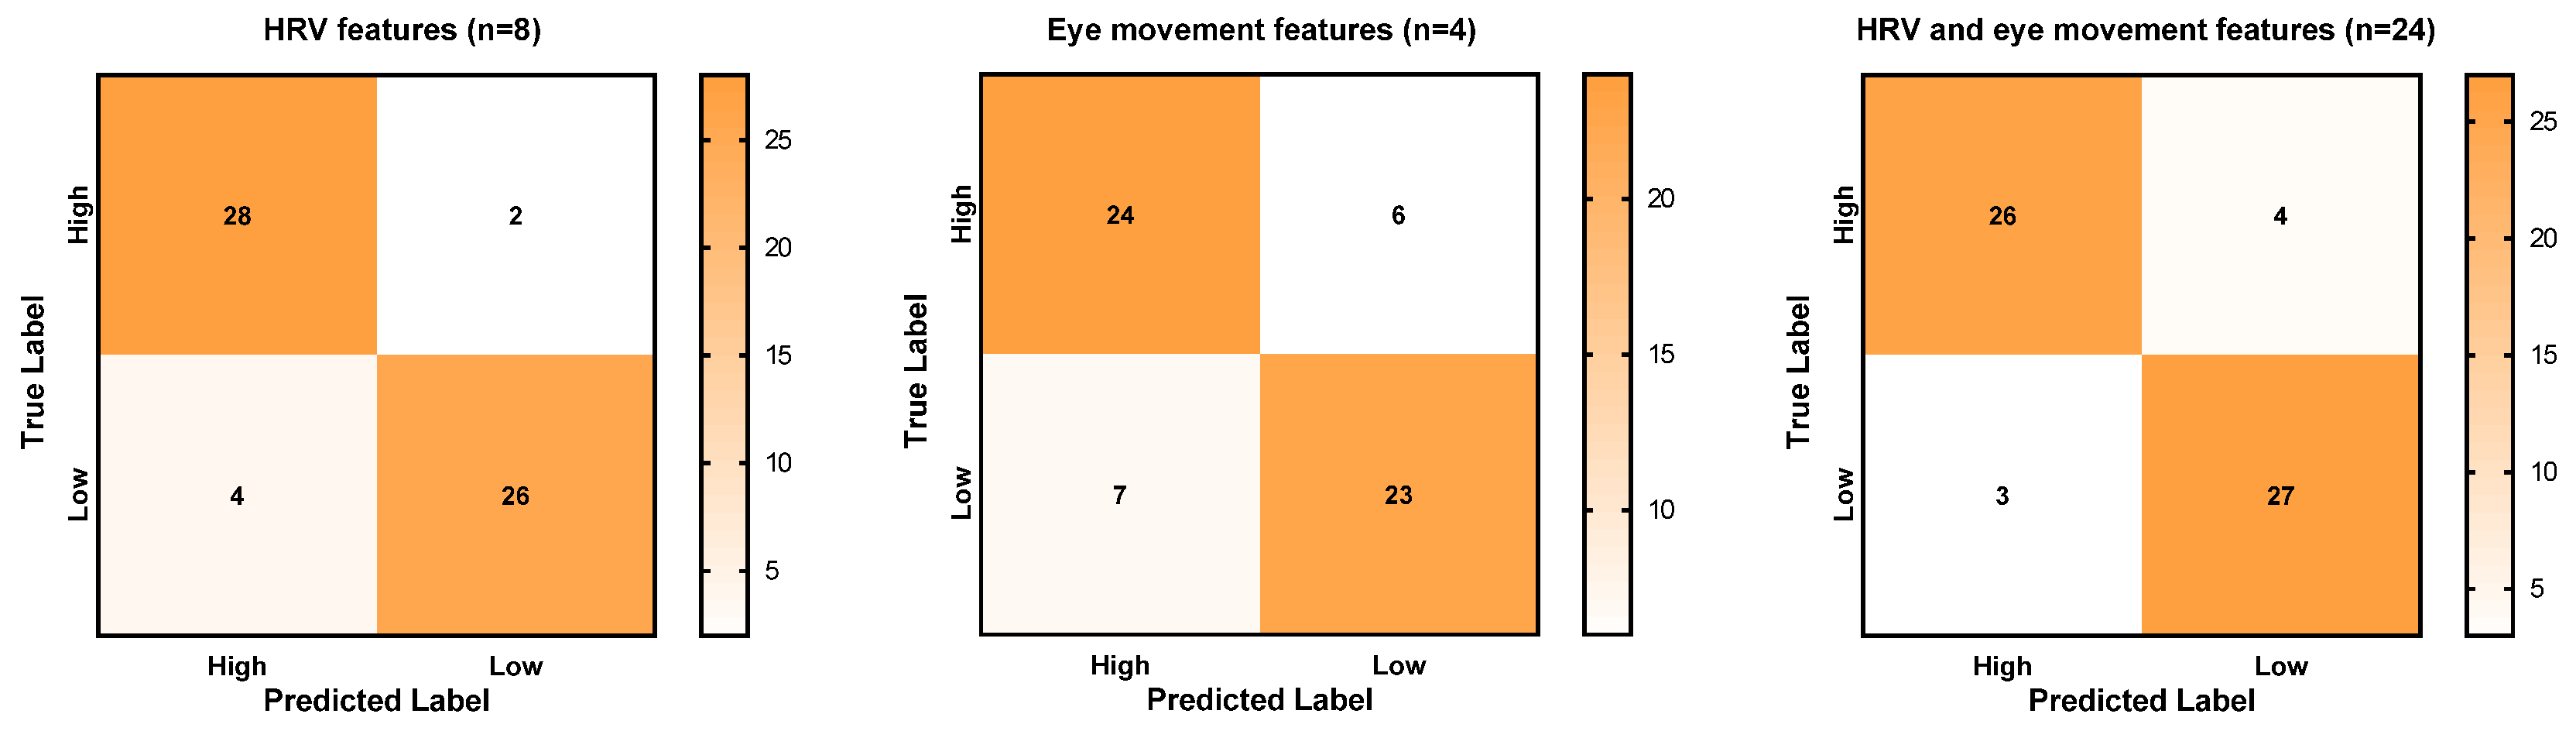
| HRV features (n = 8) | KNN, 90.00% | Recall = 0.933, Precision = 0.875, F1 = 0.903, AUC = 0.887 |
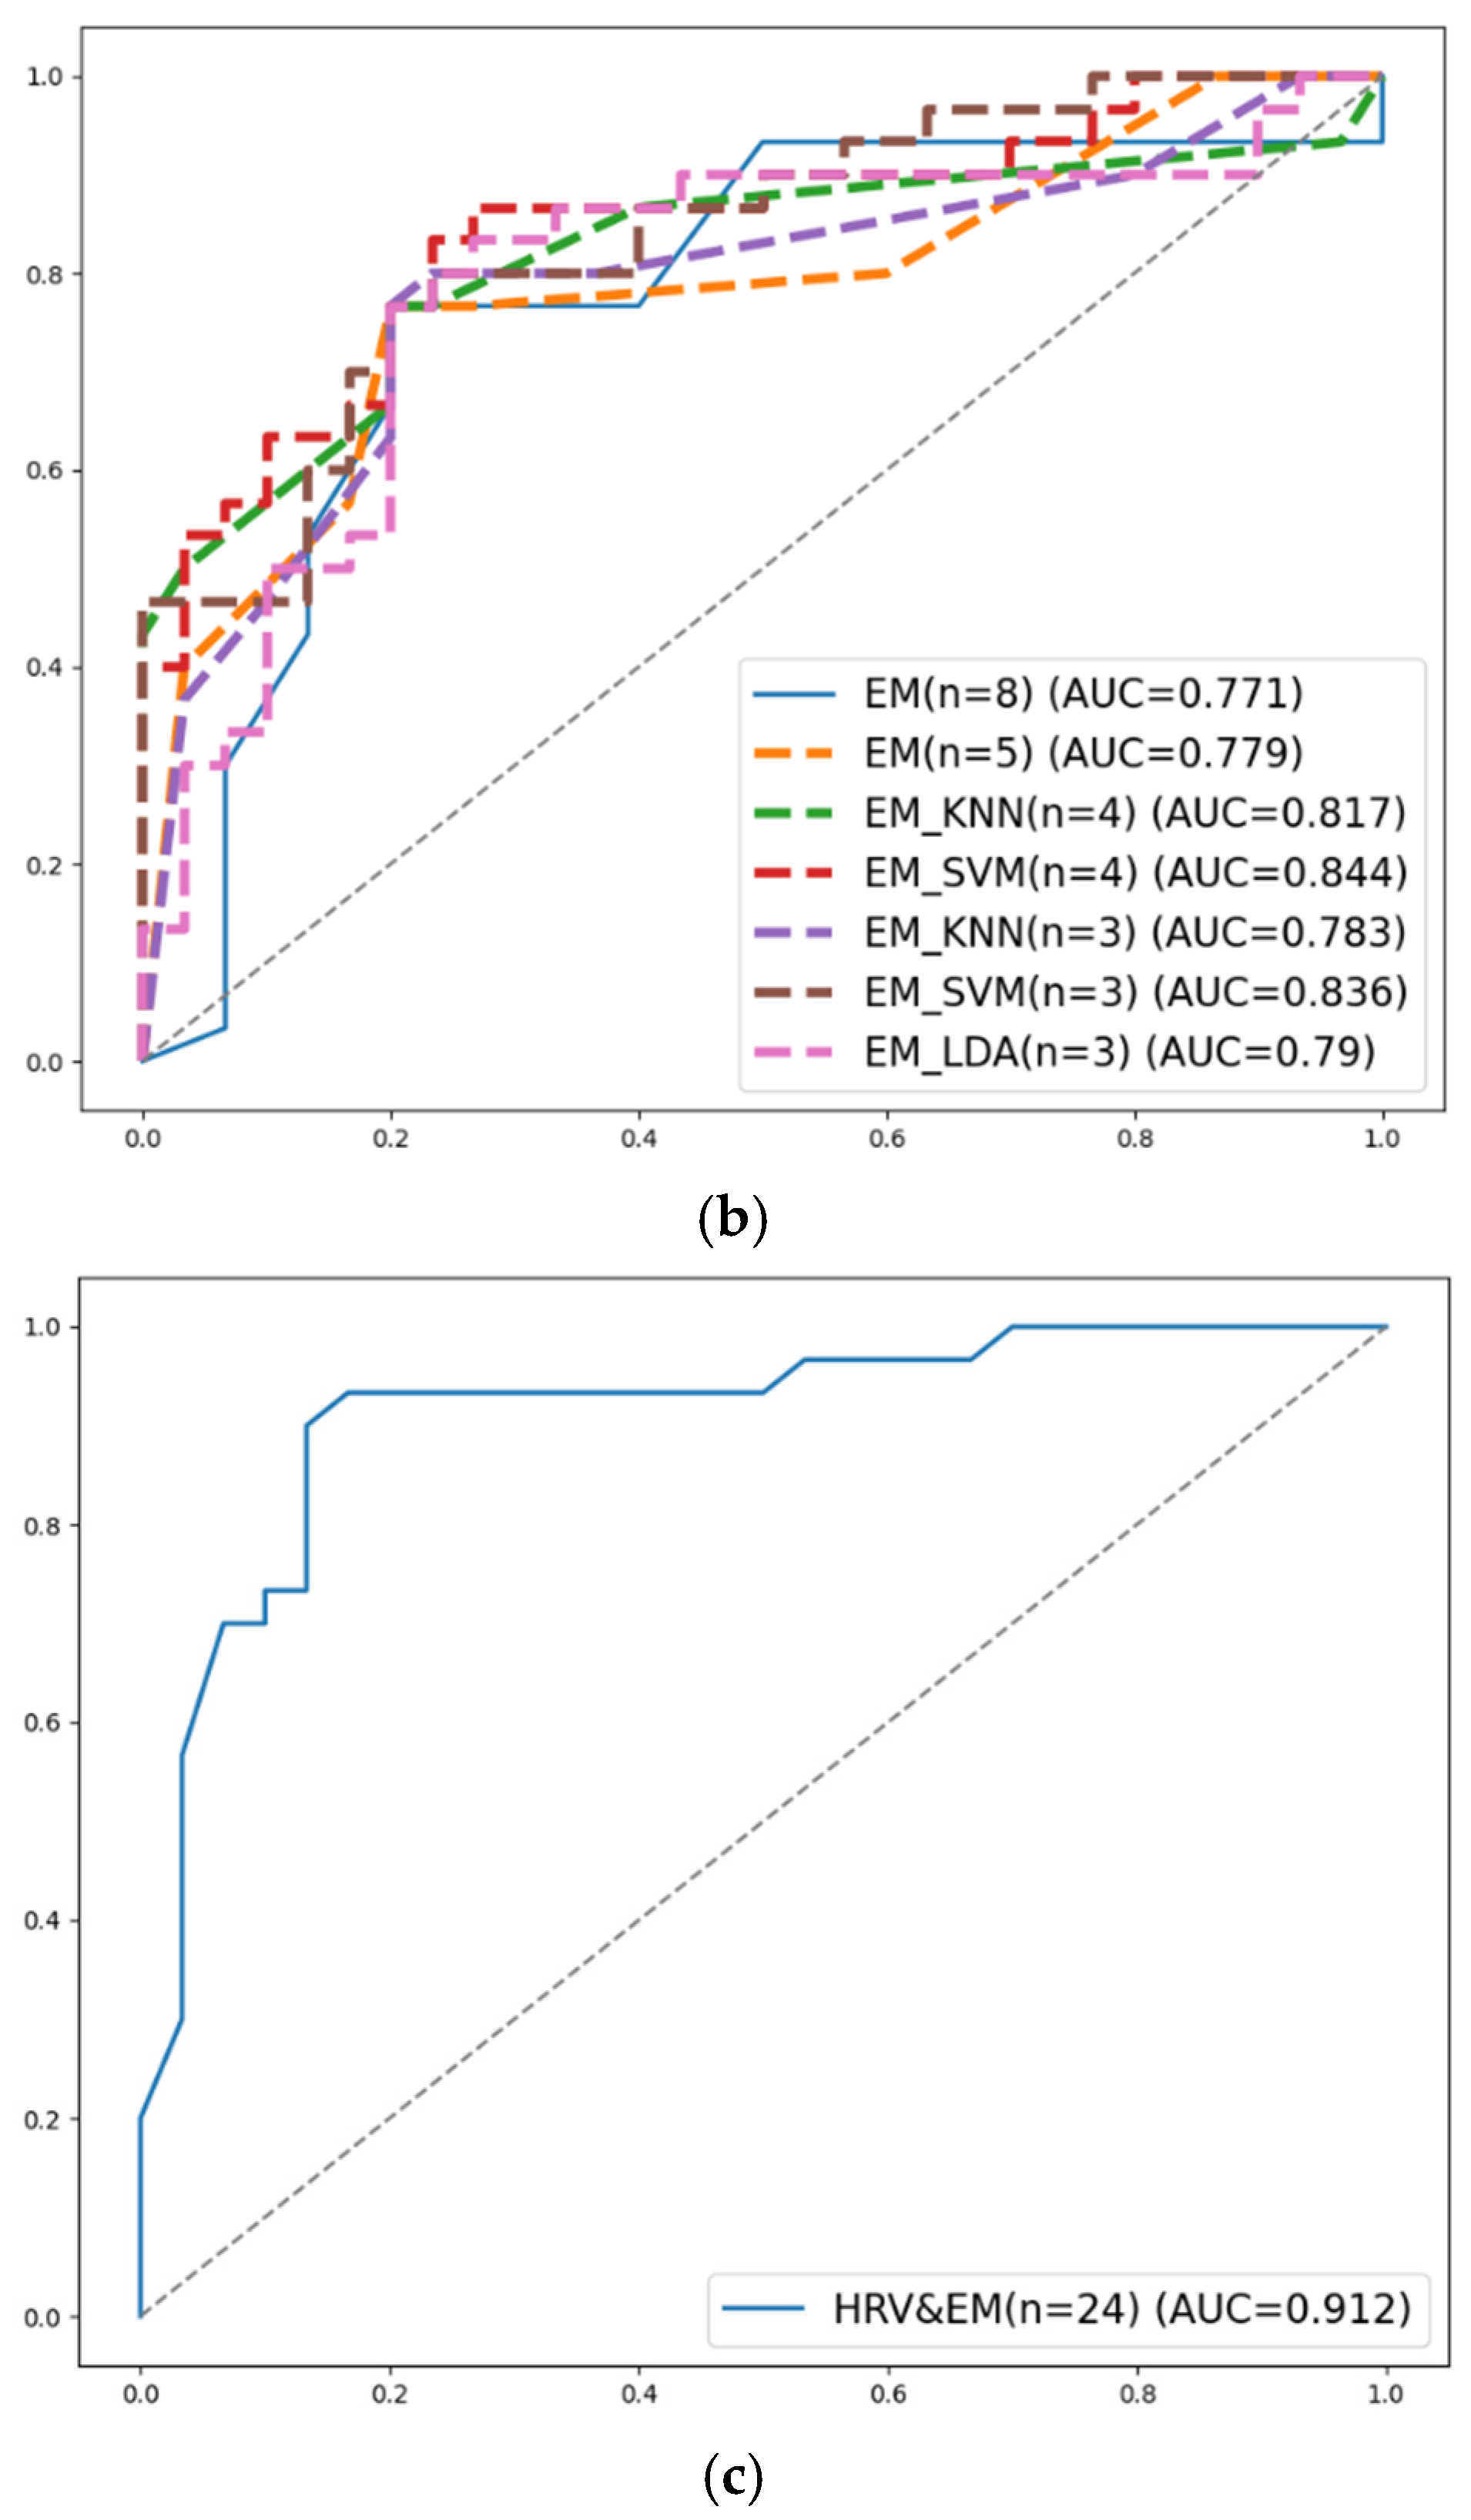
| Eye movement features (n = 8) | KNN, 78.33% | Recall = 0.800, Precision = 0.774, F1 = 0.787, AUC = 0.771 |
| Eye movement features (n = 5) | KNN, 78.33% | Recall = 0.800, Precision = 0.774, F1 = 0.787, AUC = 0.779 |
| Eye movement features (n = 4) | KNN, 78.33% | Recall = 0.800, Precision = 0.774, F1 = 0.787, AUC = 0.817 |
| Eye movement features (n = 4) | SVM, 78.33% | Recall = 0.800, Precision = 0.774, F1 = 0.787, AUC = 0.844 |
| Eye movement features (n = 3) | KNN, 78.33% | Recall = 0.800, Precision = 0.774, F1 = 0.787, AUC = 0.783 |
| Eye movement features (n = 3) | LDA, 78.33% | Recall = 0.800, Precision = 0.774, F1 = 0.787, AUC = 0.790 |
| Eye movement features (n = 3) | SVM, 78.33% | Recall = 0.800, Precision = 0.774, F1 = 0.787, AUC = 0.836 |
| HRV and eye movement features (n = 24) | RF, 88.30% | Recall = 0.867, Precision = 0.897, F1 = 0.881, AUC = 0.912 |
Disclaimer/Publisher’s Note: The statements, opinions and data contained in all publications are solely those of the individual author(s) and contributor(s) and not of MDPI and/or the editor(s). MDPI and/or the editor(s) disclaim responsibility for any injury to people or property resulting from any ideas, methods, instructions or products referred to in the content. |
© 2025 by the authors. Licensee MDPI, Basel, Switzerland. This article is an open access article distributed under the terms and conditions of the Creative Commons Attribution (CC BY) license (https://creativecommons.org/licenses/by/4.0/).
Share and Cite
He, S.; Qi, D.; Guo, E.; Wang, L.; Ouyang, Y.; Zheng, L. Monitoring Construction Workers’ Mental Workload Due to Heat Exposure Using Heart Rate Variability and Eye Movement: A Study on Pipe Workers. Sensors 2025, 25, 2377. https://doi.org/10.3390/s25082377
He S, Qi D, Guo E, Wang L, Ouyang Y, Zheng L. Monitoring Construction Workers’ Mental Workload Due to Heat Exposure Using Heart Rate Variability and Eye Movement: A Study on Pipe Workers. Sensors. 2025; 25(8):2377. https://doi.org/10.3390/s25082377
Chicago/Turabian StyleHe, Shiyi, Dongsheng Qi, Enkai Guo, Liyun Wang, Yewei Ouyang, and Lan Zheng. 2025. "Monitoring Construction Workers’ Mental Workload Due to Heat Exposure Using Heart Rate Variability and Eye Movement: A Study on Pipe Workers" Sensors 25, no. 8: 2377. https://doi.org/10.3390/s25082377
APA StyleHe, S., Qi, D., Guo, E., Wang, L., Ouyang, Y., & Zheng, L. (2025). Monitoring Construction Workers’ Mental Workload Due to Heat Exposure Using Heart Rate Variability and Eye Movement: A Study on Pipe Workers. Sensors, 25(8), 2377. https://doi.org/10.3390/s25082377