1. Introduction
Nowadays, Earth Observation (EO) is applied for the monitoring of agricultural fields, to provide insight into crop development [
1], plant health status [
2], canopy water content [
3] and biomass productivity [
4]. Crop phenology represents the timing of different stages of the plant growth and development, such as leaf emergence, flowering or maturation, and their relationship with the environmental conditions through the growing season [
5]. Satellite remote sensing is particularly used for monitoring of crop phenology [
6] since detection of specific phenological stages is of interest in agricultural management. Different approaches are used on time series of canopy spectral reflectance, vegetation indices or backscatter intensity in order to detect key dates during the growing season, such as: threshold-based methods [
7], derivative methods [
8] and shape model methods [
9]. Deployment of the specific approach highly depends on the amount of ground truth data from the fields.
Information on the harvest date of crops can help with logistics management in the agricultural industry, planning machinery operations and also with yield prediction modelling [
10]. Remote sensing of the large-scale harvest detection of various crops, by using satellite imagery, can be found in the current scientific literature, although it has not been fully explored so far. The time series of backscattering for Vertical–Horizontal (VH) polarisation from Sentinel-1 and the Enhanced Vegetation Index (EVI) from Sentinel-2 were proposed to recognise rice planting and heading dates, respectively, while the Normalised Difference Yellow Index (NDYI) was utilised to detect the rice harvest date [
11]. Tracking of asparagus development and the estimation of the harvest date were performed with VH backscatter intensity from Sentinel-1 and the Green Normalised Difference Vegetation Index (GNDVI) derived from Sentinel-2 [
12]. Given that wheat is a worldwide staple food, monitoring of winter wheat phenology has been explored in several studies. Based on Landsat 8 images, the changes in the EVI, Normalised Difference Vegetation Index (NDVI) and Normalised Difference Water Index (NDWI) were analysed at different growth stages of winter wheat [
13], including the harvest date [
14]. In [
15], the authors even analysed the optimal set of bands of Sentinel-2 among 13 available bands to predict the most accurate time for the harvesting of wheat crops, where Red, Blue and NIR bands are found to be optimal. The phenology of soybean, an industrial crop vastly cultivated for oil and protein, has also been a research focus. Different tools were analysed for the estimation of sowing and harvest dates using the NDVI and EVI2 (two-band EVI) from Sentinel-2 [
16], and the EVI from MODIS [
17,
18]. One of the first attempts to assess the optimal harvesting date in maize fields indirectly used surface reflectance data acquired from HJ-1 satellites [
19].
The main issue of utilising optical sensors for harvest date detection is that there may be gaps in the observations acquired on cloudy days; hence, as a result, there are a reduced and irregular number of days between observations in a time series. Since the synthetic aperture radar (SAR) provides all-weather and all-day imagery, potentially it is more suitable for this task. A comprehensive review of radar remote sensing of agricultural canopies, including crop phenology monitoring, is given in [
20]. Recently, Sentinel-1 SAR images were mostly exploited for this purpose. Time series of the coherence of vertical transmit and vertical receive (VV) polarisation, and the backscattering coefficient (
) in vertical transmit and horizontal receive (VH) polarisation, were used to create an algorithm which finds a step-like increase in coherence that occurs after the harvesting, and an additional check of potential wheat harvest dates was carried out by using the threshold values of
depending on vegetation height [
21]. Similar methodology was applied for soybean fields, comparing a maximum difference of ascending
between consecutive dates of observation with the threshold value of the Radar Vegetation Index (RVI), where the former method showed better performance for harvest detection [
22]. Another algorithm was accomplished by analysing both the interferometric coherence (IC) and
time series in an individual way for soybean and maize. Based on the latter, separate criteria were adopted [
23]. Additionally, harvest dates for different crop fields were determined by change detection in time series of both IC and the backscattering coefficient in VV and VH polarisation [
24].
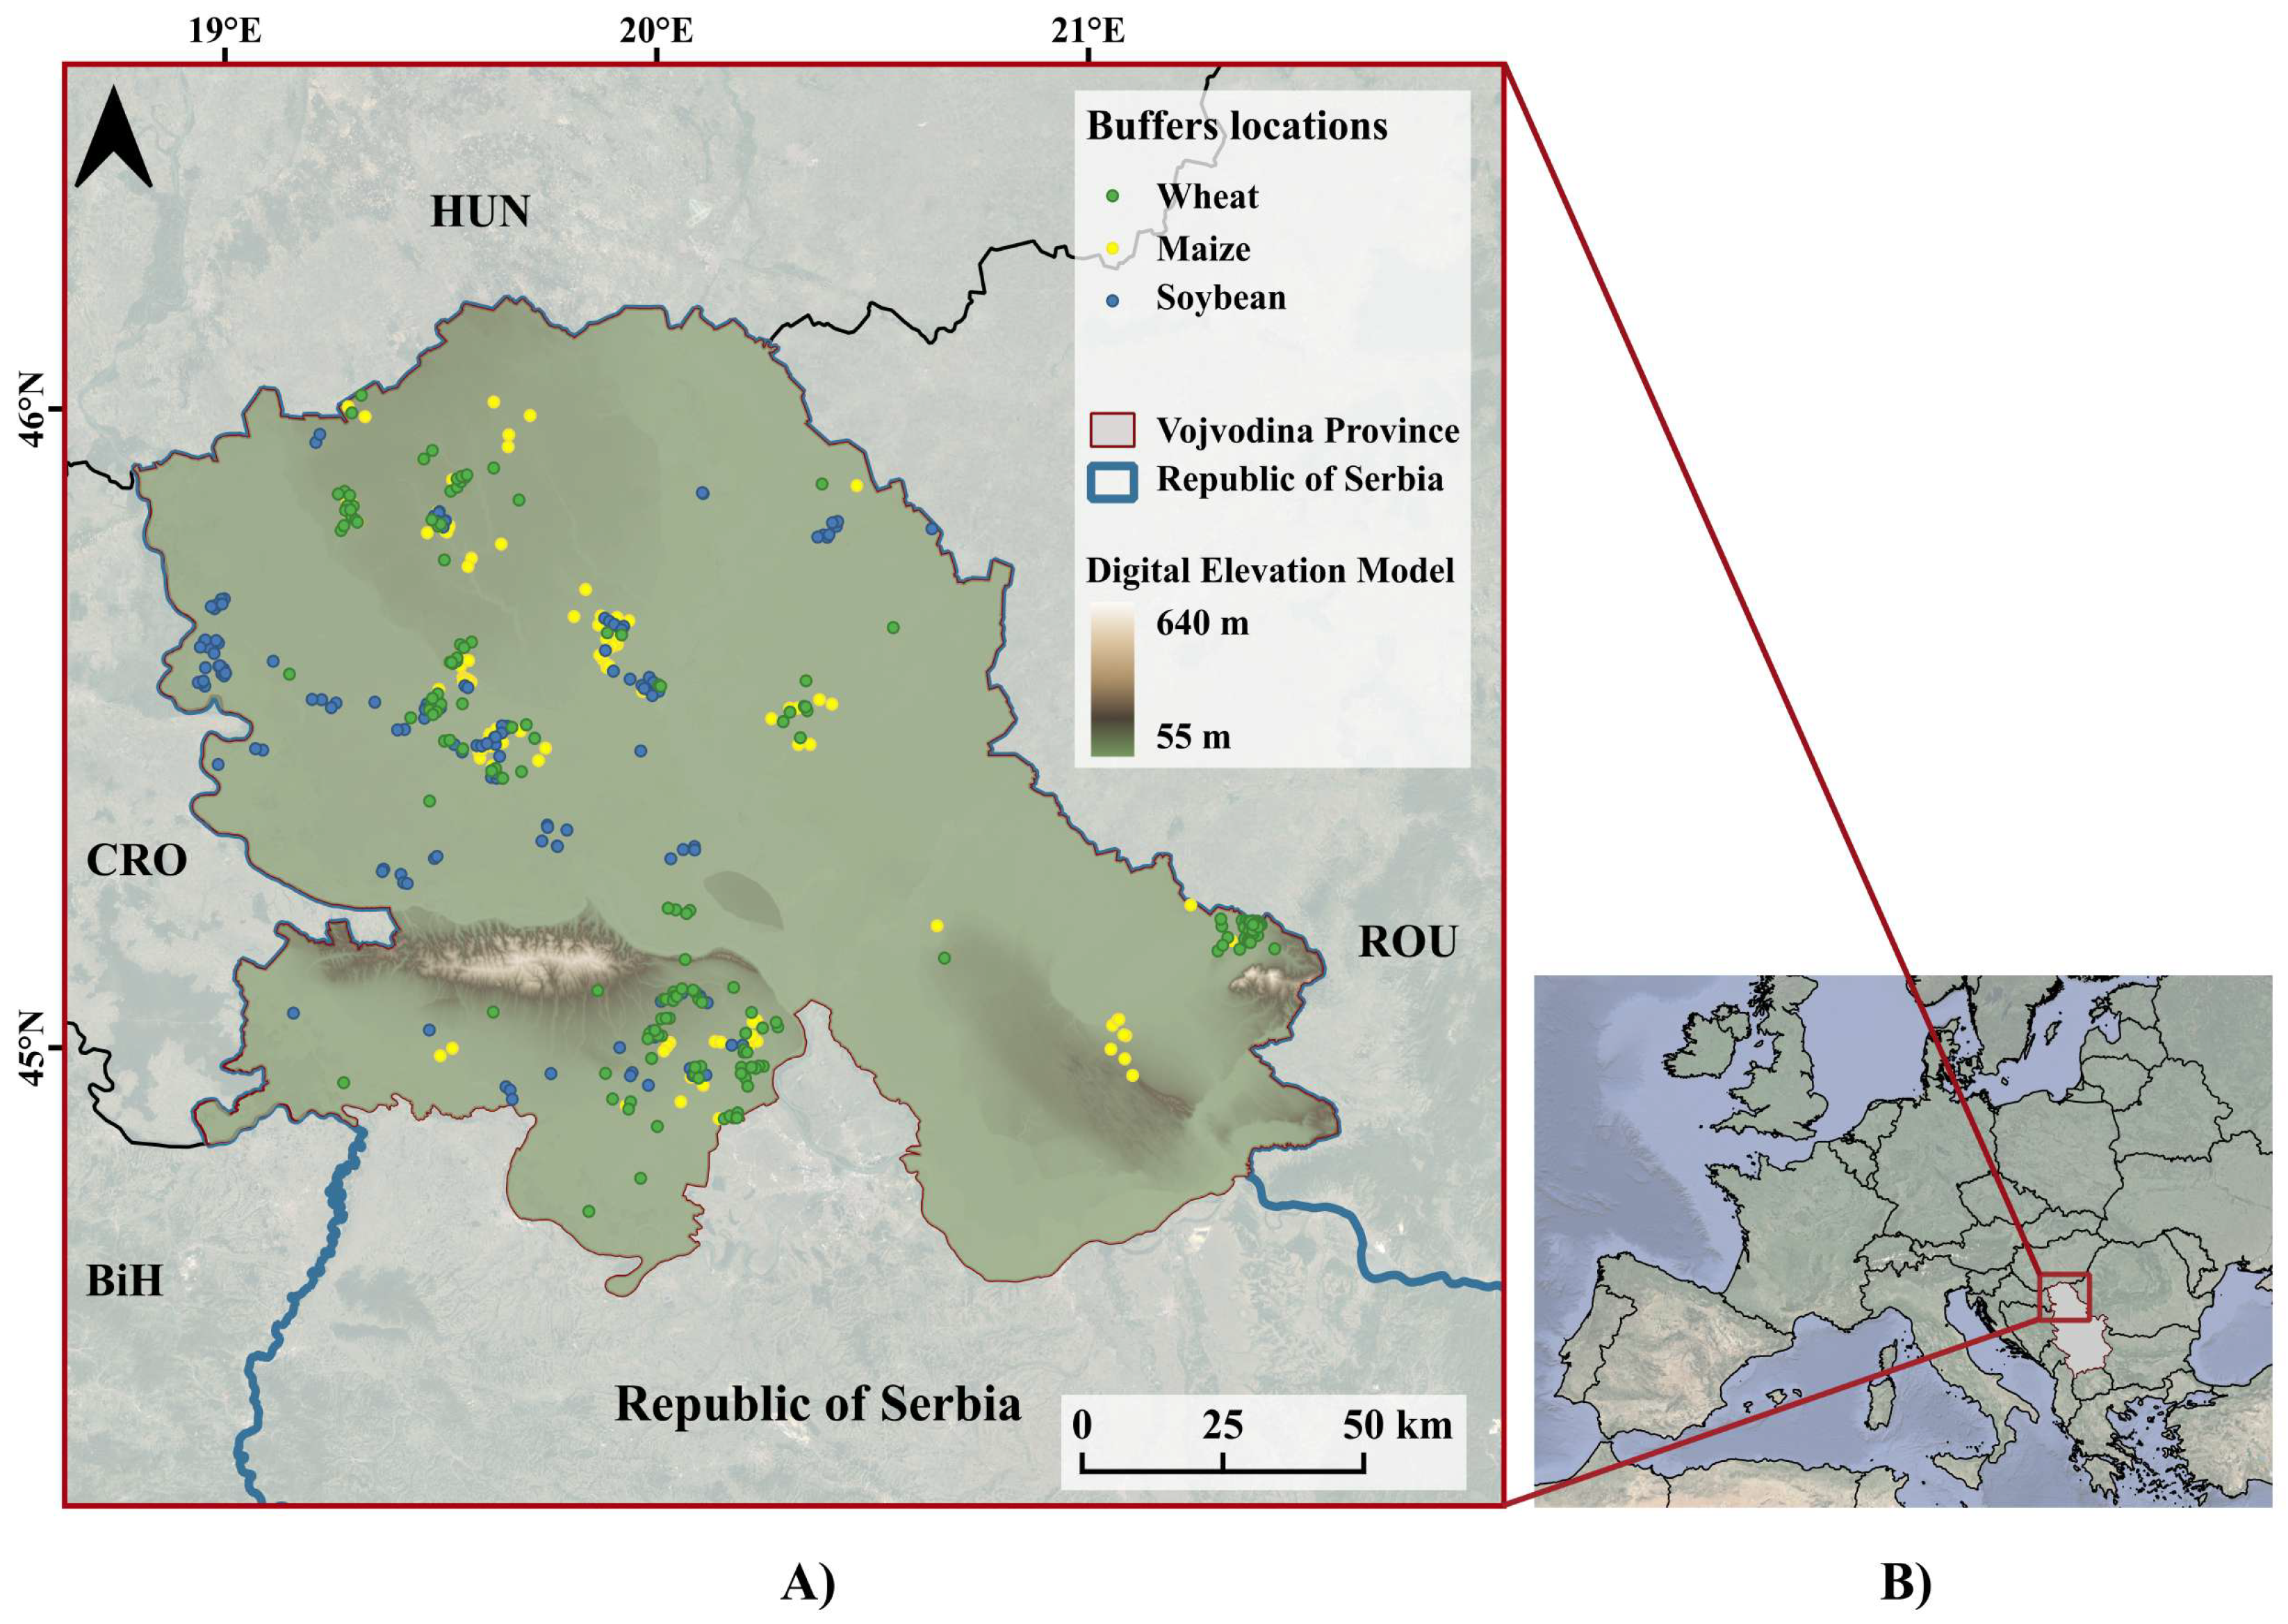
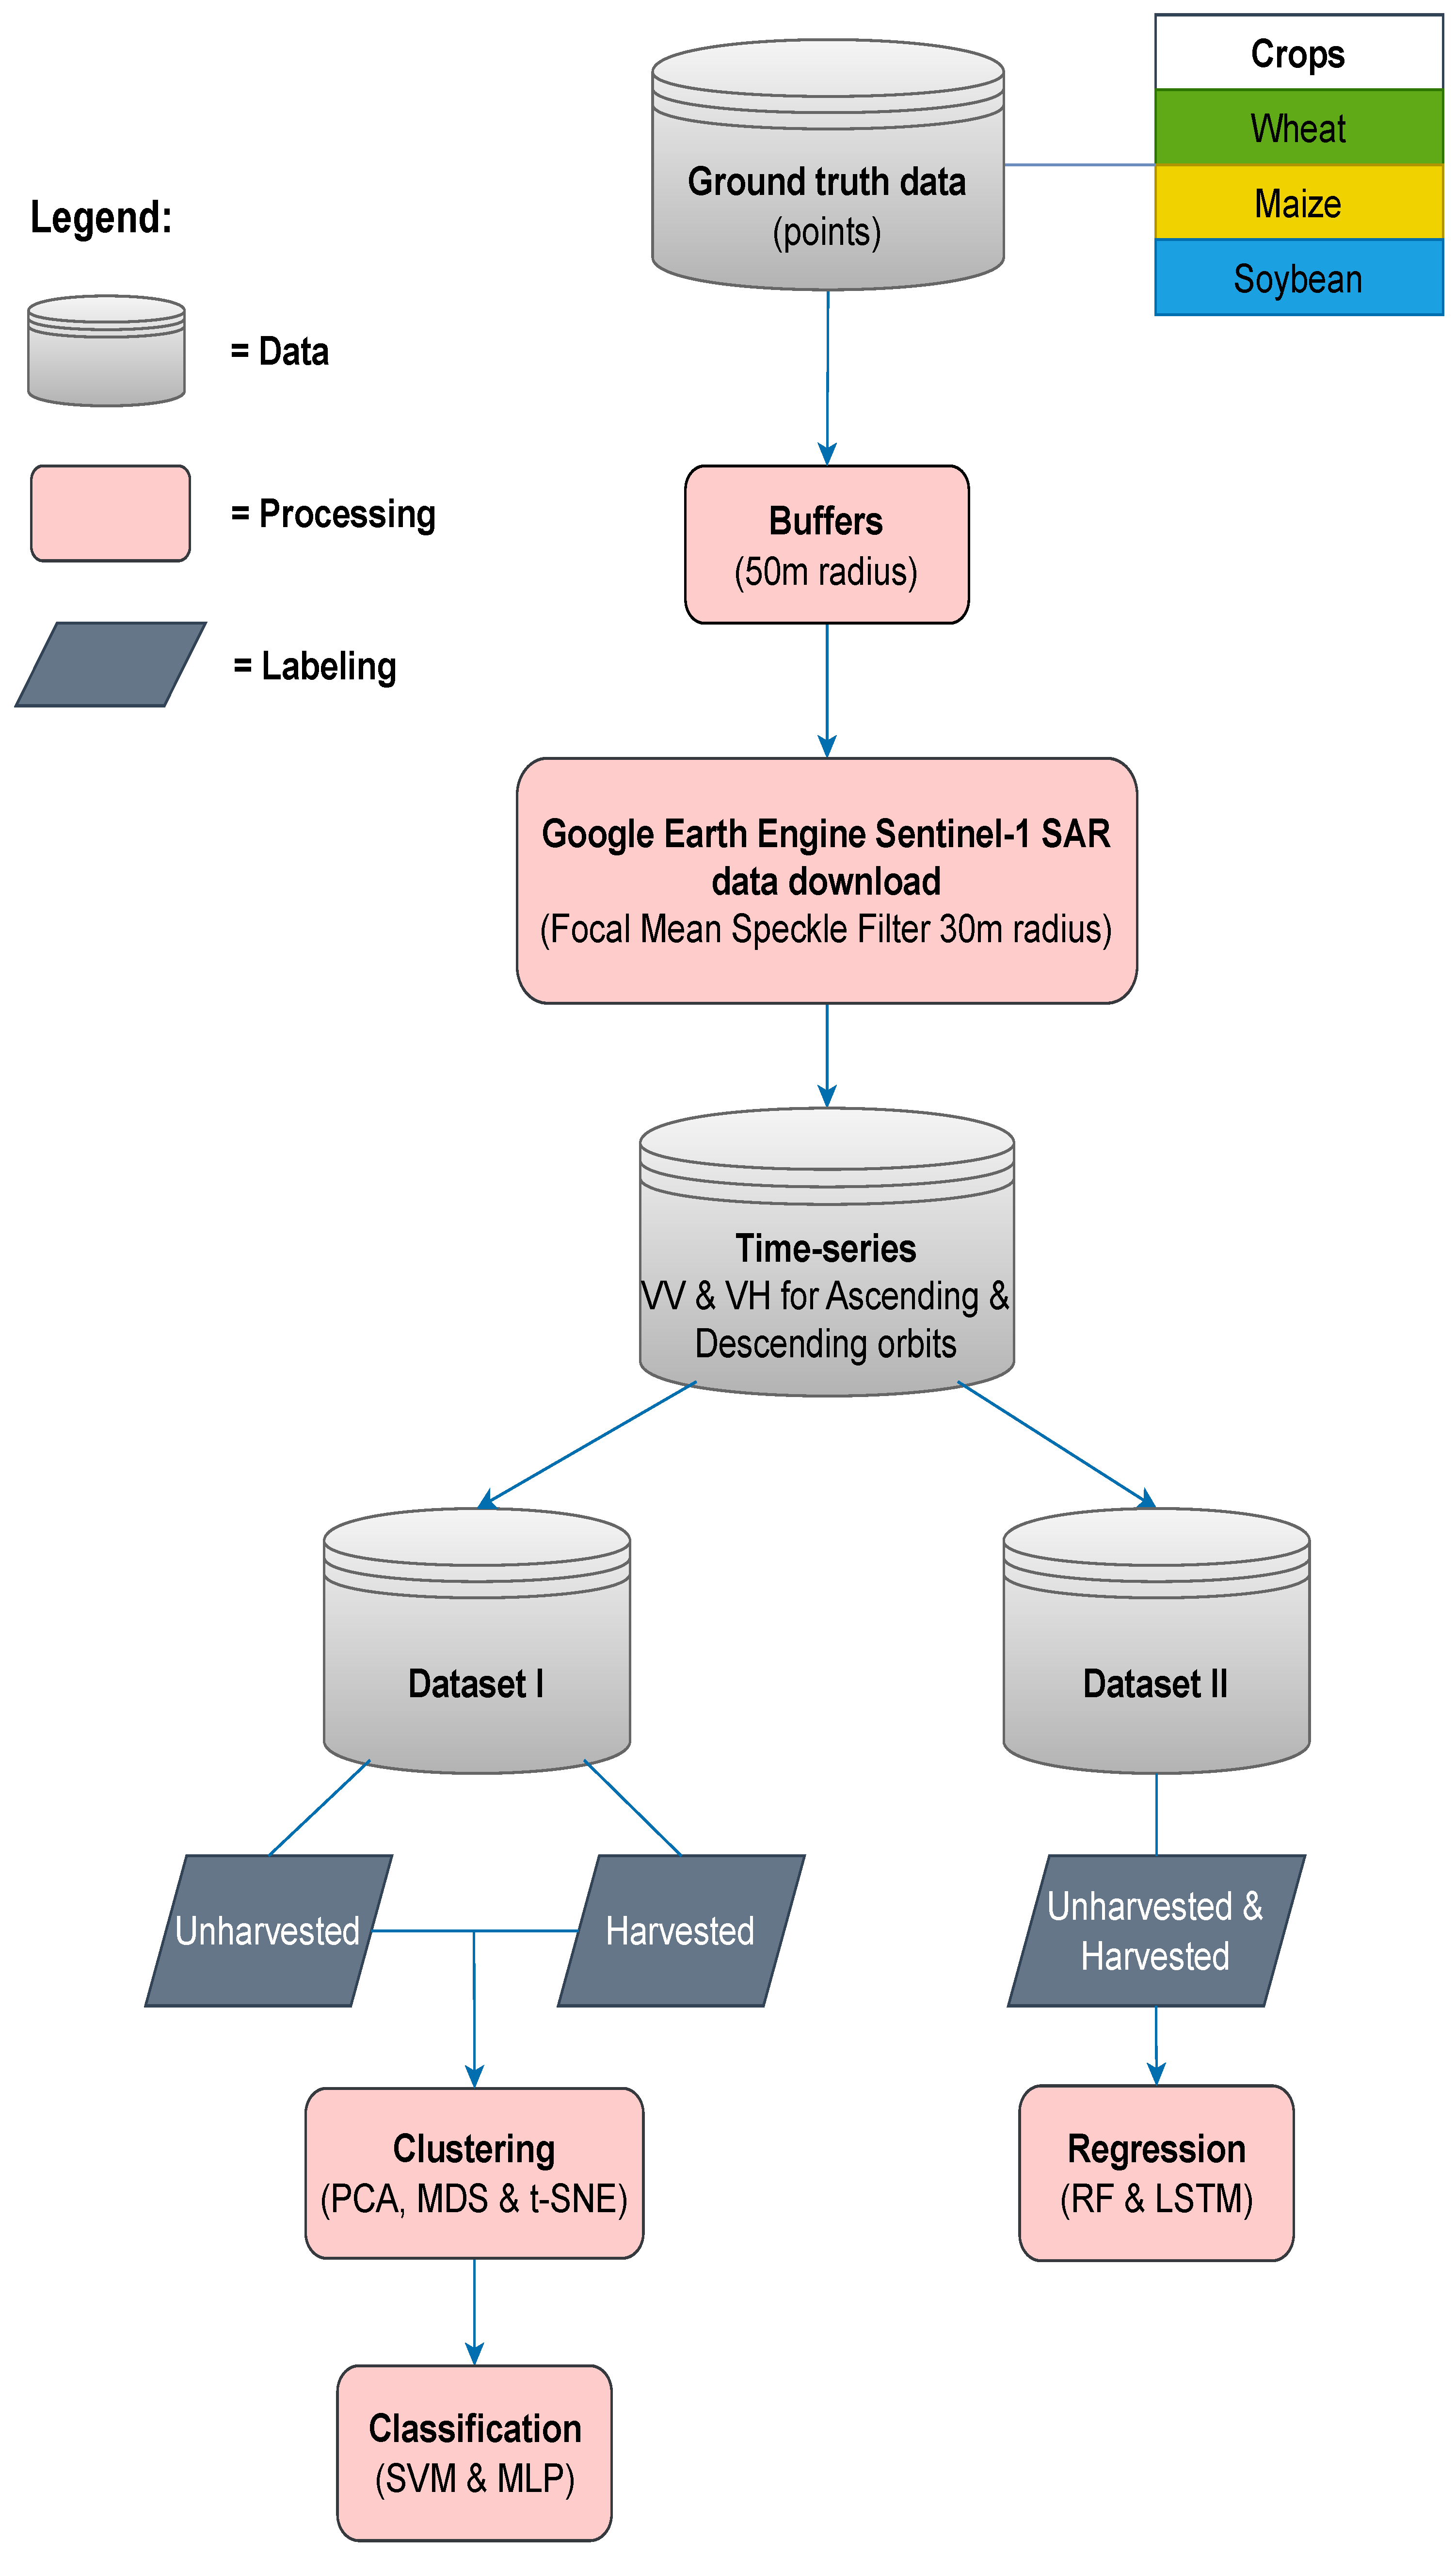
The above-mentioned studies were investigating a step-like increase in the signal, determination of the threshold value or change detection in time series, while none of them exploited the use of machine learning methods on SAR data for predictive analytics of the harvest date. The objective of this study was the determination of the harvest dates for winter wheat, maize and soybean fields in Vojvodina (Serbia), a region with intensive agricultural production. For this purpose, time series of the SAR backscattering coefficient at VH and VV polarisation, from both ascending and descending Sentinel-1 orbits, were exploited. For the first time, data analysis was performed by applying various machine learning (ML) techniques. This work has three main contributions. First of all, we applied different ML algorithms of harvest date estimation by conducting cluster analysis, followed by classification methods, and finally by regression models. Secondly, we showed how clustering can be used to gain rough estimation on the separability of unharvested and harvested data for certain crops, and thus to obtain a reasonable expectation of the performance of classification methods. Lastly, the study is rich given the amount of ground truth data we have used thanks to our industrial partner. This makes the study much more reliable.
The rest of the paper is organised as follows.
Section 2 describes the data we have used and our data preprocessing steps.
Section 3 presents the clustering, classification and regression algorithms used in this study.
Section 4 discusses the results, and the paper ends with a concluding section.
4. Discussion
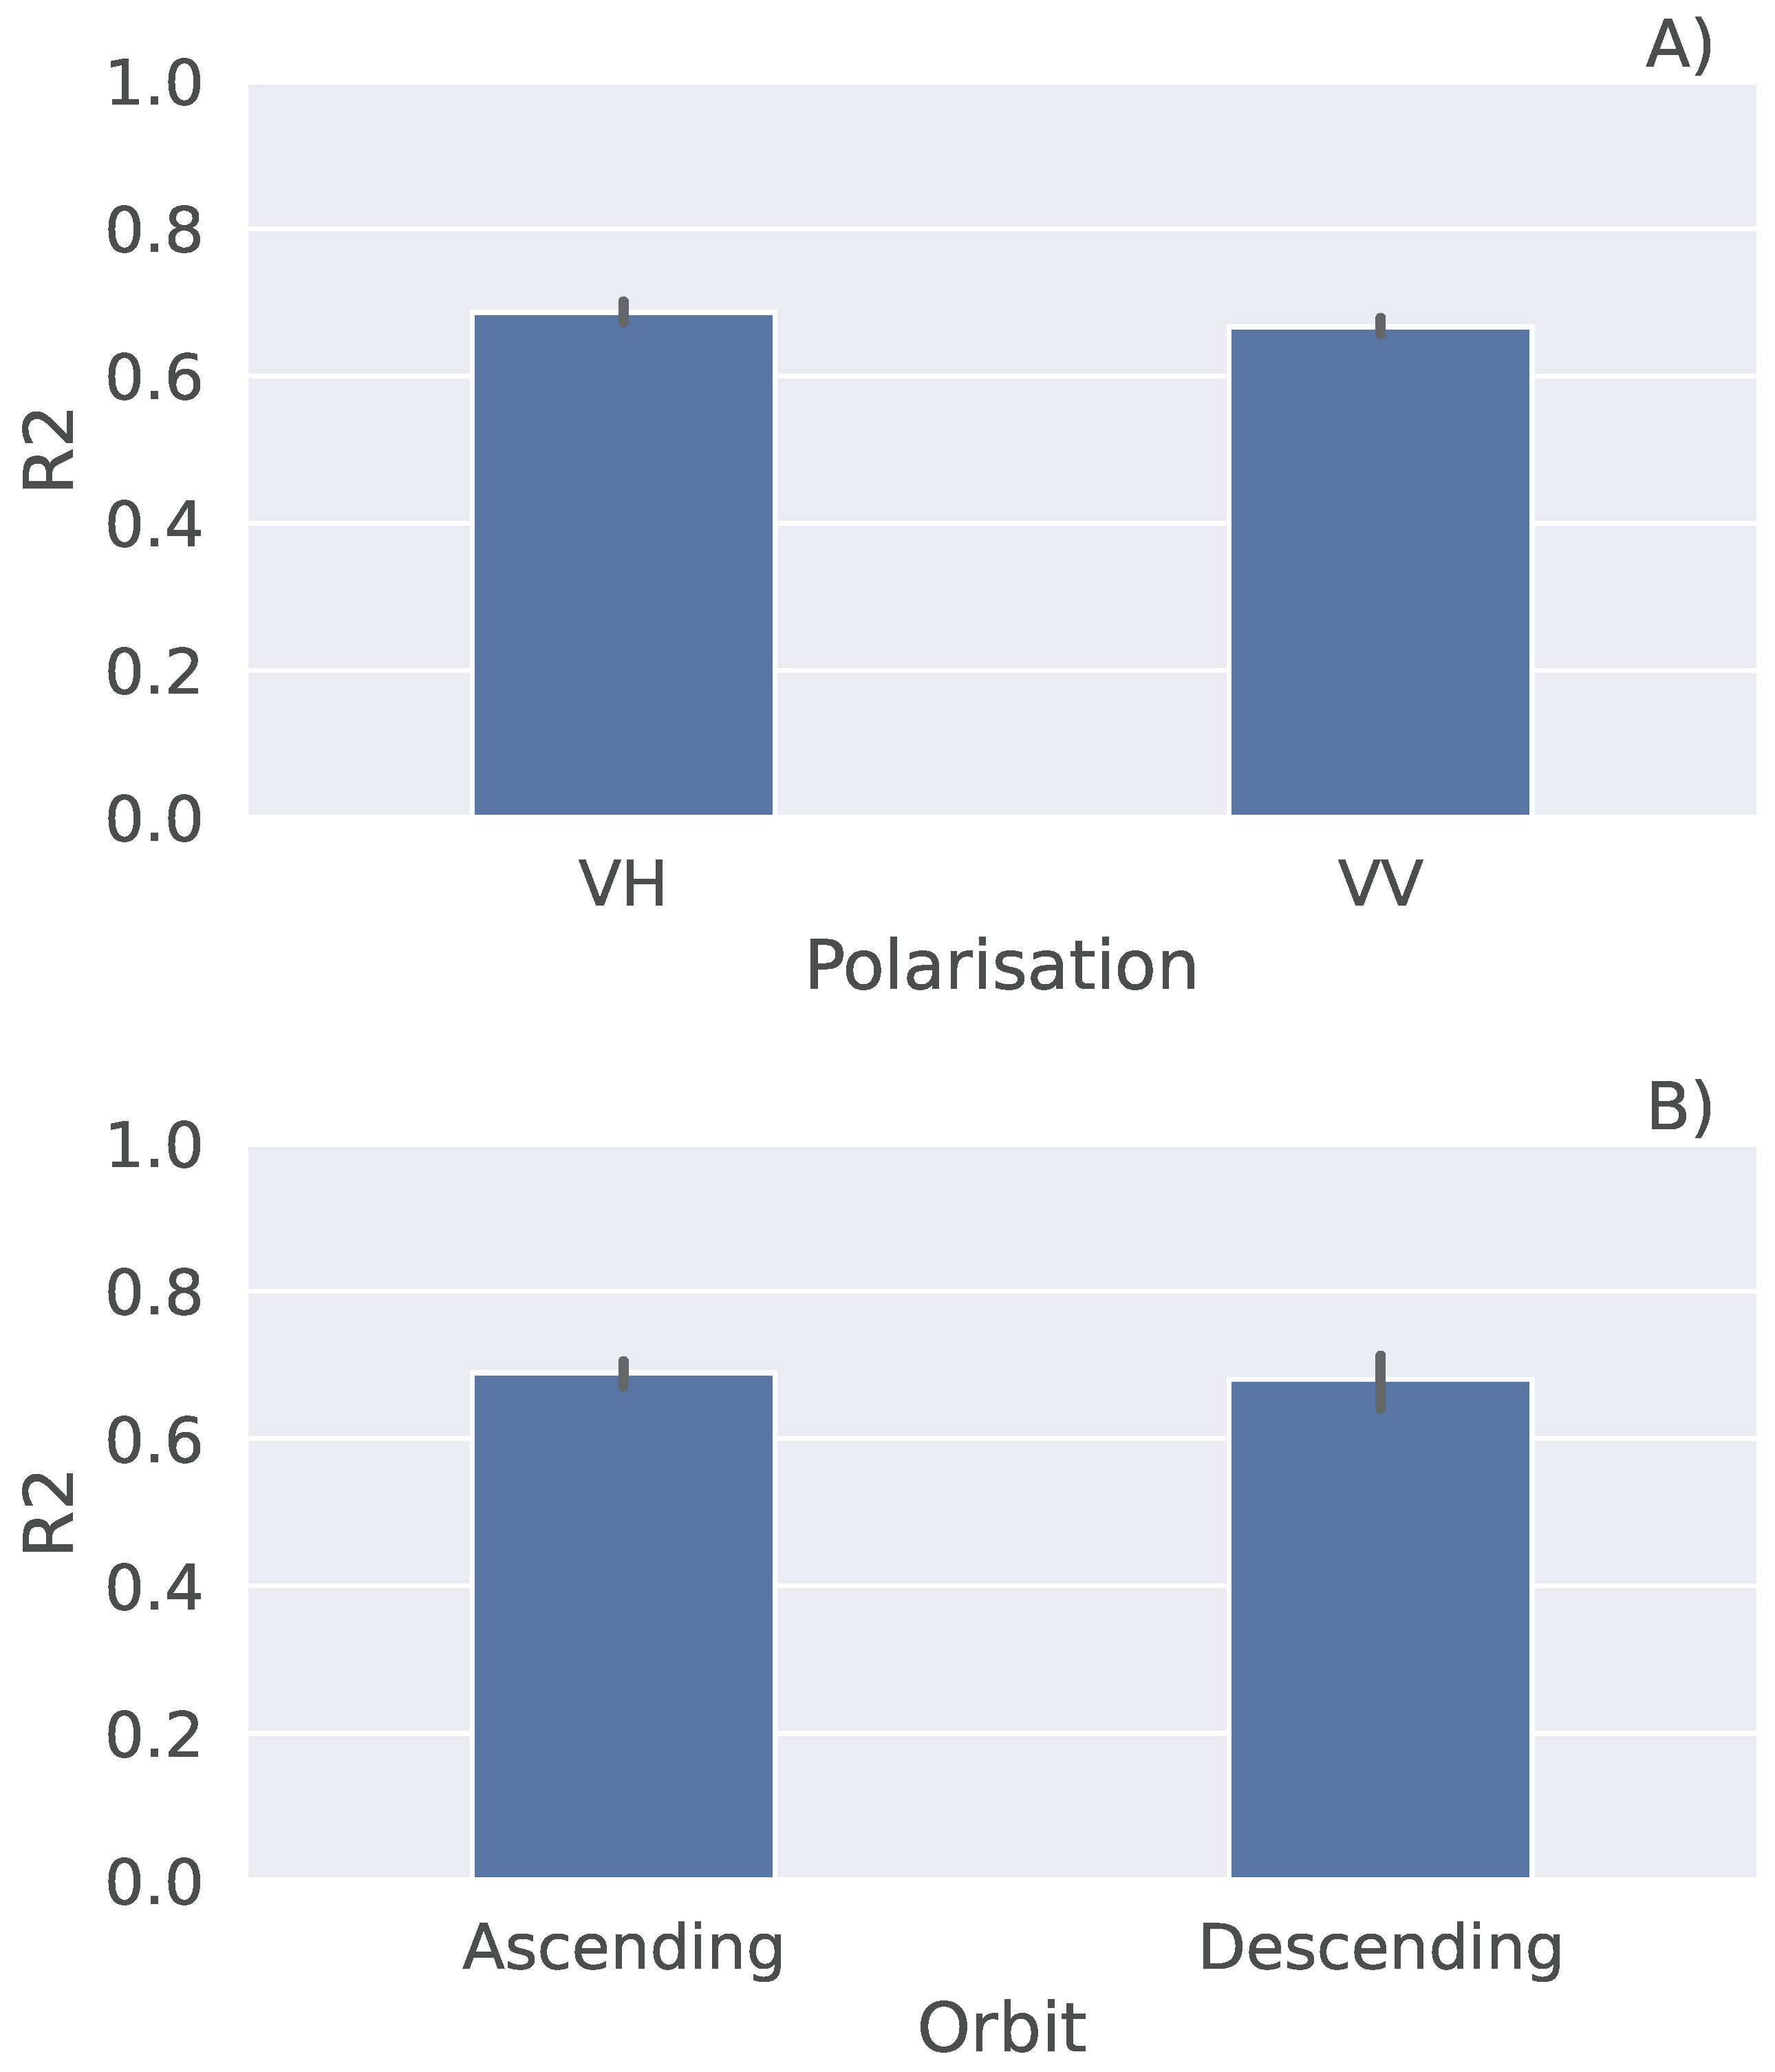
In order to explore the performance of the LSTM model in more detail, we carried out several experiments. First, we reduced the number of features used to run the model by selecting only a polarisation or an orbit. In one experiment, we used VH polarisation, while in the other, we used VV polarisation (
Figure 7A). This decreased the
score of the model to approximately 0.6 in both cases. Additionally, we ran the model with the data from the ascending orbit, and later from the descending orbit (
Figure 7B). It can be noticed that
decreased, being slightly above 0.6 for both the ascending and descending orbits, where the latter has a slightly higher standard deviation represented with the error bar.
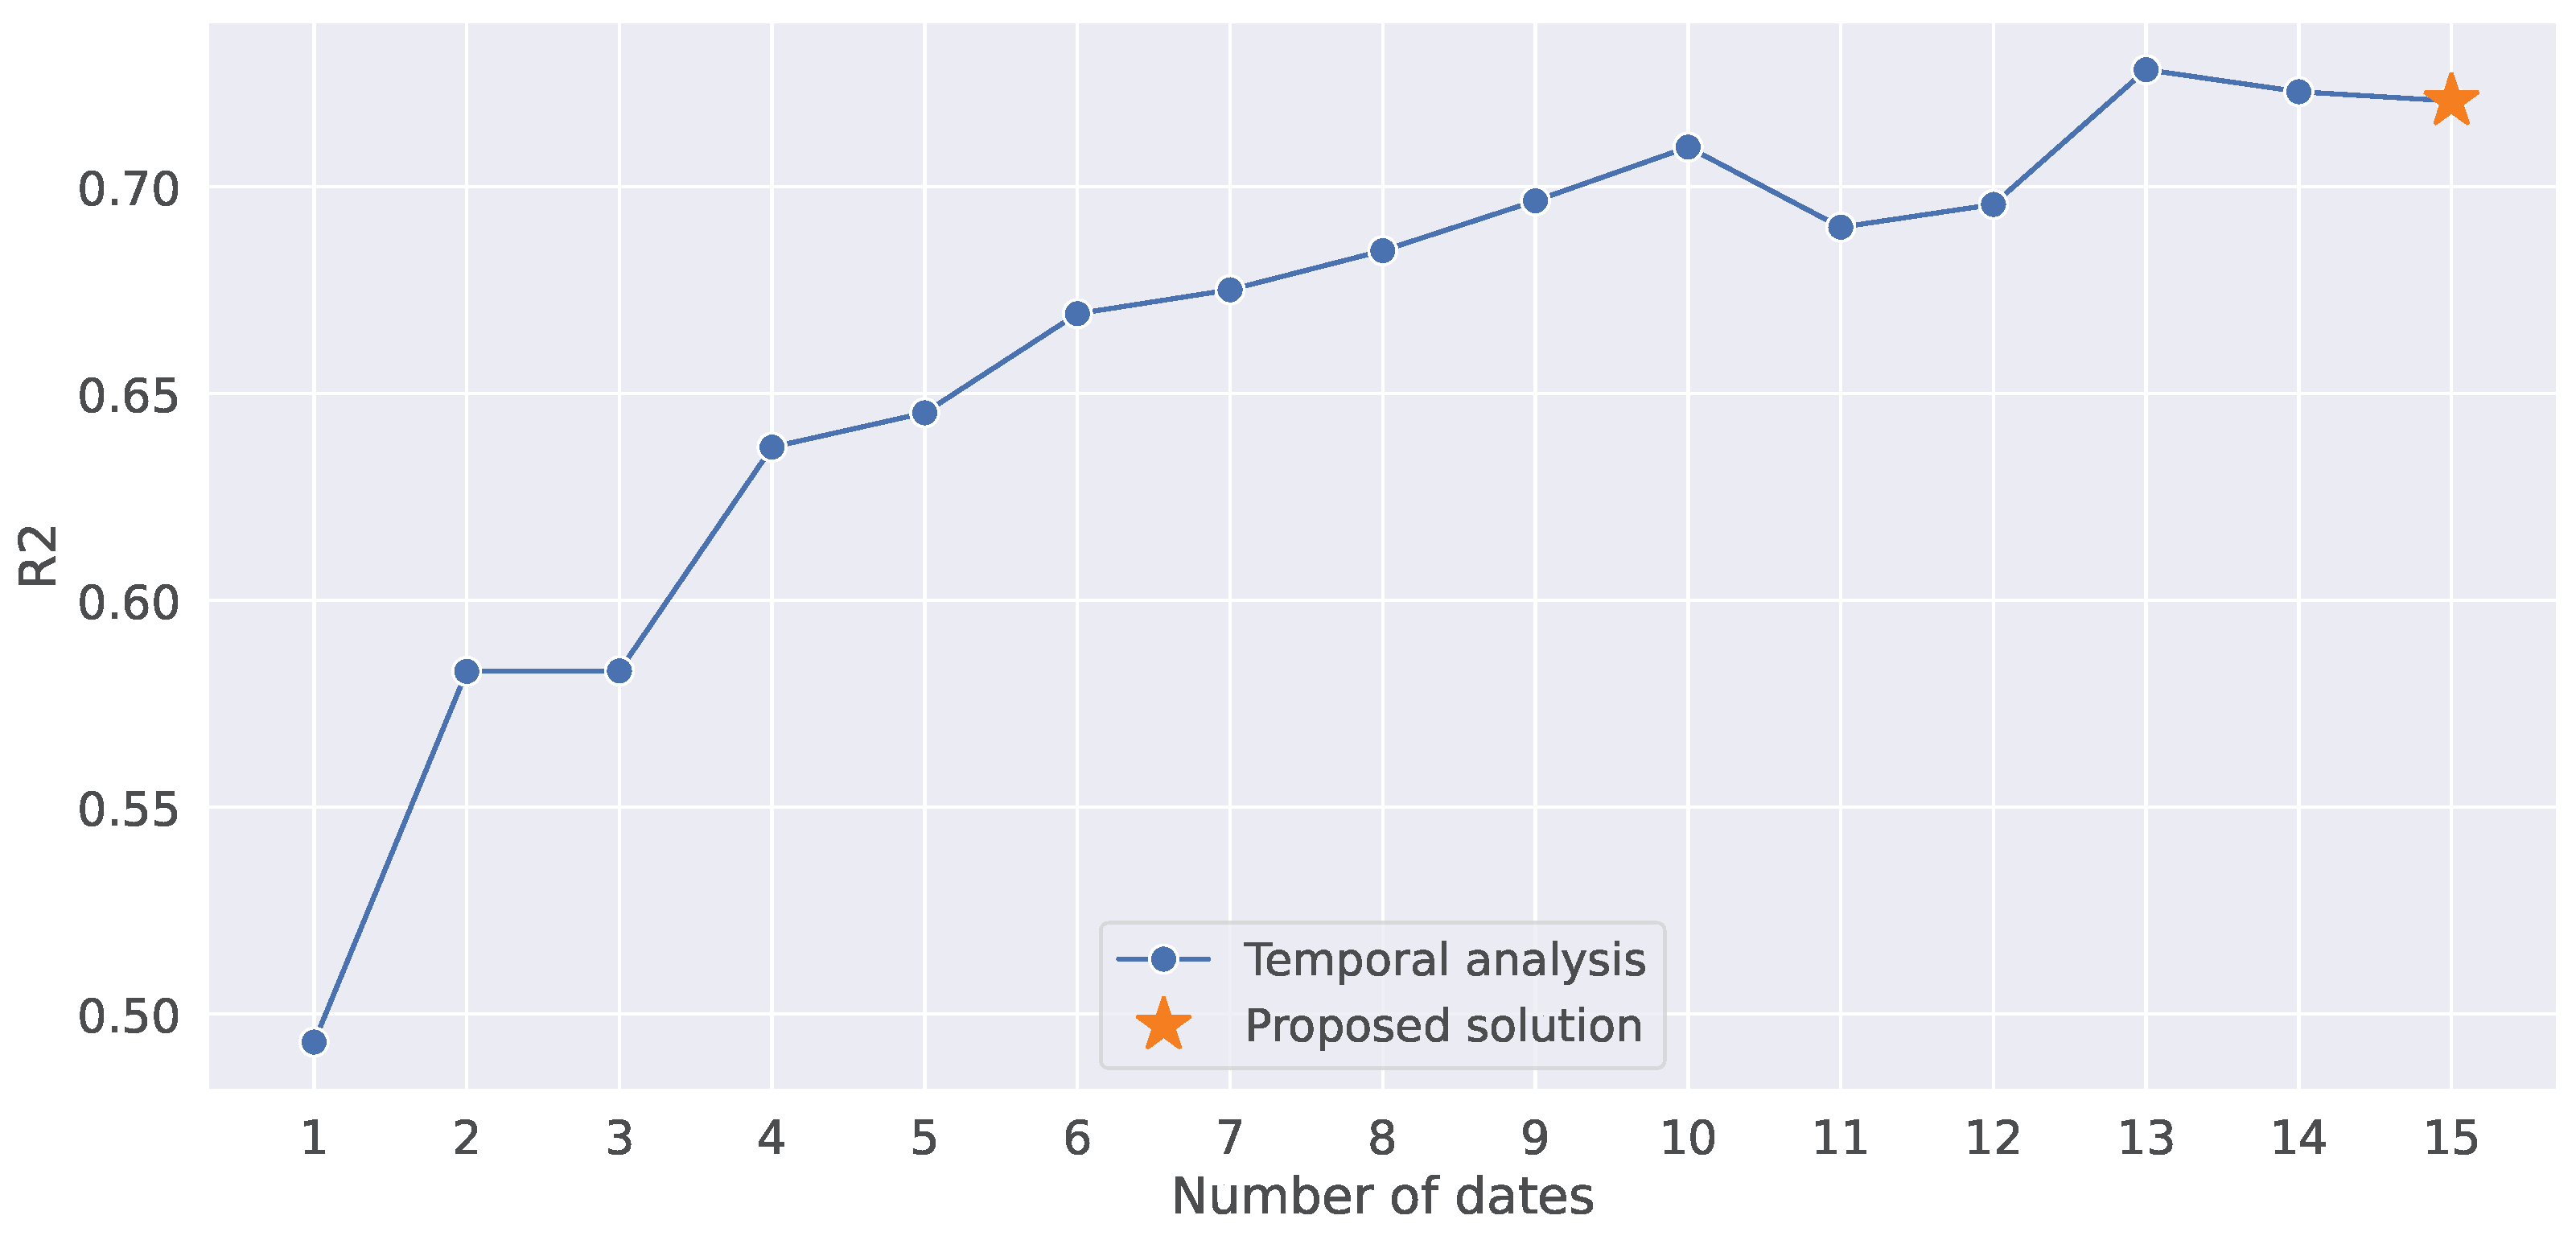
Second, we used the time series of different lengths as input to run the model, by sequentially reducing the number of dates one by one (
Figure 8). Overall, it can be seen that there is a decreasing trend of the
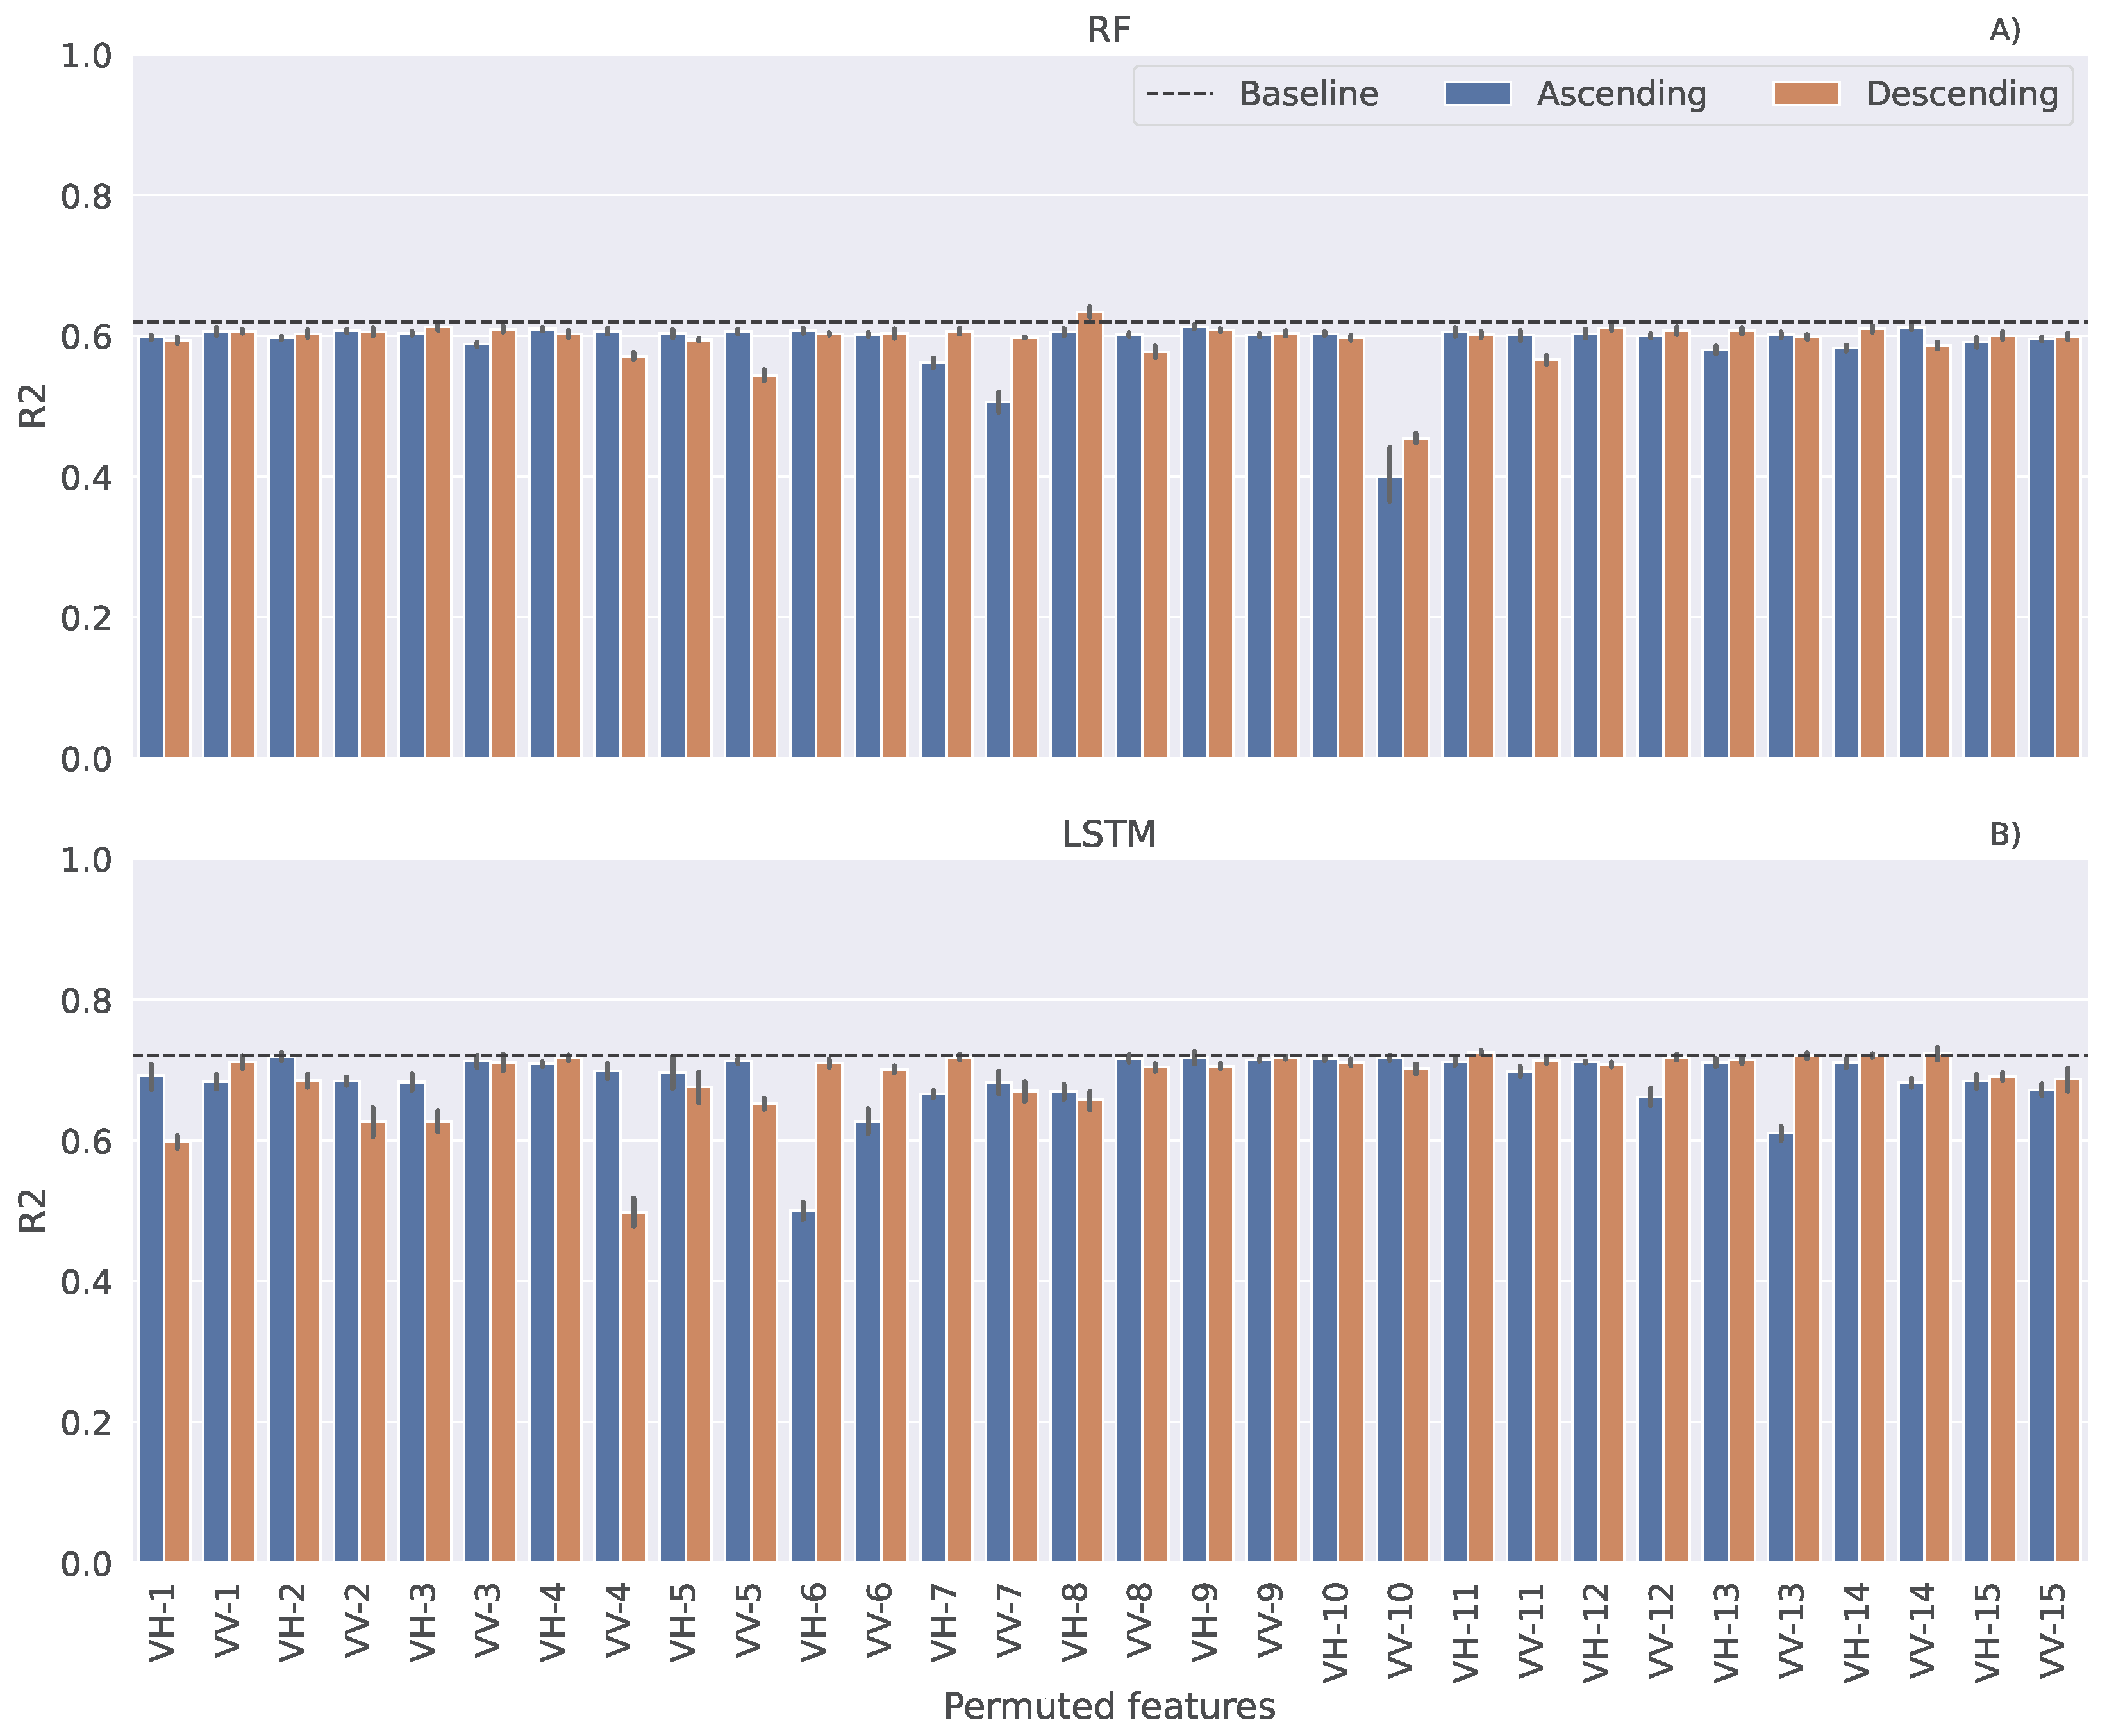
score when shortening the length. There is just a slight decrease when only 10 dates are used, there are no big differences between 9 and 6 dates, while there is a steep decrease when fewer than 5 dates are used. This is highly in accordance with the results of the permutation feature importance test (
Figure 6B), showing that the model is learning relevant information from the features in the first half of the season.
Regrading the prediction of the harvest date for winter wheat, the LSTM model with an MAE of 4.87 and RMSE of 5.86 outperformed the MAE of 6.5 days and RMSE of 8 days for spring cereals (mainly wheat) in Kazakhstan, also obtained by using SAR data [
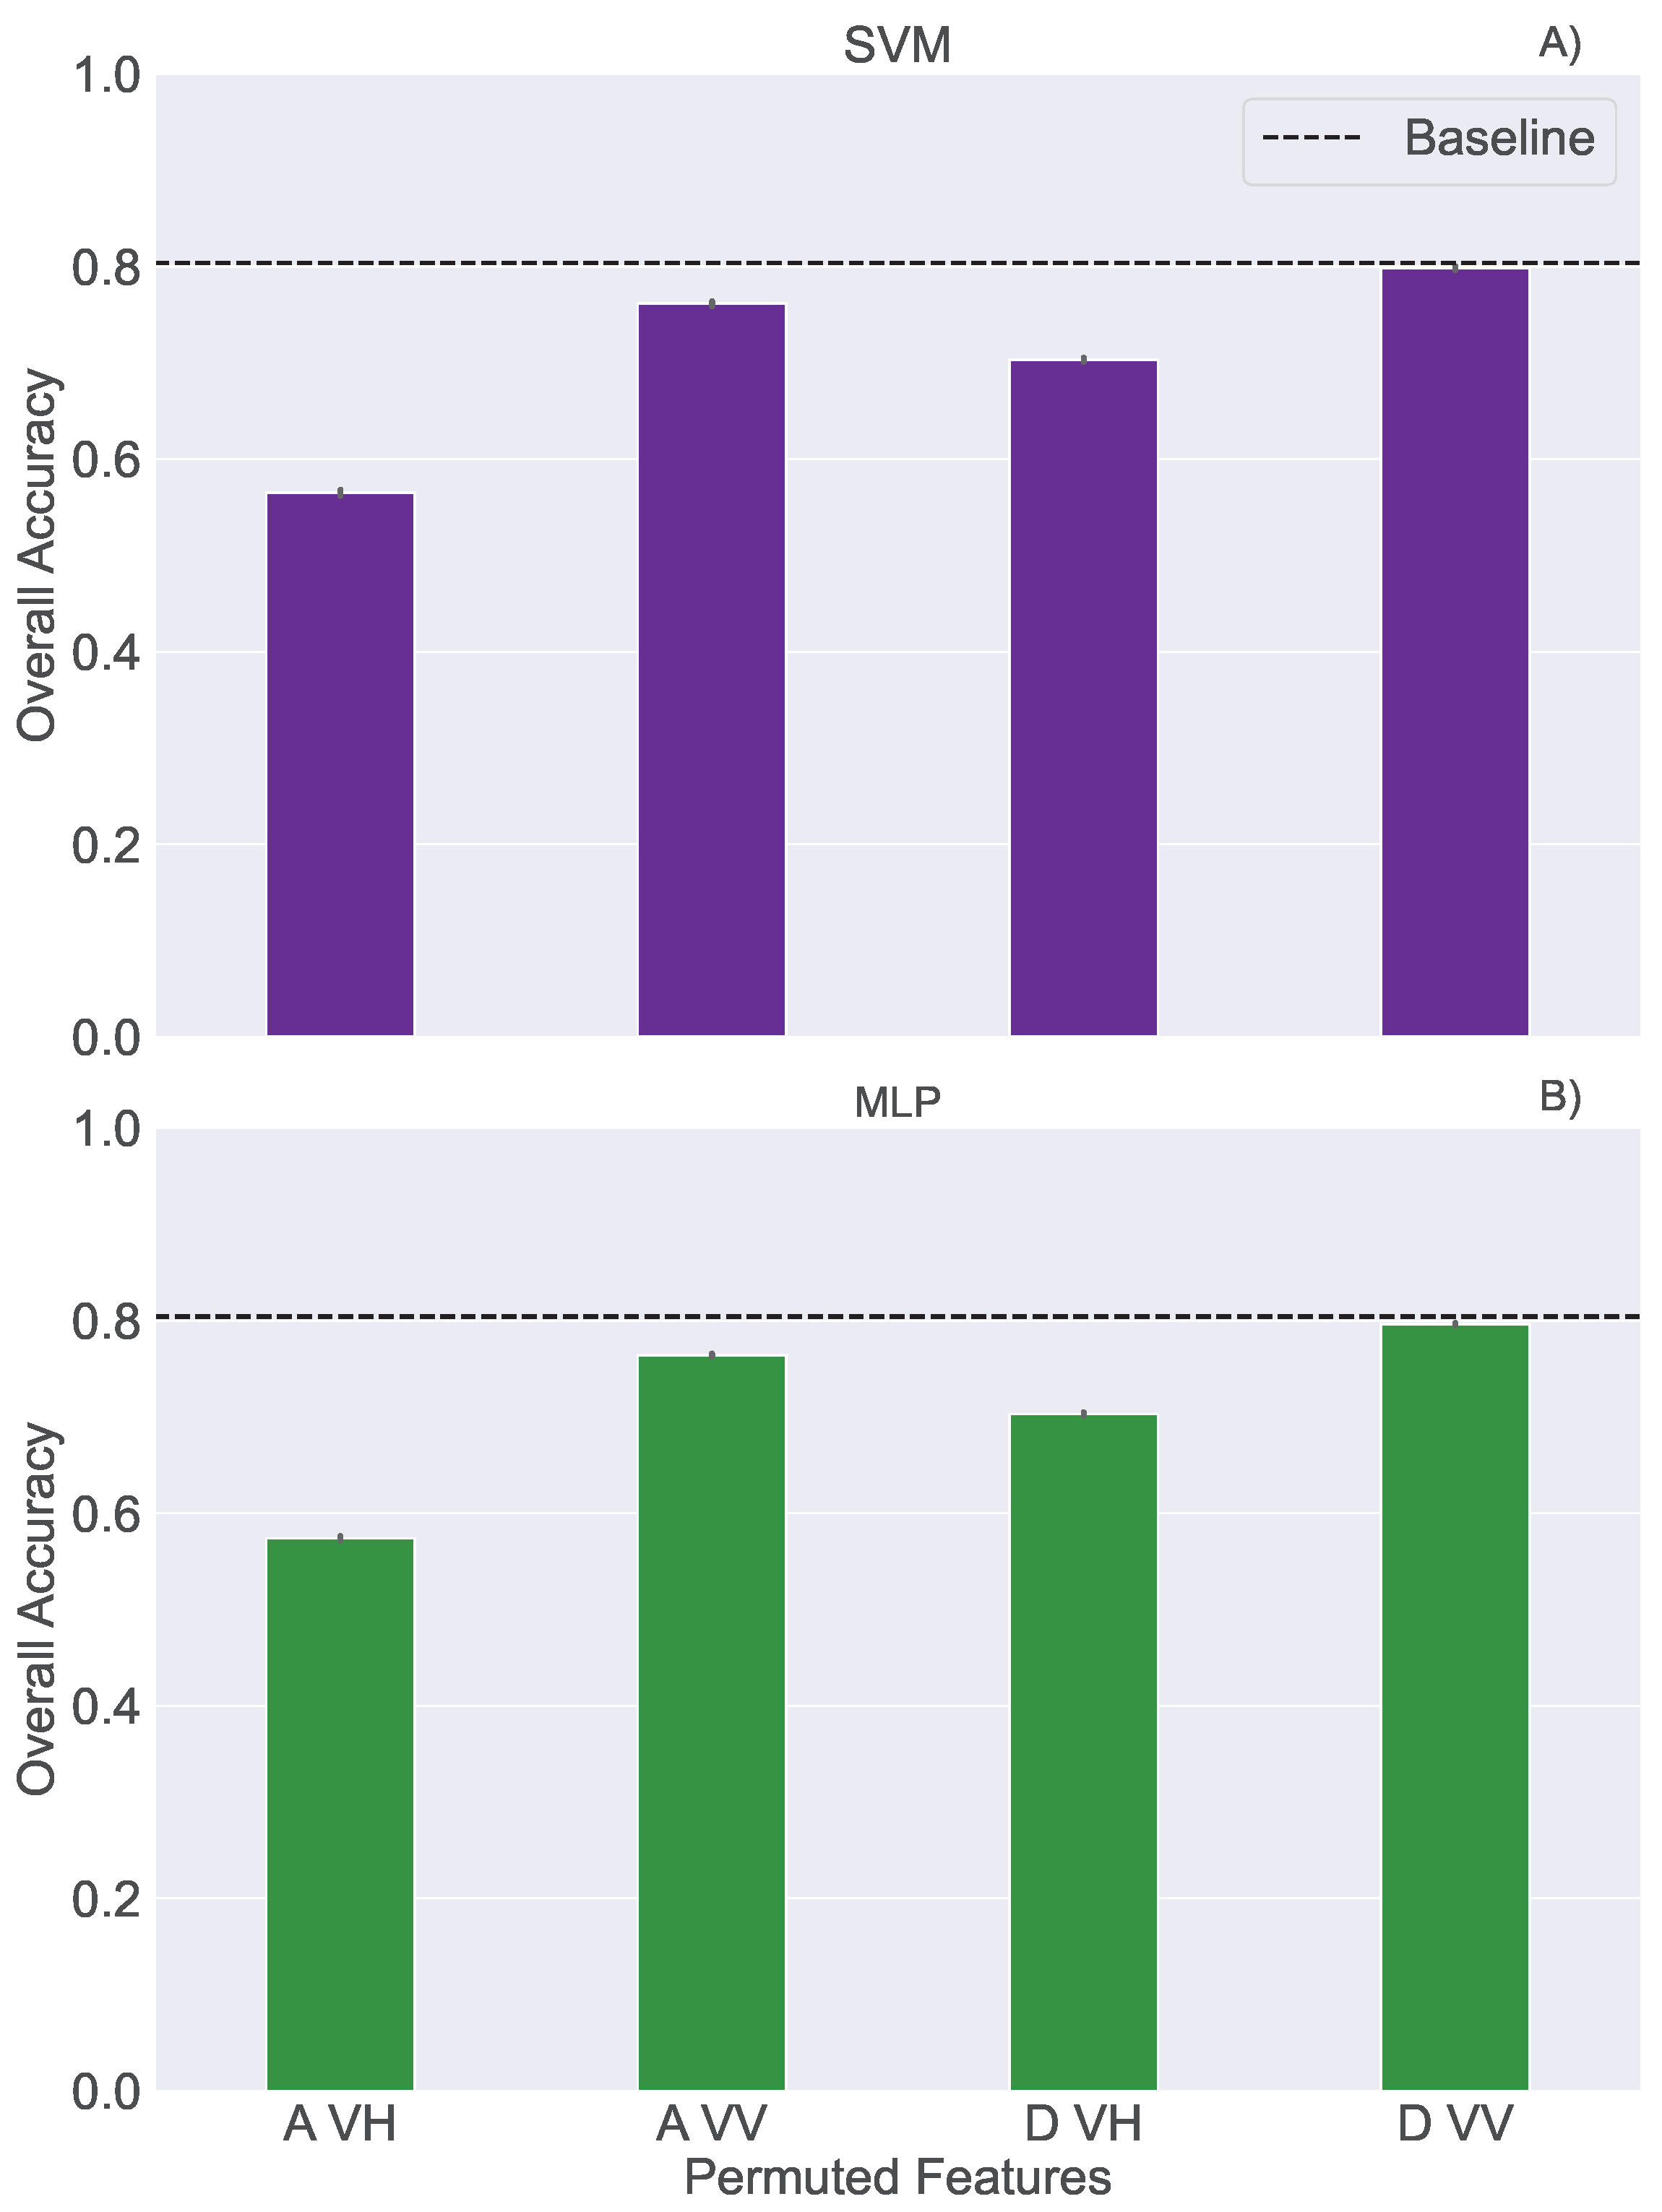
21]. With overall accuracy above 80%, both classification models developed in this study for all crops outperformed the result of 56% for harvest date identification for cereals, soybean and maize, among other crops in Canada, using InSAR data [
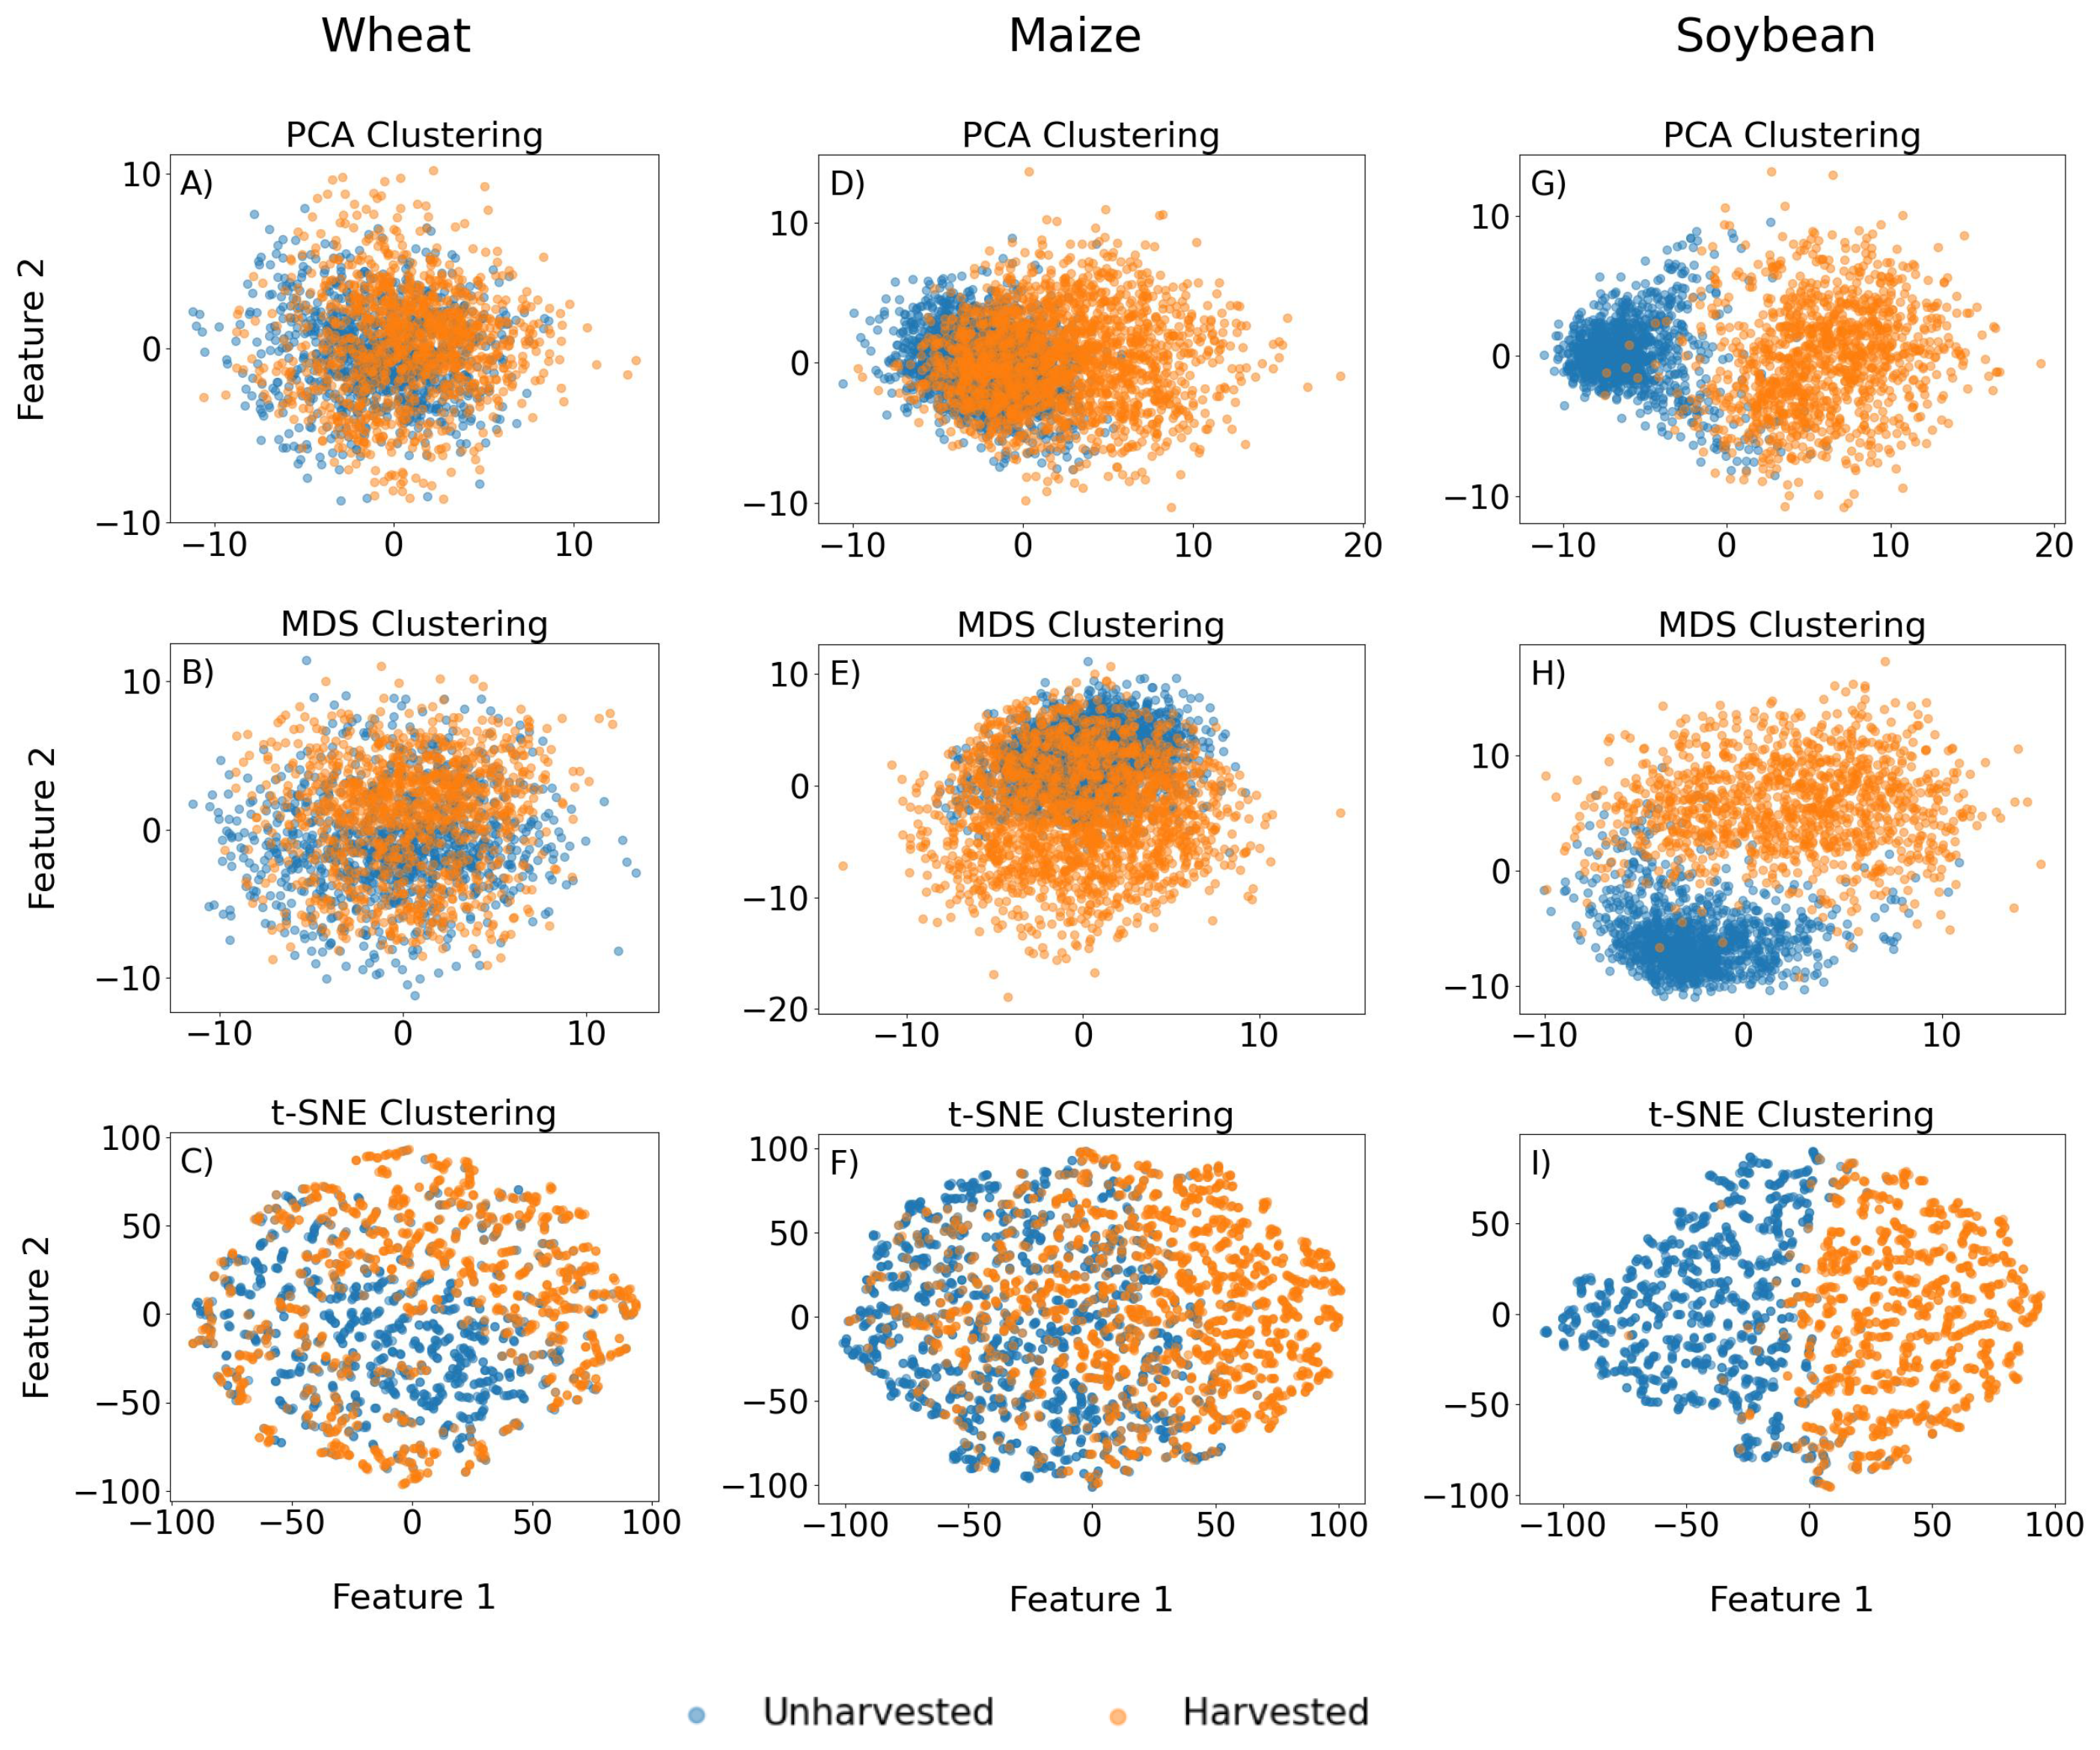
24]. This performance metric achieved for all three crops underscores the models’ robustness and potential applicability for diverse crops. The overall accuracies of the classification models developed for each crop separately, being 79.65% for wheat, 83.41% for maize and 95.97% for soybean, are in line with the results of the clustering analysis and observed separability of data points in 2D space. The outstanding results particularly for soybean could imply distinct or more separable features compared to the other crops, offering insights for focused soybean research or tailored agricultural practices. This is in accordance with the results for the harvest detection of soybean and maize in Argentina achieved with SAR data, where overall accuracy was up to 93% for both crops [
23]. This is, mostly, because of the difference in the physical features of the crops before and after harvest. In one of our future works, we intend to expand in this direction and develop phenomenological ML models that leverage the physical differences in the crops before and after harvest in order to enhance the performance of the ML models.
In the near future work, it would be interesting to test the SVM and LSTM models for harvest date detection and prediction by conducting transfer learning in some other agricultural regions in Europe. The suitable option for that might be the Netherlands, which has quite similar terrain to that in Vojvodina, and where wheat and maize are grown as well. The future work might comprise data fusion of Sentinel-1 SAR and Sentinel-2 optical data to investigate the potential benefits of including more data in visible, NIR and SWIR parts of the electromagnetic spectrum in the analysis.
5. Conclusions
In this study, determination and prediction of harvest dates for winter wheat, maize and soybean were performed by applying various machine learning techniques on Sentinel-1 SAR data. The cluster analysis with PCA, MDS and t-SNE algorithms showed no separability between unharvested and harvested data for wheat, poor separability for maize and fair separability for soybean fields. In this example, the t-SNE algorithm showed more discriminatory power compared to MDS and PCA, indicating non-linearity in soybean data. The results of classification models based on the SVM and MLP algorithms were in line with the observed separability of data points in 2D space obtained by clustering. The best results of harvest detection were obtained for soybean, followed by maize and then wheat. Considering all performance metrics, both algorithms showed quite similar behaviour, having SVM slightly outperforming MLP. In the case of the regression models, the neural network-based algorithm, i.e., LSTM, showed better performance in the task of harvest date prediction compared to the RF algorithm, providing results with an MAE around six days, which is in line with the time interval of the acquisition of Sentinel-1 images. This result reflects the usability of the LSTM model in the studied region for operational purpose.

 ,
, 