

A Comparative Study of CO2 Forecasting Strategies in School Classrooms: A Step Toward Improving Indoor Air Quality


Abstract
1. Introduction
- Use of Real-World Datasets: Many studies rely on publicly available or simulated datasets, which may not accurately reflect real-world conditions, thereby introducing noise and potentially biasing models.
- Validation Techniques: Inadequate validation strategies can affect model performance and generalization. Many studies provide limited details on the validation methods used or apply traditional ML techniques that do not account for temporal dependencies in the TS data. Adopting specialized TS validation techniques would provide more robust insights.
- Prediction Horizons: Although model performance varies across different prediction horizons, systematic comparisons are rare. In IAQ forecasting, earlier predictions allow more time for corrective actions such as activating ventilation systems. Without systematic comparisons, it is difficult to understand how the effectiveness of the model changes over time and how timing impacts decision-making.
- Comparison with Simple Models: Complex DL architectures are often assumed to outperform simpler models. However, in short-term predictions, simpler models with lower computational costs can achieve similar accuracy. Whether or not complex ML models consistently outperform simpler methods in TS forecasting remains an open question [33,34].
- Statistical Techniques for Reliability: Statistical methods that enhance the reliability and validity of forecasting results are underutilized in the literature. The absence of rigorous statistical validation can undermine the credibility of model performance and its generalization to real-world scenarios.
- Scale-Independent Performance Metrics: Many studies rely on traditional ML performance metrics that are scale-dependent, which complicates the comparison of forecasting models across different TS datasets. The use of scale-independent metrics is essential for more reliable and comparable evaluations.
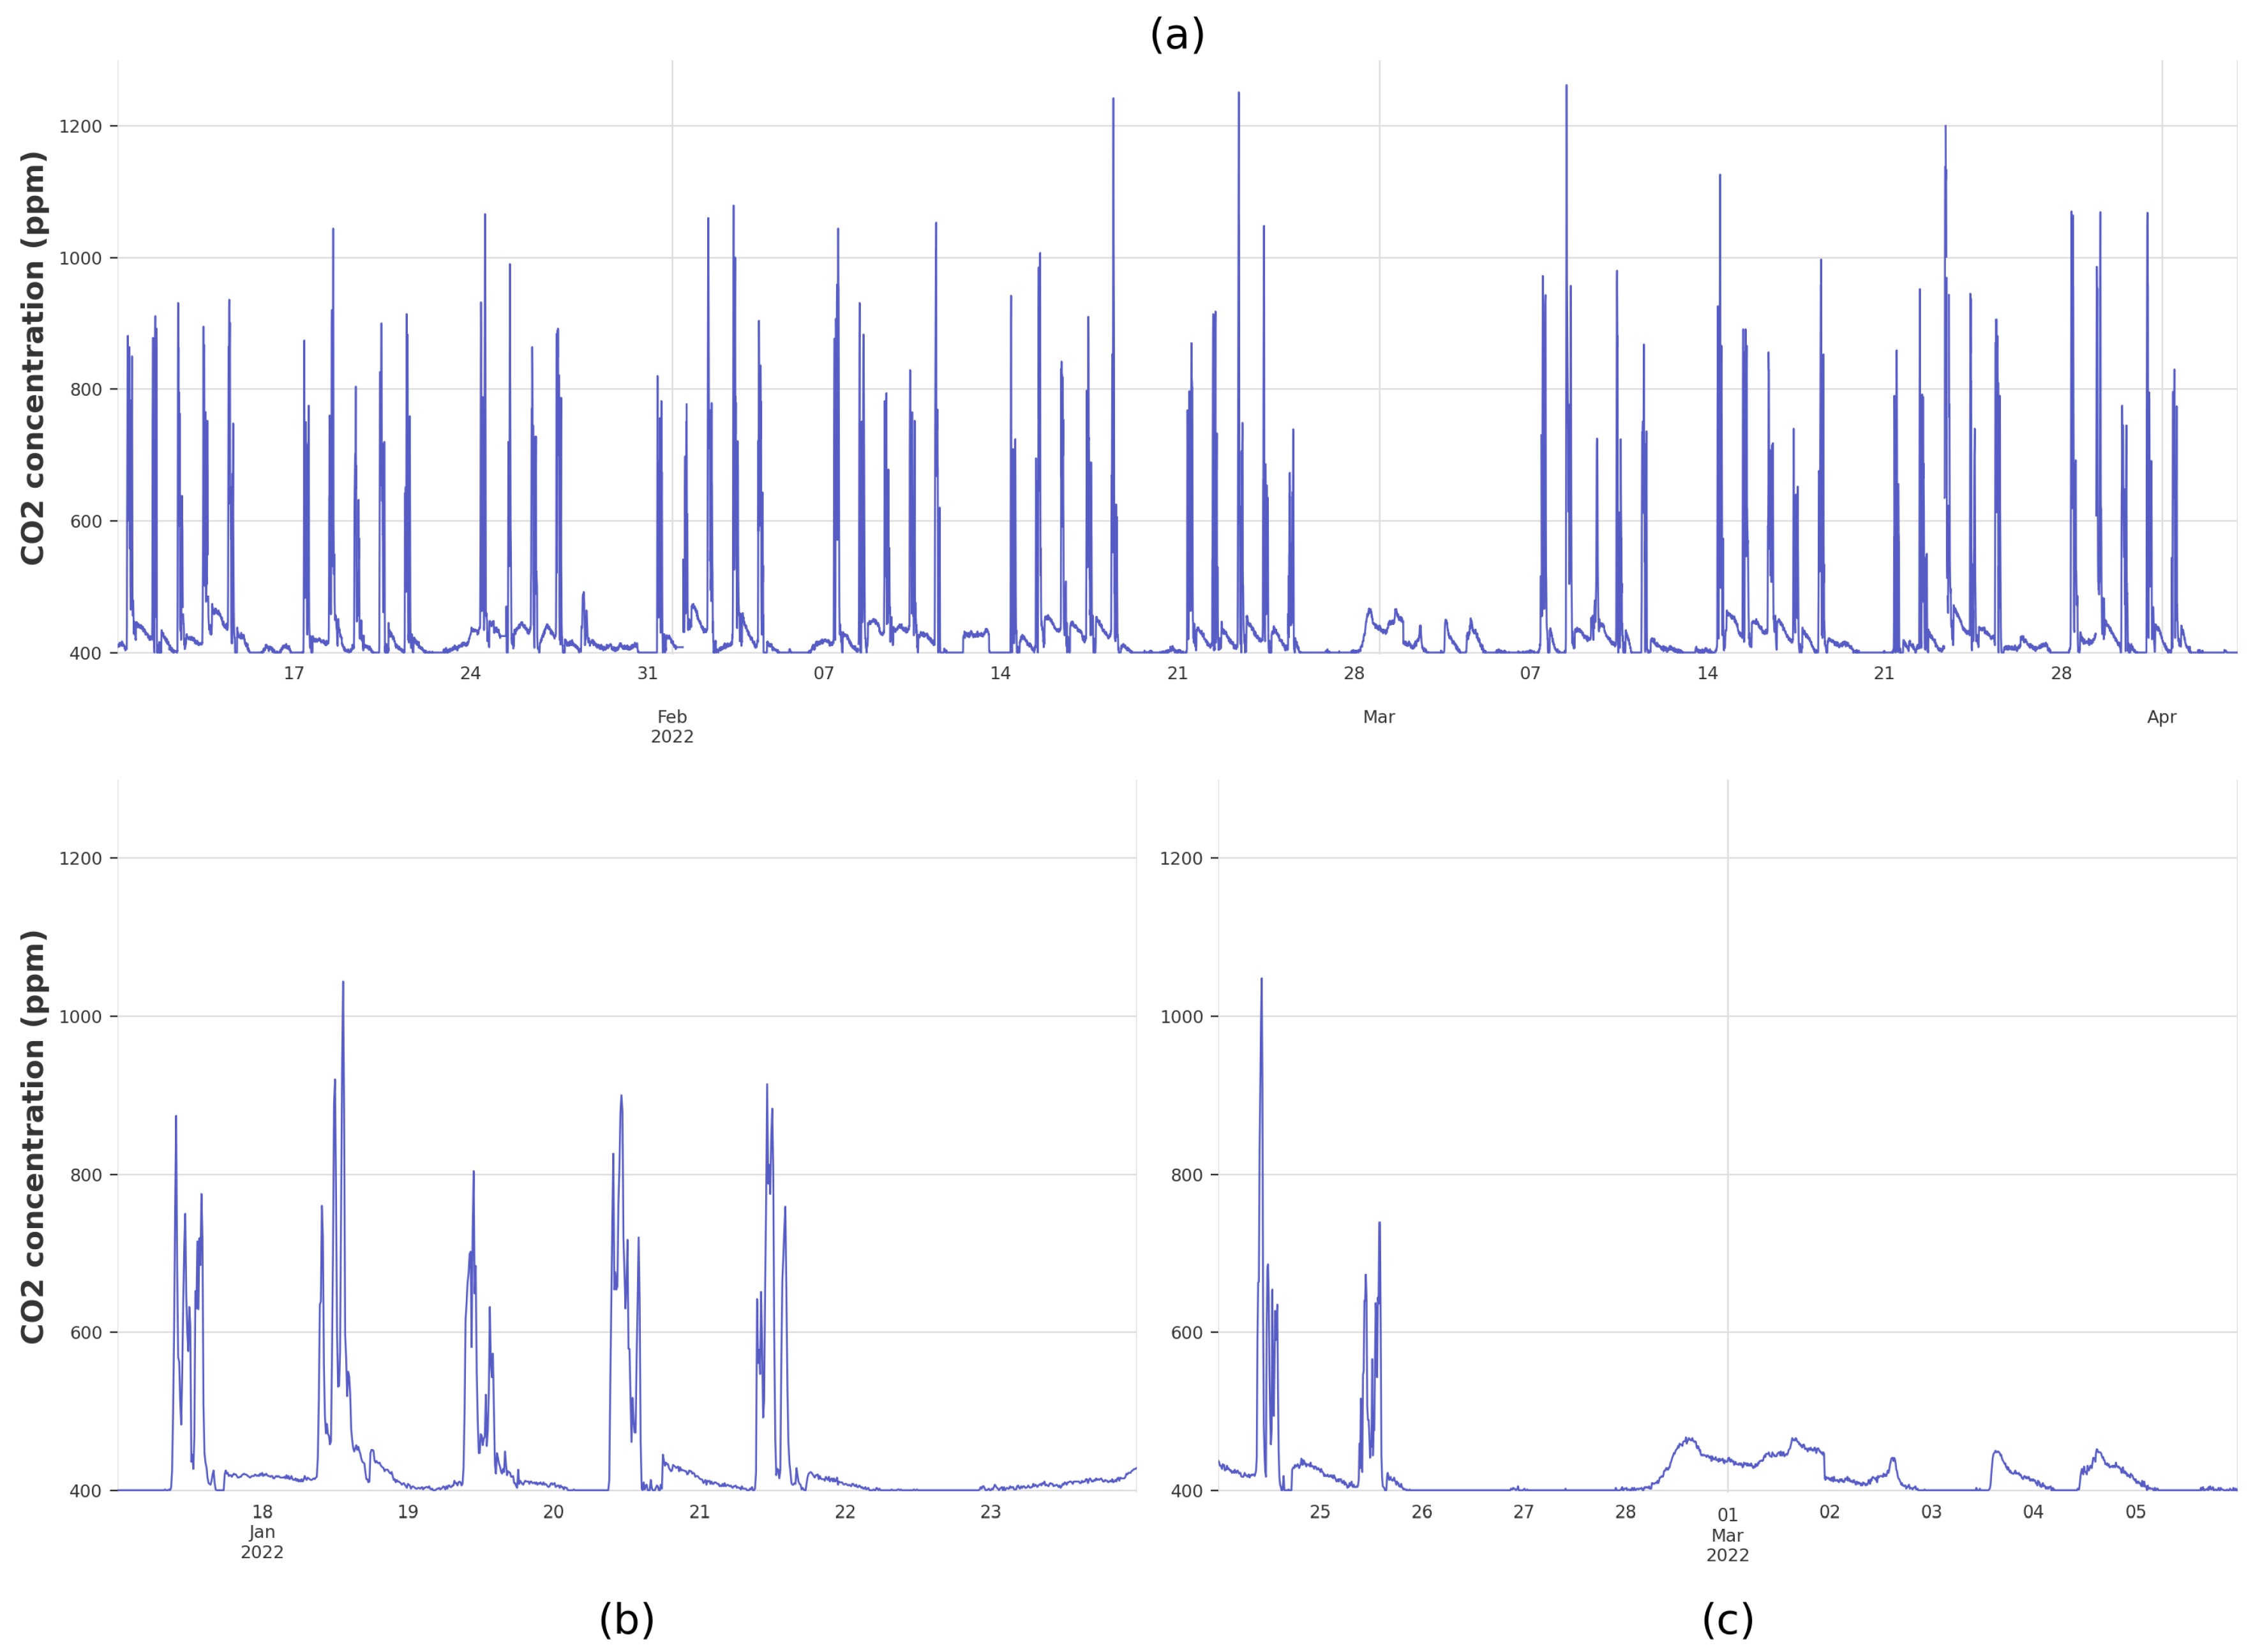
- Real-World Data Collection: CO2 levels were continuously monitored in fifteen schools located in Navarra, Spain using IoT devices from 10 January 2022 to 3 April 2022.
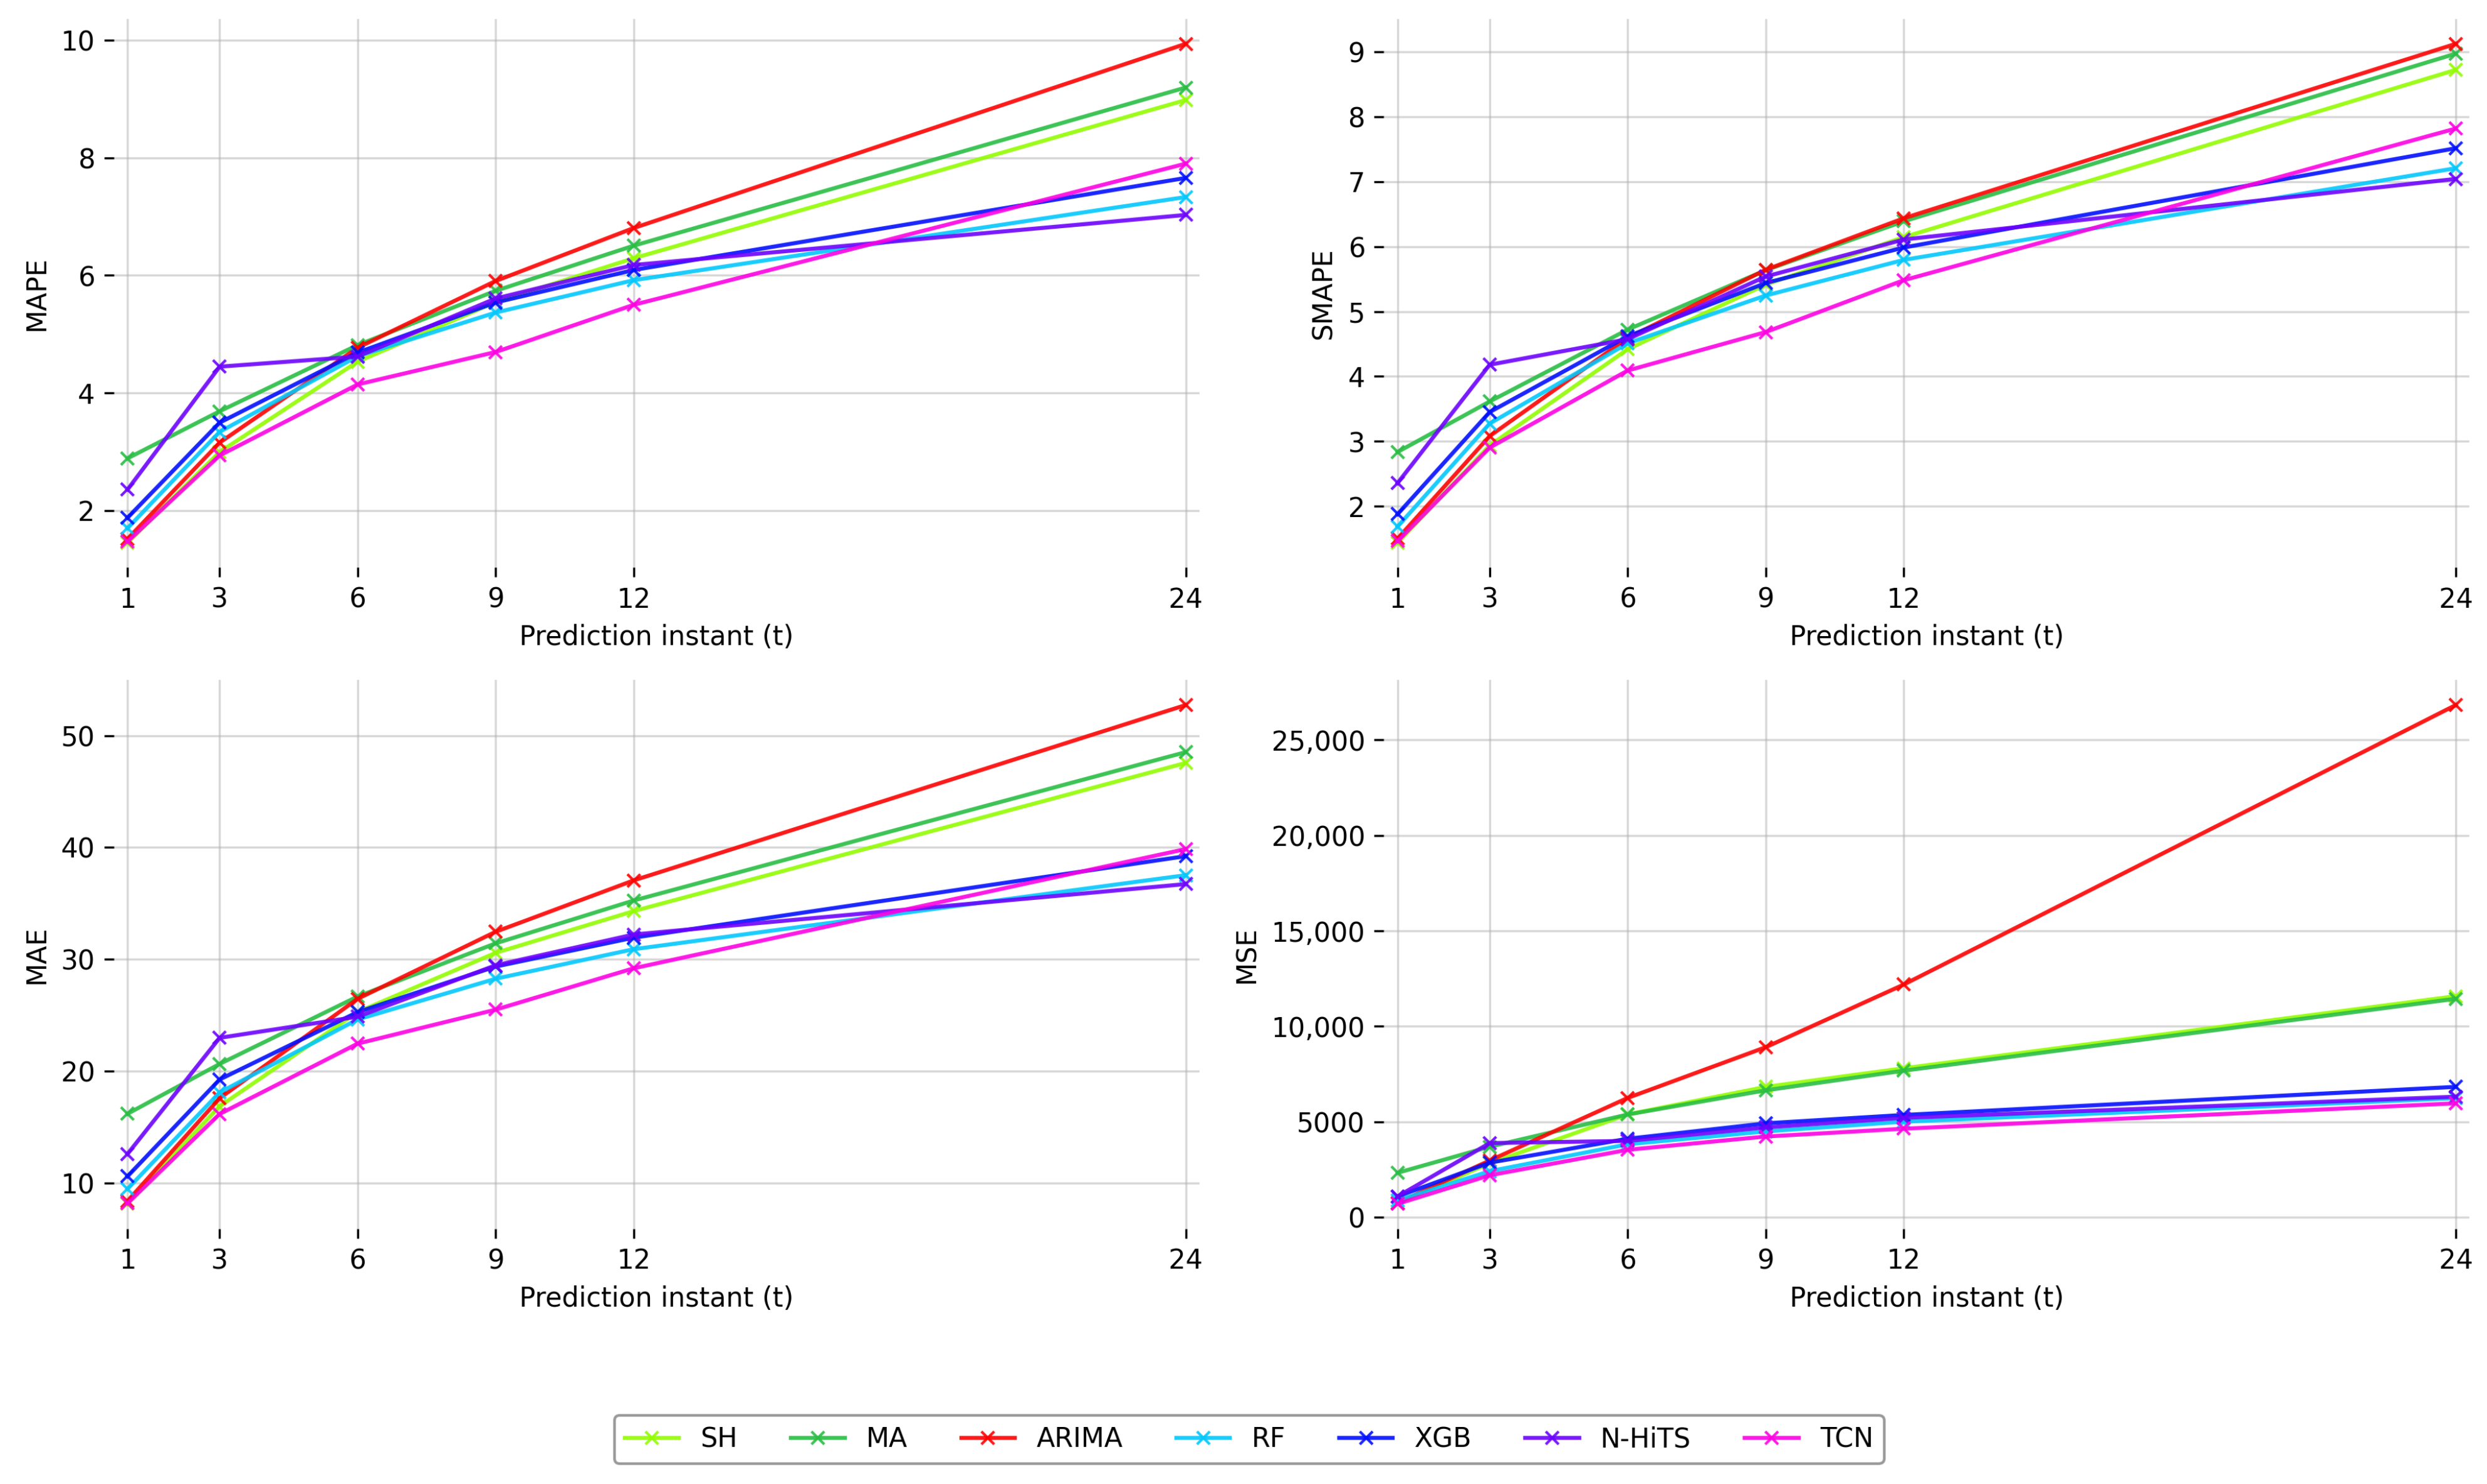
- Forecasting Methodologies: Three distinct strategies were implemented: simplistic methods (Shifted Model and Moving Average Model), a statistical approach (ARIMA), and ML-based models (XGBoost, Random Forest, N-HiTS, and TCN), allowing for a comprehensive evaluation of forecasting effectiveness and complexity.
- Prediction Horizons: The forecasting models were tested across six different horizons ranging from 10 min to 4 h in order to systematically assess how model performance varies over different temporal windows.
- Validation and Statistical Testing: A rolling cross-validation scheme was employed to account for temporal dependencies, ensuring robust and unbiased performance evaluation. Additionally, statistical tests were conducted to validate the results, enhancing the reliability and credibility of the findings. Scale-independent performance metrics were used to enable consistent and fair comparisons across models.
2. Materials and Methods
2.1. Data Collection
2.1.1. Study Area
2.1.2. Devices
2.2. Data Analysis and Preprocessing
Preprocessing
2.3. Data Partitioning for Validation
2.4. Model Training
2.5. Model Evaluation
2.6. Implementation Tools
3. Results and Discussion
Statistical Test
4. Conclusions and Future Work
Author Contributions
Funding
Institutional Review Board Statement
Informed Consent Statement
Data Availability Statement
Conflicts of Interest
References
- Leech, J.A.; Nelson, W.C.; Burnett, R.T.; Aaron, S.; Raizenne, M.E. It’s about time: A comparison of Canadian and American time–activity patterns. J. Expo. Sci. Environ. Epidemiol. 2002, 12, 427–432. [Google Scholar] [CrossRef]
- Tran, V.V.; Park, D.; Lee, Y.C. Indoor Air Pollution, Related Human Diseases, and Recent Trends in the Control and Improvement of Indoor Air Quality. Int. J. Environ. Res. Public Health 2020, 17, 2927. [Google Scholar] [CrossRef] [PubMed]
- López, L.; Dessì, P.; Cabrera-Codony, A.; Rocha-Melogno, L.; Kraakman, B.; Naddeo, V.; Balaguer, M.; Puig, S. CO2 in indoor environments: From environmental and health risk to potential renewable carbon source. Sci. Total Environ. 2023, 856, 159088. [Google Scholar] [CrossRef] [PubMed]
- Alqarni, Z.; Rezgui, Y.; Petri, I.; Ghoroghi, A. Viral infection transmission and indoor air quality: A systematic review. Sci. Total Environ. 2024, 923, 171308. [Google Scholar] [CrossRef]
- World Health Organization. Household Air Pollution and Health. Available online: https://www.who.int/news-room/fact-sheets/detail/household-air-pollution-and-health (accessed on 19 June 2023).
- Inbiot Monitoring, S.L. CO2. Available online: https://www.inbiot.es/wikinbiot/co2 (accessed on 19 June 2023).
- Lala, B.; Hagishima, A. A Review of Thermal Comfort in Primary Schools and Future Challenges in Machine Learning Based Prediction for Children. Buildings 2022, 12, 2007. [Google Scholar] [CrossRef]
- Yang, G.; Zhou, Y.; Yan, B. Contribution of influential factors on PM2.5 concentrations in classrooms of a primary school in North China: A machine discovery approach. Energy Build. 2023, 283, 112787. [Google Scholar] [CrossRef]
- Muscatiello, N.; McCarthy, A.; Kielb, C.; Hsu, W.H.; Hwang, S.A.; Lin, S. Classroom conditions and CO2 concentrations and teacher health symptom reporting in 10 New York State Schools. Indoor Air 2014, 25, 157–167. [Google Scholar] [CrossRef]
- Norbäck, D.; Nordström, K.; Zhao, Z. Carbon dioxide (CO2) demand-controlled ventilation in university computer classrooms and possible effects on headache, fatigue and perceived indoor environment: An intervention study. Int. Arch. Occup. Environ. Health 2012, 86, 199–209. [Google Scholar] [CrossRef]
- Twardella, D.; Matzen, W.; Lahrz, T.; Burghardt, R.; Spegel, H.; Hendrowarsito, L.; Frenzel, A.C.; Fromme, H. Effect of classroom air quality on students’ concentration: Results of a cluster-randomized cross-over experimental study. Indoor Air 2012, 22, 378–387. [Google Scholar] [CrossRef]
- Coley, D.A.; Greeves, R.; Saxby, B.K. The Effect of Low Ventilation Rates on the Cognitive Function of a Primary School Class. Int. J. Vent. 2007, 6, 107–112. [Google Scholar] [CrossRef]
- Dorizas, P.V.; Assimakopoulos, M.N.; Santamouris, M. A holistic approach for the assessment of the indoor environmental quality, student productivity, and energy consumption in primary schools. Environ. Monit. Assess. 2015, 187, 259. [Google Scholar] [CrossRef] [PubMed]
- Kallio, J.; Vildjiounaite, E.; Koivusaari, J.; Räsänen, P.; Similä, H.; Kyllönen, V.; Muuraiskangas, S.; Ronkainen, J.; Rehu, J.; Vehmas, K. Assessment of perceived indoor environmental quality, stress and productivity based on environmental sensor data and personality categorization. Build. Environ. 2020, 175, 106787. [Google Scholar] [CrossRef]
- Di Gilio, A.; Palmisani, J.; Pulimeno, M.; Cerino, F.; Cacace, M.; Miani, A.; De Gennaro, G. CO2 concentration monitoring inside educational buildings as a strategic tool to reduce the risk of Sars-CoV-2 airborne transmission. Environ. Res. 2021, 202, 111560. [Google Scholar] [CrossRef]
- Box, G.E.P.; Jenkins, G. Time Series Analysis, Forecasting and Control; Holden-Day, Inc.: Holden, MA, USA, 1976. [Google Scholar]
- Dai, X.; Shang, W.; Liu, J.; Xue, M.; Wang, C. Achieving better indoor air quality with IoT systems for future buildings: Opportunities and challenges. Sci. Total Environ. 2023, 895, 164858. [Google Scholar] [CrossRef]
- Cho, J.H.; Moon, J.W. Integrated artificial neural network prediction model of indoor environmental quality in a school building. J. Clean. Prod. 2022, 344, 131083. [Google Scholar] [CrossRef]
- Kim, J.; Hong, Y.; Seong, N.; Kim, D.D. Assessment of ANN Algorithms for the Concentration Prediction of Indoor Air Pollutants in Child Daycare Centers. Energies 2022, 15, 2654. [Google Scholar] [CrossRef]
- Woo, J.; Lee, J.H.; Kim, Y.; Rudasingwa, G.; Lim, D.H.; Kim, S. Forecasting the Effects of Real-Time Indoor PM2.5 on Peak Expiratory Flow Rates (PEFR) of Asthmatic Children in Korea: A Deep Learning Approach. IEEE Access 2022, 10, 19391–19400. [Google Scholar] [CrossRef]
- Wong, P.Y.; Lee, H.Y.; Chen, L.J.; Chen, Y.C.; Chen, N.T.; Lung, S.C.C.; Su, H.J.; Wu, C.D.; Laurent, J.G.C.; Adamkiewicz, G.; et al. An alternative approach for estimating large-area indoor PM2.5 concentration—A case study of schools. Build. Environ. 2022, 219, 109249. [Google Scholar] [CrossRef]
- Deng, X.; Thurston, G.; Zhang, W.; Ryan, I.; Jiang, C.; Khwaja, H.; Romeiko, X.; Marks, T.; Ye, B.; Qu, Y.; et al. Application of data science methods to identify school and home risk factors for asthma and allergy-related symptoms among children in New York. Sci. Total Environ. 2021, 770, 144746. [Google Scholar] [CrossRef]
- Lin, Z.; Lin, S.; Neamtiu, I.A.; Ye, B.; Csobod, E.; Fazakas, E.; Gurzau, E. Predicting environmental risk factors in relation to health outcomes among school children from Romania using random forest model—An analysis of data from the SINPHONIE project. Sci. Total Environ. 2021, 784, 147145. [Google Scholar] [CrossRef]
- Ho, T.K. Random decision forests. In Proceedings of the 3rd International Conference on Document Analysis and Recognition, Montreal, QC, Canada, 14–16 August 1995; Volume 1, pp. 278–282. [Google Scholar] [CrossRef]
- Chen, T.; Guestrin, C. XGBoost: A Scalable Tree Boosting System. In Proceedings of the 22nd ACM SIGKDD International Conference on Knowledge Discovery and Data Mining, New York, NY, USA, 13–17 August 2016; KDD ’16. pp. 785–794. [Google Scholar] [CrossRef]
- Challu, C.; Olivares, K.G.; Oreshkin, B.N.; Garza, F.; Mergenthaler-Canseco, M.; Dubrawski, A. N-HiTS: Neural Hierarchical Interpolation for Time Series Forecasting. arXiv 2022, arXiv:2201.12886. [Google Scholar] [CrossRef]
- Lea, C.; Vidal, R.; Reiter, A.; Hager, G.D. Temporal convolutional networks: A unified approach to action segmentation. In Proceedings of the IEEE Conference on Computer Vision and Pattern Recognition, Honolulu, HI, USA, 21–26 July 2017; pp. 156–165. [Google Scholar]
- Hochreiter, S.; Schmidhuber, J. Long short-term memory. Neural Comput. 1997, 9, 1735–1780. [Google Scholar] [CrossRef] [PubMed]
- Cho, K.; van Merrienboer, B.; Gulcehre, C.; Bahdanau, D.; Bougares, F.; Schwenk, H.; Bengio, Y. Learning phrase representations using RNN encoder-decoder for statistical machine translation. arXiv 2014, arXiv:1406.1078. [Google Scholar]
- Lin, W.-H.; Wang, P.; Chao, K.-M.; Lin, H.-C.; Yang, Z.-Y.; Lai, Y.-H. Wind Power Forecasting with Deep Learning Networks: Time-Series Forecasting. Appl. Sci. 2021, 11, 10335. [Google Scholar] [CrossRef]
- Solís, M.; Calvo-Valverde, L.-A. Performance of Deep Learning models with transfer learning for multiple-step-ahead forecasts in monthly time series. Intel. Artif. 2022, 25, 110–125. [Google Scholar] [CrossRef]
- Qin, H. Comparison of Deep learning models on time series forecasting: A case study of Dissolved Oxygen Prediction. arXiv 2019, arXiv:1911.08414. [Google Scholar]
- Elsayed, S.; Thyssens, D.; Rashed, A.; Jomaa, H.S.; Schmidt-Thieme, L. Do We Really Need Deep Learning Models for Time Series Forecasting? arXiv 2021, arXiv:2101.02118. [Google Scholar]
- Makridakis, S.; Spiliotis, E.; Assimakopoulos, V. Statistical and Machine Learning forecasting methods: Concerns and ways forward. PLoS ONE 2018, 13, e0194889. [Google Scholar] [CrossRef]
- RESET® Standard. Available online: https://www.reset.build/directory/monitors/rm-047 (accessed on 24 January 2024).
- Oreshkin, B.N.; Carpov, D.; Chapados, N.; Bengio, Y. N-BEATS: Neural basis expansion analysis for interpretable time series forecasting. arXiv 2019, arXiv:1905.10437. [Google Scholar] [CrossRef]
- Bai, S.; Kolter, J.Z.; Koltun, V. An empirical evaluation of generic convolutional and recurrent networks for sequence modeling. arXiv 2018, arXiv:1803.01271. [Google Scholar]
- van den Oord, A.; Dieleman, S.; Zen, H.; Simonyan, K.; Vinyals, O.; Graves, A.; Kalchbrenner, N.; Senior, A.; Kavukcuoglu, K. WaveNet: A generative model for raw audio. arXiv 2016, arXiv:1609.03499. [Google Scholar]
- Herzen, J.; Lässig, F.; Giuliano Piazzetta, S.; Neuer, T.; Tafti, L.; Raille, G.; Van Pottelbergh, T.; Pasieka, M.; Skrodzki, A.; Huguenin, N.; et al. Darts: User-Friendly Modern Machine Learning for Time Series. J. Mach. Learn. Res. 2022, 23, 1–6. [Google Scholar]
- Hodges, J.L.J.; Lehmann, E.L. Rank Methods for Combination of Independent Experiments in Analysis of Variance. Ann. Math. Stat. 1962, 33, 482–497. [Google Scholar] [CrossRef]
- Holm, S. A Simple Sequentially Rejective Multiple Test Procedure. Scand. J. Stat. 1979, 6, 65–70. [Google Scholar]
- Demsar, J. Statistical Comparisons of Classifiers over Multiple Data Sets. J. Mach. Learn. Res. 2006, 7, 1–30. [Google Scholar]
- Garcia, S.; Herrera, F. An Extension on “Statistical Comparisons of Classifiers over Multiple Data Sets” for all Pairwise Comparisons. J. Mach. Learn. Res. 2008, 9, 2677–2694. [Google Scholar]
- García, S.; Fernández, A.; Luengo, J.; Herrera, F. Advanced nonparametric tests for multiple comparisons in the design of experiments in computational intelligence and data mining: Experimental analysis of power. Inf. Sci. 2010, 180, 2044–2064. [Google Scholar] [CrossRef]
- García, S.; Fernández, A.; Luengo, J.; Herrera, F. A study of statistical techniques and performance measures for genetics-based machine learning: Accuracy and interpretability. Soft Comput. 2009, 13, 959–977. [Google Scholar]
- Zhang, M.; Ding, D.; Pan, X.; Yang, M. Enhancing Time Series Predictors With Generalized Extreme Value Loss. IEEE Trans. Knowl. Data Eng. 2023, 35, 1473–1487. [Google Scholar] [CrossRef]


| School | Non-Occupation | Occupation | Global | |||||
|---|---|---|---|---|---|---|---|---|
| Mean | Std | Max | Mean | Std | Max | Mean | Std | |
| 408.31 | 9.46 | 438.00 | 432.54 | 49.57 | 849.00 | 430.26 | 47.79 | |
| 409.30 | 11.29 | 447.00 | 462.74 | 92.42 | 1016.00 | 457.72 | 89.41 | |
| 405.23 | 7.69 | 436.00 | 450.12 | 101.97 | 1262.00 | 445.90 | 97.97 | |
| 401.81 | 3.66 | 419.00 | 431.77 | 59.91 | 924.00 | 428.95 | 57.70 | |
| 404.82 | 7.37 | 429.00 | 497.35 | 139.44 | 1954.00 | 488.65 | 135.46 | |
| 404.70 | 7.54 | 446.00 | 455.03 | 86.88 | 1137.00 | 450.30 | 84.02 | |
| 409.86 | 9.62 | 445.00 | 453.20 | 122.30 | 1971.00 | 449.12 | 117.12 | |
| 410.30 | 11.37 | 463.00 | 457.38 | 115.82 | 1599.00 | 452.93 | 111.12 | |
| 404.38 | 6.85 | 443.00 | 431.34 | 63.54 | 1081.00 | 428.81 | 61.02 | |
| 405.15 | 6.94 | 444.00 | 436.79 | 49.99 | 734.00 | 433.81 | 48.51 | |
| 417.11 | 24.84 | 515.00 | 478.23 | 118.44 | 1639.00 | 472.48 | 114.39 | |
| 401.53 | 3.79 | 425.00 | 441.62 | 55.82 | 977.00 | 437.84 | 54.41 | |
| 403.92 | 6.83 | 431.00 | 468.97 | 119.93 | 1562.00 | 462.84 | 115.73 | |
| 409.35 | 10.19 | 446.00 | 458.75 | 109.62 | 1125.00 | 454.11 | 105.37 | |
| 404.44 | 6.61 | 434.00 | 432.71 | 45.17 | 827.00 | 430.05 | 43.82 | |
| AVG | 406.68 | 8.94 | 444.07 | 452.57 | 88.72 | 1243.80 | 448.25 | 85.59 |
| TRAIN | VAL | |||
|---|---|---|---|---|
| #Fold | Start-Date | End-Date | Start-Date | End-Date |
| 1 | 10-Jan-2022 | 6-Feb-2022 | 7-Feb-2022 | 13-Feb-2022 |
| 2 | 17-Jan-2022 | 13-Feb-2022 | 14-Feb-2022 | 20-Feb-2022 |
| 3 | 24-Jan-2022 | 20-Feb-2022 | 21-Feb-2022 | 27-Feb-2022 |
| 4 | 31-Jan-2022 | 27-Feb-2022 | 28-Feb-2022 | 6-Mar-2022 |
| 5 | 7-Feb-2022 | 6-Mar-2022 | 7-Mar-2022 | 13-Mar-2022 |
| 6 | 14-Feb-2022 | 13-Mar-2022 | 14-Mar-2022 | 20-Mar-2022 |
| 7 | 21-Feb-2022 | 20-Mar-2022 | 21-Mar-2022 | 27-Mar-2022 |
| 8 | 28-Feb-2022 | 27-Mar-2022 | 28-Mar-2022 | 3-Apr-2022 |
| Prediction Instant (t) | Metric | SH | MA | ARIMA | RF | XGB | N-HiTS | TCN |
|---|---|---|---|---|---|---|---|---|
| 1 | MAPE | 1.452 | 2.887 | 1.518 | 1.700 | 1.877 | 2.357 | 1.473 |
| MAE | 8.126 | 16.183 | 8.389 | 9.472 | 10.595 | 12.599 | 8.176 | |
| MSE | 730.4 | 2319.3 | 750.8 | 871.6 | 1082.9 | 1083.7 | 693.6 | |
| SMAPE | 1.441 | 2.837 | 1.504 | 1.690 | 1.880 | 2.359 | 1.465 | |
| 3 | MAPE | 2.995 | 3.688 | 3.154 | 3.337 | 3.494 | 4.447 | 2.935 |
| MAE | 16.851 | 20.638 | 17.569 | 18.088 | 19.245 | 22.971 | 16.160 | |
| MSE | 2820.0 | 3685.6 | 2961.9 | 2402.8 | 2850.8 | 3875.4 | 2189.2 | |
| SMAPE | 2.937 | 3.614 | 3.081 | 3.274 | 3.451 | 4.180 | 2.903 | |
| 6 | MAPE | 4.532 | 4.814 | 4.769 | 4.624 | 4.687 | 4.619 | 4.144 |
| MAE | 25.276 | 26.666 | 26.458 | 24.616 | 25.272 | 24.858 | 22.452 | |
| MSE | 5378.7 | 5376.7 | 6242.7 | 3815.0 | 4104.4 | 3991.2 | 3524.2 | |
| SMAPE | 4.419 | 4.721 | 4.594 | 4.510 | 4.618 | 4.574 | 4.091 | |
| 9 | MAPE | 5.546 | 5.738 | 5.905 | 5.368 | 5.539 | 5.607 | 4.696 |
| MAE | 30.570 | 31.420 | 32.454 | 28.254 | 29.345 | 29.458 | 25.490 | |
| MSE | 6822.2 | 6641.8 | 8900.1 | 4488.3 | 4910.8 | 4698.9 | 4221.5 | |
| SMAPE | 5.414 | 5.636 | 5.642 | 5.246 | 5.438 | 5.538 | 4.683 | |
| 12 | MAPE | 6.292 | 6.506 | 6.806 | 5.918 | 6.092 | 6.177 | 5.499 |
| MAE | 34.301 | 35.248 | 37.047 | 30.895 | 31.929 | 32.208 | 29.190 | |
| MSE | 7797.5 | 7669.0 | 12183.4 | 4997.6 | 5351.3 | 5199.1 | 4629.9 | |
| SMAPE | 6.144 | 6.388 | 6.435 | 5.794 | 5.985 | 6.108 | 5.481 | |
| 24 | MAPE | 8.985 | 9.197 | 9.941 | 7.334 | 7.659 | 7.029 | 7.902 |
| MAE | 47.554 | 48.519 | 52.729 | 37.513 | 39.215 | 36.719 | 39.848 | |
| MSE | 11574.3 | 11436.8 | 26829.3 | 6226.0 | 6824.1 | 6307.2 | 5960.7 | |
| SMAPE | 8.721 | 8.970 | 9.121 | 7.206 | 7.514 | 7.041 | 7.817 |
| Prediction Instant (t) | Fr | p-Value | SH | MA | ARIMA | RF | XGB | N-HiTS | TCN |
|---|---|---|---|---|---|---|---|---|---|
| 1 | 12.748 | 0.047 | 23.8 | 95.467 | 29.8 | 48.333 | 64.267 | 84.933 | 24.4 |
| 3 | 12.742 | 0.047 | 29.4 | 75.2 | 40.067 | 52.2 | 64.4 | 83.333 | 26.4 |
| 6 | 13.411 | 0.037 | 48.667 | 68.733 | 63.133 | 52.867 | 58.867 | 54.2 | 24.533 |
| 9 | 13.330 | 0.038 | 58.0 | 66.6 | 71.133 | 44.467 | 53.333 | 61.0 | 16.467 |
| 12 | 13.298 | 0.039 | 59.933 | 70.4 | 76.933 | 38.933 | 48.4 | 53.933 | 22.467 |
| 24 | 13.100 | 0.041 | 71.133 | 77.133 | 88.733 | 28.933 | 37.667 | 22.333 | 28.933 |
| Prediction Instant (t) | Best Model | SH | MA | ARIMA | RF | XGB | N-HiTS | TCN |
|---|---|---|---|---|---|---|---|---|
| 1 | SH | - | 1.179 | 0.082 | 0.001 | 1.179 | ||
| 3 | TCN | 0.787 | 0.438 | 0.061 | 0.003 | - | ||
| 6 | TCN | 0.030 | 0.003 | 0.023 | 0.008 | 0.023 | - | |
| 9 | TCN | 0.012 | 0.002 | - | ||||
| 12 | TCN | 0.003 | 0.139 | 0.039 | 0.014 | - | ||
| 24 | N-HiTS | 0.553 | 0.336 | - | 0.123 |
| Prediction Instant (t) | Best Methods |
|---|---|
| 1 | SH, ARIMA, RF, TCN |
| 3 | SH, ARIMA, RF, TCN |
| 6 | TCN |
| 9 | TCN |
| 12 | RF, TCN |
| 24 | RF, XGB, N-HiTS, TCN |
Disclaimer/Publisher’s Note: The statements, opinions and data contained in all publications are solely those of the individual author(s) and contributor(s) and not of MDPI and/or the editor(s). MDPI and/or the editor(s) disclaim responsibility for any injury to people or property resulting from any ideas, methods, instructions or products referred to in the content. |
© 2025 by the authors. Licensee MDPI, Basel, Switzerland. This article is an open access article distributed under the terms and conditions of the Creative Commons Attribution (CC BY) license (https://creativecommons.org/licenses/by/4.0/).
Share and Cite
Garcia-Pinilla, P.; Jurio, A.; Paternain, D. A Comparative Study of CO2 Forecasting Strategies in School Classrooms: A Step Toward Improving Indoor Air Quality. Sensors 2025, 25, 2173. https://doi.org/10.3390/s25072173
Garcia-Pinilla P, Jurio A, Paternain D. A Comparative Study of CO2 Forecasting Strategies in School Classrooms: A Step Toward Improving Indoor Air Quality. Sensors. 2025; 25(7):2173. https://doi.org/10.3390/s25072173
Chicago/Turabian StyleGarcia-Pinilla, Peio, Aranzazu Jurio, and Daniel Paternain. 2025. "A Comparative Study of CO2 Forecasting Strategies in School Classrooms: A Step Toward Improving Indoor Air Quality" Sensors 25, no. 7: 2173. https://doi.org/10.3390/s25072173
APA StyleGarcia-Pinilla, P., Jurio, A., & Paternain, D. (2025). A Comparative Study of CO2 Forecasting Strategies in School Classrooms: A Step Toward Improving Indoor Air Quality. Sensors, 25(7), 2173. https://doi.org/10.3390/s25072173