To evaluate the measurement capability of the laser and camera assembly, we conducted a series of tests in the laboratory before deploying the setup in a real-world scenario.
3.3.1. Laboratory Testing
During the development of the system for assessing health status based on pose and displacement control, laboratory tests were conducted to verify the functionality and feasibility of the components used. These tests allowed for the adjustment of technical parameters and the determination of the system’s capabilities in controlled environments. The main procedures and results obtained are described below.
The experimental system consisted of several key elements. The equipment included a diode laser model, Picotronic 256-650-5-3, with a power of 5 mW and a wavelength of 650 nm, and it is used to project patterns onto surfaces. Additionally, three diffractive elements were employed: the Picotronic DOE-DE-R284, which generates a pattern of 41 lines; the Picotronic DOE-DE-R354, with a design of 10 × 10 lines; and the Picotronic DOE-DE-R241, which projects a pattern of 21 × 21 points. Image capture was performed using a digital camera model KUROKESU C1 PROL-X10, which was available in the laboratory at the time of testing and differed from the model intended for the final prototype. Complementing these elements, a power supply, optical mounting components to ensure proper device arrangement, and a laptop computer were used to facilitate the data acquisition and analysis during the tests.
In a preliminary stage, the camera was calibrated to determine the system’s essential optical parameters. This process was performed using the camera calibration toolbox provided by MATLAB, which implements Zhang’s method [
25] for camera calibration. This algorithm estimates intrinsic parameters such as focal length, principal point, and lens distortion through using multiple images of a known pattern, typically a checkerboard. The calibration procedure involved capturing images of graduated rulers (
Figure 4) to measure the distance between the camera and the reference surface. Through this process, a scale of 1.19 mm per pixel, a tilt of −1.82 degrees, a field of view of 59.02 degrees, and a focal distance of 5.63 mm were obtained.
The diode laser, coupled with the diffractive elements, was used to project patterns of lines and points onto various surfaces. First, a flat surface (
Figure 5a) was used as an initial reference to establish the baseline analysis values. Subsequently, the pattern was tested on a cylinder (
Figure 5b), where the deformation due to curvature was analyzed. Finally, the pattern was projected onto a cylinder covered with paper (
Figure 5c), allowing for the evaluation of changes induced by surface modification. The images obtained by the camera were processed following a systematic set of steps. First, the images were converted to grayscale (
Figure 6a), which were then subsequently cropped (
Figure 6b) and aligned, correcting a tilt of −1.86 degrees (
Figure 6c). Additionally, a Gaussian filter was applied to smooth the visual information (
Figure 6d), followed by a histogram analysis (
Figure 6e) that was performed to determine the threshold level for binarization (
Figure 6f). Since the optimal threshold can vary depending on lighting conditions and surface reflectance, an adaptive approach was used. The threshold level was automatically determined using Otsu’s method [
26], which selects the value that minimizes the intra-class variance in the histogram distribution. This ensured a robust segmentation of the projected structured light pattern across different test conditions.
Once the binarized images were obtained, the positions of the lines in the projected pattern were identified (
Figure 7a). In the case of the flat surface, 37 lines were detected, while, on the cylinder, the number increased to 39 due to curvature. The coordinates obtained in pixels were transformed into real units in millimeters using the camera calibration parameters. The analysis enabled the determination of relative heights based on the linear relationship between height z and the number of projected lines (
Figure 7b). For non-flat surfaces, the vertical displacement of each line was calculated, and, combining these data with the horizontal and vertical displacement ratio, the three-dimensional coordinates relative to the reference surface were obtained. However, it was observed that the precision decreased as the value of
z approached regions where the displacement ratio
neared zero, indicating lower method sensitivity. Specifically, the sensitivity followed the relationship
, meaning that, for lower values of
, the vertical displacement sensitivity decreased, increasing measurement uncertainty. In the context of bedridden patient posture detection, this loss of sensitivity may lead to reduced accuracy in height estimation near lower limb regions or when the projected pattern is partially occluded by bedding folds.
To validate the experimental results and optimize the experimental design, a simulation methodology was developed. Determining the positions from the images of the pattern captured by the camera requires establishing the relative positions and orientations of three reference systems: the laboratory system (), which is defined by the wall and the table; the projector system (), consisting of the laser and the diffractive element; and the camera reference system ().
The relative positions and orientations of these reference systems were determined through a structured calibration process. The calibration began by projecting a structured light pattern onto a flat surface (wall) to establish a baseline. The orientation of the projector () was adjusted to align the projected lines with the pre-measured positions in the laboratory. The camera system () was then positioned so that the recorded image of the projected pattern closely matched the expected reference positions. To ensure consistency, the transformation parameters between and were iteratively refined by adjusting the camera’s tilt and distance until minimal deviation was observed between the measured and simulated positions of the projected lines.
This calibration process was critical for achieving accurate 3D reconstruction. Errors in positioning and orientation directly affect the accuracy of height estimations obtained from the structured light deformation. In particular, small misalignments can introduce errors in the extracted contour lines, impacting the detection of a person’s posture. The iterative refinement of the system mitigated these errors, ensuring the reliability of the method for its intended application in monitoring bedridden patients.
The simulation of the projected pattern was essential for validating the calibration and experimental setup. This process involved generating a stripe pattern according to the specifications of the diffractive element used (
Figure 8a). The next step was to compute the intersection of the projected stripes with the wall plane and to fine tune the projector’s orientation so that the detected line positions matched the laboratory measurements. Finally, the projected lines’ detected positions in the camera image were extracted and superimposed onto the real image for validation (
Figure 8b). This step ensured that the spatial relationships between the reference systems were correctly established, minimizing errors in the final posture detection process.
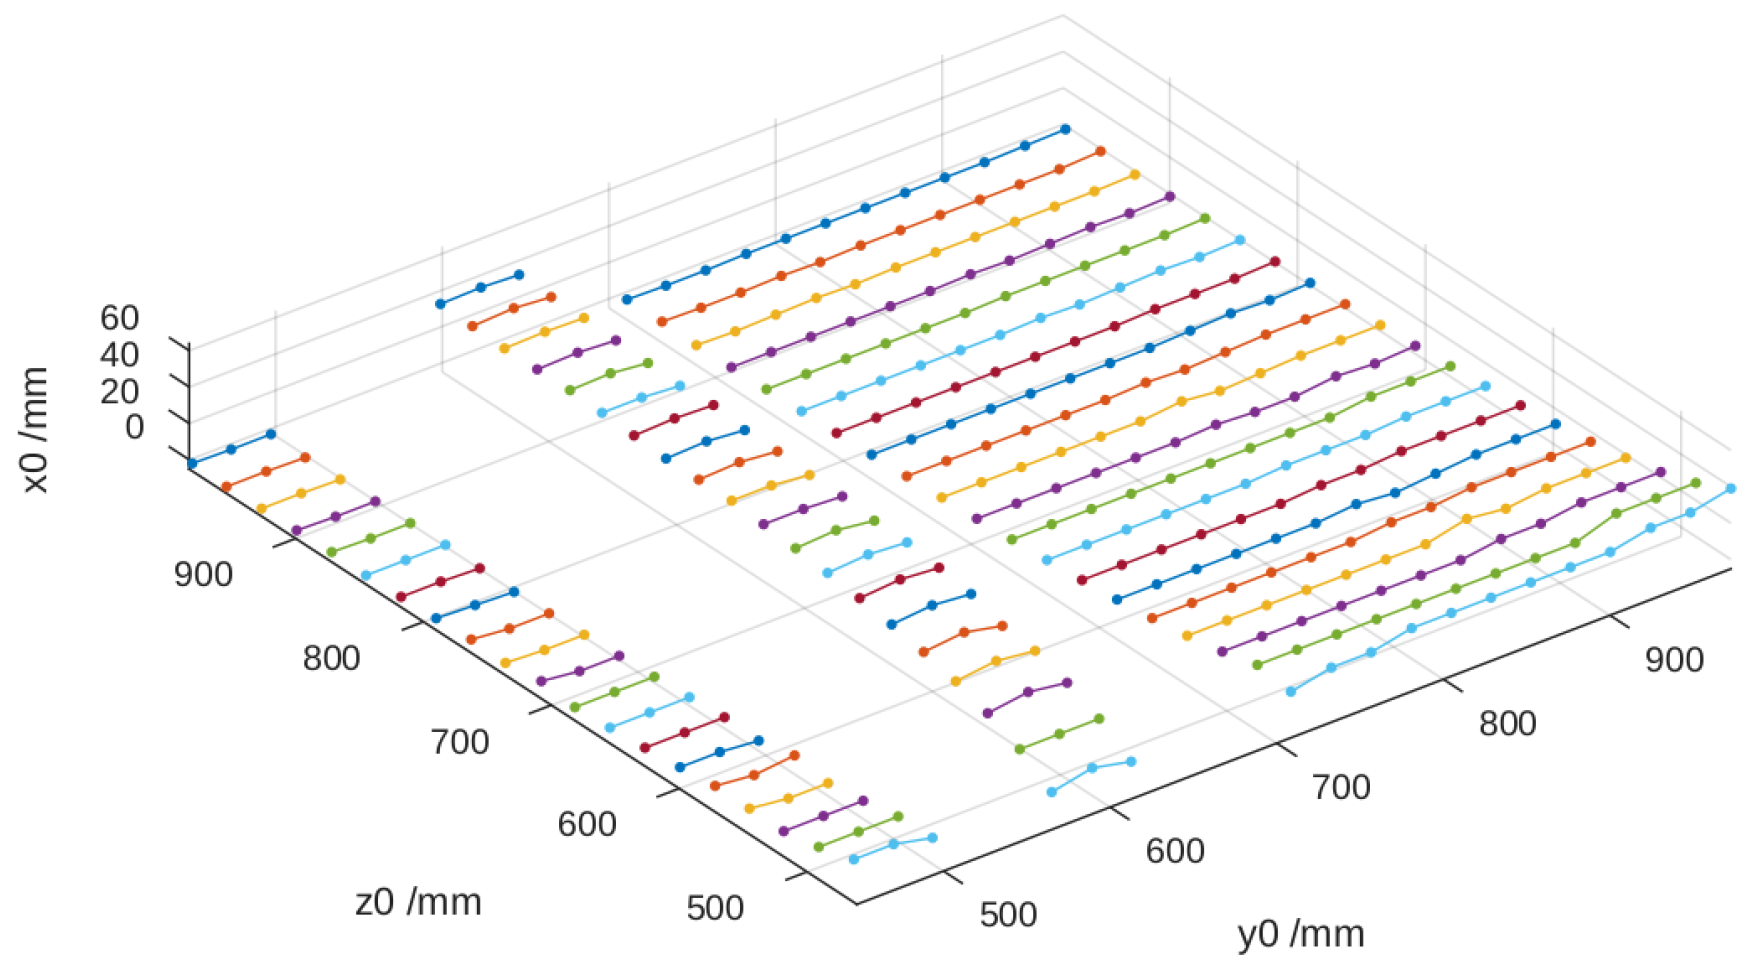
Once the simulation is calibrated, it can be used for various applications. For instance, to analyze the vertical displacement of the stripes ( axis) caused by a surface movement in the direction normal to the wall ( axis), it is possible to simulate the stripes generated by two parallel planes and to calculate the ratio , which varies with the height .
The resulting
Figure 9 is critical because the
ratio determines the sensitivity of the method for estimating heights based on the images of the lines. When
approaches zero, the sensitivity decreases significantly, leading to larger errors in the estimations.
To determine the height on non-flat surfaces, the same procedure used to process the reference image was applied, obtaining the black-and-white version and the corresponding points of the lines. In the case of a cylindrical tube (
Figure 10a,b), up to 39 lines were identified on its surface, which was 2 more than on the wall. This increase in the number of detected lines was due to the curvature of the cylinder, which causes a denser distribution of the projected pattern along the curved surface.
To establish the correspondence between the projected lines on different surfaces, a reference pattern was first captured on a flat wall to serve as a baseline. The known spacing of the lines in this reference allowed for tracking how the pattern deformed when projected onto the cylindrical surface. A linear relationship between the line number and height was established, following , where ln represents the line index. This equation, derived from the calibration process, enabled a precise mapping between the projected lines on different geometries.
However, shadowed areas were found at both ends of the cylinder, where no lines were detected due to occlusions. To handle these interruptions, the missing line segments were interpolated based on the neighboring detected points. This interpolation process helped maintain consistency in height estimation while mitigating errors introduced by shadows. The approach ensured that even in cases where partial occlusions occurred, the structured light system remained effective in extracting 3D surface information.
Using the vertical displacement of each line
and the corresponding value of
, the height relative to the reference surface was calculated, thereby obtaining the three spatial coordinates. In
Figure 11, it can be observed that the height values
deteriorate when
decreases as
tends to approach zero, which affects the method’s precision.
In the case of a cylinder covered with a sheet of paper (
Figure 12a,b and
Figure 13), the results were similar, with the particularity that certain lines disappeared due to the characteristics of the surface.
The results obtained in the laboratory tests demonstrate that the system is capable of acquiring three-dimensional information using a single camera and diffractive patterns. However, limitations were identified related to the method’s sensitivity and the relative configuration of the elements. The primary issue affecting sensitivity is the decrease in measurement accuracy when the displacement ratio approaches zero, particularly for lower values of . The sensitivity follows the relationship , meaning that, for mm, the measurement uncertainty significantly increases due to the low variation in displacement.
Additionally, the relative configuration of the elements introduced errors due to the projection angle and occlusions in certain regions of the measured surface. The experimental data indicate that misalignment of the camera and laser by even led to a deviation of up to 5 mm in height estimation. Furthermore, the occlusions caused by folds in the blanket and the curvature of the body resulted in missing data points, requiring interpolation techniques that introduce additional uncertainty.
These limitations affect the final application by reducing the accuracy of the 3D surface reconstruction, particularly in areas where the patient’s body creates significant occlusions or where the system operates at lower height ranges. As a mitigation strategy, adjustments in the projector–camera positioning and the implementation of an adaptive filtering approach were explored to enhance the robustness of the measurement process.
3.3.2. Real-World Testing
Once the system’s feasibility was demonstrated in the laboratory, it was tested in a real environment to further refine and validate its performance. With the intention of verifying whether we could improve measurement accuracy and increase the number of data points, we replaced the DOE with a parallel line pattern with one featuring a grid pattern.
The experimental setup initially involved positioning the camera and laser assembly at a height of approximately 2 m, which was situated about 1 m from the foot of the bed. This configuration, as illustrated in
Figure 14a,b, was angled at roughly 45° to maximize coverage of the bed surface. However, this arrangement presented several significant challenges that necessitated further adjustments to the experimental design.
The main issue encountered was the distortion introduced by the oblique projection angle, which caused a non-uniform distribution of the structured light pattern across the bed surface. This resulted in variations in the spacing between projected lines, leading to decreased accuracy when extracting the patient’s body profile. Additionally, due to the perspective effects, the areas closer to the camera exhibited higher resolution, while regions farther from the camera suffered from reduced measurement precision.
To address these challenges, the experimental setup was modified by repositioning the camera directly above the bed. This adjustment ensured a more uniform projection of the structured light pattern, minimized distortions, and improved the overall reliability of the system in detecting posture-related features.
One of the main issues identified was the excessive density of the projected lines near the head of the bed. As shown in
Figure 15a,b, the lines in this area were too close together, making precise detection difficult due to the relative position of the bed with respect to the laser assembly. This clustering compromised the system’s ability to distinguish individual projections, potentially affecting the accuracy of measurements in this area. To address this issue, the laser was kept in its initial position but the camera was relocated directly above the bed (
Figure 14b). Initially, the camera and laser assembly were positioned approximately 2 m high and 1 m away from the foot of the bed, angled at roughly 45° to maximize coverage. However, this oblique perspective introduced distortions in the structured light projection, affecting the accuracy of the reconstructed surface.
To mitigate these issues, the camera was repositioned directly above the bed, ensuring a more uniform and distortion-free projection of the structured light pattern. Since the available photographs do not fully illustrate the spatial relationship between the bed and the devices, a schematic diagram has been included (
Figure 16) to clarify their relative positioning. This representation provides a clearer understanding of the experimental setup and the modifications made to optimize the system’s performance.
Another challenge that emerged during the experiments was related to the reflective properties of different bed linen colors. Certain hues proved less effective at reflecting the laser light, resulting in poor visibility of the projected pattern, as shown in
Figure 17a,b. However, this issue is unlikely to be a significant limitation in real-world applications as nursing homes, where the system is intended to be used, predominantly rely on light-colored, typically white, bed sheets. White linens are the standard in such environments because they facilitate the detection of stains and allow high-temperature washing with disinfectants without the risk of discoloration. Their use also simplifies laundry processes, reduces costs, and ensures consistent availability. Additionally, white conveys cleanliness, order, and professionalism, fostering a sense of trust and control in healthcare settings. Although some nursing homes may use light pastel tones, white remains the standard due to its practical and psychological benefits. Given these factors, variations in bed sheet color are unlikely to affect the system’s accuracy in its intended deployment environment.
The third significant problem arose from the interaction between the grid pattern and the test dummy. When the complete grid was projected onto the dummy, it became evident that the horizontal lines provided more valuable height information compared to the vertical lines. The presence of vertical lines introduced interference in the processing of the data, potentially compromising the accuracy of the height measurements. This observation led to a critical decision in the experimental approach.
In light of these findings, we concluded that continuing the experiments with the DOE projecting parallel lines would be the most effective path forward. This adjustment aims to capitalize on the more informative horizontal lines while eliminating the interference caused by the vertical components of the grid pattern.
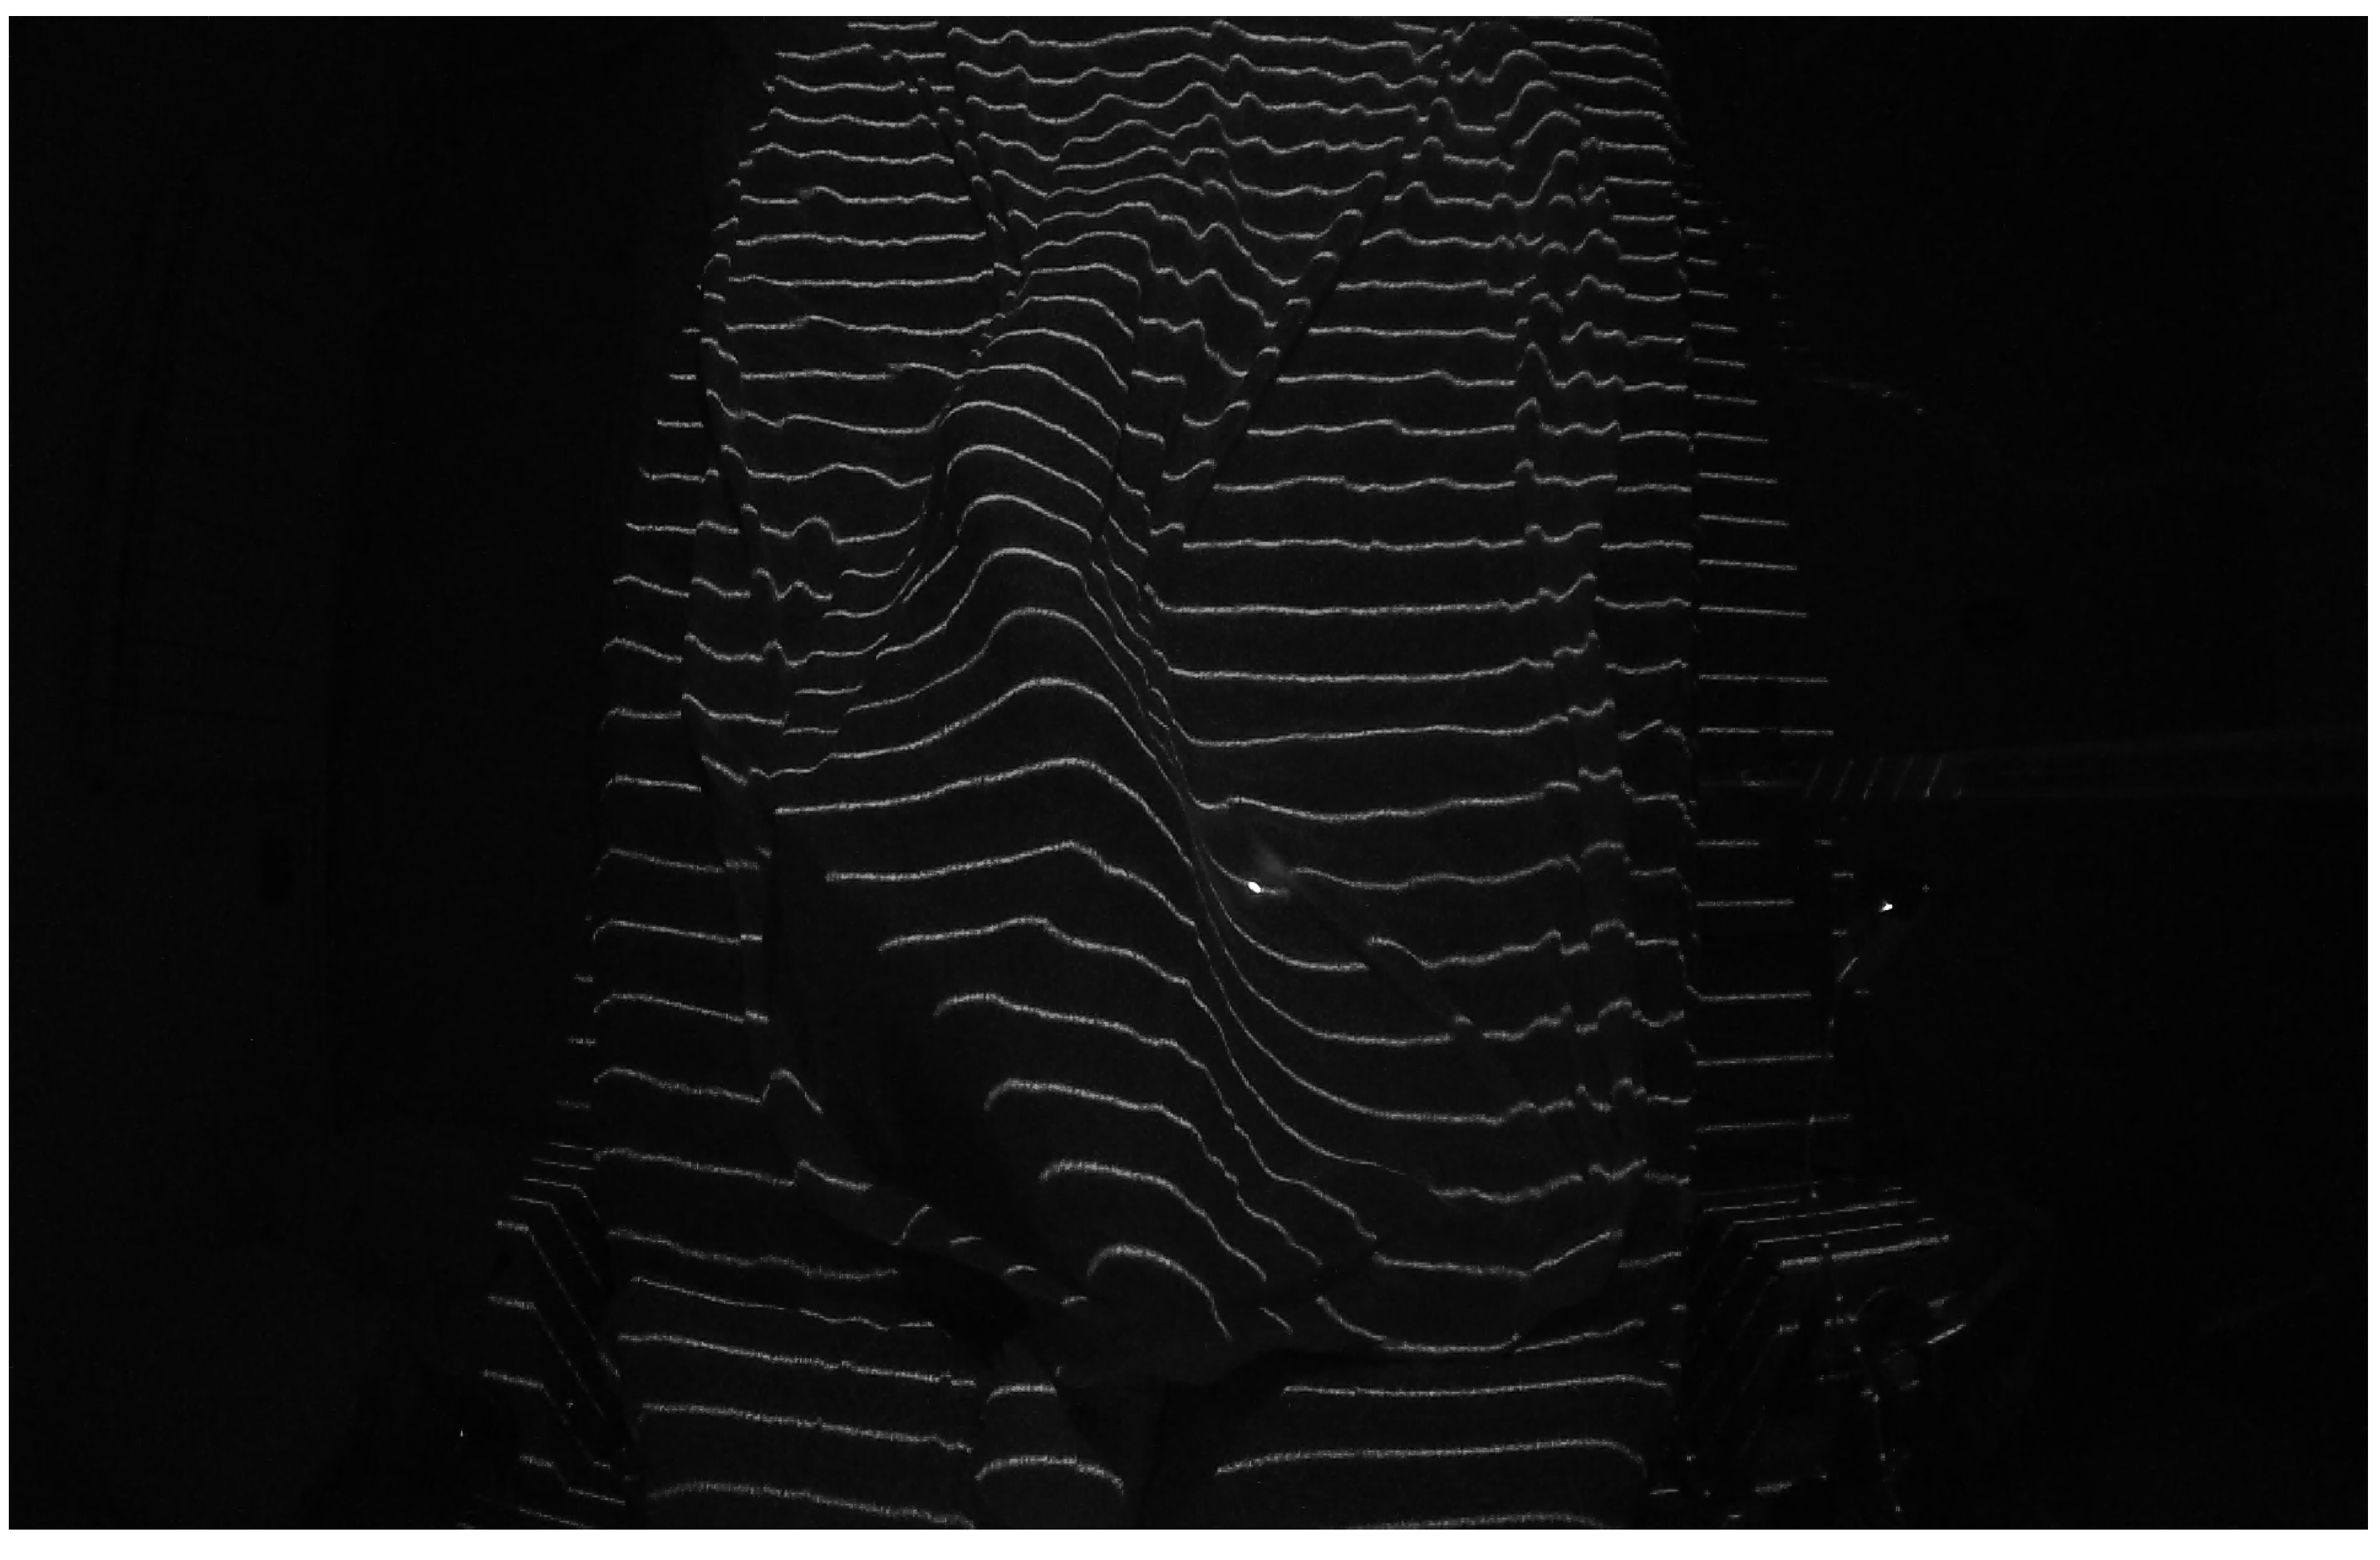
When using the parallel lines DOE, we observed a more pronounced issue of interruptions in the projected lines compared to the laboratory tests conducted with the cylinder. This phenomenon was caused by multiple shadow zones created by the mannequin under the blanket, as shown in
Figure 18. These interruptions made it impossible to accurately determine the correspondence between each projected line segment and its reference image on the empty bed, a correspondence that is crucial for precisely calculating the surface of the mannequin lying on the bed. We are currently working on solutions to address this issue, as previewed in
Section 4.
A comprehensive analysis of the images obtained in our tests, as illustrated in
Figure 18, revealed a significant simplification in the process of determining the patient’s position. Contrary to what might be expected, it is not necessary to reconstruct the entire body surface; instead, extracting the profile of the legs under the sheet is sufficient to determine whether the patient is lying on their left or right side. This simplification is based on the observation that the curvature of the leg profile provides a reliable indicator of lateral posture, reducing the computational complexity and avoiding the need for full-body surface reconstruction.
This profile is obtained by identifying the maximum points of each structured light line projected onto the body. The maximum points correspond to the highest elevations of the curves formed by the laser projection on the covered legs. To achieve this, the algorithm processes the structured light pattern by first segmenting the laser-projected lines within the region of interest (legs area). Each detected line is then analyzed to extract its local maximum, representing the peak deformation caused by the patient’s body. To ensure robustness, only lines meeting predefined geometric constraints—such as the minimum segment length and sufficient separation—are considered valid.
In the practical application of our structured light system, the process is further refined by fitting a second-degree polynomial (using the polyfit method of the Python NumPy library) to the set of the extracted maxima. This polynomial fitting allows for a smooth approximation of the leg profile while mitigating minor noise and projection irregularities. The concavity or convexity of the fitted curve is then evaluated, enabling a precise classification of whether the patient is lying on their left or right side.
However, this approach is specifically designed to classify lateral decubitus positions and does not provide information about whether the patient is lying in a supine position (on their back). Since the method does not analyze the upper body or head, it cannot distinguish between supine and lateral postures. This limitation is inherent to the simplification process, which prioritizes a minimally invasive and computationally efficient method over full-body posture classification. Future work may explore complementary techniques to extend the system’s capabilities to distinguish between additional postures if required for broader applications.
Figure 19 and
Figure 20 illustrate this process, showing the mannequin lying on its right and left sides, respectively. Since the camera is positioned at the foot of the bed, the lower part of each image corresponds to the patient’s heels, while the upper part represents the position of the patient’s hips. This orientation is crucial for interpreting the results correctly.
In both images, green crosses mark the extracted maximum points from each projected line in the leg region, while the red curve represents the fitted polynomial derived from these maxima. As observed, the curvature of this polynomial—whether concave or convex—directly indicates the mannequin’s lateral posture, demonstrating the effectiveness of our method. Based on this orientation,
Figure 19 corresponds to the mannequin lying on its right side, while
Figure 20 corresponds to the mannequin lying on its left side.


