
Combined Solid-State LiDAR and Fluorescence Photogrammetry Imaging to Determine Uranyl Mineral Distribution in a Legacy Uranium Mine

 , , , , , , ,
Abstract
1. Introduction
2. Materials and Methods
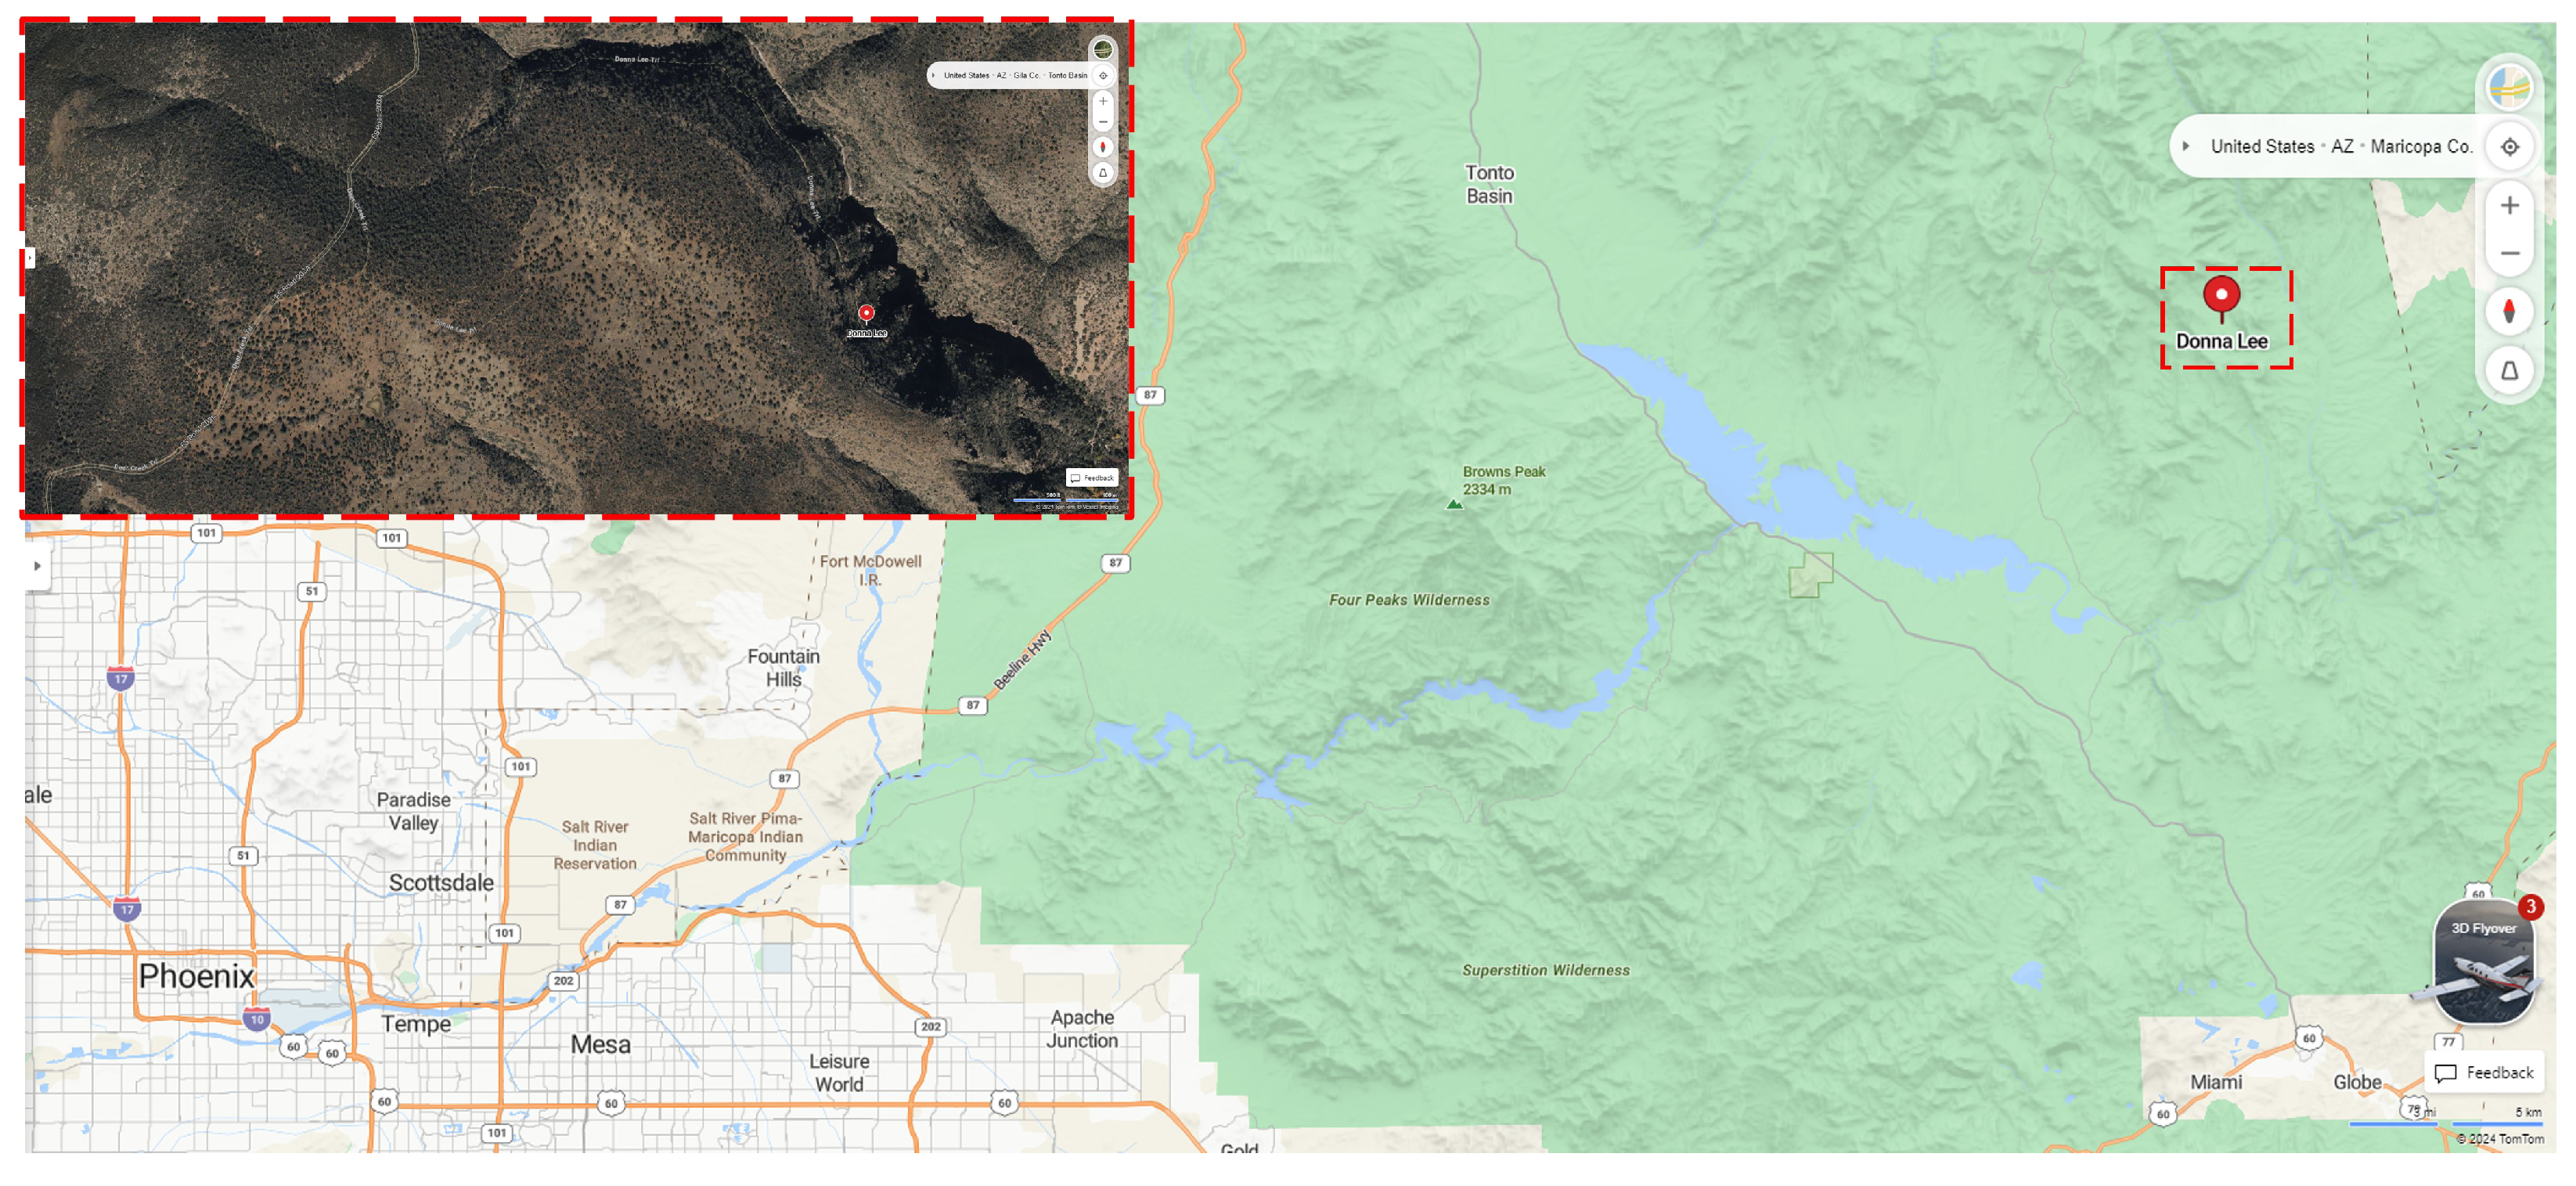
2.1. Lithological Location
2.2. Data Collection
2.2.1. Initial Scout Survey
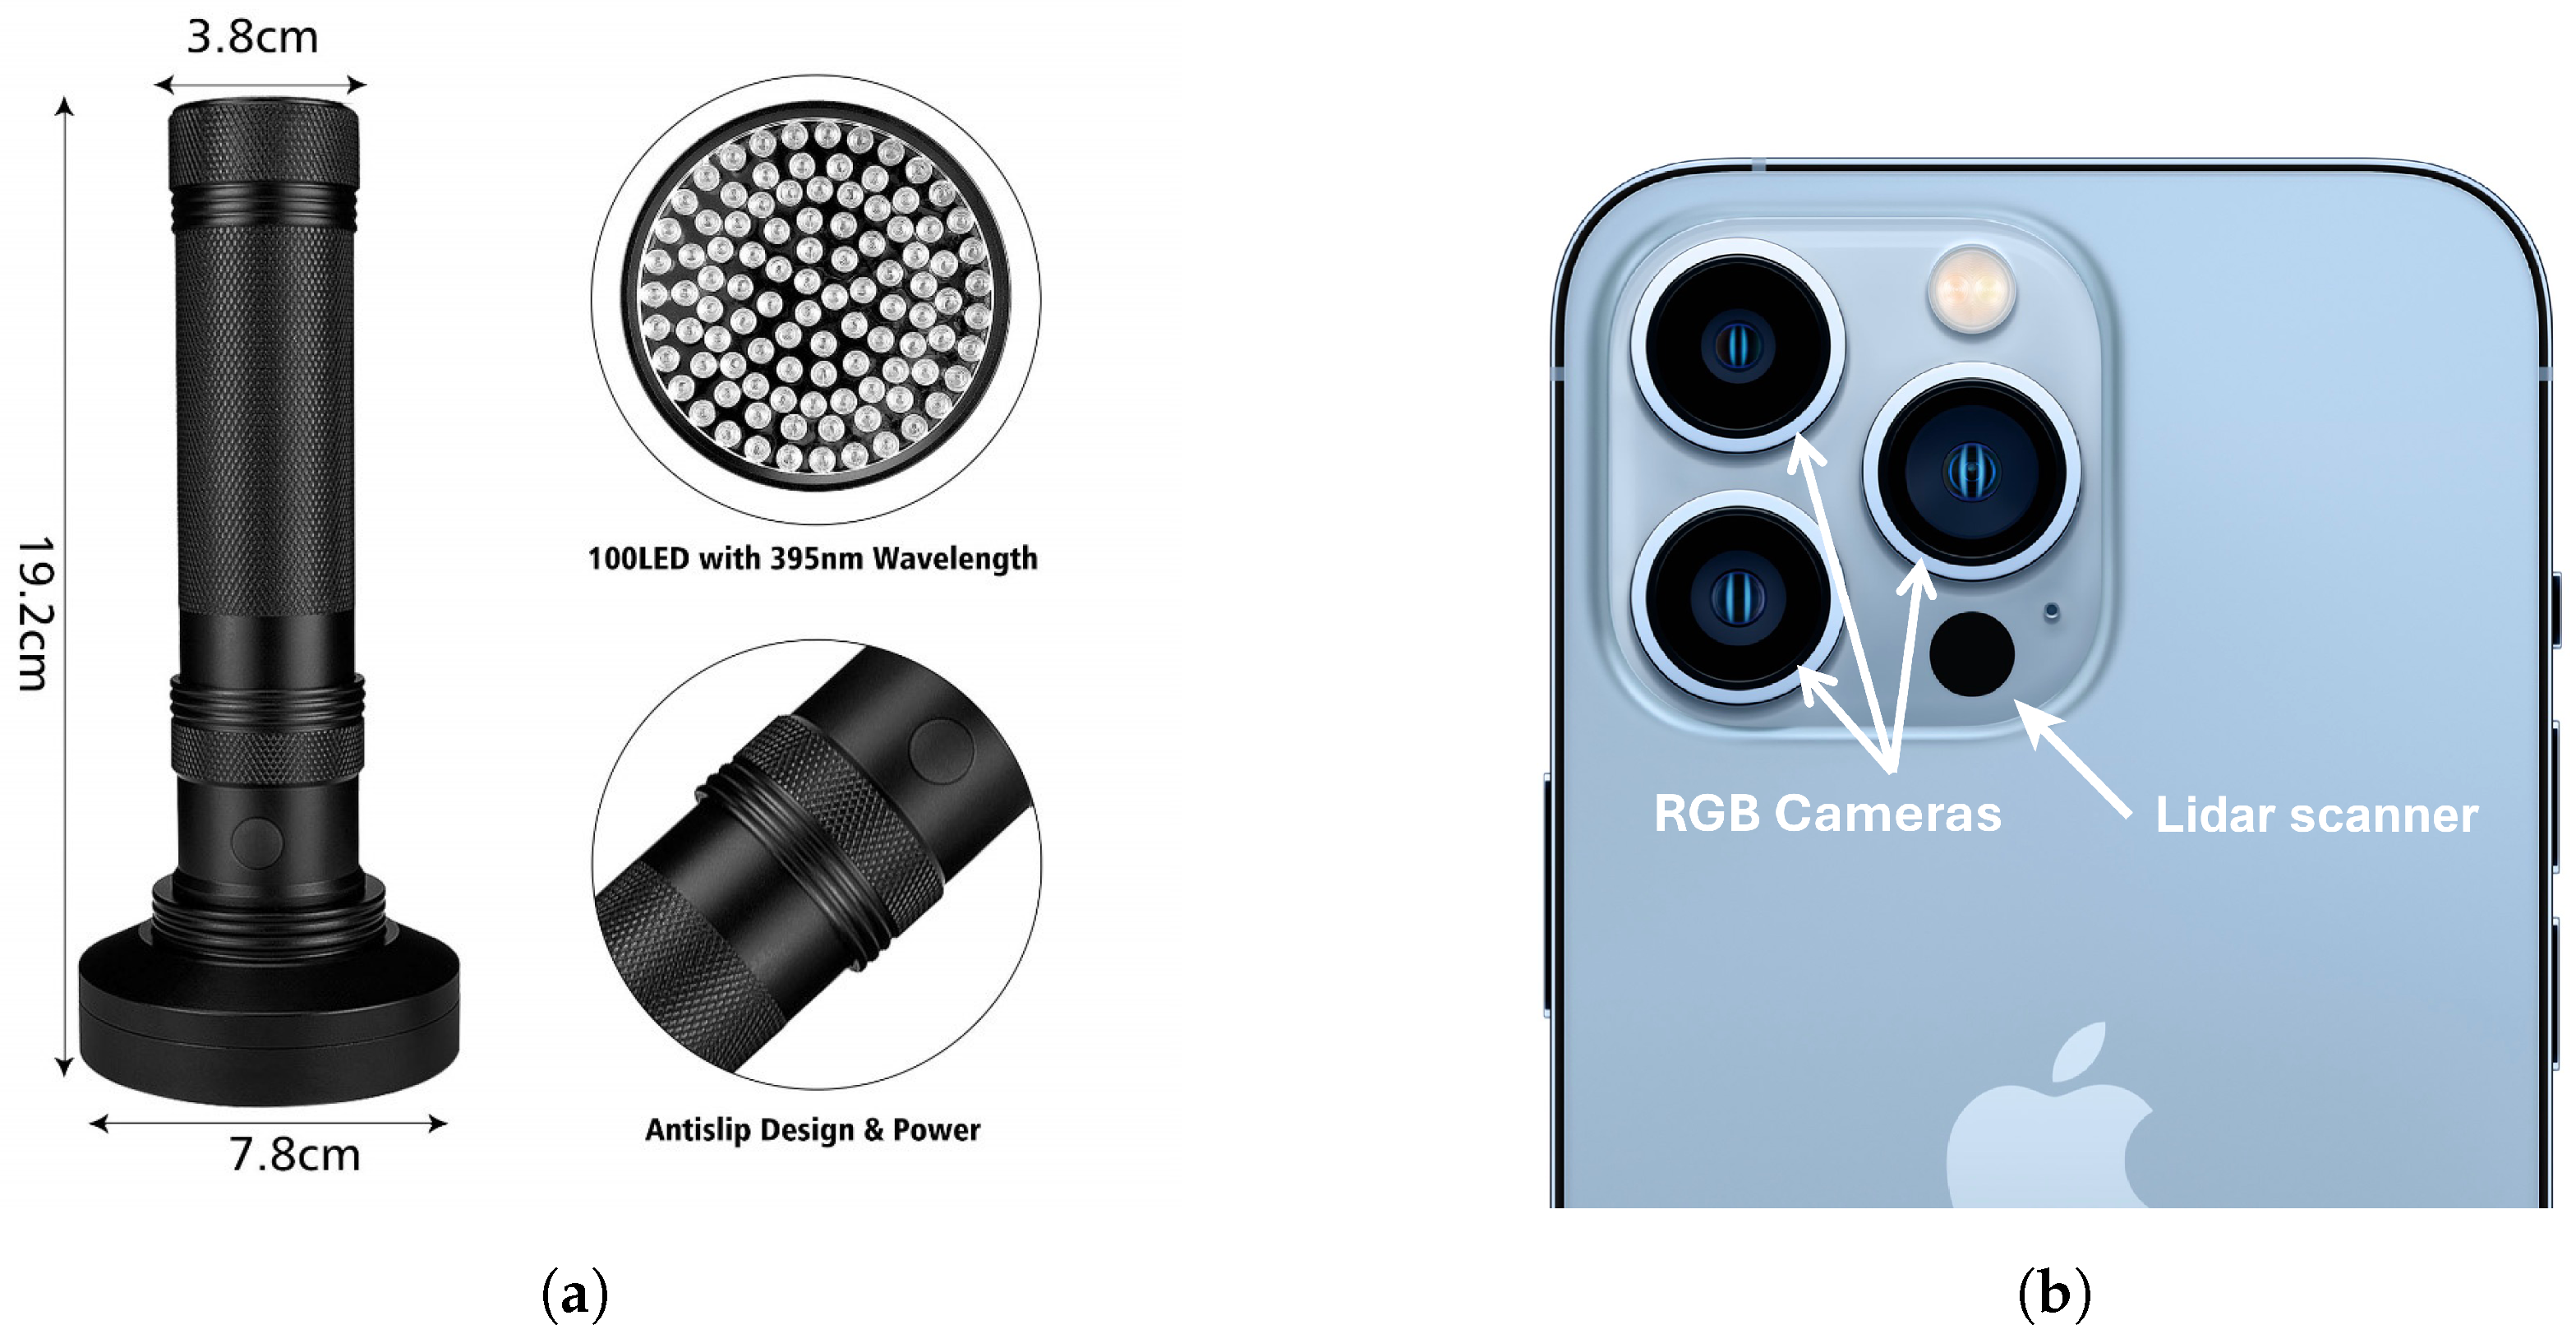
2.2.2. Fluorescence Survey
2.2.3. 3D Rendering Software Canvas
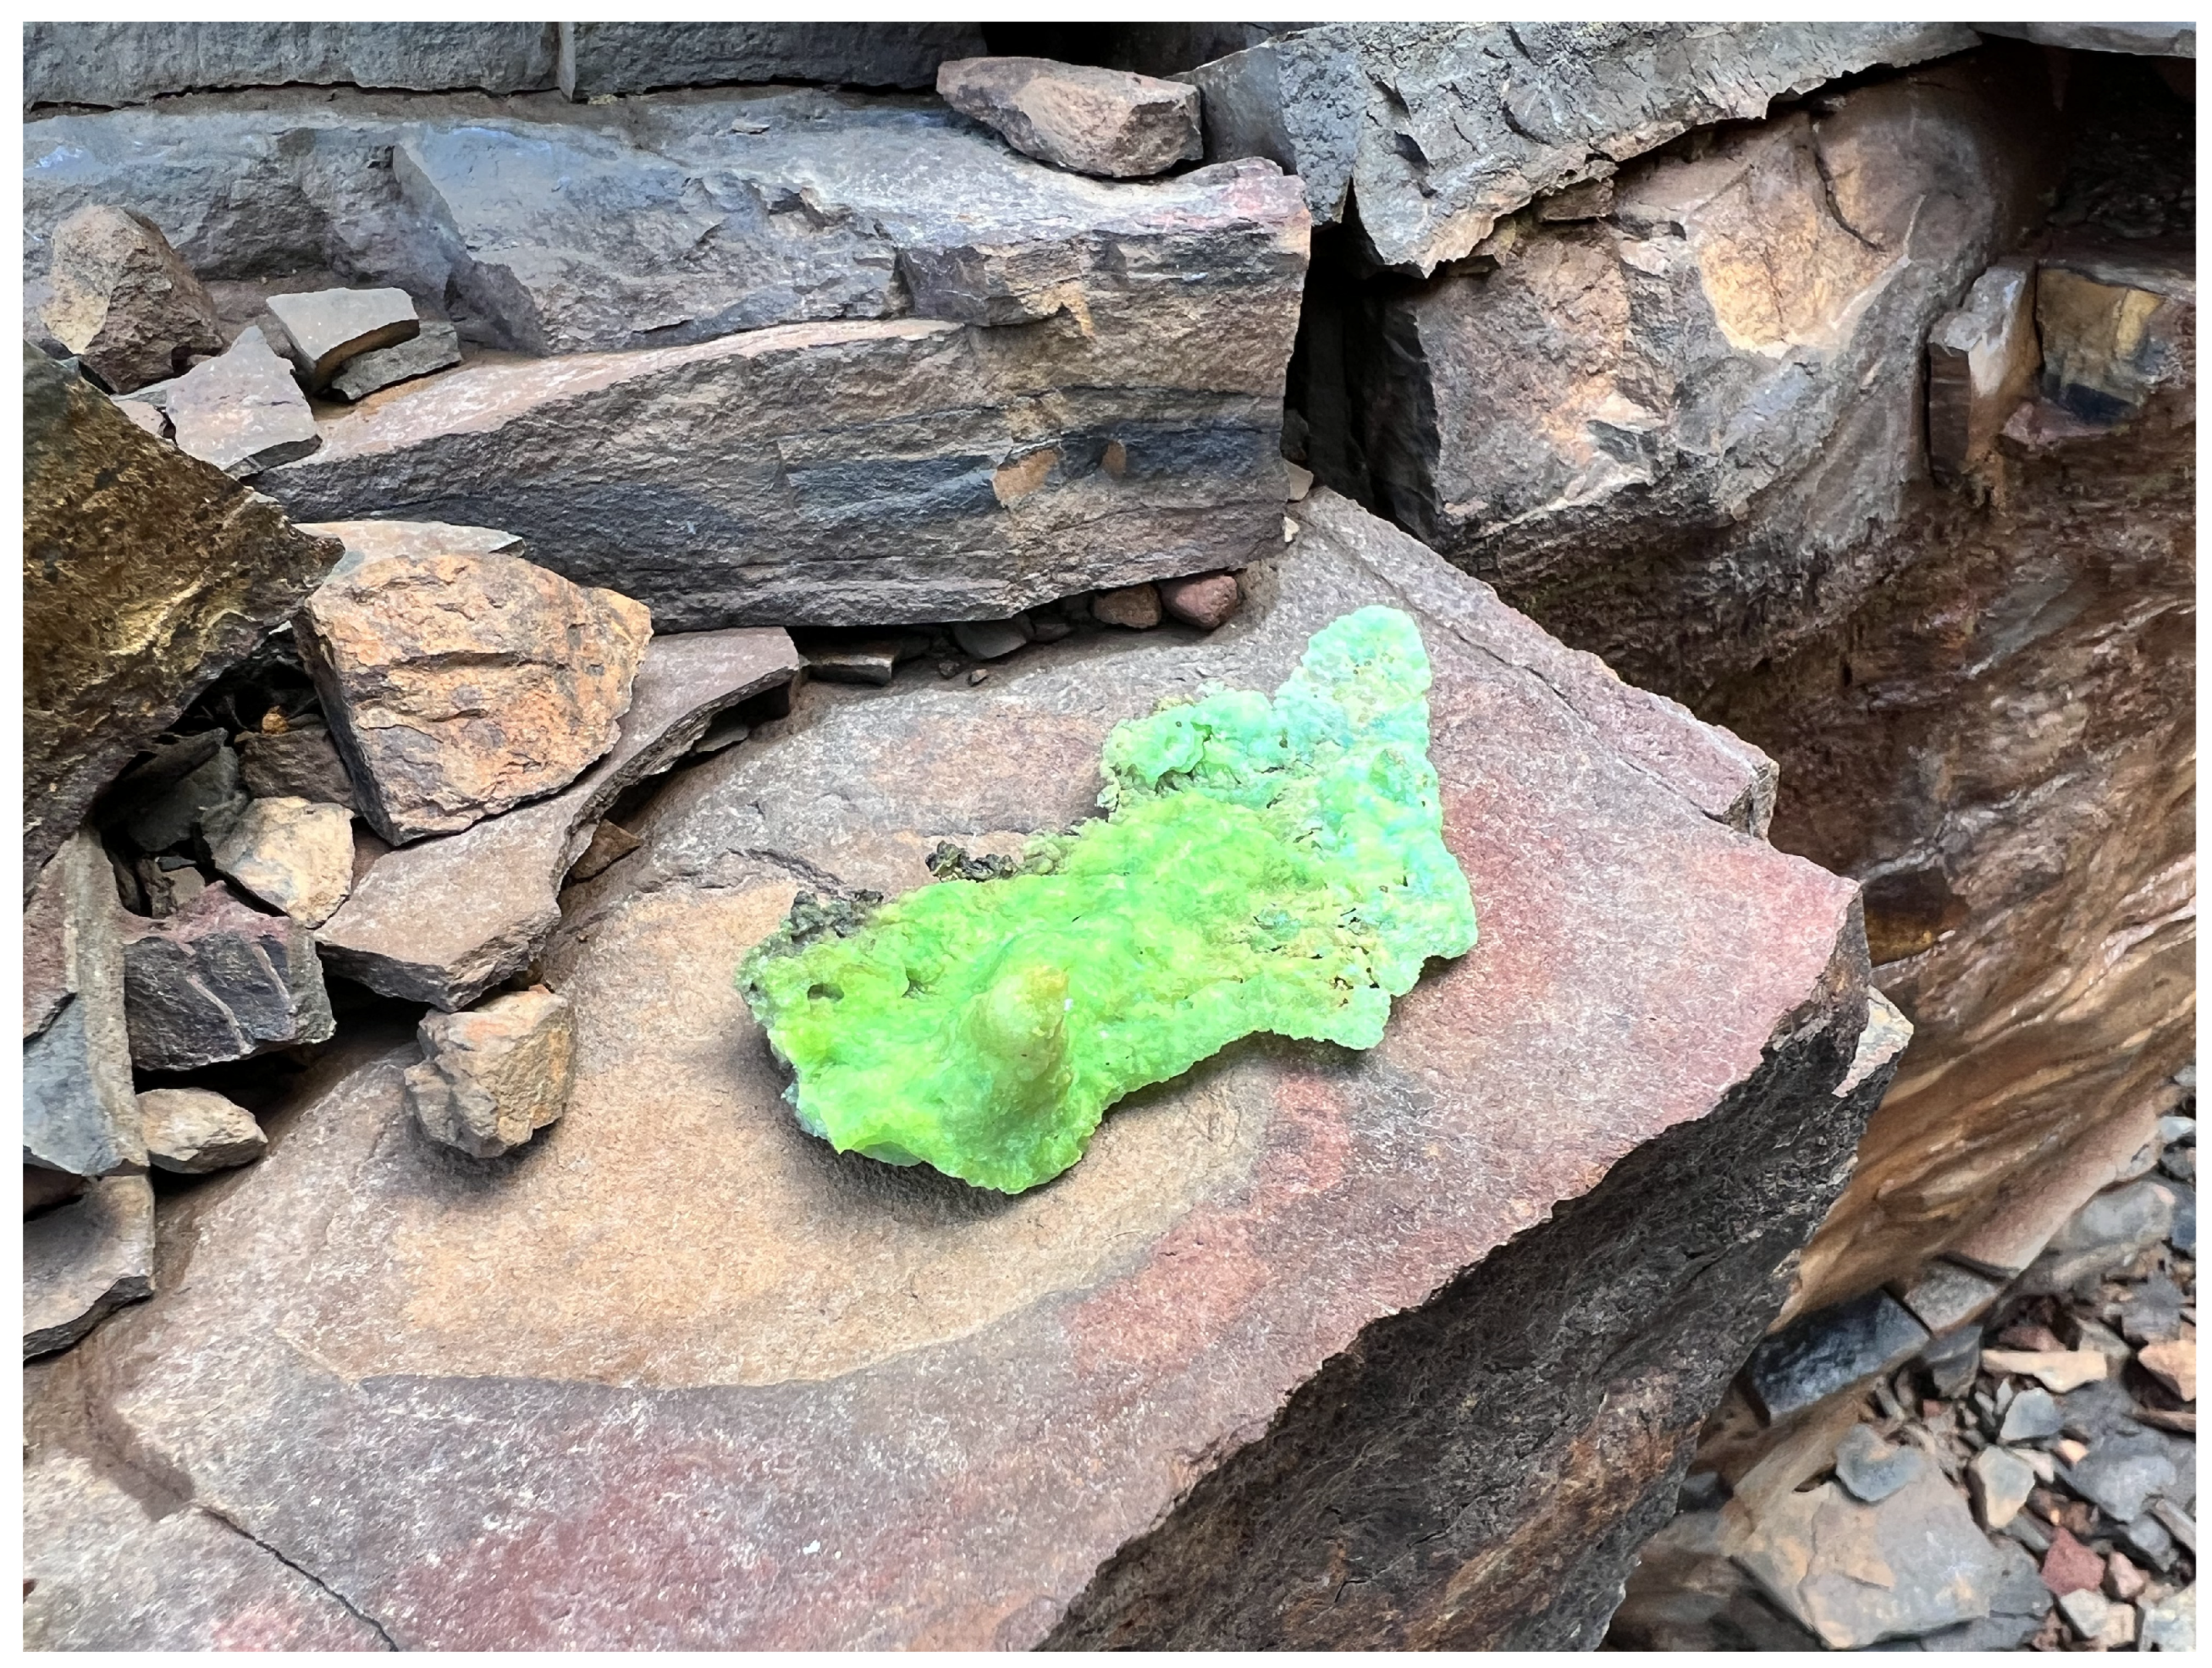
2.2.4. Collection of Ground Truthing Samples
2.2.5. Laboratory Analysis of Mine Samples
2.3. In-Mine Determination of Uranyl Mineral Distribution
3. Results
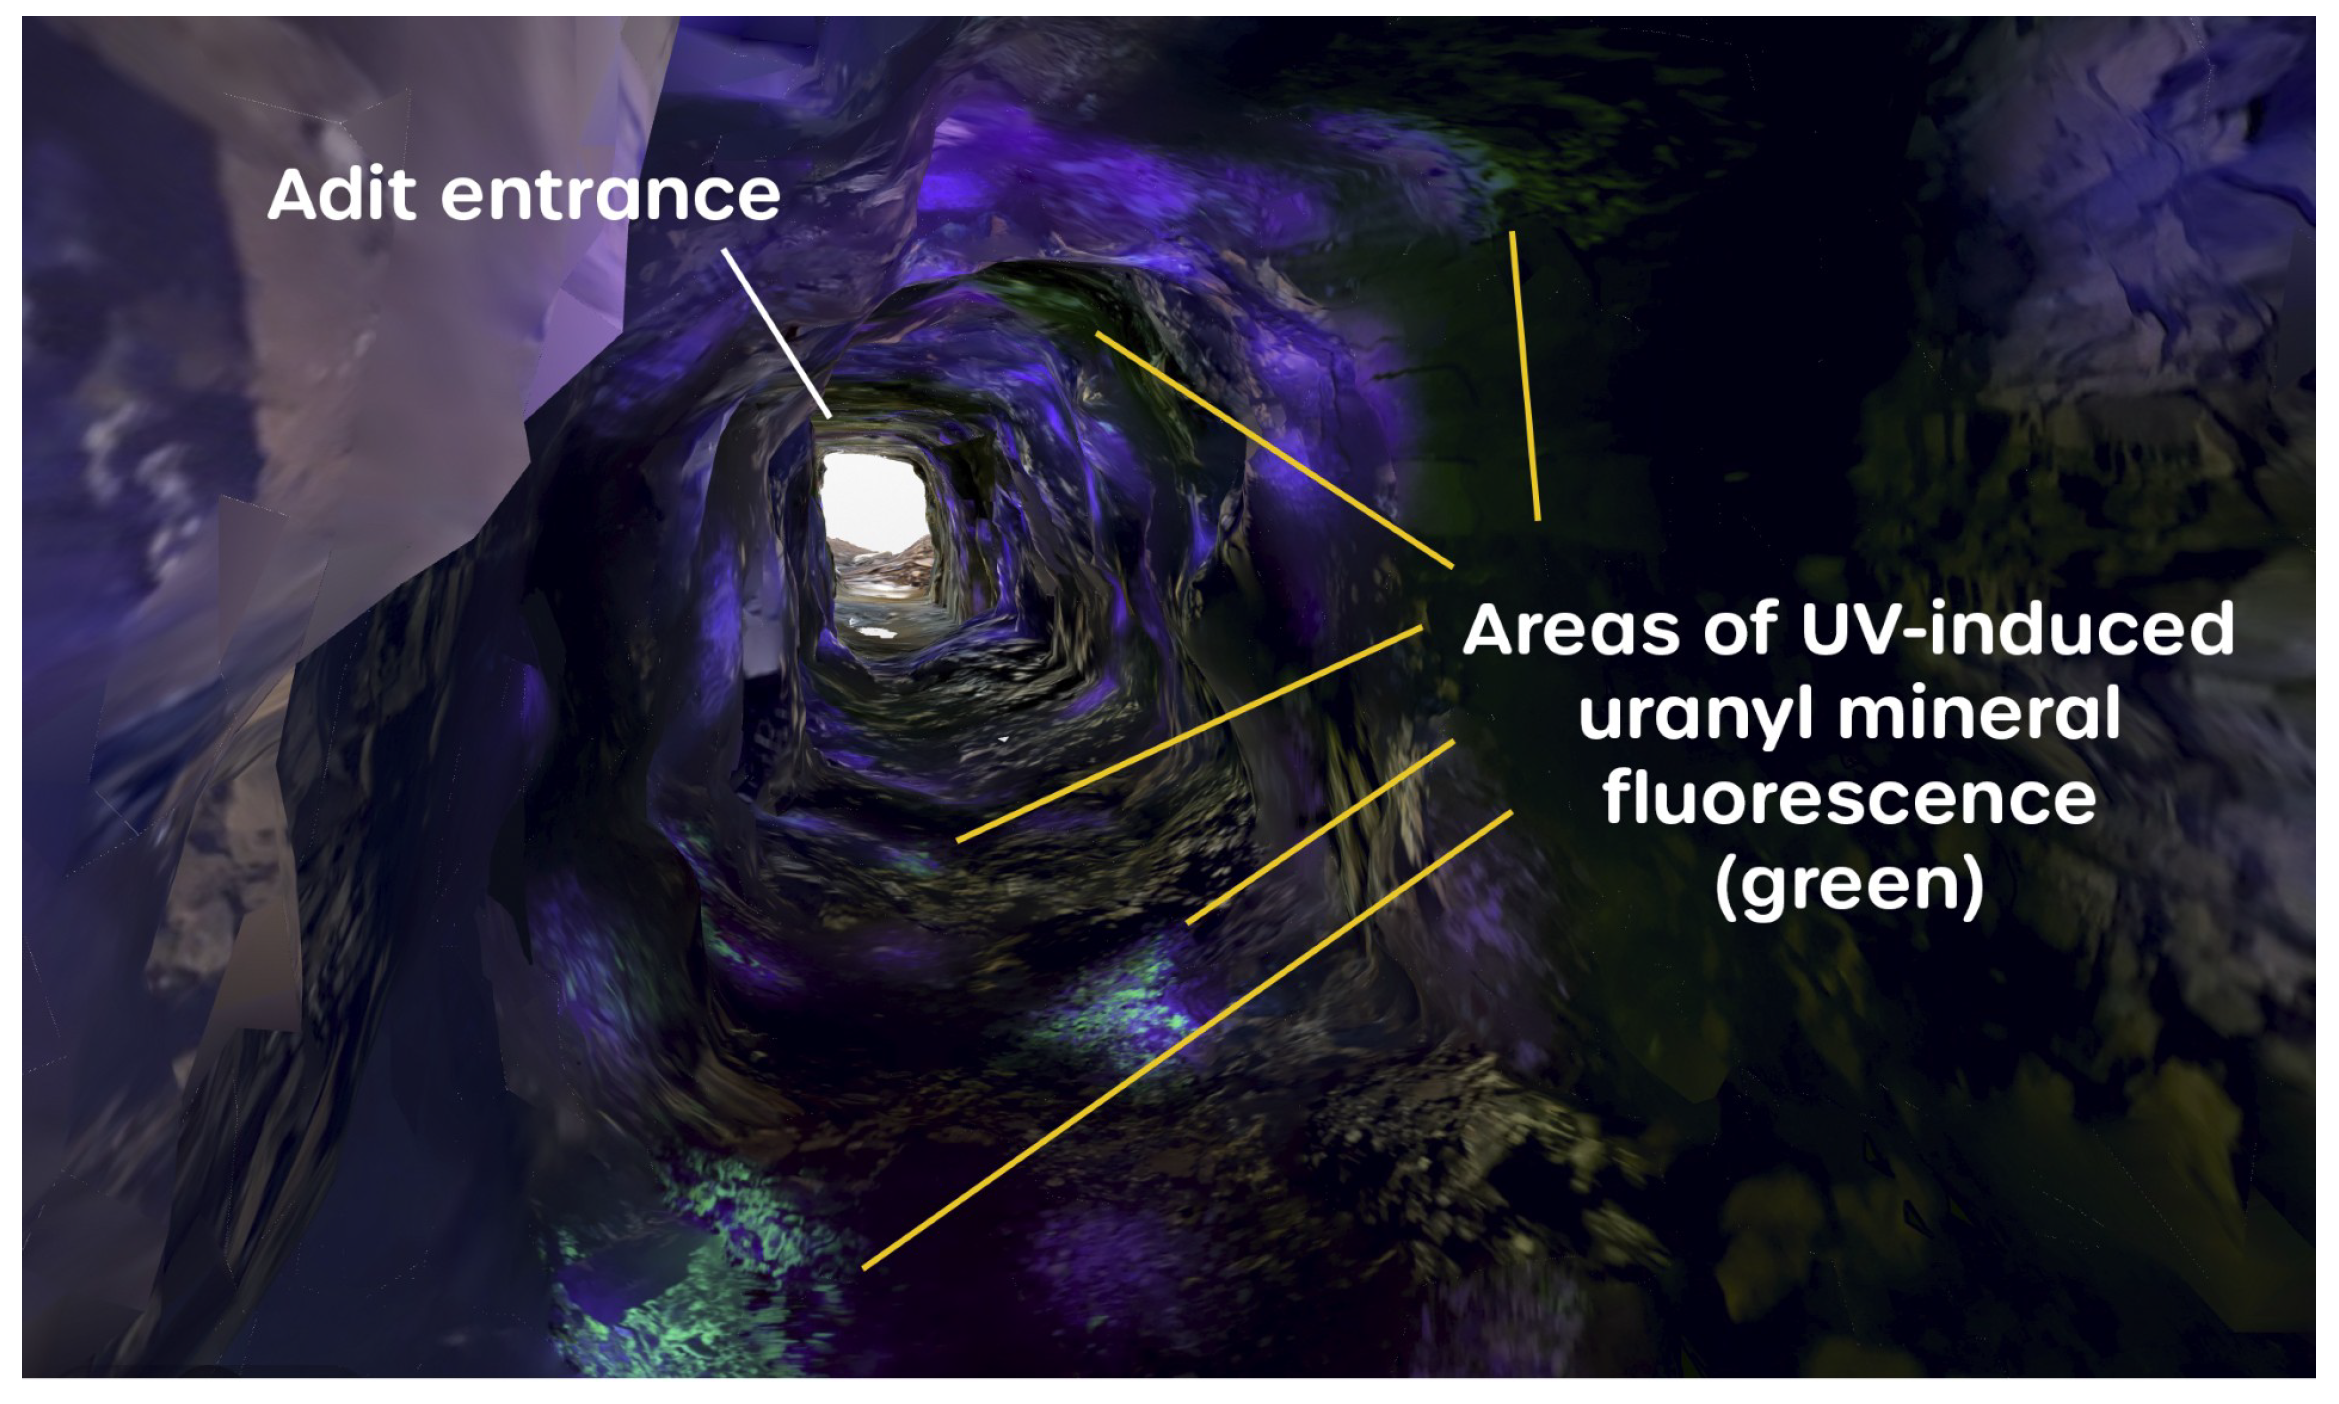
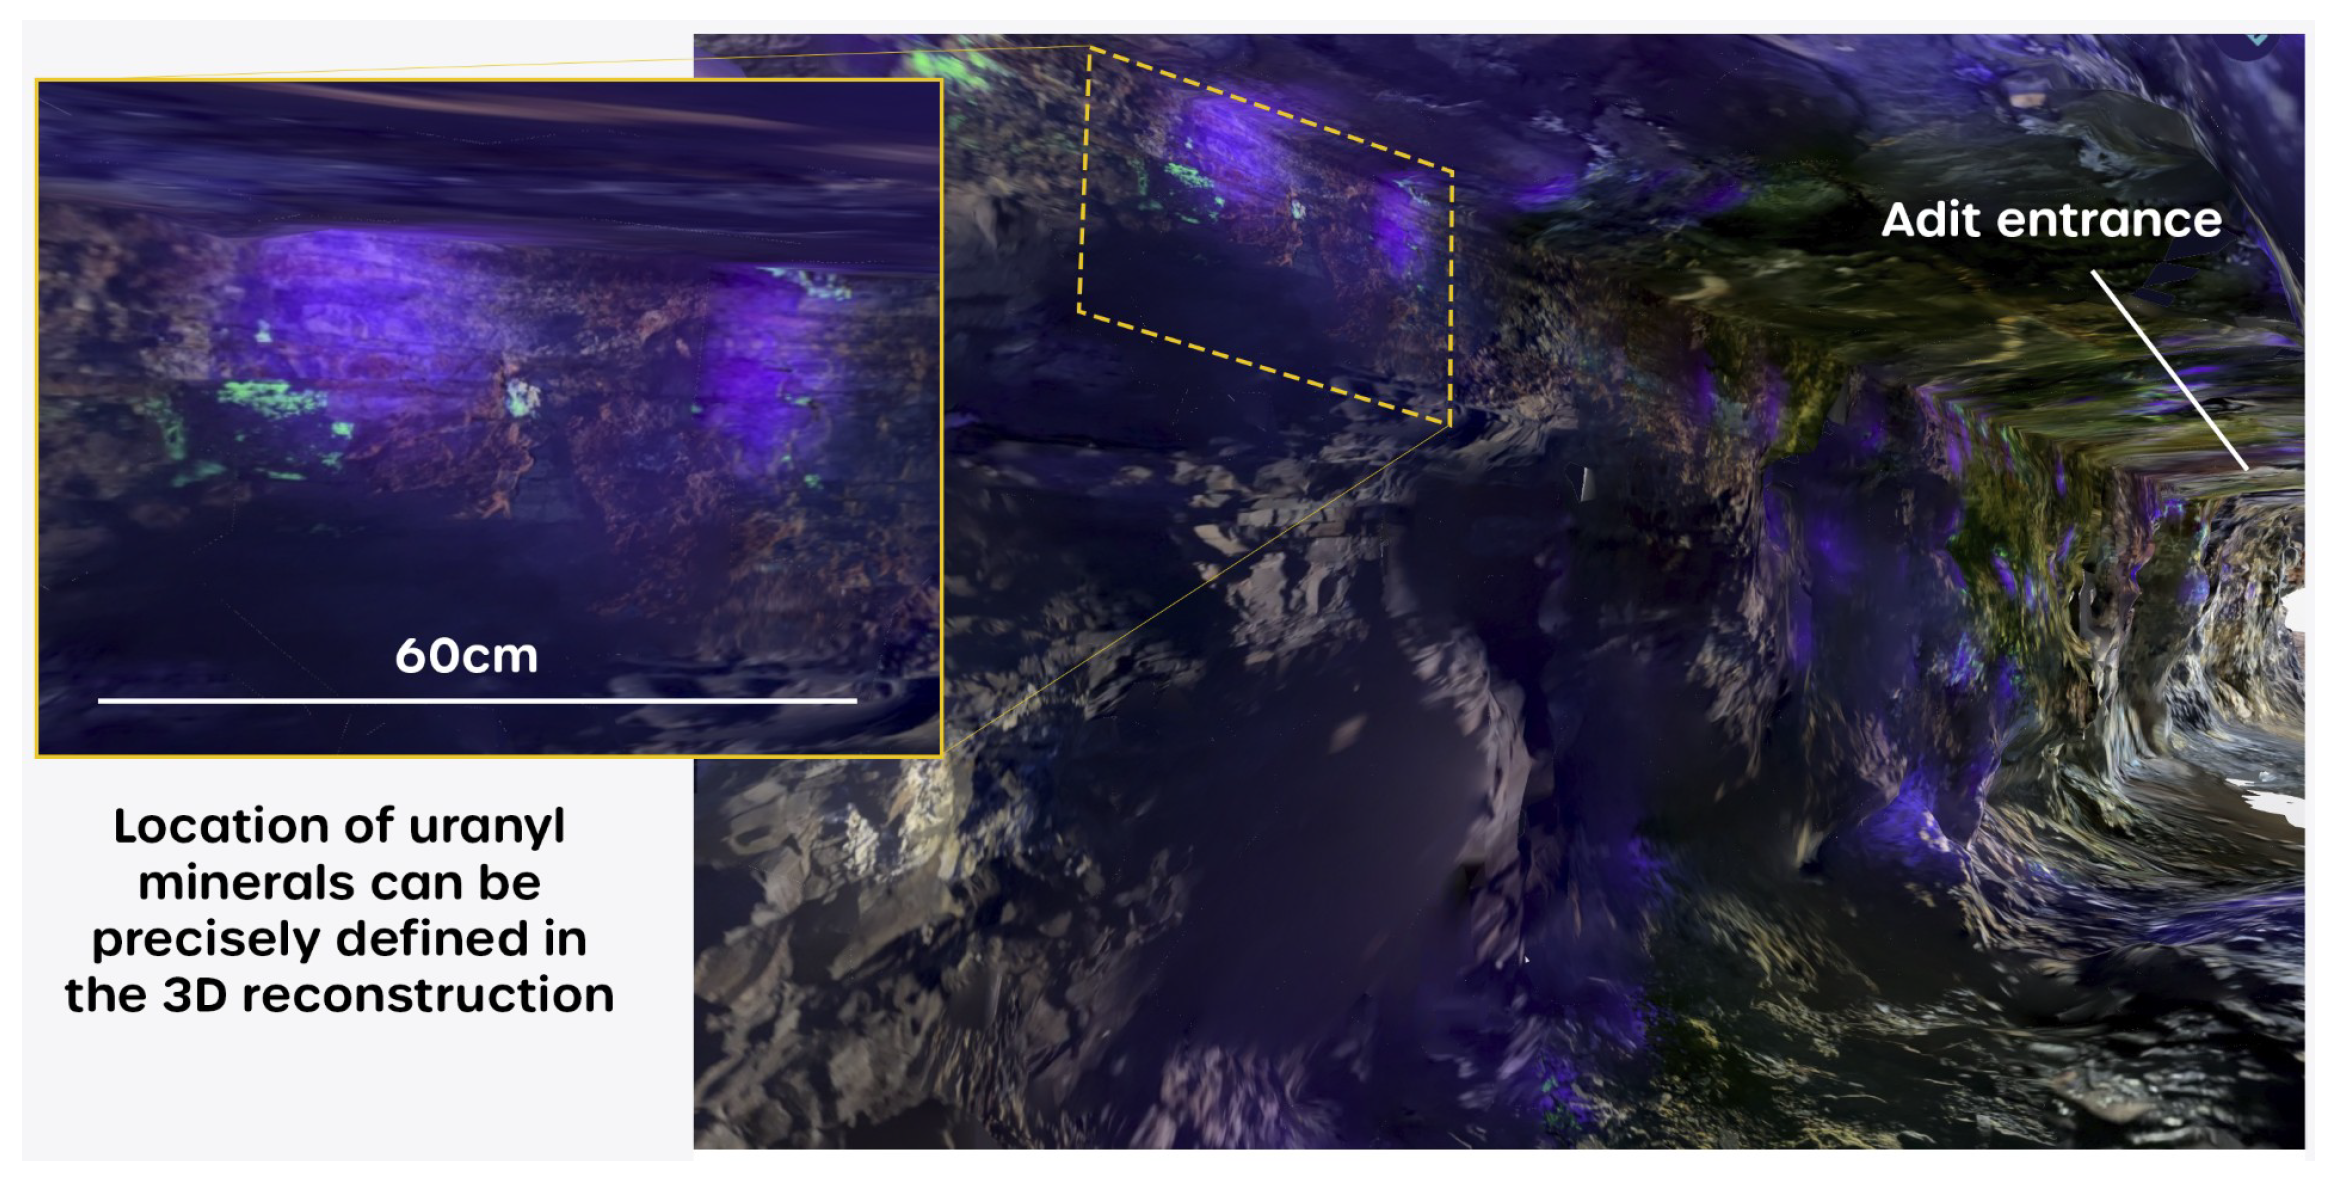
3.1. Canvas Renders
- enabling the operator to see the immediate area of the mine being scanned;
- and providing localized illumination of the rock surfaces, meaning that the recorded orthophoto captured textural detail, showing the physical structure of the exposed rock strata.
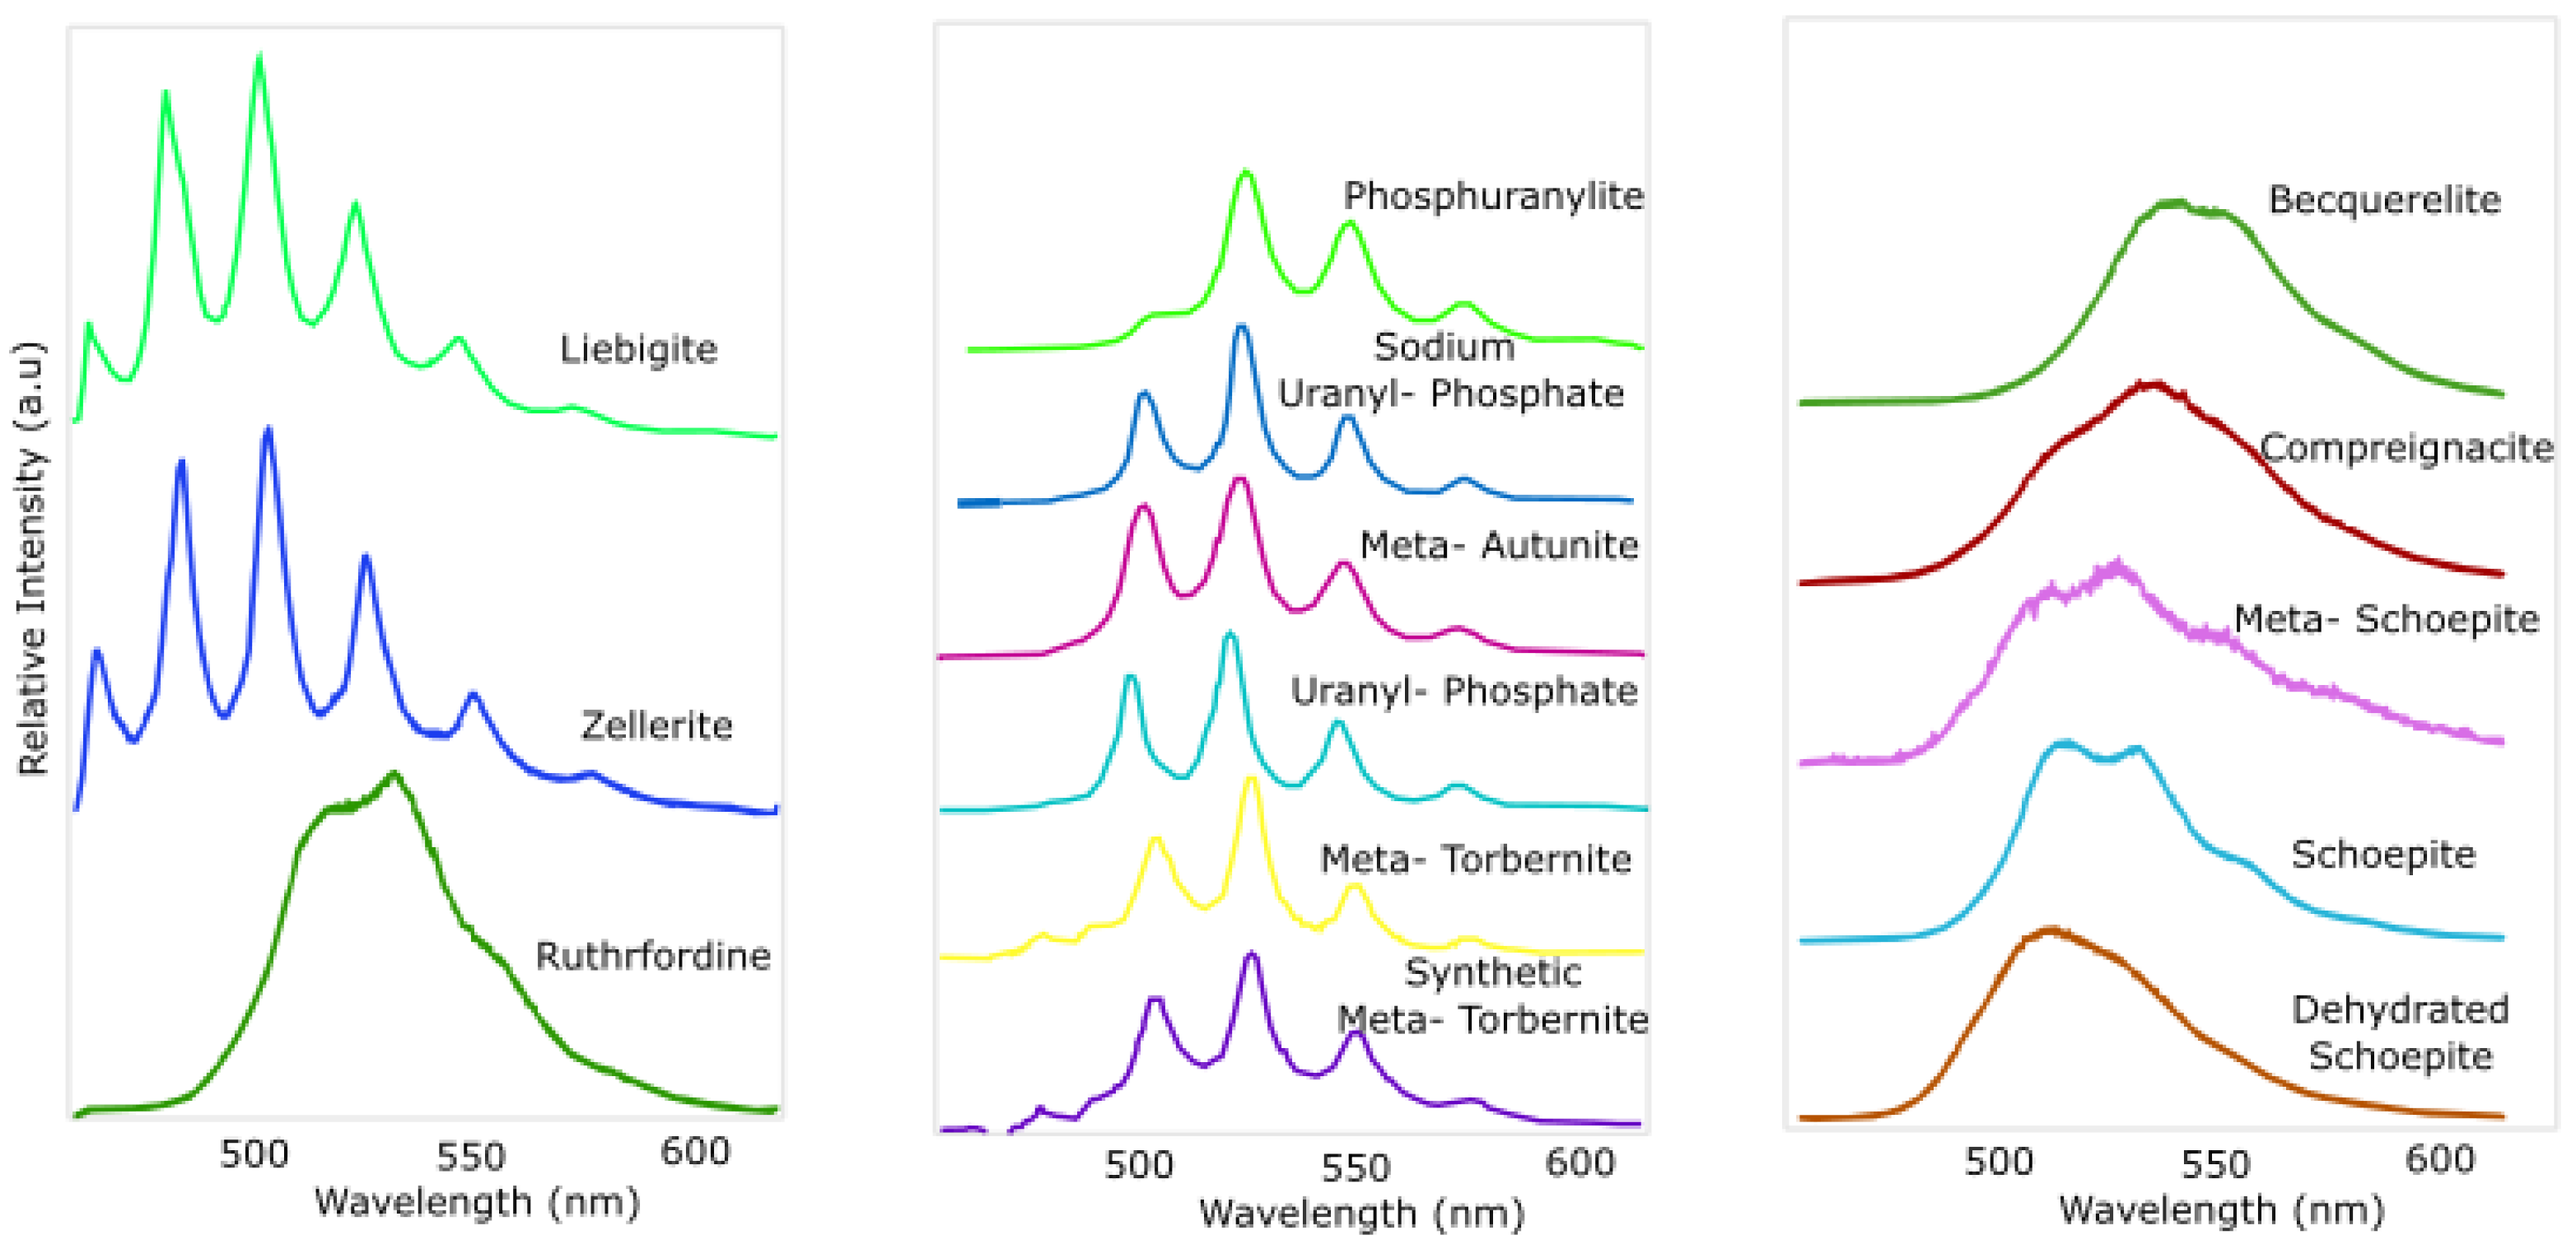
3.2. Spectral Analysis of UV-Induced Fluorescence from Uranyl-Bearing Mineral Samples
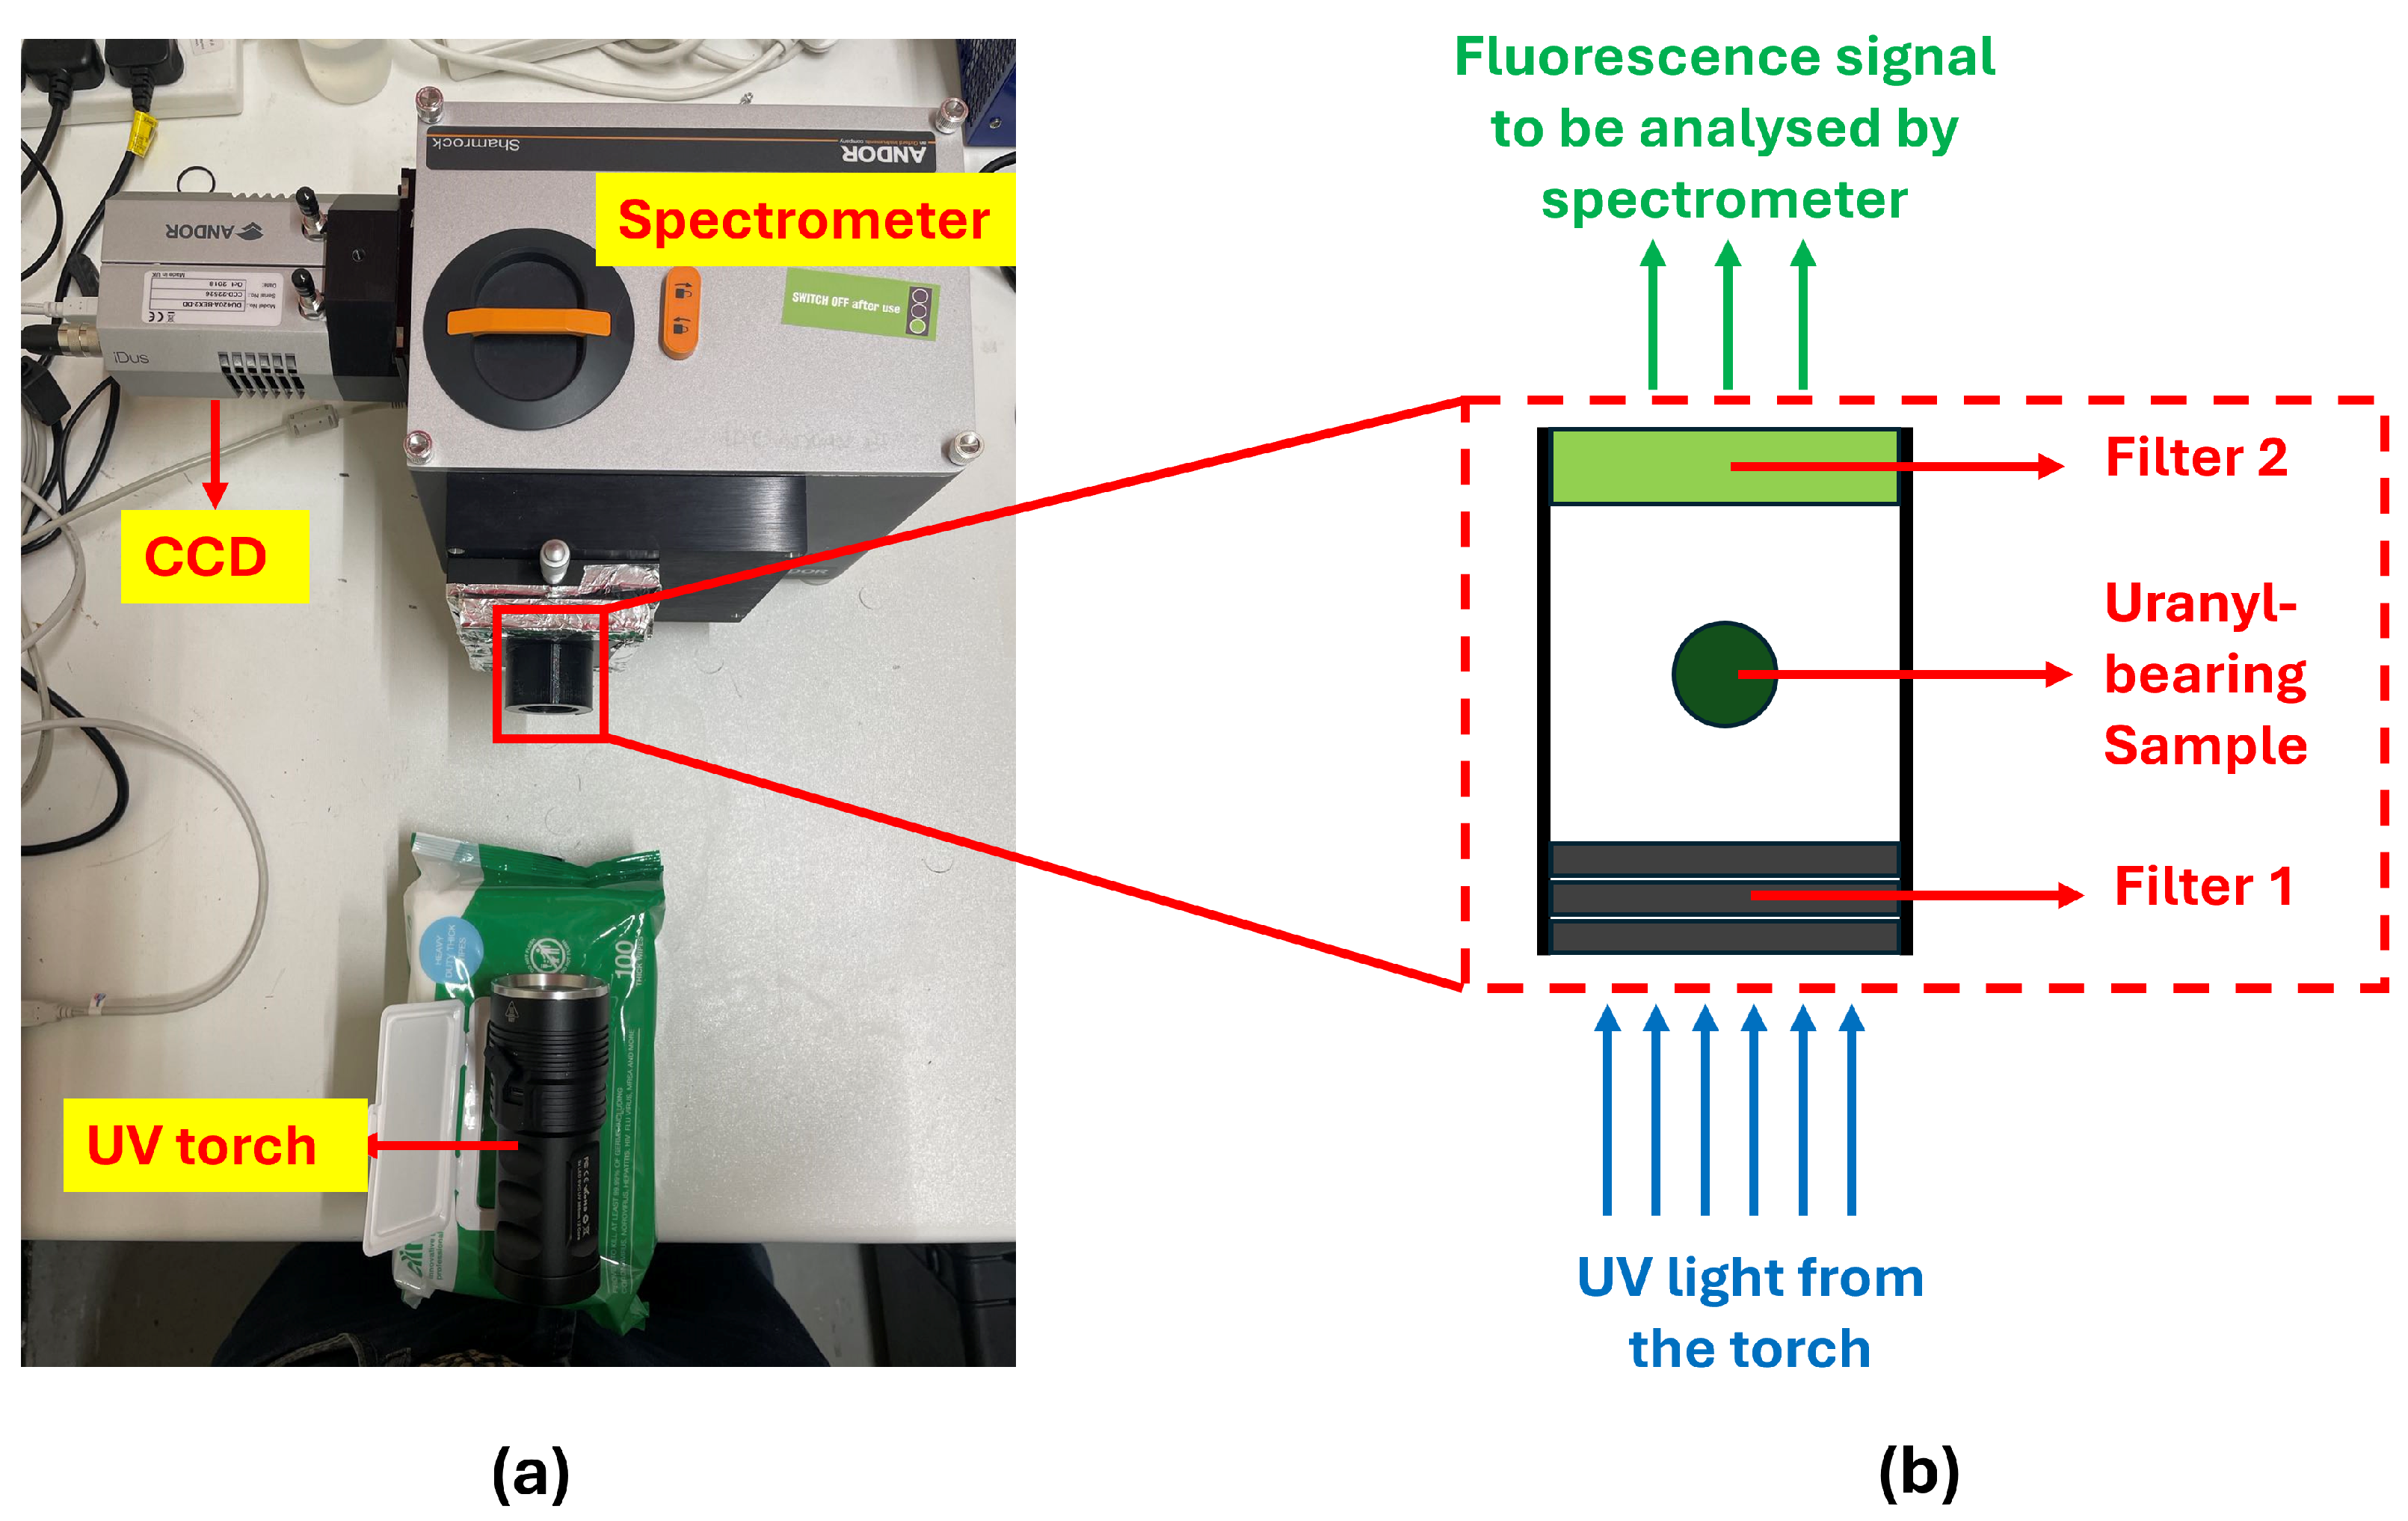
3.2.1. Experimental Setup
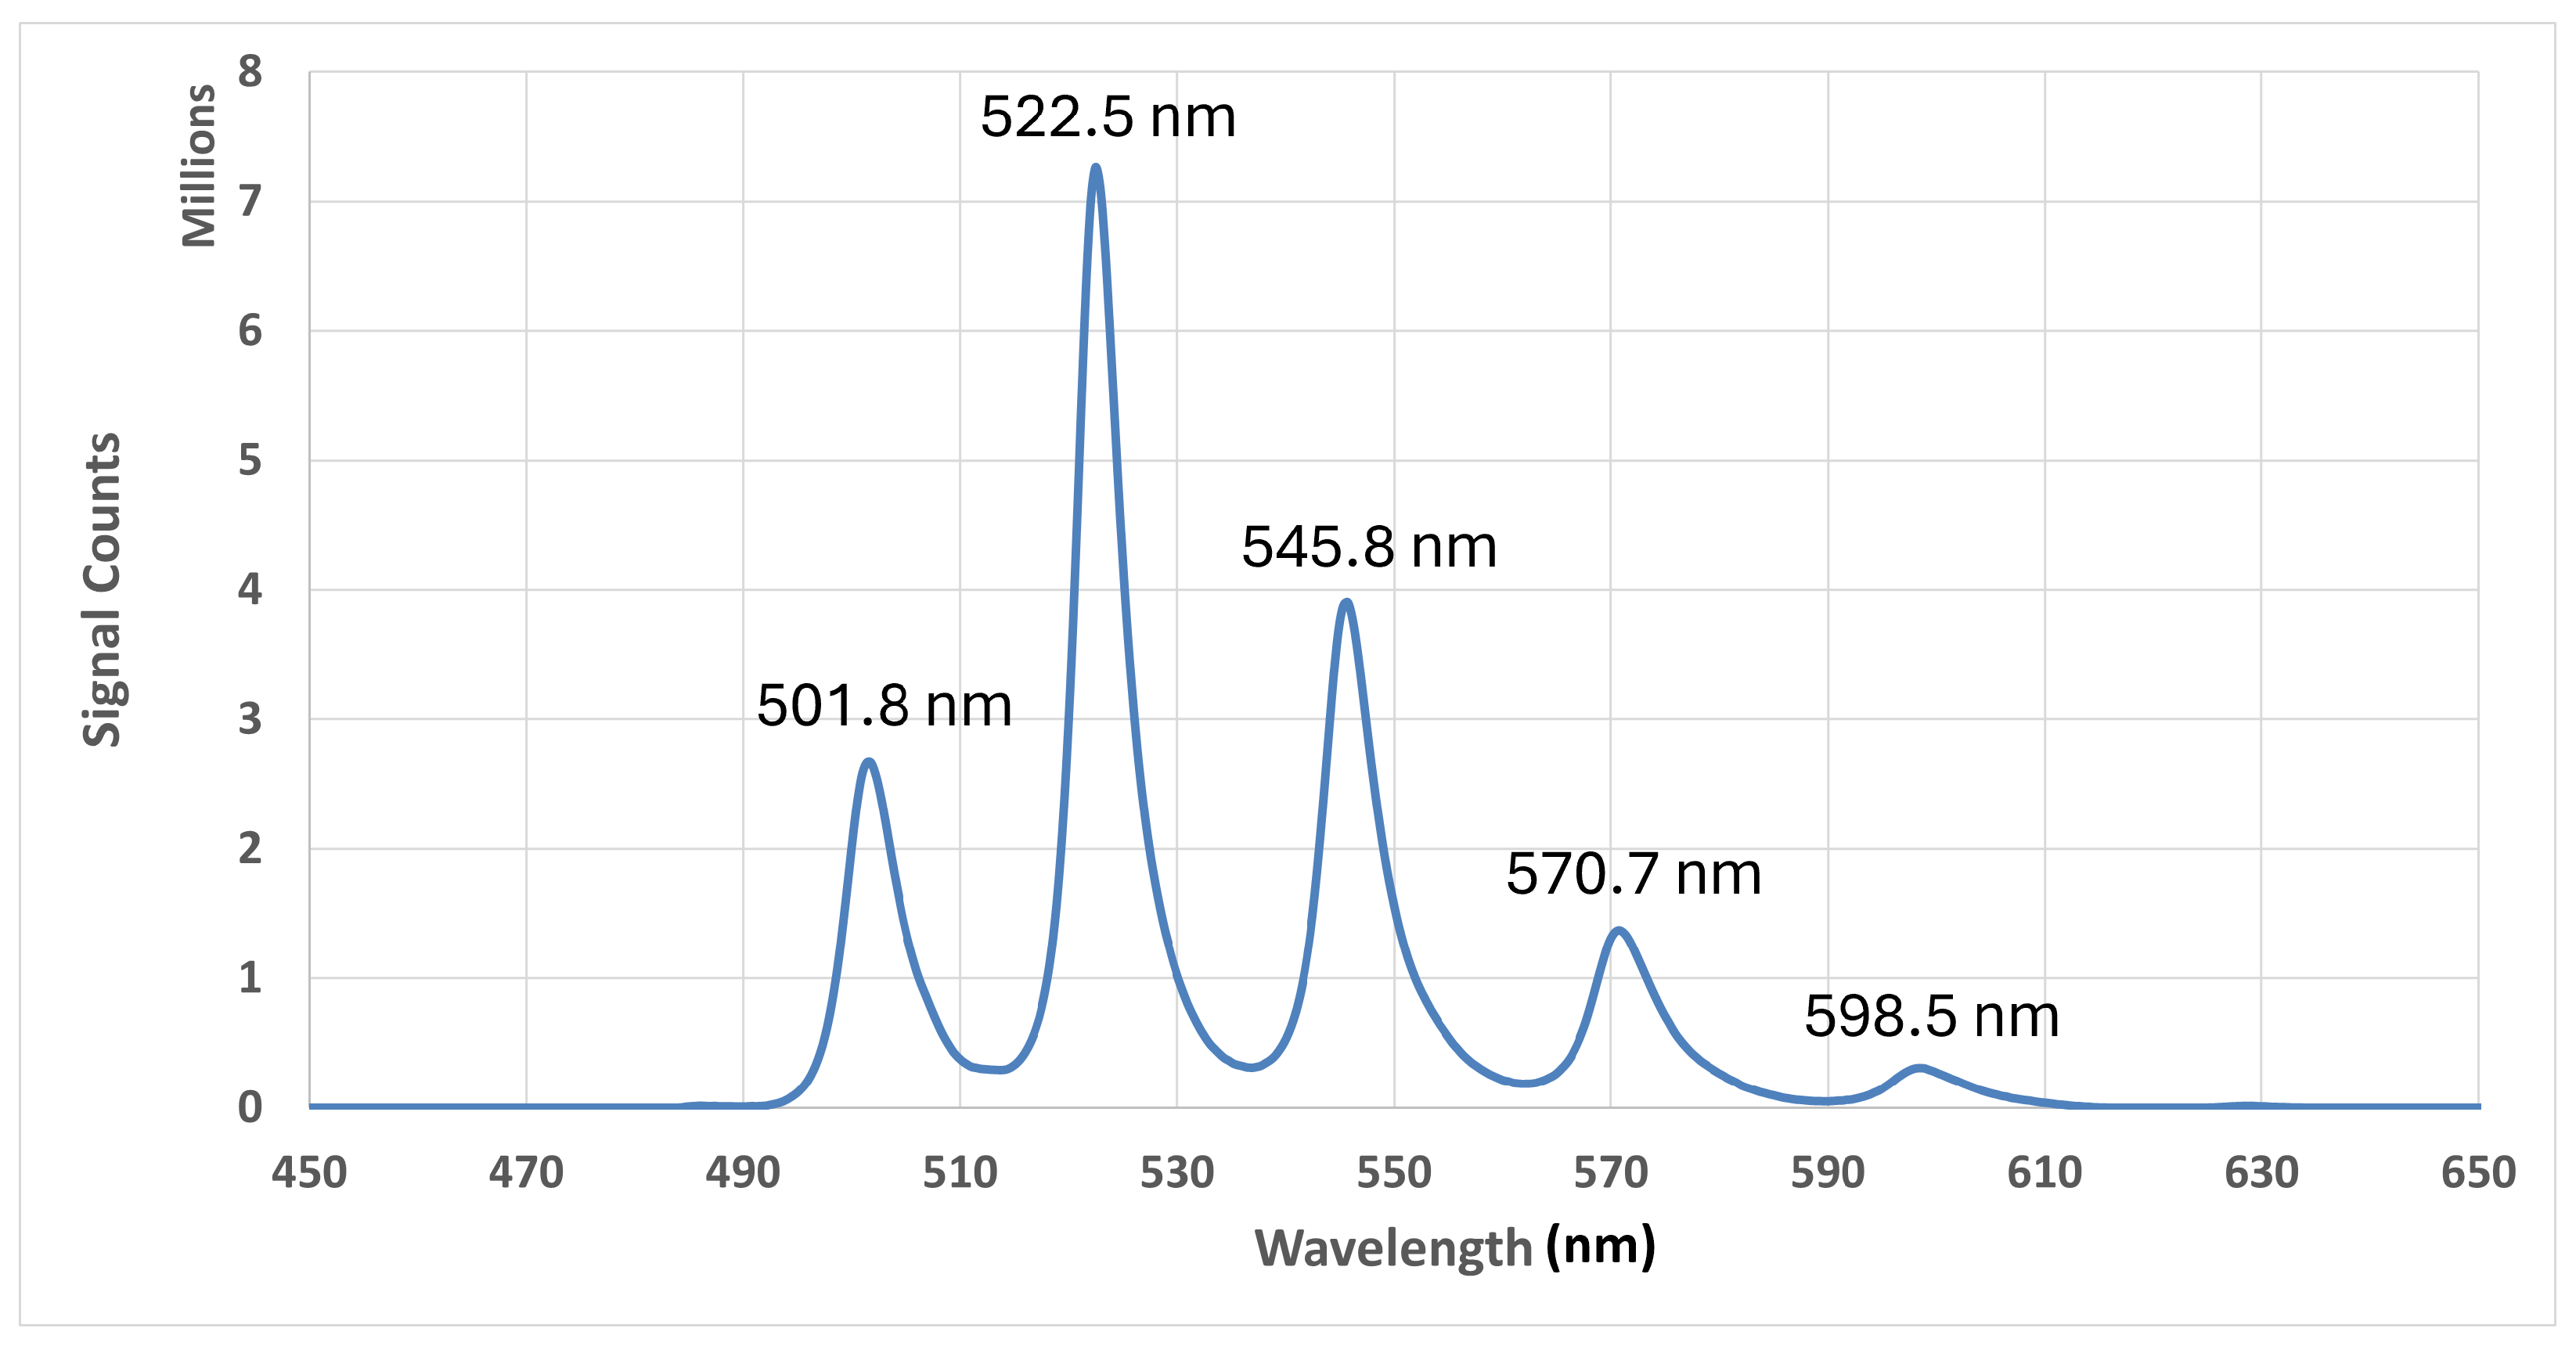
3.2.2. Data Analysis and Results
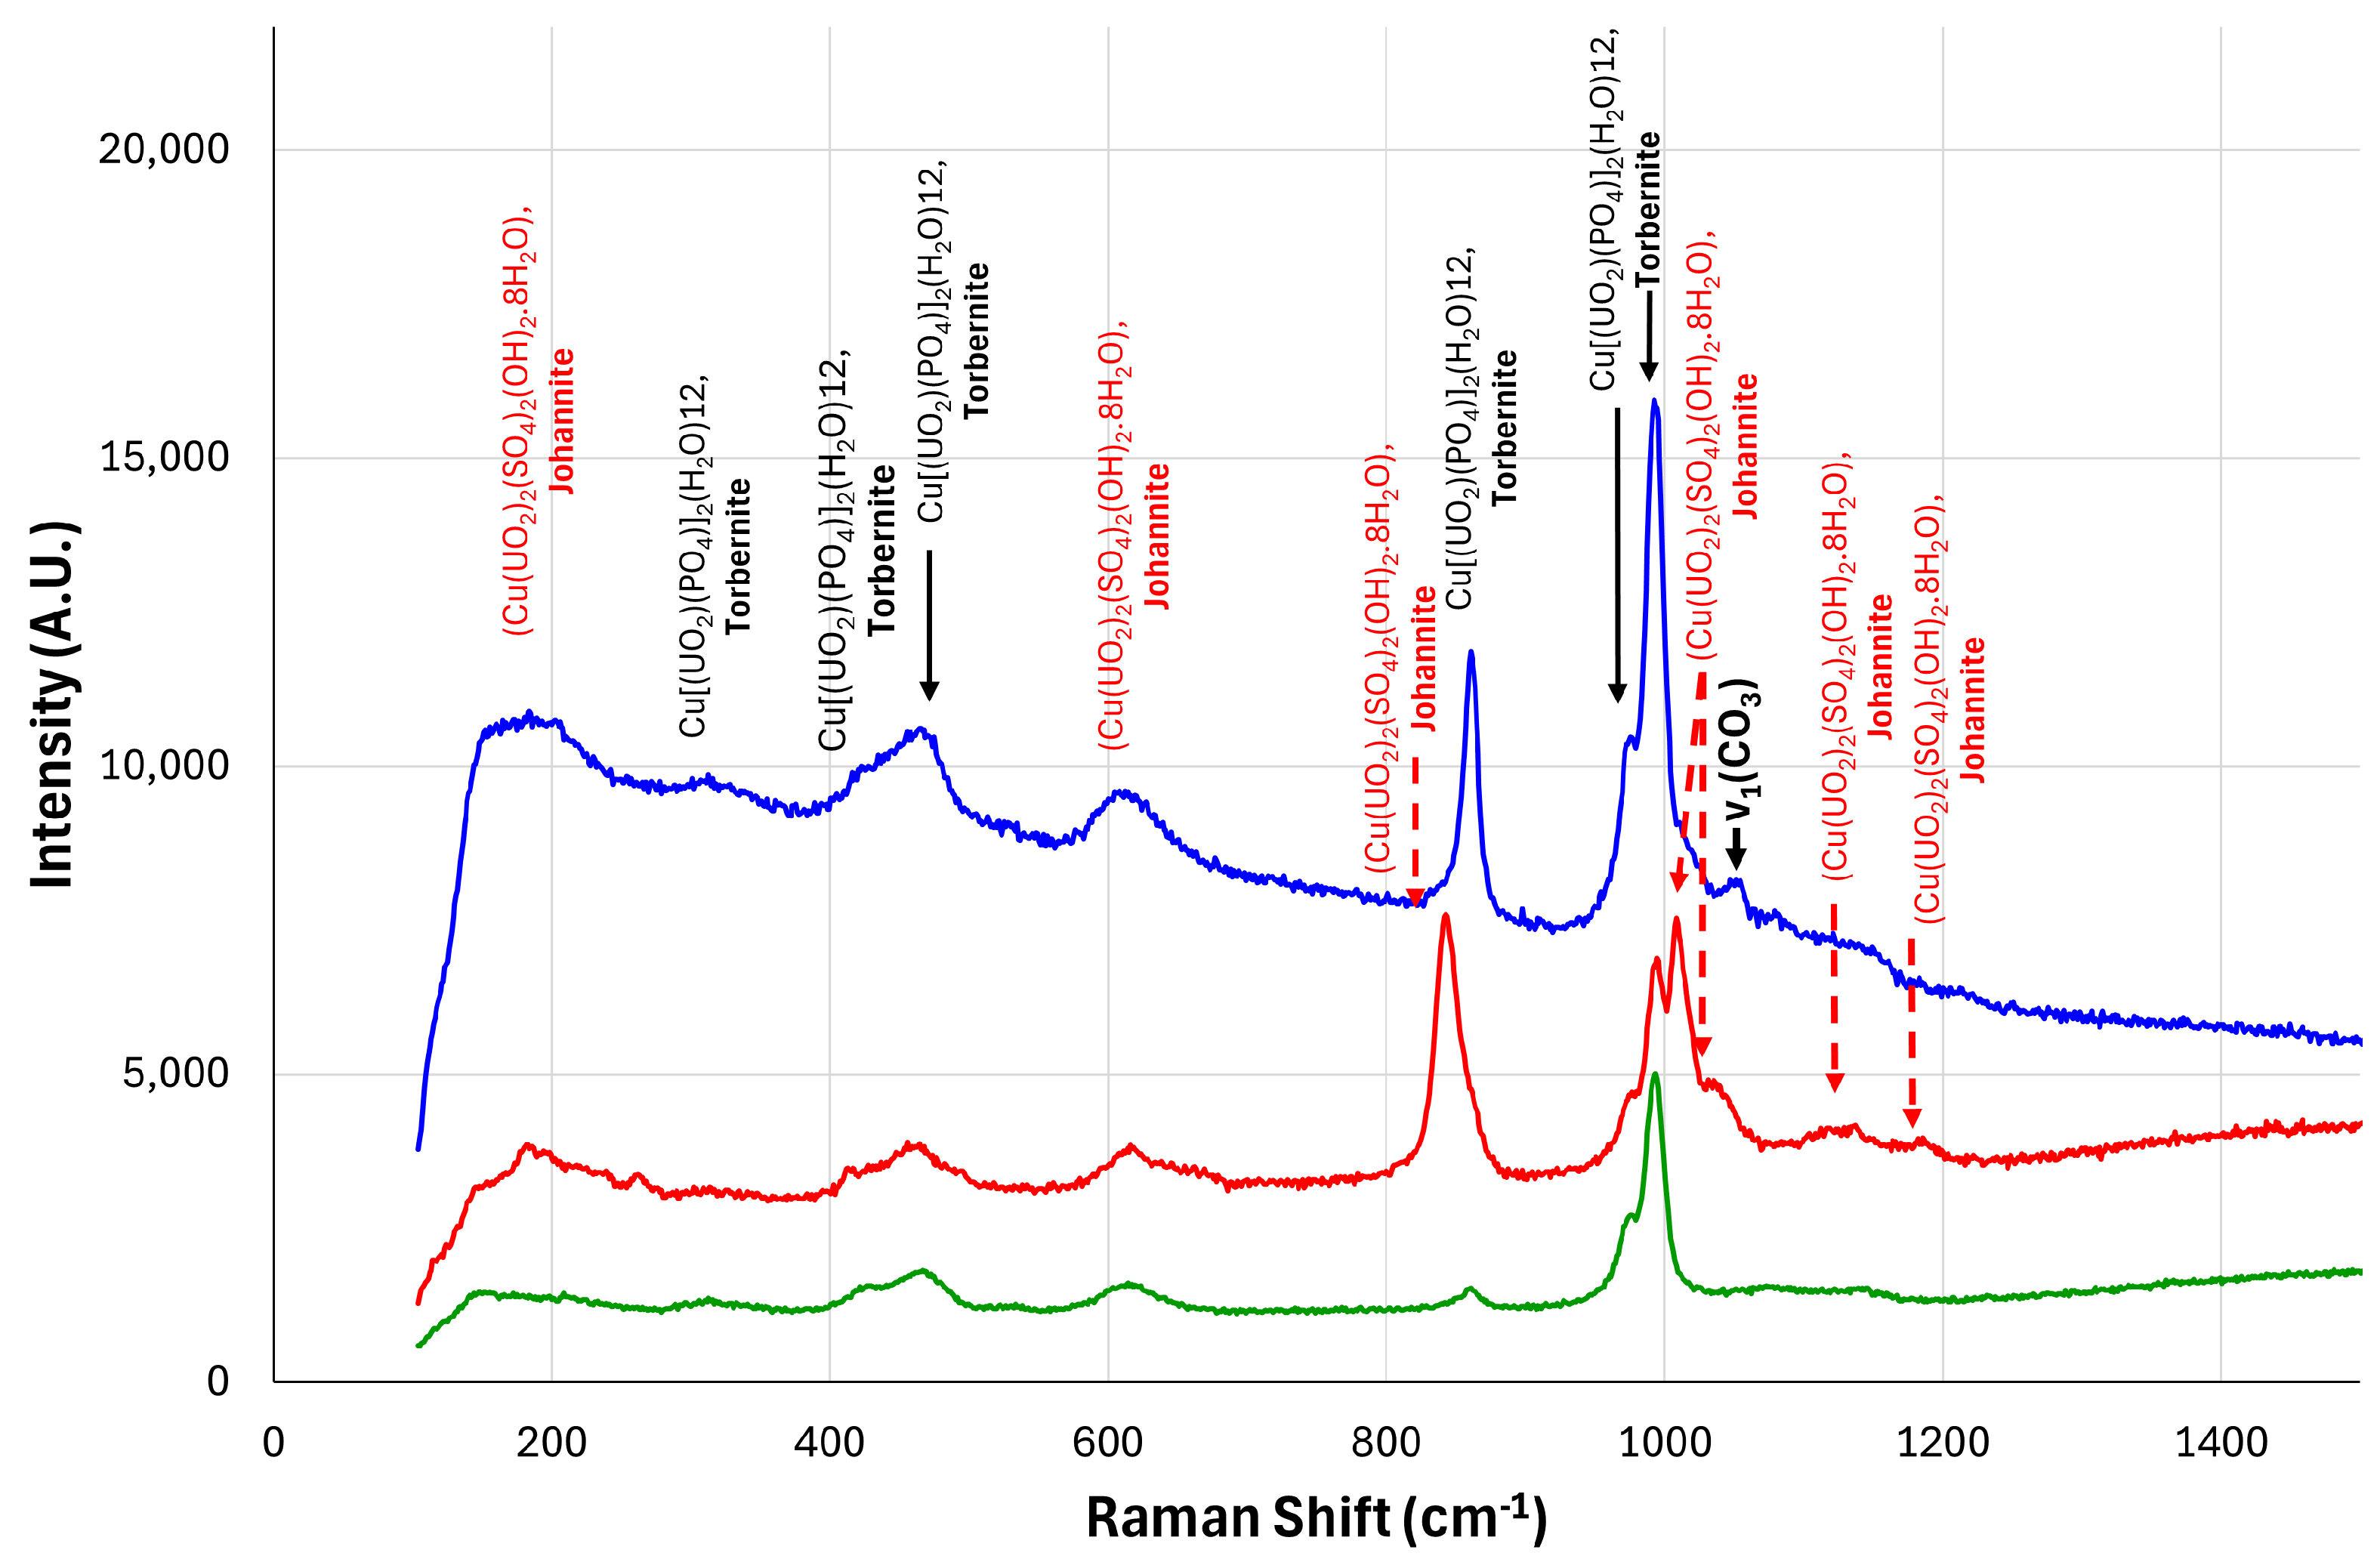
3.3. Raman Analysis
3.4. Elemental Composition Determined via Energy-Dispersive X-Ray Analysis
4. Ground Truth Mineral Sample Analysis
5. Discussion
6. Considerations for Future Work
Author Contributions
Funding
Institutional Review Board Statement
Data Availability Statement
Acknowledgments
Conflicts of Interest
References
- Lottermoser, B. Introduction to Mine Wastes. In Mine Wastes: Characterization, Treatment and Environmental Impacts; Springer: Berlin/Heidelberg, Germany, 2003; pp. 1–30. [Google Scholar] [CrossRef]
- Olías, M.; Cánovas, C.R.; Macías, F.; Basallote, M.D.; Nieto, J.M. The Evolution of Pollutant Concentrations in a River Severely Affected by Acid Mine Drainage: Río Tinto (SW Spain). Minerals 2020, 10, 598. [Google Scholar] [CrossRef]
- Miranda, M.; Blanco-Uribe, Q.; Hernández, L.; Ochoa, G.; Yerena, E. All That Glitters Is Not Gold. Balancing Conservation and Development in Venezuela’s Frontier Forests; World Resources Institute: Washington, DC, USA, 1998. [Google Scholar]
- Paul, J.; Campbell, G. Investigating Rare Earth Element Mine Development in EPA Region 8 and Potential Environmental Impacts; Technical Report EPA Document-908R11003; United States Environmental Protection Agency: Washington, DC, USA, 2011. [Google Scholar]
- Schüler, D.; Buchert, M.; Liu, R.; Dittrich, S.; Merz, C. Study on Rare Earths and Their Recycling; Technical Report; Öko-Institut eV Darmstadt: Darmstadt, Germany, 2011. [Google Scholar]
- Shen, Y.; Moomy, R.; Eggert, R.G. China’s public policies toward rare earths, 1975–2018. Miner. Econ. 2020, 33, 127–151. [Google Scholar] [CrossRef]
- EPA. Health and Environmental Protection Standards for Uranium and Thorium Mill Tailings (40 CFR Part 192); Technical Report; U.S. Environmental Protection Agency: Washington, DC, USA, 2024. [Google Scholar]
- United States Government Accountability Office. ABANDONED HARDROCK MINES Information on Number of Mines Expenditures, and Factors That Limit Efforts to Address Hazards; Technical Report; United States Government Accountability Office: Washington, DC, USA, 2020. [Google Scholar]
- EPA. TEN-YEAR PLAN Federal Actions to Address Impacts of Uranium Contamination on the Navajo Nation 2020–2029; Technical Report; U.S. Environment Protection Agency: Washington, DC, USA, 2021. [Google Scholar]
- Willson, D. Abandoned Uranium Mine Settlements on or near the Navajo Nation; Technical Report; U.S. Environmental Protection Agency: Washington, DC, USA, 2022. [Google Scholar]
- Woodbridge, E.; Connor, D.T.; Verbelen, Y.; Hine, D.; Richardson, T.; Scott, T.B. Airborne gamma-ray mapping using fixed-wing vertical take-off and landing (VTOL) uncrewed aerial vehicles. Front. Robot. AI 2023, 10, 1137763. [Google Scholar]
- Ren, H.; Zhao, Y.; Xiao, W.; Hu, Z. A review of UAV monitoring in mining areas: Current status and future perspectives. Int. J. Coal Sci. Technol. 2019, 6, 320–333. [Google Scholar] [CrossRef]
- Young, K.; Phillips, C.; Reyes, M.; O’Connor, T.; Schierman, R.; Meldem, A.; English, E.; West, W. Mission Results: Creating a 3D Map of a Very High Radiation Confined Space Using the LiDAR-Equipped Elios 3 Drone. Nucl. Sci. Eng. 2024, 1–13. [Google Scholar] [CrossRef]
- Parker, E.; Tucker, M.R.; Okeme, I.; Holland, E.; Connor, D.T.; Mohamed, O.; Martin, P.G.; Scott, T.B. Examining the residual radiological footprint of a former colliery: An industrial nuclear archaeology investigation. J. Environ. Radioact. 2023, 270, 107292. [Google Scholar] [CrossRef] [PubMed]
- Schindler, M.; Hawthorne, F.C.; Mandaliev, P.; Burns, P.C.; Maurice, P. An integrated study of uranyl mineral dissolution processes: Etch pit formation, effects of cations in solution, and secondary precipitation. Radiochim. Acta 2011, 99, 79–94. [Google Scholar] [CrossRef]
- Gaft, M.; Reisfeld, R.; Panczer, G. Modern Luminescence Spectroscopy of Minerals and Materials; Springer: Berlin/Heidelberg, Germany, 2015. [Google Scholar]
- deNeufville, J.P.; Kasdan, A.; Chimenti, R.J.L. Selective detection of uranium by laser-induced fluorescence: A potential remote-sensing technique. 1: Optical characteristics of uranyl geologic targets. Appl. Opt. 1981, 20, 1279–1296. [Google Scholar] [CrossRef] [PubMed]
- Marfunin. Spectroscopy, Luminescence and Radiation Centers in Minerals; Springer: Berlin/Heidelberg, Germany, 2012. [Google Scholar]
- Wang, Z.; Zachara, J.M.; Liu, C.; Gassman, P.L.; Felmy, A.R.; Clark, S.B. A cryogenic fluorescence spectroscopic study of uranyl carbonate, phosphate and oxyhydroxide minerals. Radiochim. Acta 2008, 96, 591–598. [Google Scholar] [CrossRef]
- Barmarin, G. Spectroscopic Atlas of Luminescent Minerals. 2010. Available online: https://www.fluomin.org/uk/list.php?liste=1 (accessed on 17 January 2025).
- Massuyeau, F.; Perry, D.; Kalashnyk, N.; Faulques, E. Spectroscopic markers for uranium (VI) phosphates. Part II: The use of time-resolved photoluminescence. RSC Adv. 2017, 7, 919–926. [Google Scholar] [CrossRef]
- Emmermann, A. Spectra Phosphates-Arsenates-Vanadates. In Mineralogy; Springer: Berlin/Heidelberg, Germany, 2014. [Google Scholar]
- Silver, L. Age determinations on Precambrian diabase differentiates in the Sierra Ancha, Gila county, Arizona. Geol. Soc. Am. Bull. 1960, 71, 108. [Google Scholar]
- Granger, H.C.; Raup, R.B. Uranium Deposits in the Dripping Spring Quartzite, Gila County, Arizona; Technical Report; U.S. Geological Survey: Reston, VA, USA, 1959. [Google Scholar]
- Apple. iPhone 12 Pro—Technical Specifications. 2020. Available online: https://support.apple.com/en-us/111875 (accessed on 17 January 2025).
- Murtiyoso, A.; Grussenmeyer, P.; Landes, T.; Macher, H. First assessments into the use of commercial-grade solid state lidar for low cost heritage documentation. In Proceedings of the XXIV ISPRS Congress (2021), Nice, France, 5–9 July 2021; Volume 43. [Google Scholar]
- Gollob, C.; Ritter, T.; Kraßnitzer, R.; Tockner, A.; Nothdurft, A. Measurement of forest inventory parameters with Apple iPad pro and integrated LiDAR technology. Remote Sens. 2021, 13, 3129. [Google Scholar] [CrossRef]
- Luetzenburg, G.; Kroon, A.; Bjørk, A.A. Evaluation of the Apple iPhone 12 Pro LiDAR for an Application in Geosciences. Sci. Rep. 2021, 11, 22221. [Google Scholar] [CrossRef]
- Chase, P.; Clarke, K.; Hawkes, A.; Jabari, S.; Jakus, J. Apple iPhone 13 Pro LiDAR accuracy assessment for engineering applications. In Proceedings of the Transforming Construction with Reality Capture Technologies: The Digital Reality of Tomorrow, Fredericton, NB, USA, 23–25 August 2022. [Google Scholar] [CrossRef]
- Zawacki, E. iPhone Lidar with Applications for the Geosciences. 2022. Available online: https://opentopography.org/blog/iphone-lidar-applications-geosciences (accessed on 17 January 2025).
- Canvas. What Kind of Accuracy Can I Expect from Canvas? 2024. Available online: https://support.canvas.io/article/5-what-kind-of-accuracy-can-i-expect-from-canvas (accessed on 17 January 2025).
- Downs, R.T. The RRUFF Project: An integrated study of the chemistry, crystallography, Raman and infrared spectroscopy of minerals. In Proceedings of the Program and Abstracts of the 19th General Meeting of the International Mineralogical Association, Kobe, Japan, 23–28 July 2006. [Google Scholar]
- Hoya U340 UV Transmitting Filter. Available online: https://www.uqgoptics.com/materials/hoya-u340/ (accessed on 26 February 2025).
- 550/200 nm BrightLine Single-Band Bandpass Filter. Available online: https://photonics.laser2000.co.uk/products/light-delivery-and-control/microscopy-filters/individual-filters/bandpass-filters/550-200-nm-brightline-single-band-bandpass-filter/?attribute_pa_size=25-mm (accessed on 26 February 2025).
- Driscoll, R.; Wolverson, D.; Mitchels, J.; Skelton, J.; Parker, S.C.; Molinari, M.; Khan, I.; Geeson, D.; Allen, G.C. A Raman spectroscopic study of uranyl minerals from Cornwall, UK. RSC Adv. 2014, 4, 59137–59149. [Google Scholar]
- Frost, R.L. An infrared and Raman spectroscopic study of the uranyl micas. Spectrochim. Acta Part A Mol. Biomol. Spectrosc. 2004, 60, 1469–1480. [Google Scholar] [CrossRef] [PubMed]
- Henkel, G. The Henkel Glossary of Fluorescent Minerals; Fluorescent Mineral Society: Fresh Meadows, NY, USA, 1989; Volume 15. [Google Scholar]
- Robbins, M. Fluorescence: Gems and Minerals Under Ultraviolet Light; Rocks, Minerals and Gemstones; Geoscience Press: Phoenix, AZ, USA, 1994. [Google Scholar]
- Son, H.J.; Kang, S.H.; Jung, J.P.; Kim, C.L. Long Term Trend of Uranium Production and Price. J. Nucl. Fuel Cycle Waste Technol. 2023, 21, 295–301. [Google Scholar]
- Tejado-Ramos, J.J.; Chocarro-León, M.; Barrero-Béjar, I.; Valverde-Calvo, A.; Giraldo-Pavón, F.; Tarragona-Pérez, C.; Morales-Sotaminga, E.S.; Fernández-Cedrón, L. Drones and ultraviolet radiation for the detection of scheelite mineral. Remote Sens. Appl. Soc. Environ. 2023, 30, 100949. [Google Scholar] [CrossRef]
- Raoul, Y.W.; Emmanuel, N.N.; Dagwaï, N.; Mouhamed, A.N.; Bertrand, M.G.I.; Ismaïla, N. Prospecting Tungsten (Scheelite) Mineralization in the Djouzami Area (Adamawa Cameroon) Using Ultra-Violet (UV) Fluorescence and Landsat-8 OLI Images. Earth Sci. 2024, 12, 97–115. [Google Scholar]


| Mineral | Composition | Crystal Structure | Fluorescence (Intensity/Color) | Fluorescence Peaks (nm) |
|---|---|---|---|---|
| Autunite | Tetragonal | Strong/Yellow–green | 488.6, 504, 524.2, 548, 573.9, 602.4 | |
| Meta-autunite | Tetragonal | Strong/Yellow–green | 488, 501.6, 523.7, 547.2, 573.3, 600.2 | |
| Metauranocircite | Tetragonal | Strong/Yellow–green | 488.9, 502.5, 523.7, 547.4, 573.4, 602.6 | |
| Saléeite | Tetragonal | Strong/Yellow–green | 535.2, 557.2, 579.3, 602.4, 625.6 | |
| Uranospinite | Tetragonal | Strong/Yellow–green | 501, 522, 546, 570, 597 | |
| Zippeite | Orthorhombic | Medium/Green | 505, 527, 551, 577 | |
| Schroeckingerite | (SO4)F · 10 H2O | Orthorhombic | Strong/Blue–green | 465, 483, 504, 526, 550, 577, 608, 641, 676, 713 |
| Liebigite | Orthorhombic | Strong/Blue–green | 469.8, 482.8, 503.3, 524.8, 548.5, 574.8, 604.6 | |
| Andersonite | Rhombohedral | Strong/Blue–green | 472, 483, 504, 526, 550, 577, 607, 640 | |
| Uranophane | Monoclinic | Medium/Green | 499, 513, 535, 560, 586, 597, 609 | |
| -Uranophane | Monoclinic | Weak/None/ (Yellow–green) | 506, 527, 548, 565 | |
| Tyuyamunite | Orthorhombic | Weak/None/ (Yellow–green) | 504, 526, 547, 573 | |
| Carnotite | Monoclinic | Not fluorescent | Not fluorescent | |
| Torbernite | Tetragonal | Not fluorescent | Not fluorescent | |
| Meta-torbernite | Tetragonal | Not fluorescent | Not fluorescent |
Disclaimer/Publisher’s Note: The statements, opinions and data contained in all publications are solely those of the individual author(s) and contributor(s) and not of MDPI and/or the editor(s). MDPI and/or the editor(s) disclaim responsibility for any injury to people or property resulting from any ideas, methods, instructions or products referred to in the content. |
© 2025 by the authors. Licensee MDPI, Basel, Switzerland. This article is an open access article distributed under the terms and conditions of the Creative Commons Attribution (CC BY) license (https://creativecommons.org/licenses/by/4.0/).
Share and Cite
Scott, T.B.; Woodbridge, E.; Verbelen, Y.; Ryan Tucker, M.; Kong, L.; El-Turke, A.; Megson-Smith, D.; Malchow, R.; Burnley, P.C. Combined Solid-State LiDAR and Fluorescence Photogrammetry Imaging to Determine Uranyl Mineral Distribution in a Legacy Uranium Mine. Sensors 2025, 25, 2094. https://doi.org/10.3390/s25072094
Scott TB, Woodbridge E, Verbelen Y, Ryan Tucker M, Kong L, El-Turke A, Megson-Smith D, Malchow R, Burnley PC. Combined Solid-State LiDAR and Fluorescence Photogrammetry Imaging to Determine Uranyl Mineral Distribution in a Legacy Uranium Mine. Sensors. 2025; 25(7):2094. https://doi.org/10.3390/s25072094
Chicago/Turabian StyleScott, Thomas B., Ewan Woodbridge, Yannick Verbelen, Matthew Ryan Tucker, Lingteng Kong, Adel El-Turke, David Megson-Smith, Russell Malchow, and Pamela C. Burnley. 2025. "Combined Solid-State LiDAR and Fluorescence Photogrammetry Imaging to Determine Uranyl Mineral Distribution in a Legacy Uranium Mine" Sensors 25, no. 7: 2094. https://doi.org/10.3390/s25072094
APA StyleScott, T. B., Woodbridge, E., Verbelen, Y., Ryan Tucker, M., Kong, L., El-Turke, A., Megson-Smith, D., Malchow, R., & Burnley, P. C. (2025). Combined Solid-State LiDAR and Fluorescence Photogrammetry Imaging to Determine Uranyl Mineral Distribution in a Legacy Uranium Mine. Sensors, 25(7), 2094. https://doi.org/10.3390/s25072094