
Continuous Wave-Diffuse Optical Tomography (CW-DOT) in Human Brain Mapping: A Review

 , , and
Abstract
1. Introduction
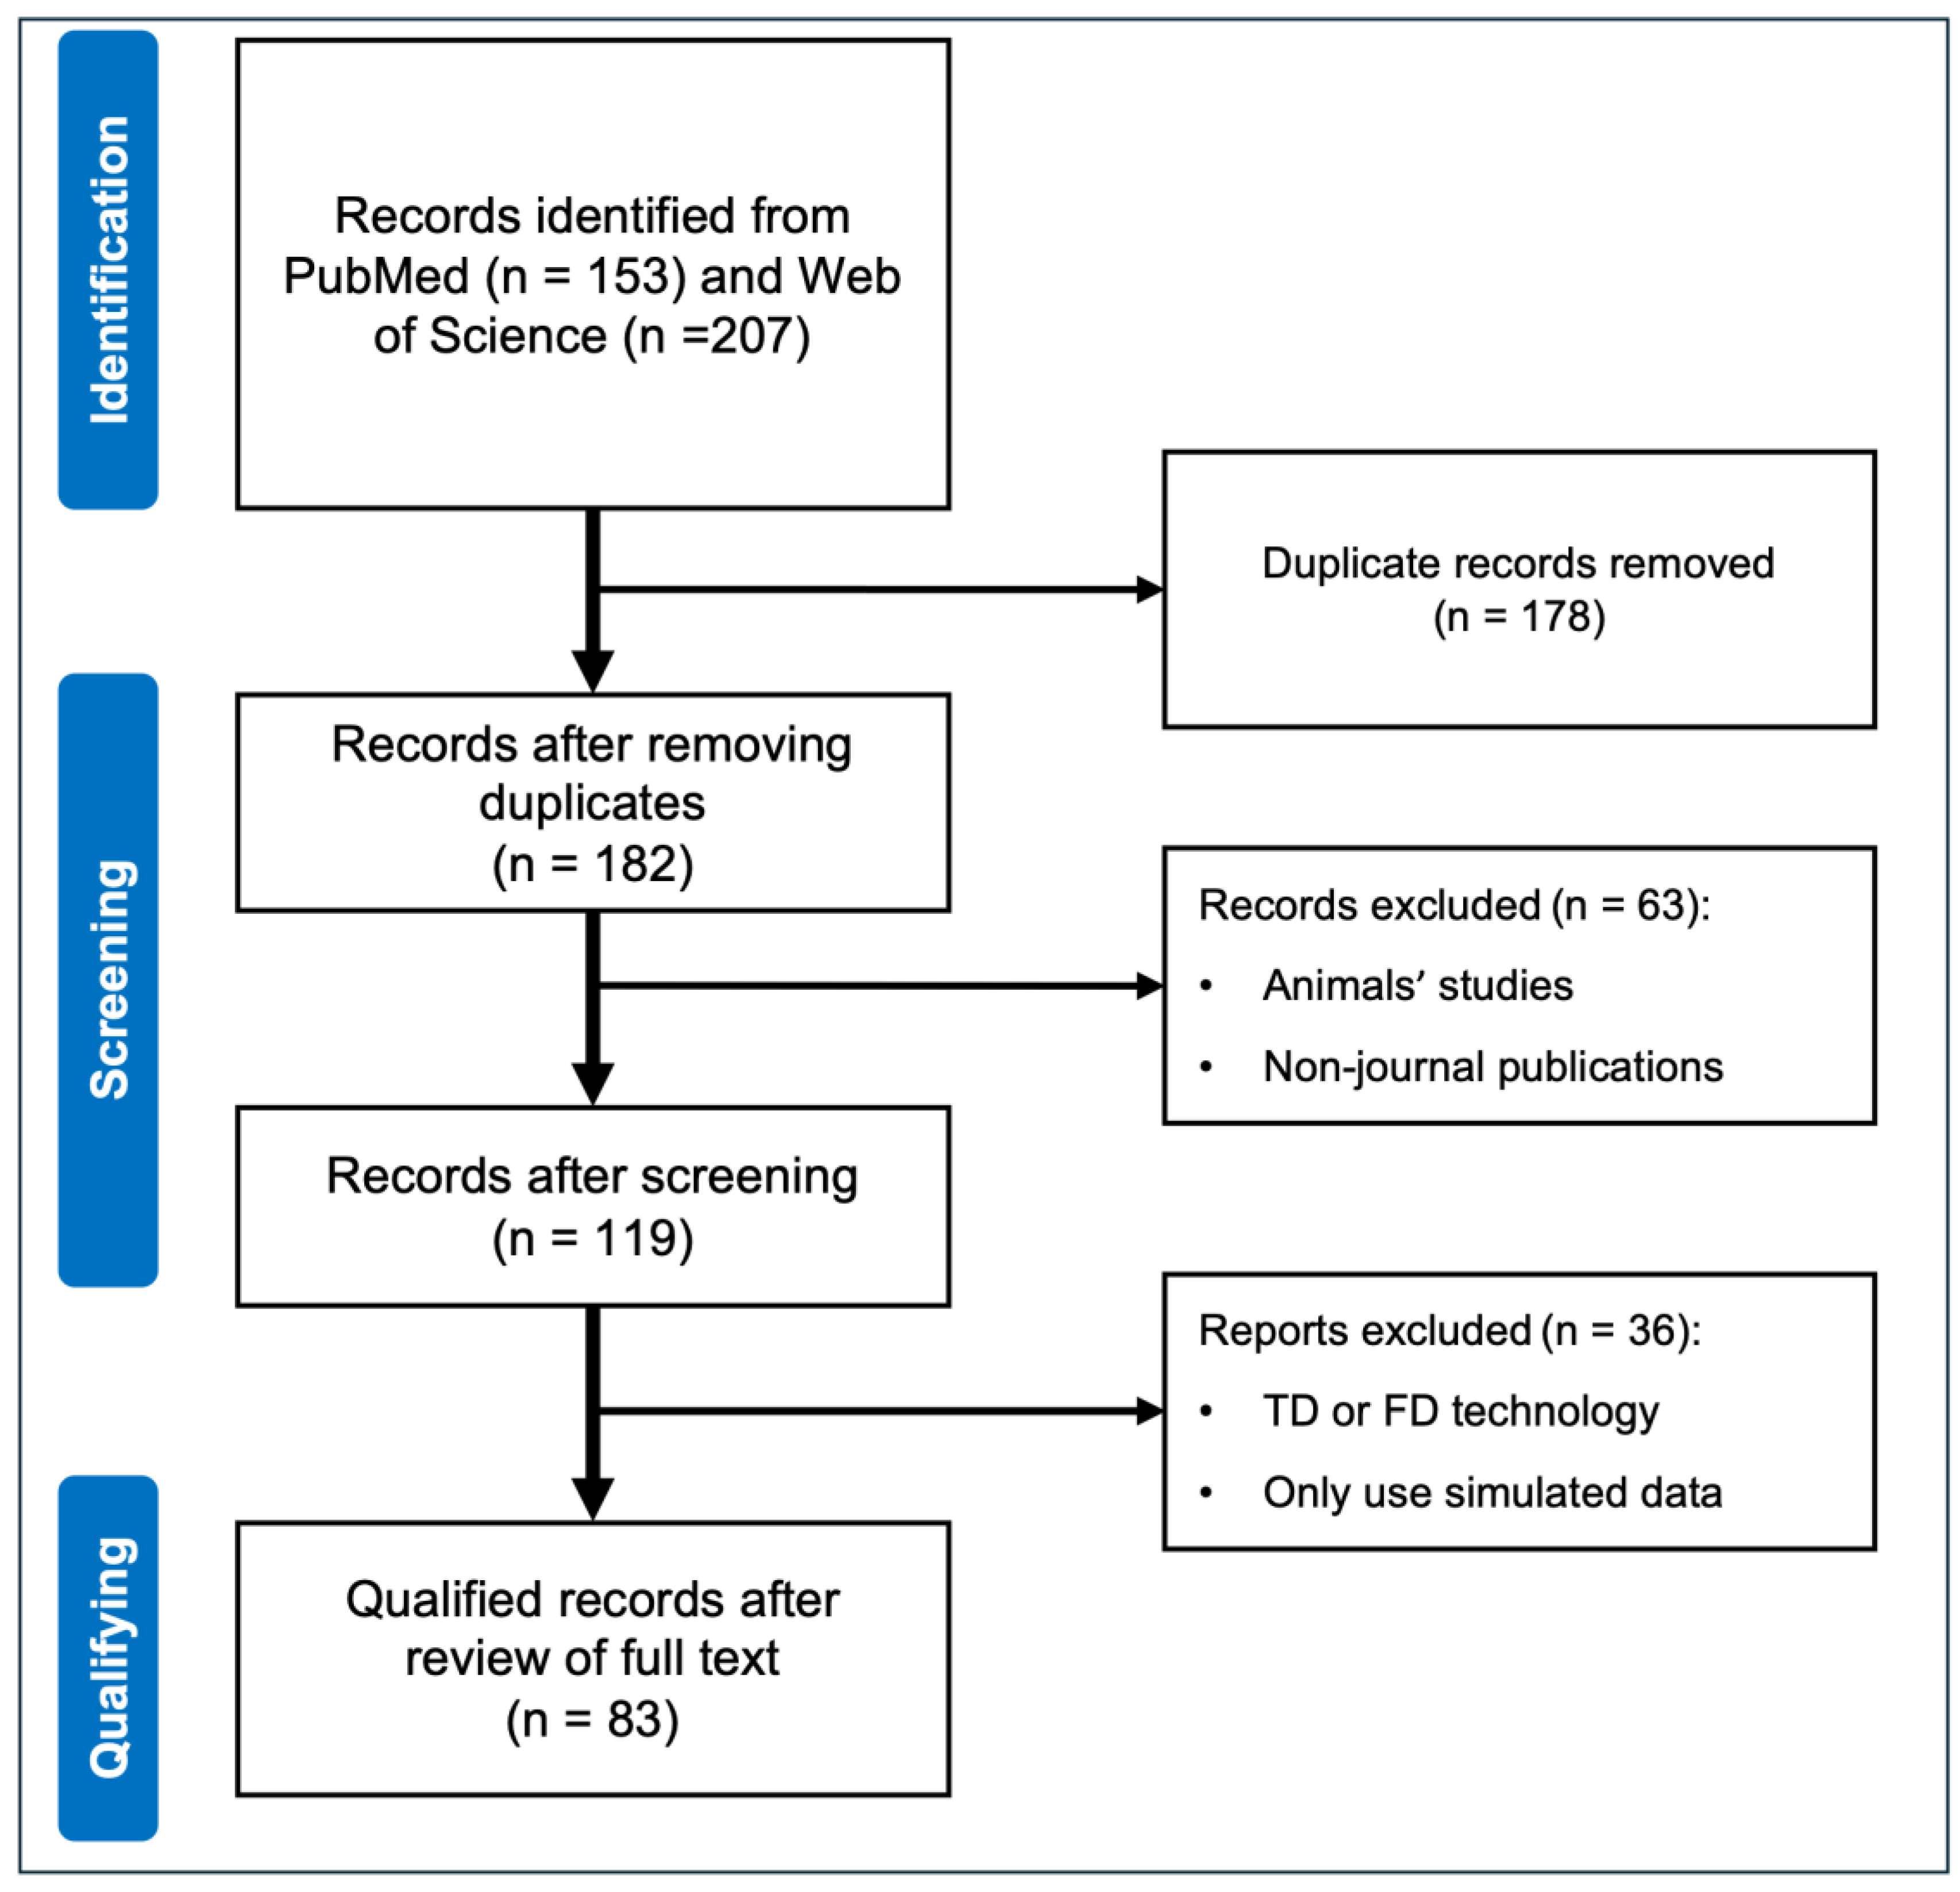
2. Methodology
2.1. Search Strategy
2.2. Prescreening and Qualifying Criteria
3. Results
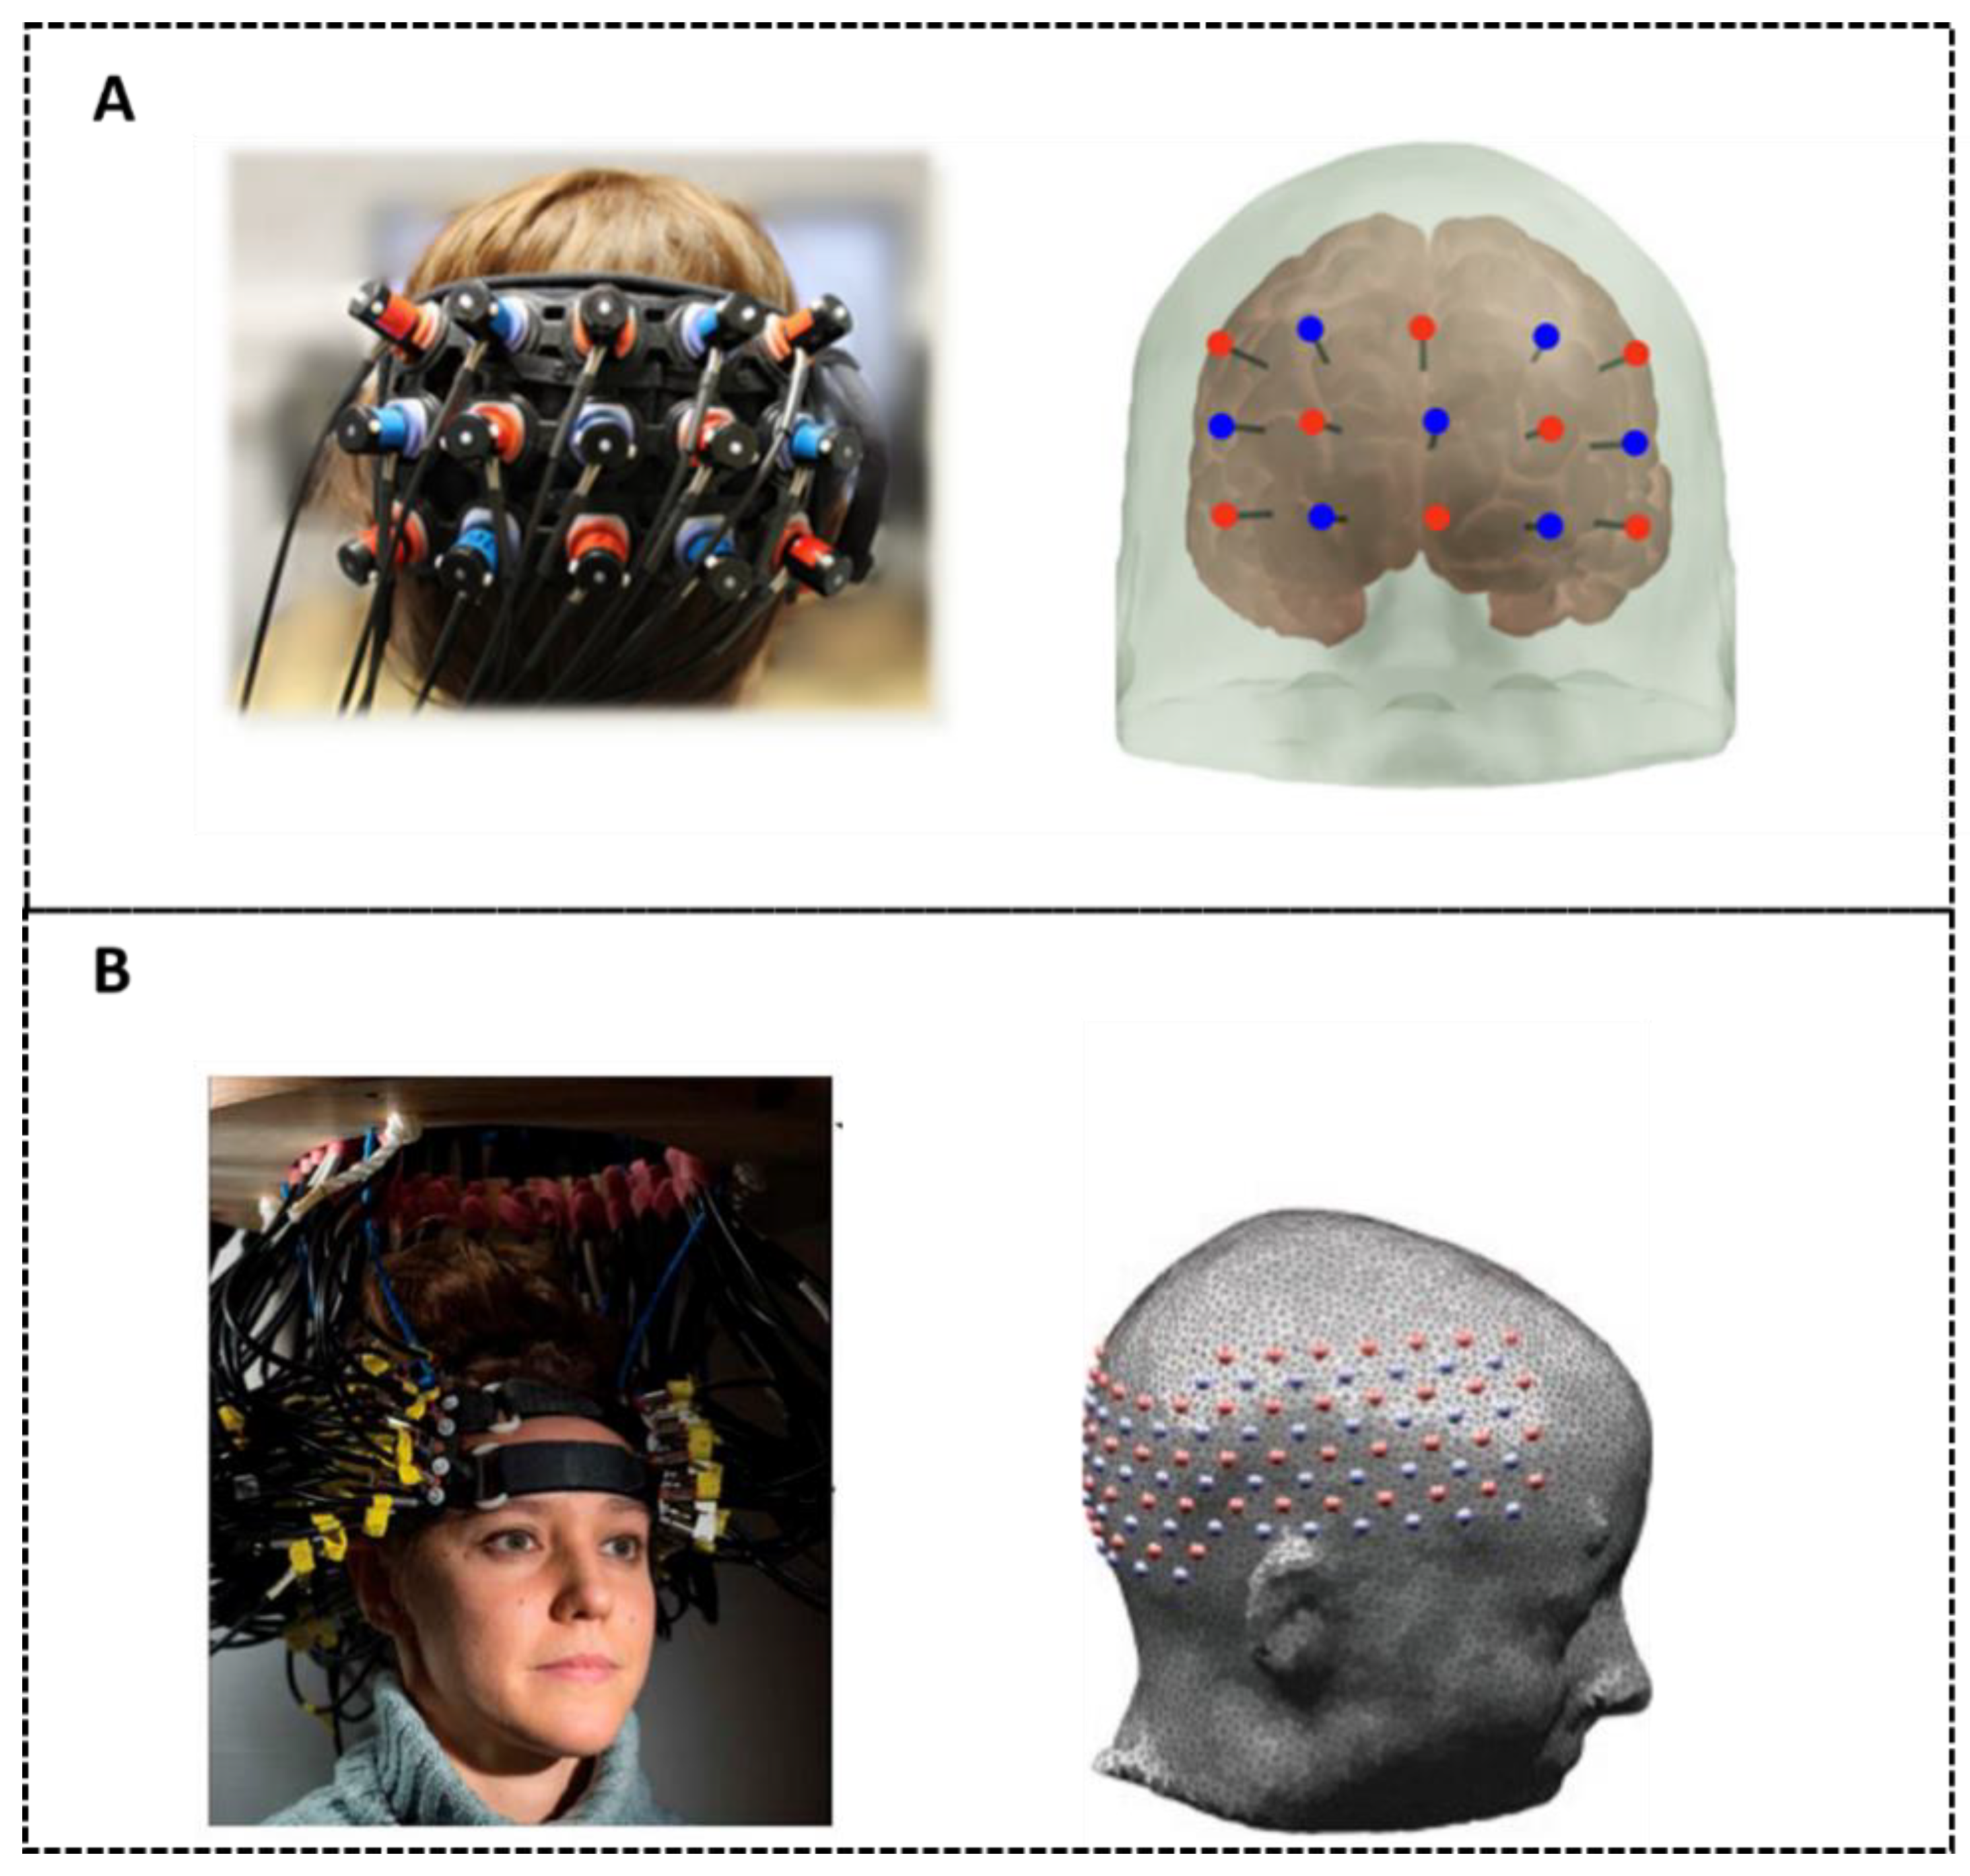
3.1. Structure of DOT Systems
3.1.1. Fiber-Based Systems
3.1.2. Modular Systems

3.2. Imaging Reconstruction of DOT
3.2.1. Forward Modeling
3.2.2. Inverse Problem
Linear Approach
Nonlinear Iterative Reconstruction
3.3. Applications of DOT
3.3.1. DOT in Newborn and Neonatal Research

| First Author, Year | Age | Instrument | Channel Distance (mm) | Channels | Sampling Rate | Region of Brain | Task |
|---|---|---|---|---|---|---|---|
| Steve M. Liao, 2012 [50] | >37 weeks | HD-DOT | 10, 22, 30, 36 | 168 | 10.78 | occipital cortex | sleep or rest |
| Brian R. White, 2012 [54] | term, preterm | HD-DOT | 13, 30, 40, 48 | 106 | 10.78 | occipital cortex | rest |
| Harsimrat Singh, 2014 [52] | 40 weeks | DOT-EEG | 20~40 | 58 | 10 | whole | rest |
| Silvina L. Ferradal, 2016 [49] | 40 weeks | HD-DOT | 10, 22, 30,36 | 168 | 10 | occipital, temporal, and inferior parietal cortex | sleep or rest |
| Maria Chalia, 2019 [51] | 40 weeks | NTS | 20~40 | 58 | 10 | whole | rest |
| Shashank Shekhar, 2019 [55] | 2 months | Aalto DOT system | 12~45 | - | - | left temporal cortex | emotional speech |
| Ambika Maria, 2020 [56] | 2 months | Aalto DOT system | 12~45 | - | - | left fronto-temporal cortex | emotional speech |
| Elisabetta Maria Frijia, 2021 [11] | 4–7 months | LUMO | 10~45 | 864 | 4.6 | the superior temporal lobes and the temporopari-etal junction | video stimula |
| Julie Uchitel, 2023 [53] | 40 weeks | LUMO | 10~45 | 1728 | 10 | frontal and parietal cortex | sleep |
3.3.2. DOT in Brain Diseases Investigation
3.3.3. DOT in Visual Processing Investigation
| First Author, Year | Age | Instrument | Channel Distance (mm) | Channels | Sampling Rate | Region of Brain | Task |
|---|---|---|---|---|---|---|---|
| Benjamin W. Zeff, 2007 [28] | 23–25 | HD192 | 13, 30, 40, 48 | 1200+ | 10 | visual cortex | visual-checkboard |
| Joanne Markham, 2009 [63] | 25–26 | HD-DOT | 13, 30, 40, 48 | 212 | 10.8 | occipital cortex | visual-checkboard |
| Brian R. White, 2010 [64] | 21–27 | HD-DOT | 13, 30, 40, 48 | 212 | 10.78 | visual cortex | visual-checkboard |
| Brian R. White, 2010 [18] | - | HD-DOT | 13, 30, 40, 48 | 212 | 10.78 | visual cortex | visual stimuli |
| Adam T. Eggebrecht, 2012 [9] | 21–30 | HD-DOT | 13, 30, 39, 47 | 1200+ | 10 | visual cortex | visual-checkboard |
| Mahlega S.Hassanpour, 2014 [65] | 17–30 | HD-DOT | 13, 30, 39, 47 | 1200+ | 10 | occipital cortex | visual-checkboard |
| Silvina L. Ferradal, 2014 [10] | 21–30 | HD-DOT | 13, 30, 39, 47 | 1200+ | 10 | visual cortex | visual-checkboard |
| Adam T. Eggebrecht, 2014 [43] | 21–45 | HD-DOT | 13, 30, 39, 47 | 1200+ | 10 | occipital, temporal, motor, and frontal cortex | visual stimuli |
| Andrew K. Fishell, 2019 [68] | - | HD-DOT | 13, 30, 39, 47 | 1200+ | 10 | occipital, temporal, motor, and frontal cortex | view film |
| Andrew K. Fishell, 2020 [69] | 8.4 | HD-DOT | 13, 29, 39 | 324 | 10 | bilateral superior temporal gyrus | movie viewing |
| Kalyan Tripathy, 2021 [66] | 24–54 | HD-DOT | 13, 30, 39, 47 | 1200+ | 10 | back and side | visual stimulation |
| Elisabetta Maria Frijia, 2021 [11] | 4–7 months | LUMO | 10~45 | 864 | 4.6 | the superior temporal lobes and the temporoparietal junction | video stimula |
| Ernesto E. Vidal-Rosas, 2021 [16] | 36 | LUMO | 10~45 | 1728 | 5 | visual cortex | visual stimulus |
| Jiaming Cao, 2023 [67] | - | NIRSport 2 | average 27 | 76 | 5.1 | occipital cortex | visual-checkboard |
| Kalyan Tripathy, 2024 [70] | 18–81 months | HD-DOT | 11, 25, 33, 39, 46 | 3445 | - | occipital, temporal, sensorimotor cortex | movie |
3.3.4. DOT in Motor Function Investigation
| First Author, Year | Age | Instrument | Channel Distance (mm) | Channels | Sampling Rate | Region of Brain | Task |
| Theodore J. Huppert, 2008 [71] | - | CW4 | 29 | - | - | primary motor cortex (M1) | finger-walking |
| Brian R. White, 2009 [76] | 24–27 | HD-DOT | 13, 30, 40, 48 | 212 | 10.8 | visual and motor cortex | finger tapping |
| Haijing Niu, 2011 [73] | 18–35 | DYNOT/CW5 | >19/>30 | 65/32 | - | motor | finger tapping |
| Anna Custo, 2010 [78] | 25,34,31 | CW4 | >30 | - | 10 | left hemisphere motor and pre-motor cortex | right thumb median-nerve stimulation |
| Jin Wook Jung, 2012 [79] | - | Oxymon MKIII | 35, 78 | 24 | 10 | left primary motor and somato-sensory cortex | right finger tapping go-nogo |
| Venkaiah C. Kavuri, 2012 [80] | CW5 | 30 | 188 | 100 | motor cortex | finger tapping | |
| Christina Habermehl, 2012 [13] | 26.8 | DYNOT | 10~30 | 900 | 1.8 | left motor cortex | right fingers stimulate |
| Meryem A. Yücel, 2012 [75] | 20–60 | CW4 | 29 | - | - | primary motor area | finger tapping |
| Fenghua Tian, 2014 [74] | 22–39 | HD-DOT | 16, 36 | 169 | 10.8 | sensorimotor cortex | finger tapping |
| Okito Yamashita, 2014 [44] | - | FOIRE3000, Shimadzu | 13, 29 | 64 | 5.3 | left motor | right finger tapping |
| Okkyun Lee, 2015 [72] | - | Oxymon MKIII | 35 | 24 | 10 | left motor | right finger tapping go-nogo |
| Okito Yamashita, 2016 [81] | 22–45 | FOIRE 3000, Shimadzu | 13, 29 | 64 | 5.3 | left motor | hand movement |
| Danial Chitnis, 2016 [77] | 23–51 | NTS | 8.5~85 | 128 | 2.94 | motor cortex | finger extension |
| Xianjin Dai, 2018 [59] | - | HD-DOT | >10 | - | 14.4 | motor | finger tapping |
| Daniel Anaya, 2023 [24] | 33.2 | spotlight | >6.5 | 3198 × 2 | 6.1 | motor cortex | finger tapping |
| Yuanyuan Gao, 2023 [12] | - | NIRSport 2 | 19, 32.9 | 50 × 2 | - | motor cortex | squeeze |
3.3.5. DOT in Auditory Function Investigation
| First Author, Year | Age | Instrument | Channel Distance (mm) | Channels | Sampling Rate | Region of Brain | Task |
| Mahlega S. Hassanpour, 2015 [14] | 20–32 | HD-DOT | 13, 30, 39, 47 | 1200+ | 10 | portions of occipital, temporal, motor, and frontal cortex | speech |
| Mahlega S. Hassanpour, 2017 [82] | 20–30 | HD-DOT | 13, 30, 39, 47 | 1200+ | 10 | occipital, temporal, and parts of parietal, motor, and frontal cortex | auditory |
| Arefeh Sherafati, 2020 [83] | - | HD-DOT | 13, 30, 39, 47 | 1200+ | 10 | occipital, temporal, motor, and frontal cortex | hearing word |
| Andrew K. Fishell, 2020 [69] | 8.4 | HD-DOT | 13, 29, 39 | 324 | 10 | superior temporal gyrus | passive word listening |
| Mariel L. Schroeder, 2023 [84] | 20–44 | HD-DOT | 13, 30, 39, 47 | 1200+ | 10 | portions of occipital, temporal, motor, and frontal cortex | language |
3.3.6. DOT in Investigating Complex Cognitive Function and Brain Network
| First Author, Year | Age | Instrument | Channel Distance (mm) | Channels | Sampling Rate | Region of Brain | Task |
| L. Becerra, 2008 [85] | 18–40 | CW5 | 30 | - | - | frontal and sensory cortex | brush or heat hand |
| Lino Becerra, 2009 [86] | 18–40 | CW5 | 30 | - | - | somatosensory cortex | heat face |
| Xue Wu, 2015 [90] | 26 | HD-DOT | 10, 22, 30, 36 | - | - | whole | rest |
| Lin Li, 2017 [87] | 40 (25–40), 60 (>60) | HD-DOT | 30/32.5 | 40/72 | - | prefrontal region | BART |
| Estefania Hernandez-Martin, 2020 [94] | - | DYNOT232 | 10~40 | 2048 | 1.81 | frontal cortex | rest |
| Takatsugu Aihara, 2020 [93] | 21–38 | SMARTNIRS, Shimadzu | 13, 29 | 152 | 18.5 | frontal and parietal area | rest |
| Hubin Zhao, 2020 [88] | 22–45 | DOT sensor module | 10, 23, 28 | 1152 | 3 | T7-Cz-T8 | text and walk |
| Ali Fahim Khan, 2022 [89] | 31.7 | NIRxGmbH | 29.8~45.6 | 117 | 6.25 | whole | rest |
| Julie Uchitel, 2022 [15] | 36 | LUMO | 10~45 | 800 | - | pre-frontal and occipital regions | rest |
| Fan Zhang, 2023 [91] | 31.7 | NIRScout | 30 | 109 | 6.25 | whole | rest |
| Sruthi Srinivasan, 2024 [92] | 29.1 | LUMO | 10~45 | - | 12.5,5 | prefrontal, motor, and visual cortex | rest |
4. Discussion and Future Directions
Author Contributions
Funding
Conflicts of Interest
References
- Akila, V.; Christaline, J.A. Investigation of Neural Correlates of Head and Facial Movement Using fNIRS. In Proceedings of the 2023 First International Conference on Advances in Electrical, Electronics and Computational Intelligence (ICAEECI), Tiruchengode, India, 19 October 2023; pp. 1–6. [Google Scholar]
- Ferrari, M.; Quaresima, V. A Brief Review on the History of Human Functional Near-Infrared Spectroscopy (fNIRS) Development and Fields of Application. NeuroImage 2012, 63, 921–935. [Google Scholar] [CrossRef] [PubMed]
- Hu, Z.; Liu, G.; Dong, Q.; Niu, H. Applications of Resting-State fNIRS in the Developing Brain: A Review From the Connectome Perspective. Front. Neurosci. 2020, 14, 476. [Google Scholar] [CrossRef]
- Von Lühmann, A.; Li, X.; Müller, K.-R.; Boas, D.A.; Yücel, M.A. Improved Physiological Noise Regression in fNIRS: A Multimodal Extension of the General Linear Model Using Temporally Embedded Canonical Correlation Analysis. NeuroImage 2020, 208, 116472. [Google Scholar] [CrossRef] [PubMed]
- Do Nascimento, D.C.; Santos Da Silva, J.R.; Ara, A.; Sato, J.R.; Costa, L. Hyperscanning fNIRS Data Analysis Using Multiregression Dynamic Models: An Illustration in a Violin Duo. Front. Comput. Neurosci. 2023, 17, 1132160. [Google Scholar] [CrossRef]
- Vidal-Rosas, E.E.; Von Lühmann, A.; Pinti, P.; Cooper, R.J. Wearable, High-Density fNIRS and Diffuse Optical Tomography Technologies: A Perspective. Neurophoton. 2023, 10, 23513. [Google Scholar] [CrossRef]
- Zhang, Y.; Zhu, C. Assessing Brain Networks by Resting-State Dynamic Functional Connectivity: An fNIRS-EEG Study. Front. Neurosci. 2020, 13, 1430. [Google Scholar] [CrossRef]
- Chiarelli, A.M.; Maclin, E.L.; Low, K.A.; Fantini, S.; Fabiani, M.; Gratton, G. Low-Resolution Mapping of the Effective Attenuation Coefficient of the Human Head: A Multidistance Approach Applied to High-Density Optical Recordings. Neurophoton 2017, 4, 21103. [Google Scholar] [CrossRef]
- Eggebrecht, A.T.; White, B.R.; Ferradal, S.L.; Chen, C.; Zhan, Y.; Snyder, A.Z.; Dehghani, H.; Culver, J.P. A Quantitative Spatial Comparison of High-Density Diffuse Optical Tomography and fMRI Cortical Mapping. NeuroImage 2012, 61, 1120–1128. [Google Scholar] [CrossRef]
- Ferradal, S.L.; Eggebrecht, A.T.; Hassanpour, M.; Snyder, A.Z.; Culver, J.P. Atlas-Based Head Modeling and Spatial Normalization for High-Density Diffuse Optical Tomography: In Vivo Validation against fMRI. NeuroImage 2014, 85, 117–126. [Google Scholar] [CrossRef]
- Frijia, E.M.; Billing, A.; Lloyd-Fox, S.; Vidal Rosas, E.; Collins-Jones, L.; Crespo-Llado, M.M.; Amadó, M.P.; Austin, T.; Edwards, A.; Dunne, L.; et al. Functional Imaging of the Developing Brain with Wearable High-Density Diffuse Optical Tomography: A New Benchmark for Infant Neuroimaging Outside the Scanner Environment. NeuroImage 2021, 225, 117490. [Google Scholar] [CrossRef]
- Gao, Y.; Rogers, D.; Von Lühmann, A.; Ortega-Martinez, A.; Boas, D.A.; Yücel, M.A. Short-Separation Regression Incorporated Diffuse Optical Tomography Image Reconstruction Modeling for High-Density Functional near-Infrared Spectroscopy. Neurophoton. 2023, 10, 25007. [Google Scholar] [CrossRef]
- Habermehl, C.; Holtze, S.; Steinbrink, J.; Koch, S.P.; Obrig, H.; Mehnert, J.; Schmitz, C.H. Somatosensory Activation of Two Fingers Can Be Discriminated with Ultrahigh-Density Diffuse Optical Tomography. NeuroImage 2012, 59, 3201–3211. [Google Scholar] [CrossRef]
- Hassanpour, M.S.; Eggebrecht, A.T.; Culver, J.P.; Peelle, J.E. Mapping Cortical Responses to Speech Using High-Density Diffuse Optical Tomography. NeuroImage 2015, 117, 319–326. [Google Scholar] [CrossRef]
- Uchitel, J.; Blanco, B.; Vidal-Rosas, E.; Collins-Jones, L.; Cooper, R.J. Reliability and Similarity of Resting State Functional Connectivity Networks Imaged Using Wearable, High-Density Diffuse Optical Tomography in the Home Setting. NeuroImage 2022, 263, 119663. [Google Scholar] [CrossRef] [PubMed]
- Vidal-Rosas, E.E.; Zhao, H.; Nixon-Hill, R.W.; Smith, G.; Dunne, L.; Powell, S.; Cooper, R.J.; Everdell, N.L. Evaluating a New Generation of Wearable High-Density Diffuse Optical Tomography Technology via Retinotopic Mapping of the Adult Visual Cortex. Neurophoton. 2021, 8, 25002. [Google Scholar] [CrossRef]
- Wheelock, M.D.; Culver, J.P.; Eggebrecht, A.T. High-Density Diffuse Optical Tomography for Imaging Human Brain Function. Rev. Sci. Instrum. 2019, 90, 51101. [Google Scholar] [CrossRef]
- White, B.R.; Culver, J.P. Quantitative Evaluation of High-Density Diffuse Optical Tomography: In Vivo Resolution and Mapping Performance. J. Biomed. Opt. 2010, 15, 1. [Google Scholar] [CrossRef]
- Zhao, H.; Frijia, E.M.; Vidal Rosas, E.; Collins-Jones, L.; Smith, G.; Nixon-Hill, R.; Powell, S.; Everdell, N.L.; Cooper, R.J. Design and Validation of a Mechanically Flexible and Ultra-Lightweight High-Density Diffuse Optical Tomography System for Functional Neuroimaging of Newborns. Neurophoton. 2021, 8, 15011. [Google Scholar] [CrossRef]
- Wiggins, I.M.; Hartley, D.E.H. A Synchrony-Dependent Influence of Sounds on Activity in Visual Cortex Measured Using Functional Near-Infrared Spectroscopy (fNIRS). PLoS ONE 2015, 10, e0122862. [Google Scholar] [CrossRef]
- Cooper, R.J.; Caffini, M.; Dubb, J.; Fang, Q.; Custo, A.; Tsuzuki, D.; Fischl, B.; Wells, W.; Dan, I.; Boas, D.A. Validating Atlas-Guided DOT: A Comparison of Diffuse Optical Tomography Informed by Atlas and Subject-Specific Anatomies. NeuroImage 2012, 62, 1999–2006. [Google Scholar] [CrossRef]
- Perkins, G.A.; Eggebrecht, A.T.; Dehghani, H. Quantitative Evaluation of Frequency Domain Measurements in High Density Diffuse Optical Tomography. J. Biomed. Opt. 2021, 26, 56001. [Google Scholar] [CrossRef] [PubMed]
- Okawa, S.; Hoshi, Y.; Yamada, Y. Improvement of Image Quality of Time-Domain Diffuse Optical Tomography with Lp Sparsity Regularization. Biomed. Opt. Express 2011, 2, 3334–3348. [Google Scholar] [CrossRef] [PubMed]
- Anaya, D.; Batra, G.; Bracewell, P.; Catoen, R.; Chakraborty, D.; Chevillet, M.; Damodara, P.; Dominguez, A.; Emms, L.; Jiang, Z.; et al. Scalable, Modular Continuous Wave Functional near-Infrared Spectroscopy System (Spotlight). J. Biomed. Opt. 2023, 28, 65003. [Google Scholar] [CrossRef]
- Galderisi, A.; Brigadoi, S.; Cutini, S.; Moro, S.B.; Lolli, E.; Meconi, F.; Benavides-Varela, S.; Baraldi, E.; Amodio, P.; Cobelli, C.; et al. Long-Term Continuous Monitoring of the Preterm Brain with Diffuse Optical Tomography and Electroencephalography: A Technical Note on Cap Manufacturing. Neurophoton 2016, 3, 45009. [Google Scholar] [CrossRef]
- Page, M.J.; McKenzie, J.E.; Bossuyt, P.M.; Boutron, I.; Hoffmann, T.C.; Mulrow, C.D.; Shamseer, L.; Tetzlaff, J.M.; Akl, E.A.; Brennan, S.E.; et al. The PRISMA 2020 Statement: An Updated Guideline for Reporting Systematic Reviews. BMJ 2021, 372, n71. [Google Scholar] [CrossRef] [PubMed]
- Zhao, H.; Cooper, R.J. Review of Recent Progress toward a Fiberless, Whole-Scalp Diffuse Optical Tomography System. Neurophoton 2017, 5, 1. [Google Scholar] [CrossRef]
- Zeff, B.W.; White, B.R.; Dehghani, H.; Schlaggar, B.L.; Culver, J.P. Retinotopic Mapping of Adult Human Visual Cortex with High-Density Diffuse Optical Tomography. Proc. Natl. Acad. Sci. USA 2007, 104, 12169–12174. [Google Scholar] [CrossRef]
- Bergonzi, K.M.; Burns-Yocum, T.M.; Bumstead, J.R.; Buckley, E.M.; Mannion, P.C.; Tracy, C.H.; Mennerick, E.; Ferradal, S.L.; Dehghani, H.; Eggebrecht, A.T.; et al. Lightweight sCMOS-Based High-Density Diffuse Optical Tomography. Neurophotonics 2018, 5, 1. [Google Scholar] [CrossRef]
- Abdelnour, F.; Genovese, C.; Huppert, T. Hierarchical Bayesian Regularization of Reconstructions for Diffuse Optical Tomography Using Multiple Priors. Biomed. Opt. Express 2010, 1, 1084. [Google Scholar] [CrossRef]
- Okawa, S.; Hoshi, Y. A Review of Image Reconstruction Algorithms for Diffuse Optical Tomography. Appl. Sci. 2023, 13, 5016. [Google Scholar] [CrossRef]
- Arridge, S.; Hebden, J. Optical Imaging in Medicine 2. Modelling and Reconstruction. Phys. Med. Biol. 1997, 42, 841–853. [Google Scholar] [CrossRef] [PubMed]
- Arridge, S. Optical Tomography in Medical Imaging. Inverse Probl. 1999, 15, R41–R93. [Google Scholar] [CrossRef]
- Arridge, S. Methods in Diffuse Optical Imaging. Philos. Trans. R. Soc. A-Math. Phys. Eng. Sci. 2011, 369, 4558–4576. [Google Scholar] [CrossRef] [PubMed]
- Dehghani, H.; White, B.R.; Zeff, B.W.; Tizzard, A.; Culver, J.P. Depth Sensitivity and Image Reconstruction Analysis of Dense Imaging Arrays for Mapping Brain Function with Diffuse Optical Tomography. Appl. Opt. 2009, 48, D137. [Google Scholar] [CrossRef]
- Klose, A. The Forward and Inverse Problem in Tissue Optics Based on the Radiative Transfer Equation: A Brief Review. J. Quant. Spectrosc. Radiat. Transf. 2010, 111, 1852–1853. [Google Scholar] [CrossRef]
- Schweiger, M.; Arridge, S. The Toast plus plus Software Suite for Forward and Inverse Modeling in Optical Tomography. J. Biomed. Opt. 2014, 19, 40801. [Google Scholar] [CrossRef]
- Tarvainen, T.; Vauhkonen, M.; Kolehmainen, V.; Kaipio, J. Finite Element Model for the Coupled Radiative Transfer Equation and Diffusion Approximation. Int. J. Numer. Methods Eng. 2006, 65, 383–405. [Google Scholar] [CrossRef]
- Dehghani, H.; Eames, M.; Yalavarthy, P.; Davis, S.; Srinivasan, S.; Carpenter, C.; Pogue, B.; Paulsen, K. Near Infrared Optical Tomography Using NIRFAST: Algorithm for Numerical Model and Image Reconstruction. Commun. Numer. Methods Eng. 2009, 25, 711–732. [Google Scholar] [CrossRef]
- Boas, D. A Fundamental Limitation of Linearized Algorithms for Diffuse Optical Tomography. Opt. Express 1997, 1, 404–413. [Google Scholar] [CrossRef]
- Machida, M. Numerical Algorithms of the Radiative Transport Equation Using Rotated Reference Frames for Optical Tomography with Structured Illumination. J. Quant. Spectrosc. Radiat. Transf. 2019, 234, 124–138. [Google Scholar] [CrossRef]
- Tarvainen, T.; Cox, B.; Kaipio, J.; Arridge, S. Reconstructing Absorption and Scattering Distributions in Quantitative Photoacoustic Tomography. Inverse Probl. 2012, 28, 84009. [Google Scholar] [CrossRef]
- Eggebrecht, A.T.; Ferradal, S.L.; Robichaux-Viehoever, A.; Hassanpour, M.S.; Dehghani, H.; Snyder, A.Z.; Hershey, T.; Culver, J.P. Mapping Distributed Brain Function and Networks with Diffuse Optical Tomography. Nat. Photon 2014, 8, 448–454. [Google Scholar] [CrossRef] [PubMed]
- Yamashita, O.; Shimokawa, T.; Kosaka, T.; Amita, T.; Inoue, Y.; Sato, M. Hierarchical Bayesian model for diffuse optical tomography of the human brain: Human experimental study. J. Adv. Comput. Intell. Intell. Inform. 2014, 18, 1026–1033. [Google Scholar] [CrossRef]
- Lee, O.; Ye, J.C. Joint Sparsity-Driven Non-Iterative Simultaneous Reconstruction of Absorption and Scattering in Diffuse Optical Tomography. Opt. Express 2013, 21, 26589. [Google Scholar] [CrossRef]
- Hayakawa, C.; Spanier, J.; Bevilacqua, F.; Dunn, A.; You, J.; Tromberg, B.; Venugopalan, V. Perturbation Monte Carlo Methods to Solve Inverse Photon Migration Problems in Heterogeneous Tissues. Opt. Lett. 2001, 26, 1335–1337. [Google Scholar] [CrossRef] [PubMed]
- Arridge, S.; Schweiger, M. A Gradient-Based Optimisation Scheme for Optical Tomography. Opt. Express 1998, 2, 213–226. [Google Scholar] [CrossRef]
- Tarvainen, T.; Vauhkonen, M.; Arridge, S. Gauss-Newton Reconstruction Method for Optical Tomography Using the Finite Element Solution of the Radiative Transfer Equation. J. Quant. Spectrosc. Radiat. Transf. 2008, 109, 2767–2778. [Google Scholar] [CrossRef]
- Ferradal, S.L.; Liao, S.M.; Eggebrecht, A.T.; Shimony, J.S.; Inder, T.E.; Culver, J.P.; Smyser, C.D. Functional Imaging of the Developing Brain at the Bedside Using Diffuse Optical Tomography. Cereb. Cortex 2016, 26, 1558–1568. [Google Scholar] [CrossRef]
- Liao, S.M. High-Density Diffuse Optical Tomography of Term Infant Visual Cortex in the Nursery. J. Biomed. Opt 2012, 17, 81414. [Google Scholar] [CrossRef]
- Chalia, M.; Dempsey, L.A.; Cooper, R.J.; Lee, C.-W.; Gibson, A.P.; Hebden, J.C.; Austin, T. Diffuse Optical Tomography for the Detection of Perinatal Stroke at the Cot Side: A Pilot Study. Pediatr Res 2019, 85, 1001–1007. [Google Scholar] [CrossRef]
- Singh, H.; Cooper, R.J.; Wai Lee, C.; Dempsey, L.; Edwards, A.; Brigadoi, S.; Airantzis, D.; Everdell, N.; Michell, A.; Holder, D.; et al. Mapping Cortical Haemodynamics during Neonatal Seizures Using Diffuse Optical Tomography: A Case Study. NeuroImage: Clin. 2014, 5, 256–265. [Google Scholar] [CrossRef]
- Uchitel, J.; Blanco, B.; Collins-Jones, L.; Edwards, A.; Porter, E.; Pammenter, K.; Hebden, J.; Cooper, R.J.; Austin, T. Cot-Side Imaging of Functional Connectivity in the Developing Brain during Sleep Using Wearable High-Density Diffuse Optical Tomography. NeuroImage 2023, 265, 119784. [Google Scholar] [CrossRef]
- White, B.R.; Liao, S.M.; Ferradal, S.L.; Inder, T.E.; Culver, J.P. Bedside Optical Imaging of Occipital Resting-State Functional Connectivity in Neonates. NeuroImage 2012, 59, 2529–2538. [Google Scholar] [CrossRef]
- Shekhar, S.; Maria, A.; Kotilahti, K.; Huotilainen, M.; Heiskala, J.; Tuulari, J.J.; Hirvi, P.; Karlsson, L.; Karlsson, H.; Nissilä, I. Hemodynamic Responses to Emotional Speech in Two-Month-Old Infants Imaged Using Diffuse Optical Tomography. Sci Rep 2019, 9, 4745. [Google Scholar] [CrossRef] [PubMed]
- Maria, A.; Nissilä, I.; Shekhar, S.; Kotilahti, K.; Tuulari, J.J.; Hirvi, P.; Huotilainen, M.; Heiskala, J.; Karlsson, L.; Karlsson, H. Relationship between Maternal Pregnancy-Related Anxiety and Infant Brain Responses to Emotional Speech—A Pilot Study. J. Affect. Disord. 2020, 262, 62–70. [Google Scholar] [CrossRef] [PubMed]
- Arun, K.M.; Smitha, K.A.; Sylaja, P.N.; Kesavadas, C. Identifying Resting-State Functional Connectivity Changes in the Motor Cortex Using fNIRS During Recovery from Stroke. Brain Topogr 2020, 33, 710–719. [Google Scholar] [CrossRef] [PubMed]
- Chen, S.; Mao, M.; Zhu, G.; Chen, Y.; Qiu, Y.; Ye, B.; Xu, D. Cortical Activity in Patients with High-Functioning Ischemic Stroke during the Purdue Pegboard Test: Insights into Bimanual Coordinated Fine Motor Skills with Functional near-Infrared Spectroscopy. Neural Regen. Res. 2024, 19, 1098–1104. [Google Scholar] [CrossRef]
- Dai, X.; Zhang, T.; Yang, H.; Tang, J.; Carney, P.R.; Jiang, H. Fast Noninvasive Functional Diffuse Optical Tomography for Brain Imaging. J. Biophotonics 2018, 11, e201600267. [Google Scholar] [CrossRef]
- Jiang, S.; Huang, J.; Yang, H.; Czuma, R.; Farley, L.; Cohen-Oram, A.; Hartney, K.; Chechotka, K.; Kozel, F.A.; Jiang, H. Diffuse Optical Tomography for Mapping Cerebral Hemodynamics and Functional Connectivity in Delirium. Alzheimer’s Dement. 2024, 20, alz.13827. [Google Scholar] [CrossRef]
- Yang, D.; Svoboda, A.M.; George, T.G.; Mansfield, P.K.; Wheelock, M.D.; Schroeder, M.L.; Rafferty, S.M.; Sherafati, A.; Tripathy, K.; Burns-Yocum, T.; et al. Mapping Neural Correlates of Biological Motion Perception in Autistic Children Using High-Density Diffuse Optical Tomography. Mol. Autism 2024, 15, 35. [Google Scholar] [CrossRef]
- Jiang, S.; Huang, J.; Yang, H.; Wagoner, R.; Kozel, F.A.; Currier, G.; Jiang, H. Neuroimaging of Depression with Diffuse Optical Tomography during Repetitive Transcranial Magnetic Stimulation. Sci Rep 2021, 11, 7328. [Google Scholar] [CrossRef] [PubMed]
- Markham, J.; White, B.R.; Zeff, B.W.; Culver, J.P. Blind Identification of Evoked Human Brain Activity with Independent Component Analysis of Optical Data. Hum. Brain Mapp. 2009, 30, 2382–2392. [Google Scholar] [CrossRef] [PubMed]
- White, B.R.; Culver, J.P. Phase-Encoded Retinotopy as an Evaluation of Diffuse Optical Neuroimaging. NeuroImage 2010, 49, 568–577. [Google Scholar] [CrossRef] [PubMed]
- Hassanpour, M.S.; White, B.R.; Eggebrecht, A.T.; Ferradal, S.L.; Snyder, A.Z.; Culver, J.P. Statistical Analysis of High Density Diffuse Optical Tomography. NeuroImage 2014, 85, 104–116. [Google Scholar] [CrossRef]
- Tripathy, K.; Markow, Z.E.; Fishell, A.K.; Sherafati, A.; Burns-Yocum, T.M.; Schroeder, M.L.; Svoboda, A.M.; Eggebrecht, A.T.; Anastasio, M.A.; Schlaggar, B.L.; et al. Decoding Visual Information from High-Density Diffuse Optical Tomography Neuroimaging Data. NeuroImage 2021, 226, 117516. [Google Scholar] [CrossRef]
- Cao, J.; Bulger, E.; Shinn-Cunningham, B.; Grover, P.; Kainerstorfer, J.M. Diffuse Optical Tomography Spatial Prior for EEG Source Localization in Human Visual Cortex. NeuroImage 2023, 277, 120210. [Google Scholar] [CrossRef]
- Fishell, A.K.; Burns-Yocum, T.M.; Bergonzi, K.M.; Eggebrecht, A.T.; Culver, J.P. Mapping Brain Function during Naturalistic Viewing Using High-Density Diffuse Optical Tomography. Sci Rep 2019, 9, 11115. [Google Scholar] [CrossRef]
- Fishell, A.K.; Arbeláez, A.M.; Valdés, C.P.; Burns-Yocum, T.M.; Sherafati, A.; Richter, E.J.; Torres, M.; Eggebrecht, A.T.; Smyser, C.D.; Culver, J.P. Portable, Field-Based Neuroimaging Using High-Density Diffuse Optical Tomography. NeuroImage 2020, 215, 116541. [Google Scholar] [CrossRef]
- Tripathy, K.; Fogarty, M.; Svoboda, A.M.; Schroeder, M.L.; Rafferty, S.M.; Richter, E.J.; Tracy, C.; Mansfield, P.K.; Booth, M.; Fishell, A.K.; et al. Mapping Brain Function in Adults and Young Children during Naturalistic Viewing with High-density Diffuse Optical Tomography. Hum. Brain Mapp. 2024, 45, e26684. [Google Scholar] [CrossRef]
- Huppert, T.J.; Diamond, S.G.; Boas, D.A. Direct Estimation of Evoked Hemoglobin Changes by Multimodality Fusion Imaging. J. Biomed. Opt. 2008, 13, 054031. [Google Scholar] [CrossRef]
- Lee, O.; Tak, S.; Ye, J.C. A Unified Sparse Recovery and Inference Framework for Functional Diffuse Optical Tomography Using Random Effect Model. IEEE Trans. Med. Imaging 2015, 34, 1602–1615. [Google Scholar] [CrossRef]
- Niu, H.; Khadka, S.; Tian, F.; Lin, Z.-J.; Lu, C.; Zhu, C.; Liu, H. Resting-State Functional Connectivity Assessed with Two Diffuse Optical Tomographic Systems. J. Biomed. Opt. 2011, 16, 46006. [Google Scholar] [CrossRef]
- Tian, F.; Liu, H. Depth-Compensated Diffuse Optical Tomography Enhanced by General Linear Model Analysis and an Anatomical Atlas of Human Head. NeuroImage 2014, 85, 166–180. [Google Scholar] [CrossRef] [PubMed]
- Yücel, M.A.; Huppert, T.J.; Boas, D.A.; Gagnon, L. Calibrating the BOLD Signal during a Motor Task Using an Extended Fusion Model Incorporating DOT, BOLD and ASL Data. NeuroImage 2012, 61, 1268–1276. [Google Scholar] [CrossRef]
- White, B.R.; Snyder, A.Z.; Cohen, A.L.; Petersen, S.E.; Raichle, M.E.; Schlaggar, B.L.; Culver, J.P. Resting-State Functional Connectivity in the Human Brain Revealed with Diffuse Optical Tomography. NeuroImage 2009, 47, 148–156. [Google Scholar] [CrossRef] [PubMed]
- Chitnis, D.; Cooper, R.J.; Dempsey, L.; Powell, S.; Quaggia, S.; Highton, D.; Elwell, C.; Hebden, J.C.; Everdell, N.L. Functional Imaging of the Human Brain Using a Modular, Fibre-Less, High-Density Diffuse Optical Tomography System. Biomed. Opt. Express 2016, 7, 4275. [Google Scholar] [CrossRef]
- Custo, A.; Boas, D.A.; Tsuzuki, D.; Dan, I.; Mesquita, R.; Fischl, B.; Grimson, W.E.L.; Wells, W. Anatomical Atlas-Guided Diffuse Optical Tomography of Brain Activation. NeuroImage 2010, 49, 561–567. [Google Scholar] [CrossRef]
- Jung, J.W.; Lee, O.K.; Ye, J.C. Source Localization Approach for Functional DOT Using MUSIC and FDR Control. Opt. Express 2012, 20, 6267. [Google Scholar] [CrossRef]
- Kavuri, V.C.; Lin, Z.-J.; Tian, F.; Liu, H. Sparsity Enhanced Spatial Resolution and Depth Localization in Diffuse Optical Tomography. Biomed. Opt. Express 2012, 3, 943. [Google Scholar] [CrossRef]
- Yamashita, O.; Shimokawa, T.; Aisu, R.; Amita, T.; Inoue, Y.; Sato, M. Multi-Subject and Multi-Task Experimental Validation of the Hierarchical Bayesian Diffuse Optical Tomography Algorithm. NeuroImage 2016, 135, 287–299. [Google Scholar] [CrossRef]
- Hassanpour, M.S.; Eggebrecht, A.T.; Peelle, J.E.; Culver, J.P. Mapping Effective Connectivity within Cortical Networks with Diffuse Optical Tomography. Neurophoton 2017, 4, 41402. [Google Scholar] [CrossRef]
- Sherafati, A.; Snyder, A.Z.; Eggebrecht, A.T.; Bergonzi, K.M.; Burns-Yocum, T.M.; Lugar, H.M.; Ferradal, S.L.; Robichaux-Viehoever, A.; Smyser, C.D.; Palanca, B.J.; et al. Global Motion Detection and Censoring in High-density Diffuse Optical Tomography. Hum. Brain Mapp. 2020, 41, 4093–4112. [Google Scholar] [CrossRef] [PubMed]
- Schroeder, M.L.; Sherafati, A.; Ulbrich, R.L.; Wheelock, M.D.; Svoboda, A.M.; Klein, E.D.; George, T.G.; Tripathy, K.; Culver, J.P.; Eggebrecht, A.T. Mapping Cortical Activations Underlying Covert and Overt Language Production Using High-Density Diffuse Optical Tomography. NeuroImage 2023, 276, 120190. [Google Scholar] [CrossRef]
- Becerra, L.; Harris, W.; Joseph, D.; Huppert, T.; Boas, D.A.; Borsook, D. Diffuse Optical Tomography of Pain and Tactile Stimulation: Activation in Cortical Sensory and Emotional Systems. NeuroImage 2008, 41, 252–259. [Google Scholar] [CrossRef]
- Becerra, L.; Harris, W.; Grant, M.; George, E.; Boas, D.; Borsook, D. Diffuse Optical Tomography Activation in the Somatosensory Cortex: Specific Activation by Painful vs. Non-Painful Thermal Stimuli. PLoS ONE 2009, 4, e8016. [Google Scholar] [CrossRef]
- Li, L.; Cazzell, M.; Zeng, L.; Liu, H. Are There Gender Differences in Young vs. Aging Brains under Risk Decision-Making? An Optical Brain Imaging Study. Brain Imaging Behav. 2017, 11, 1085–1098. [Google Scholar] [CrossRef]
- Zhao, H.; Brigadoi, S.; Chitnis, D.; Vita, E.D.; Castellaro, M.; Powell, S.; Everdell, N.L.; Cooper, R.J. A Wide Field-of-View, Modular, High-Density Diffuse Optical Tomography System for Minimally Constrained Three-Dimensional Functional Neuroimaging. Biomed. Opt. Express 2020, 11, 4110. [Google Scholar] [CrossRef]
- Khan, A.F.; Zhang, F.; Shou, G.; Yuan, H.; Ding, L. Transient Brain-Wide Coactivations and Structured Transitions Revealed in Hemodynamic Imaging Data. NeuroImage 2022, 260, 119460. [Google Scholar] [CrossRef]
- Wu, X.; Eggebrecht, A.T.; Ferradal, S.L.; Culver, J.P.; Dehghani, H. Evaluation of Rigid Registration Methods for Whole Head Imaging in Diffuse Optical Tomography. Neurophoton 2015, 2, 35002. [Google Scholar] [CrossRef]
- Zhang, F.; Khan, A.F.; Ding, L.; Yuan, H. Network Organization of Resting-State Cerebral Hemodynamics and Their Aliasing Contributions Measured by Functional near-Infrared Spectroscopy. J. Neural Eng. 2023, 20, 16012. [Google Scholar] [CrossRef]
- Srinivasan, S.; Acharya, D.; Butters, E.; Collins-Jones, L.; Mancini, F.; Bale, G. Subject-Specific Information Enhances Spatial Accuracy of High-Density Diffuse Optical Tomography. Front. Neuroergonomics 2024, 5, 1283290. [Google Scholar] [CrossRef]
- Aihara, T.; Shimokawa, T.; Ogawa, T.; Okada, Y.; Ishikawa, A.; Inoue, Y.; Yamashita, O. Resting-State Functional Connectivity Estimated With Hierarchical Bayesian Diffuse Optical Tomography. Front. Neurosci. 2020, 14, 32. [Google Scholar] [CrossRef]
- Hernandez-Martin, E.; Gonzalez-Mora, J.L. Diffuse Optical Tomography Using Bayesian Filtering in the Human Brain. Appl. Sci. 2020, 10, 3399. [Google Scholar] [CrossRef]
- Machado, A.; Cai, Z.; Pellegrino, G.; Marcotte, O.; Vincent, T.; Lina, J.-M.; Kobayashi, E.; Grova, C. Optimal Positioning of Optodes on the Scalp for Personalized Functional Near-Infrared Spectroscopy Investigations. J. Neurosci. Methods 2018, 309, 91–108. [Google Scholar] [CrossRef] [PubMed]
- Guo, R.; Jiang, J.; Li, Y. Learn an Index Operator by CNN for Solving Diffusive Optical Tomography: A Deep Direct Sampling Method. J. Sci. Comput. 2023, 95, 31. [Google Scholar] [CrossRef]
- Siddalingaiah, H.G.; Jagannath, R.P.K.; Prashanth, G.R. Optimal Image Reconstruction and Anomaly Detection in Diffuse Optical Tomography with Hybrid CNN-LSTM. Multimed. Tools Appl. 2024, 83, 1–23. [Google Scholar] [CrossRef]
- Mireles, M.; Xu, E.; Ragunathan, R.; Fang, Q. Medium-Adaptive Compressive Diffuse Optical Tomography. Biomed. Opt. Express 2024, 15, 5128. [Google Scholar] [CrossRef]
- Doulgerakis, M.; Eggebrecht, A.; Wojtkiewicz, S.; Culver, J.; Dehghani, H. Toward Real-Time Diffuse Optical Tomography: Accelerating Light Propagation Modeling Employing Parallel Computing on GPU and CPU. J. Biomed. Opt 2017, 22, 1. [Google Scholar] [CrossRef]
- Li, R.; Yang, D.; Fang, F.; Hong, K.-S.; Reiss, A.L.; Zhang, Y. Concurrent fNIRS and EEG for Brain Function Investigation: A Systematic, Methodology-Focused Review. Sensors 2022, 22, 5865. [Google Scholar] [CrossRef]
- Li, R.; Hosseini, H.; Saggar, M.; Balters, S.C.; Reiss, A.L. Current Opinions on the Present and Future Use of Functional Near-Infrared Spectroscopy in Psychiatry. Neurophoton. 2023, 10, 13505. [Google Scholar] [CrossRef]

Disclaimer/Publisher’s Note: The statements, opinions and data contained in all publications are solely those of the individual author(s) and contributor(s) and not of MDPI and/or the editor(s). MDPI and/or the editor(s) disclaim responsibility for any injury to people or property resulting from any ideas, methods, instructions or products referred to in the content. |
© 2025 by the authors. Licensee MDPI, Basel, Switzerland. This article is an open access article distributed under the terms and conditions of the Creative Commons Attribution (CC BY) license (https://creativecommons.org/licenses/by/4.0/).
Share and Cite
Guan, S.; Li, Y.; Gao, Y.; Luo, Y.; Zhao, H.; Yang, D.; Li, R. Continuous Wave-Diffuse Optical Tomography (CW-DOT) in Human Brain Mapping: A Review. Sensors 2025, 25, 2040. https://doi.org/10.3390/s25072040
Guan S, Li Y, Gao Y, Luo Y, Zhao H, Yang D, Li R. Continuous Wave-Diffuse Optical Tomography (CW-DOT) in Human Brain Mapping: A Review. Sensors. 2025; 25(7):2040. https://doi.org/10.3390/s25072040
Chicago/Turabian StyleGuan, Shuo, Yuhang Li, Yuanyuan Gao, Yuxi Luo, Hubin Zhao, Dalin Yang, and Rihui Li. 2025. "Continuous Wave-Diffuse Optical Tomography (CW-DOT) in Human Brain Mapping: A Review" Sensors 25, no. 7: 2040. https://doi.org/10.3390/s25072040
APA StyleGuan, S., Li, Y., Gao, Y., Luo, Y., Zhao, H., Yang, D., & Li, R. (2025). Continuous Wave-Diffuse Optical Tomography (CW-DOT) in Human Brain Mapping: A Review. Sensors, 25(7), 2040. https://doi.org/10.3390/s25072040