1. Introduction
There are two methods for measuring blood pressure in human bodies: invasive and non-invasive methods. Sometimes, patients in intensive care units or operating rooms would need arterial cannulation (AC) to continuously monitor their blood pressure, nevertheless at the risk of getting infected [
1]. On the other hand, non-invasive methods of blood pressure measurement have been extensively studied. They can be categorized into continuous and non-continuous types. As we know, a non-invasive commercial blood pressure measuring device extensively adopted by the public is based on the use of the oscillometric measurement with a cuff inflated and deflated around the subject’s arm [
2,
3]. This method is not continuous and may cause inconvenience to particular patients. Many continuous blood pressure measurement methods have been studied. The photoplethysmography-based (PPG-based) device using light sources and photodiodes to detect arterial pulse waves equipped on wrists was tested on patients immediately following cardiac surgery, demonstrating maximum discrepancies of −3.3 beat/min in heart rate and 6–10 mmHg in systolic blood pressure, compared with AC measurements [
4]. PPG has been used for blood pressure measurement for several decades [
5] and recently gained popularity for wearable devices; however, it is usually used only in non-movement situations [
6,
7]. Blood pressure could also be measured by PPG with the help of the electrocardiograph (ECG) method to derive pulse transit time (PTT) that relates to blood pressure [
8,
9].
On the other hand, fiber optic solutions for the acquisition of arterial pulse waveforms have been adopted to assess the health of subjects. Fiber Bragg gratings (FBGs) were mostly used for the purpose, such as in the work of [
10,
11], which measured, respectively, the pulse waveform of carotid arteries and the waveforms of carotid and foot dorsal arteries to acquire the PTT between the carotid and foot. Also, blood pressure and heart rate were measured non-invasively by using FBG sensors by other researchers [
12,
13,
14]. These studies measured vascular pulse waveforms by detecting changes in the reflection wavelength of the FBG in order to obtain the values of blood pressure and heart rates. Additionally, in 2019, an optical method combined with a blood pressure calibration model for measuring blood pressure was provided. There, a single fiber grating was used to sense vascular pulsation signals, and a Mach–Zehnder interferometer was employed to obtain the pulsation signals of pulse waveforms. These waveforms were then processed by a blood pressure value calculation unit to determine blood pressure values [
15]. A wearable device with two sets of fiber gratings being placed on the wrist was used to measure the blood pressure. This device detected changes in wavelength and estimated blood pressure values in cooperation with a blood pressure estimation model [
16].
The works mentioned above for the acquisition of vascular pulse waveforms by using FBGs are just a few. All of them, except that of [
15], used a spectrometer to obtain the time-domain variation of the reflection wavelength (i.e., the Bragg wavelength) of the FBG in order to obtain the pulse waveforms. These detection methods used a broadband light source and acquired the shift of Bragg wavelength resulting from the vascular pulsation-induced strain by using a spectrometer. When it comes to a strain measurement, an optical power detection scheme in a proper design can calibrate the strain, as mentioned in the work of [
17,
18]. In the system of [
17], two FBGs were cascaded, wherein the optical power corresponding to the union of the reflection spectra of the two FBGs was used to calibrate the strain imposed on one FBG. In the power detection scheme in the work of [
18], the overlapped part between the reflection spectra of the two FBGs corresponded to the strain to be measured. However, the method used in [
18] would lead to a large optical loss due to the use of double 3 dB couplers for acquiring the overlapped part between the reflection spectra of the two FBGs.
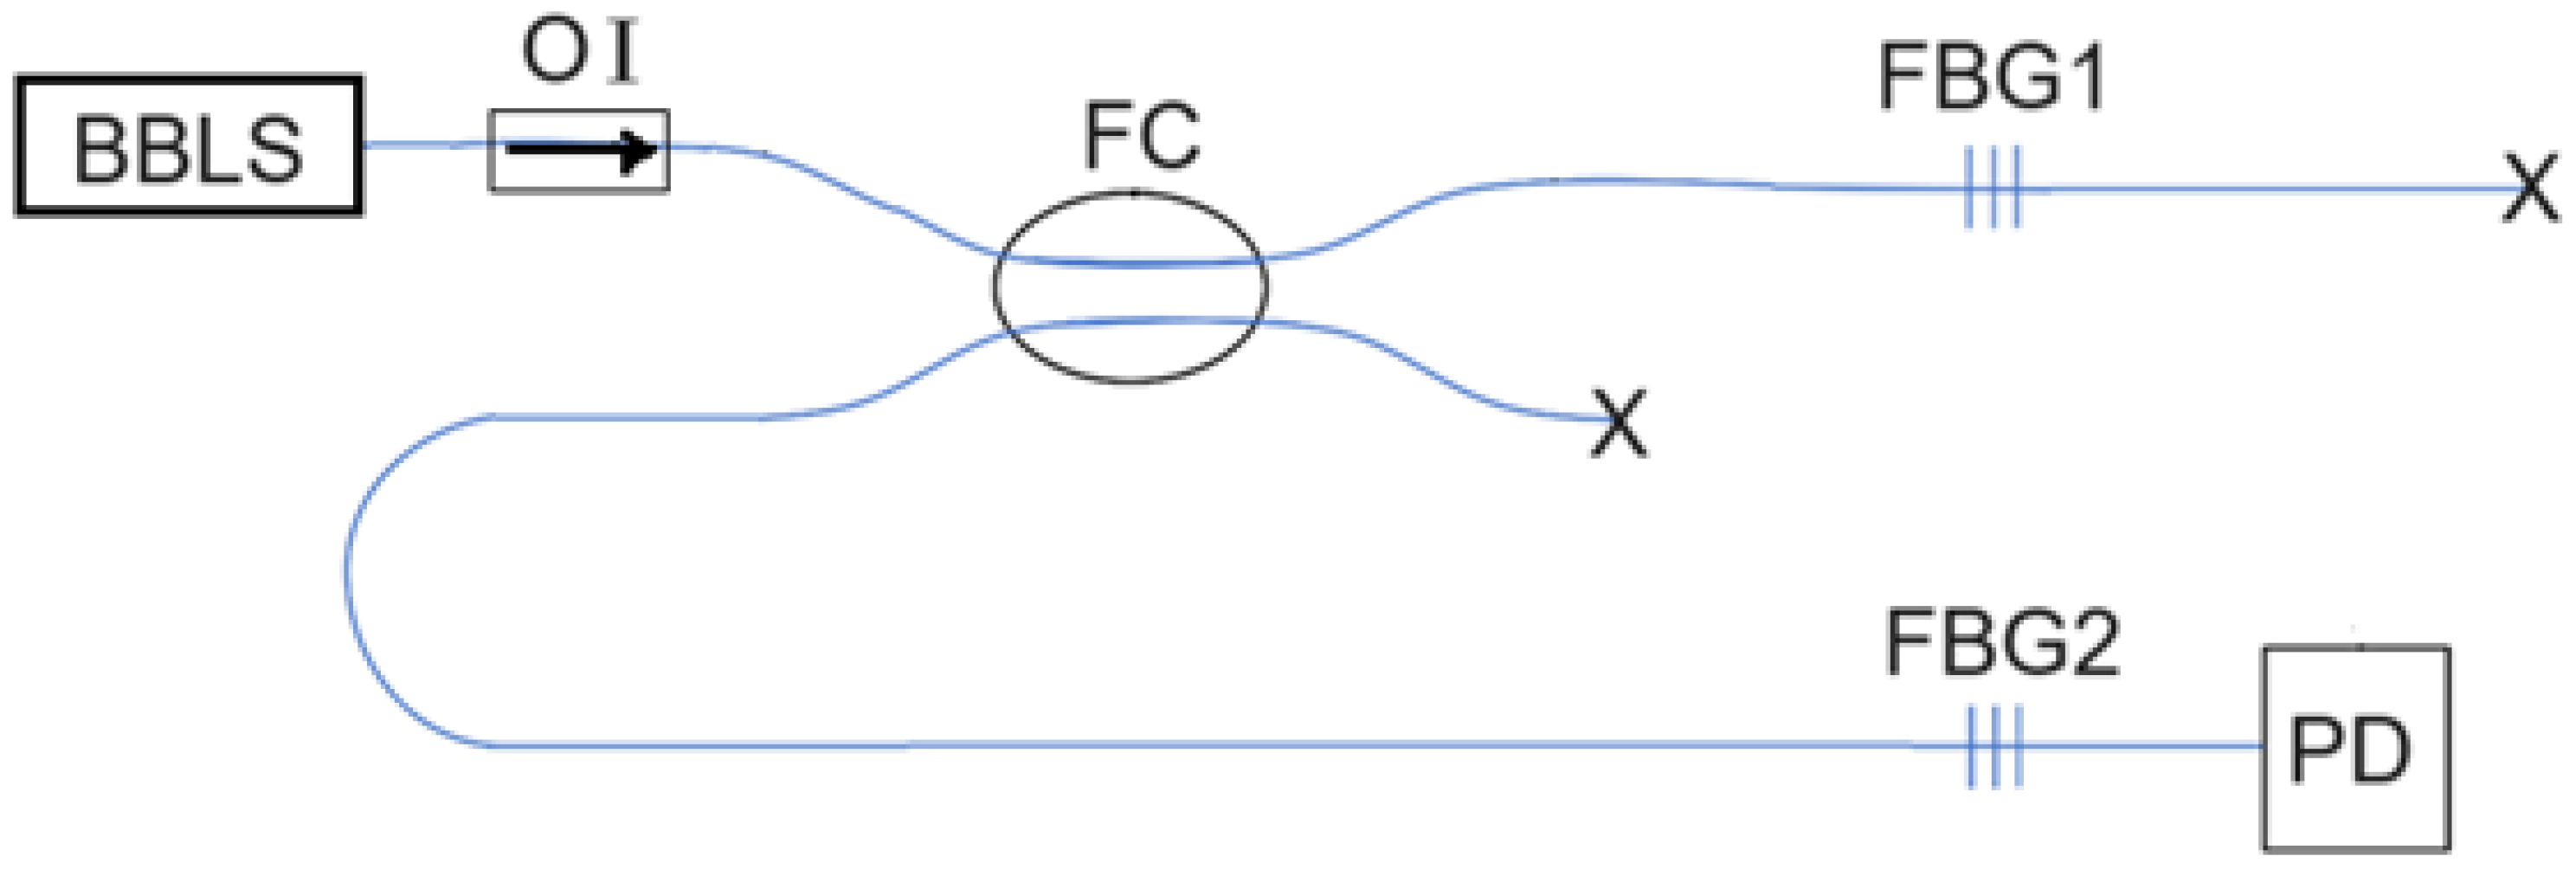
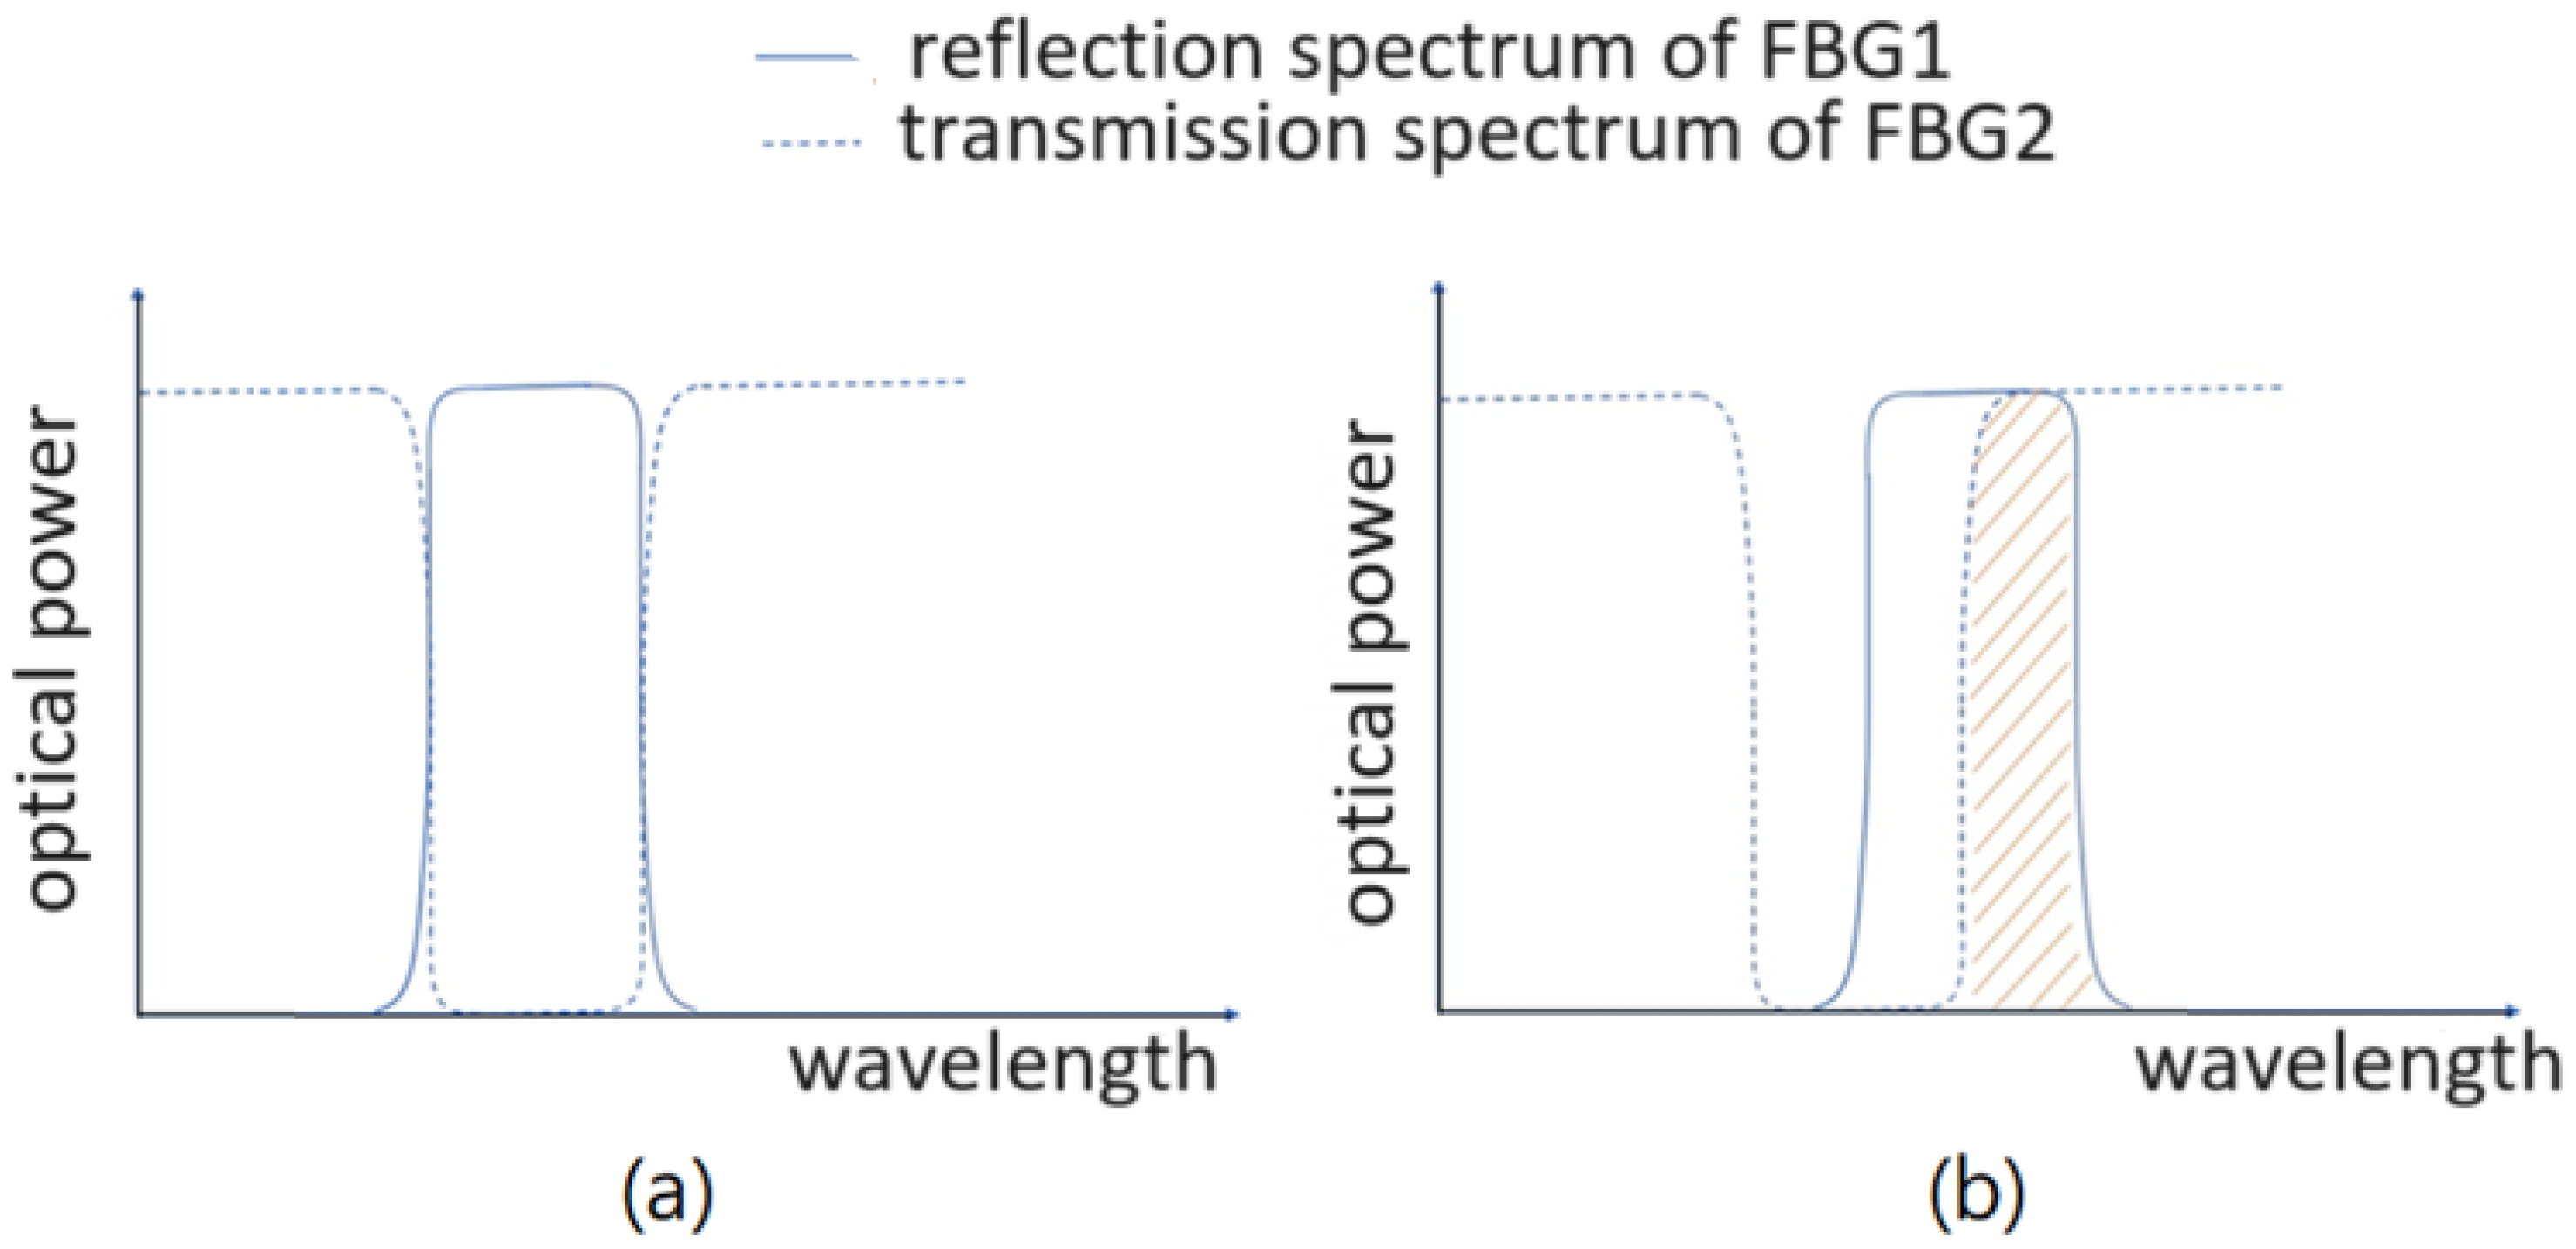
Here, in this research, we use two identical FBGs to calibrate the vascular pulsation-induced strain and accordingly acquire the pulse waveform based on a different optical power detection scheme. However, the overlapped part between the reflection spectrum of one FBG (the sensing FBG) and the transmission spectrum of the other FBG is used to obtain the optical power that depends on the vascular pulsation-induced strain. There is a difference between this optical power detection scheme and that used in the method of [
17]. When the two FBGs suffer from no vascular strain, the optical power detected would approach null by using this new detection scheme, whereas it would not with the method of [
17]. Therefore, the new detection scheme offers a more sensitive strain-sensing capability in detecting the vascular pulse.
In
Section 2, we introduce the principle of the proposed optical method for measuring vascular pulsation waveform. Blood pressure and heart rate measurements based on the dual FBG method are shown in
Section 3, and then blood pressure measurement data are demonstrated in
Section 4. In
Section 4, two different blood pressure models are used to give different results.
Section 5 concludes this work.
3. Measurement of Blood Pressure and Heart Rate
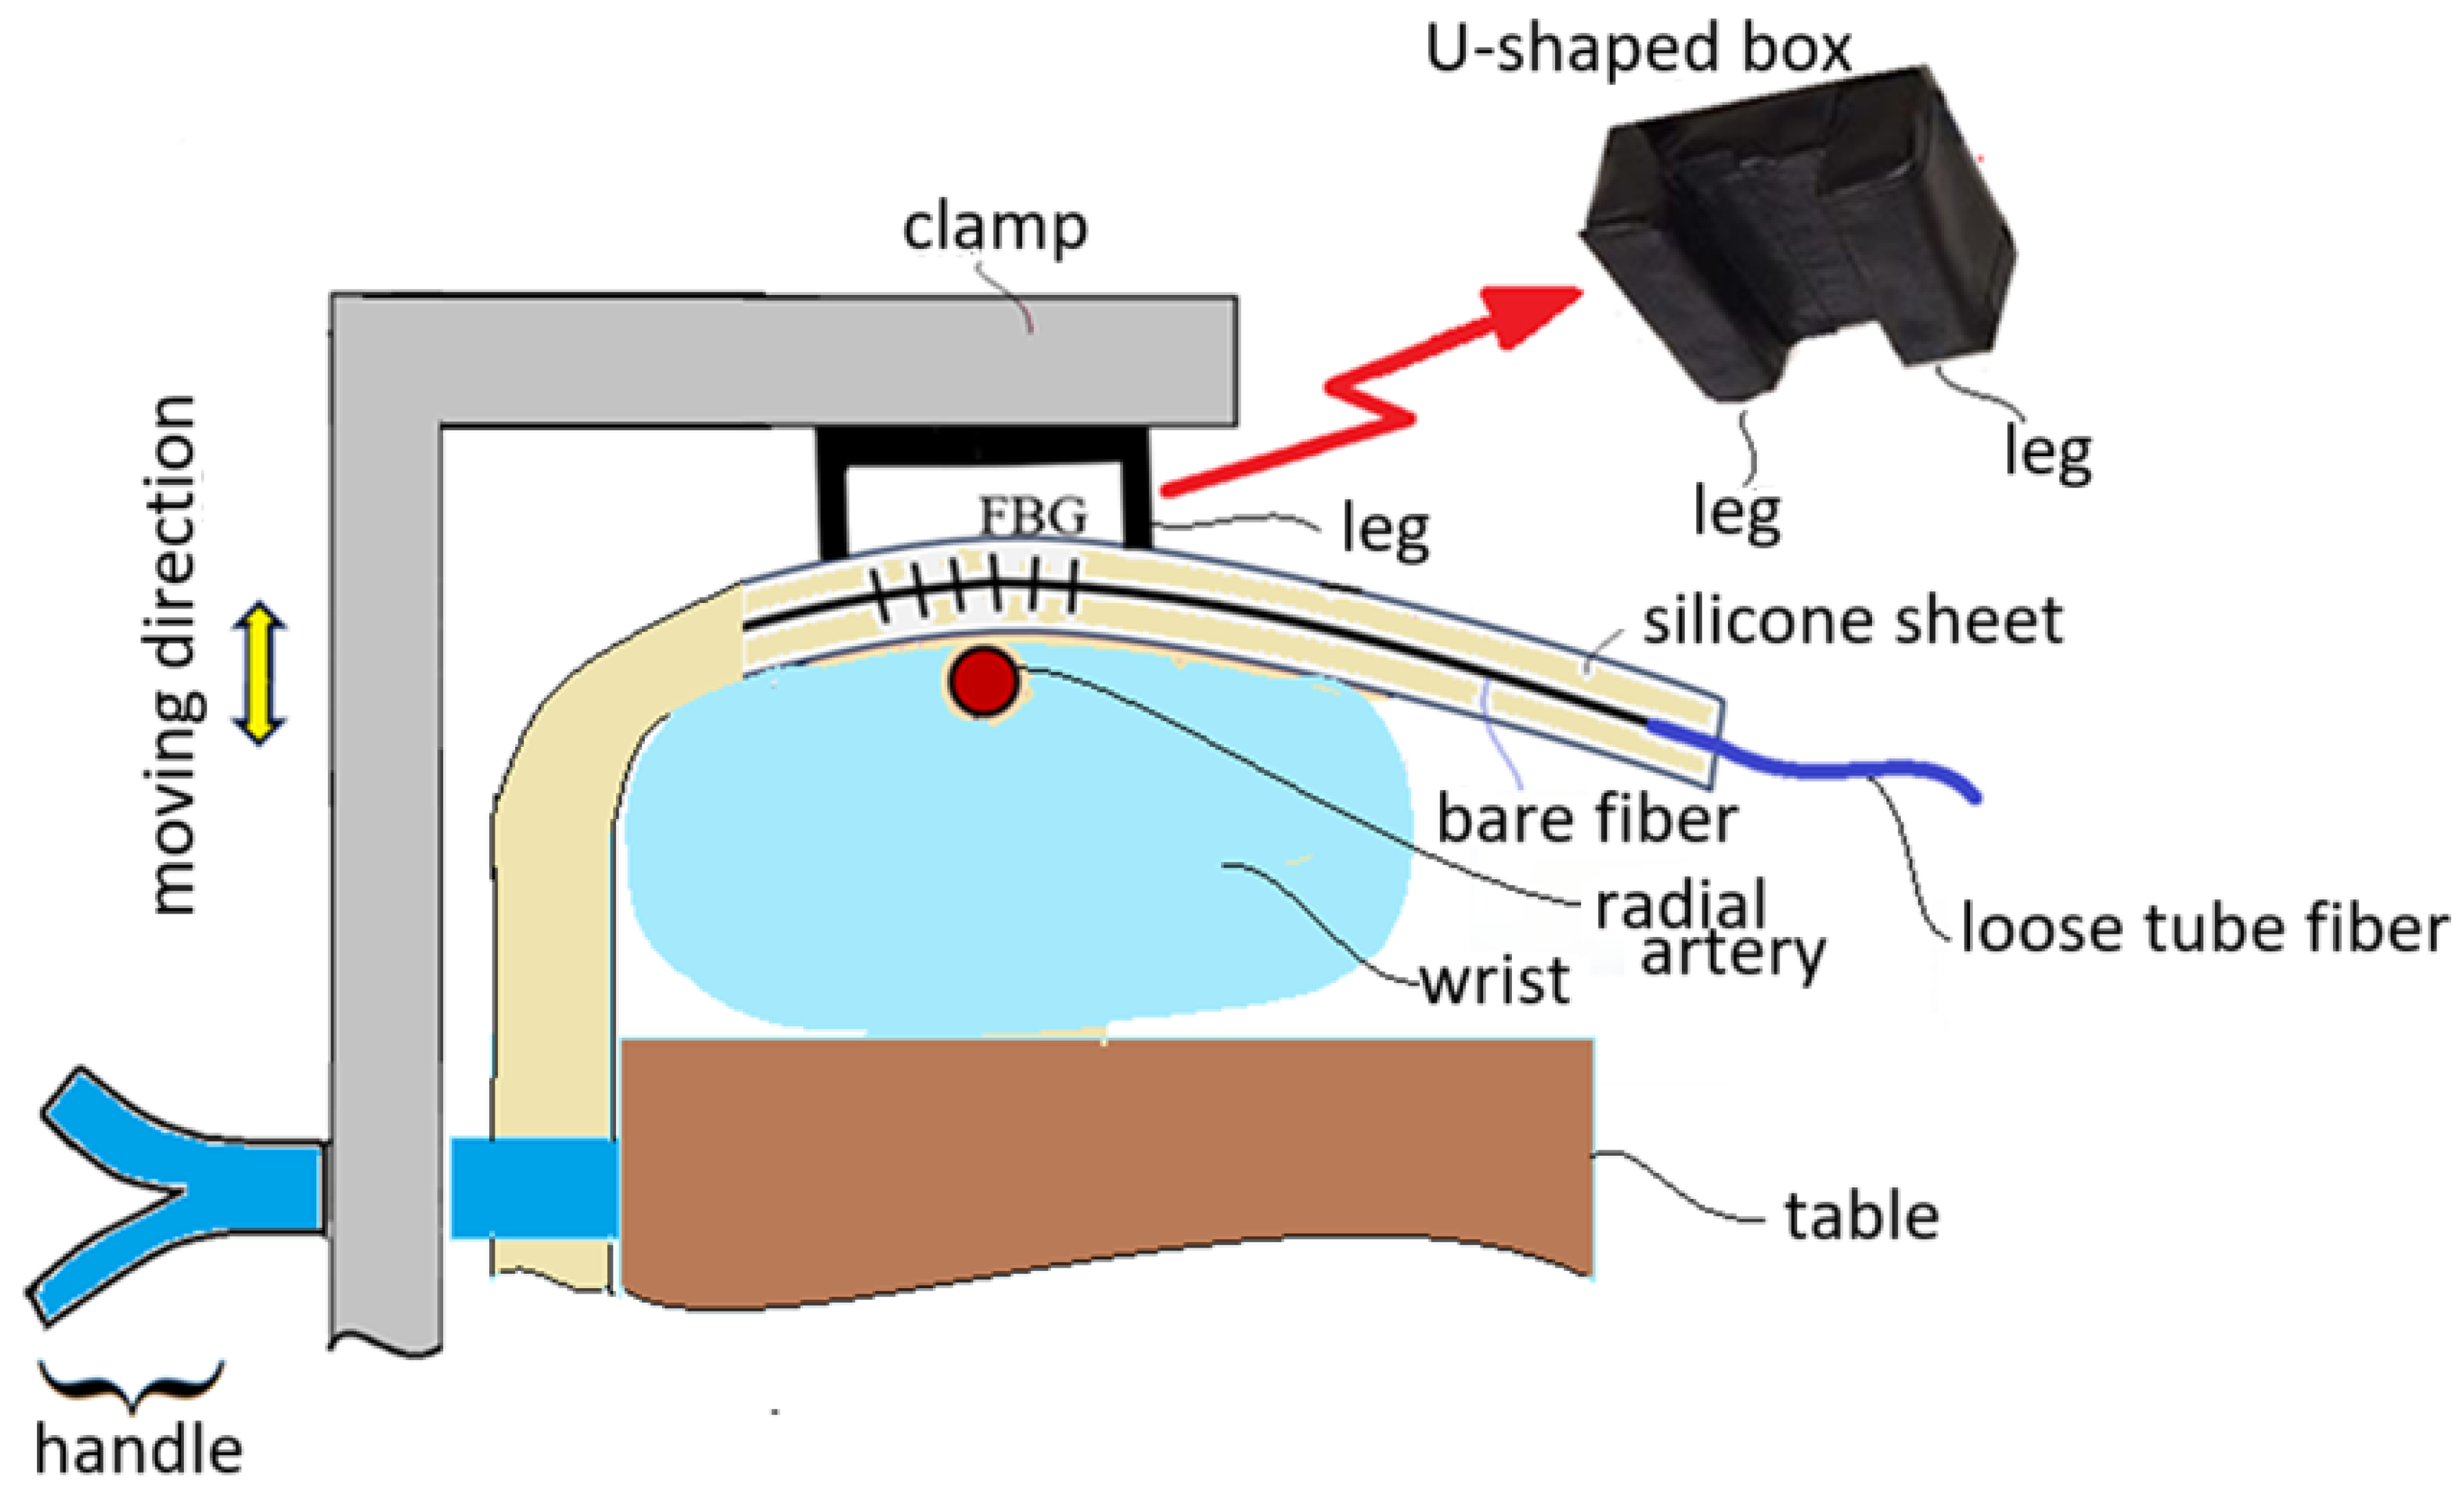
When the FBG sensor embedded inside a silicone sheet is positioned near the radial artery of a subject’s wrist, a U-shaped box is used to press the silicone sheet to not only make the silicone sheet closely contact with the skin of the wrist but also to enhance the vascular pulsation sensing capability. The U-shaped box is pressed by a clamp to make its legs tightly touch the silicone sheet, as shown in
Figure 4. This figure schematically shows that the clamp can be moved up and down by controlling a handle. The wrist is put on a table and the handle touches firmly the side of the table for the clamp to move up and down. When the clamp is moved downwards to press the U-shaped box, the legs of the U-shaped box tightly touch the silicone sheet. When the clamp is moved upwards, the wrist of the subject can move out.
The arm of a subject is kept stable with the clamp shown in
Figure 4 in the measurement of blood pressure and heart rate, as shown in
Figure 5, where the handle is held and pressed to keep the arm clamped and the U-shaped box tightly touching the silicone sheet. The FBG sensor across the legs of the U-shaped box can then sense the vascular pulsation stress, and pulse waveforms are obtained at the output of the PD with the clamping scheme.
The pulse waveforms acquired by the PD are inputted to an analog-to-digital converter, and then the microcontroller ESP32 is used to sample the pulse waveform at a sample rate of 200 Hz. The sampled signals are then transferred to a computer instantaneously.
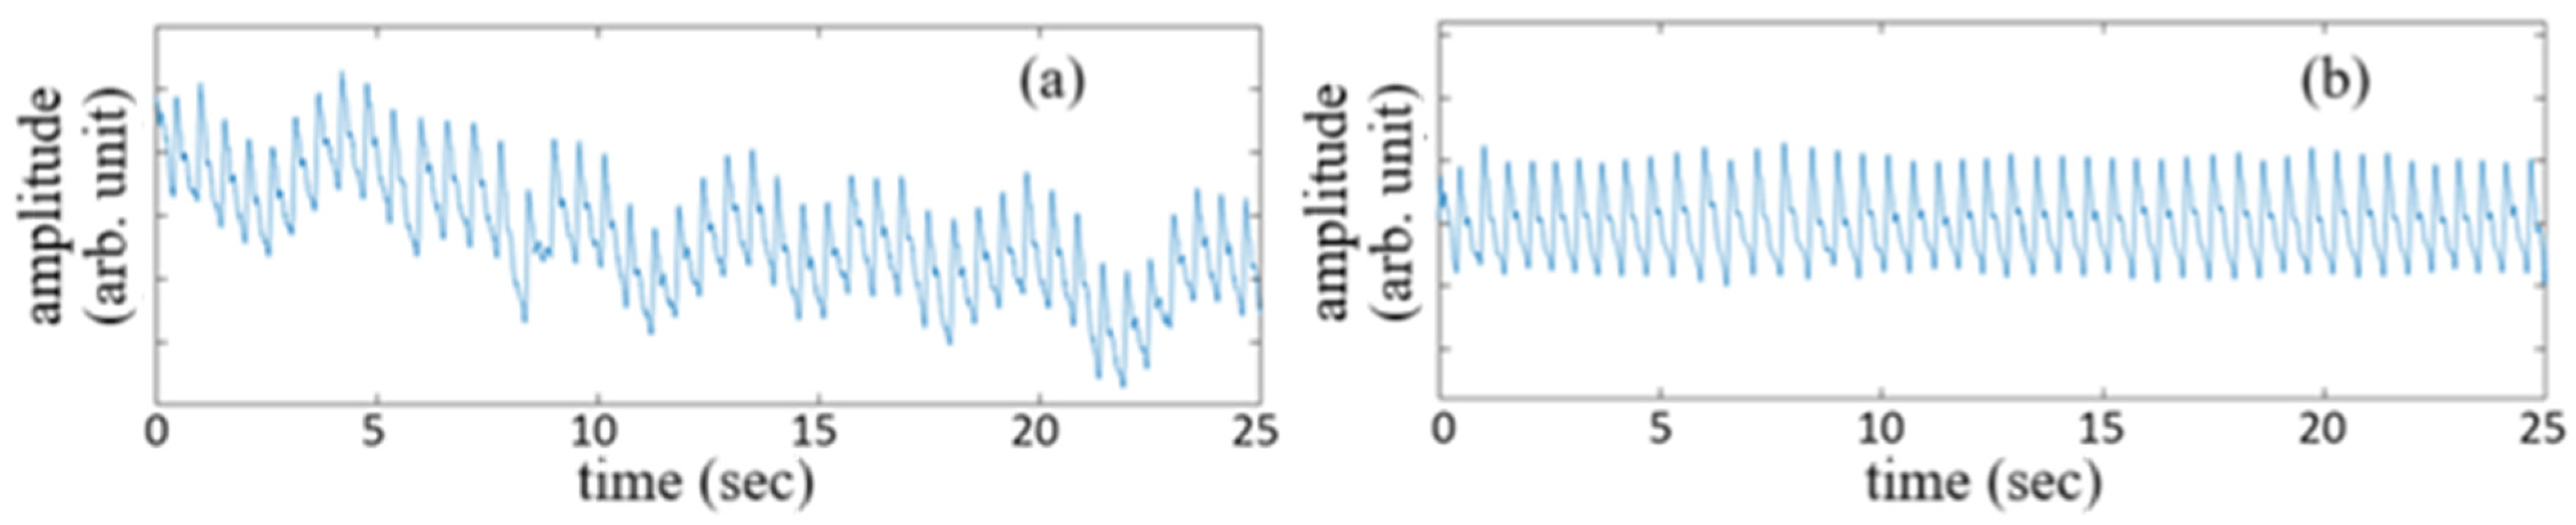
The vascular pulsation waveforms of a subject acquired for 25 sec before signal treatment and after signal treatment are shown by the traces in
Figure 6a,b, respectively. The untreated signal waveform corresponds to the detected originally by the PD, while the use of a bandpass filter with a band from 0.5 Hz to 12 Hz for the untreated signal waveform gives the vascular pulsation waveform shown in
Figure 6b.
Each pulse of the filtered signal waveform shown in
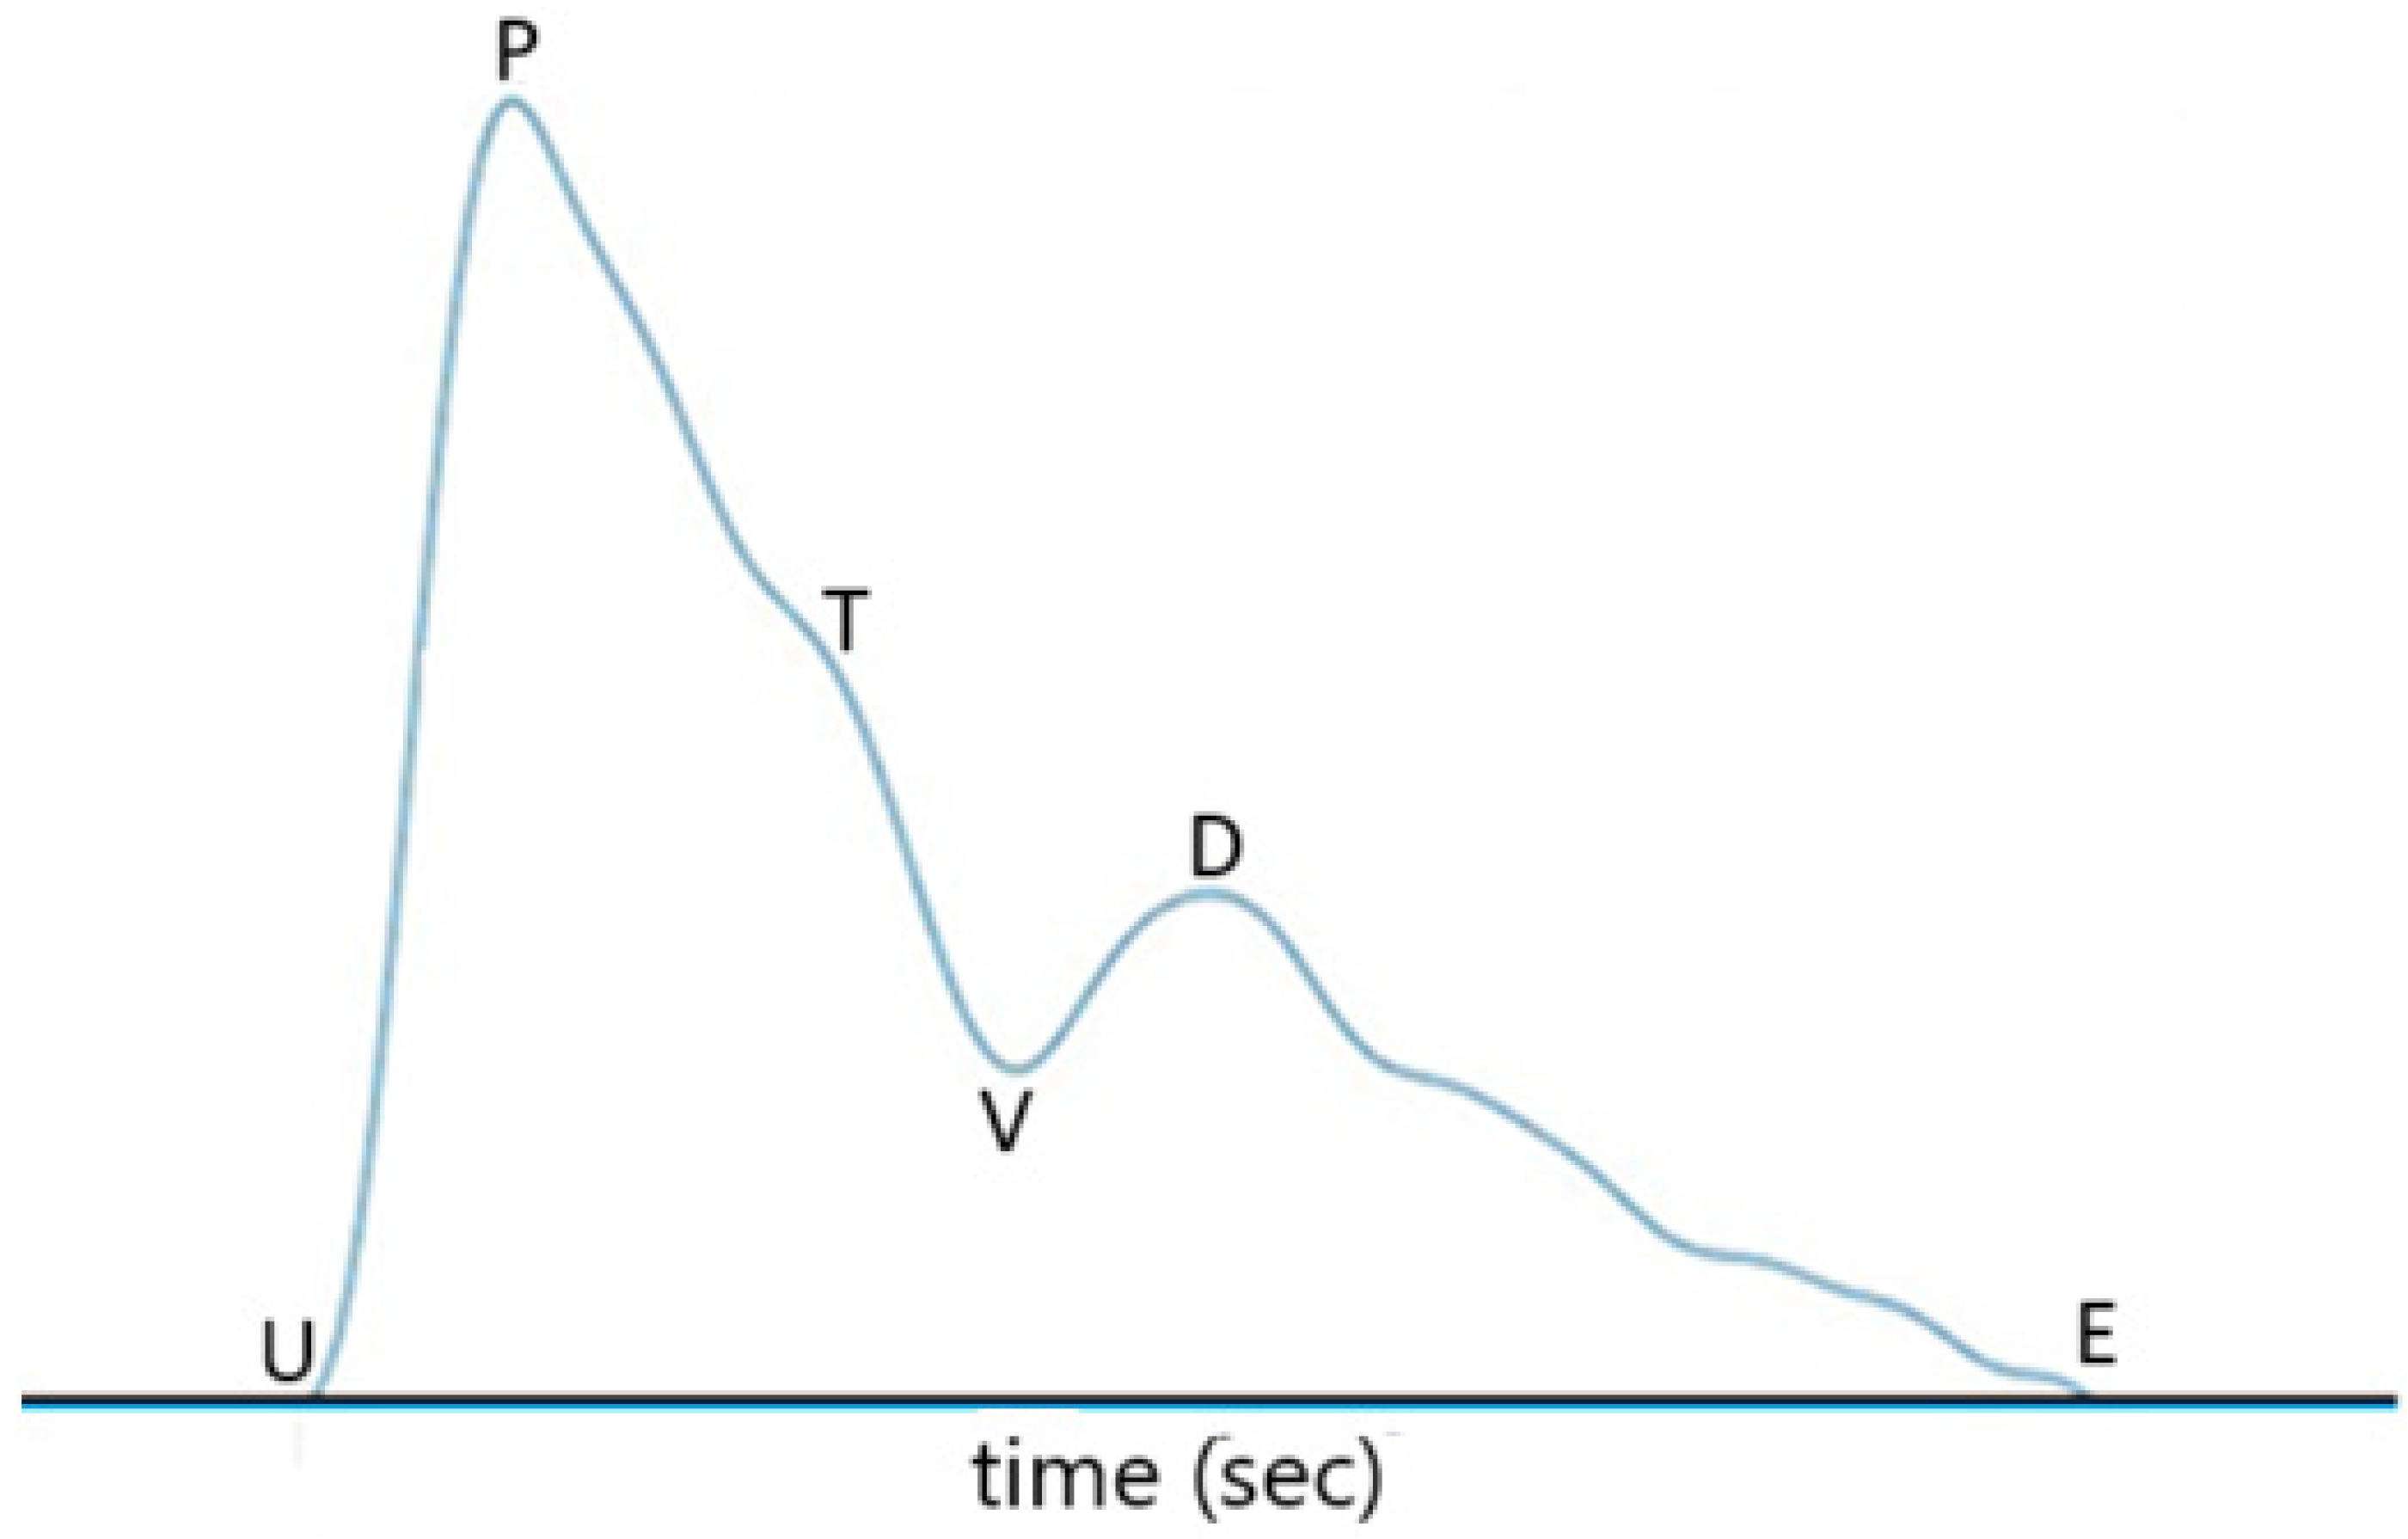
Figure 6b can be used for the estimation of blood pressure and heart rate. All of the pulses acquired during a certain time period, which is set to be 25 sec in this study, almost have the same shape as that shown in
Figure 7, where U represents the onset point for blood ejection from the left ventricle when the heart contracts, P is the peak of the percussion wave during systole, T represents the tidal wave, V is the valley of the pulse representing the beginning of diastole (i.e., the
descending wave trough point), D is the peak of the dicrotic wave, and point E represents the end of diastole. In
Figure 7, the time interval between point P and point D is defined as PTT, the same as in [
20]
. The time interval from point U to point P is defined as Pt, named by pulse ascending time herein. The time interval from point D to the end point E of the pulse waveform, which is normally the onset point of the next pulse waveform, is defined as Dt, named by pulse descending time herein. The heart rate can be obtained from the repetition rate of the filtered pulse waveform signal in Figure 6. In other words, the heart rate can be obtained from the repetition rate of point U, point P, point V, or point D of the pulse waveform.The difference between SBP and DBP is related to PTT, the density of blood, and the volume of blood in the artery, as indicated by Equation (2) of Ref. [
20]. From some experimental results, mean BP and PTT are related according to Equation (6) of Ref. [
20]. SBP and DBP are related to PTT in accordance with Equations (6)–(8) of Ref. [
20]. On the other hand, we believe that the pulse ascending time would be related to SBP because this time parameter has something to do with the time required for blood ejection from the heart. Likewise, the pulse descending time is related to the time for diastole. Therefore, in the present study, we add Pt and Dt in the BP estimation model.
Because the processed pulse waveform signal has multiple percussion wave peaks within a time period and the three time parameters PTT, Pt, and Dt provided by the pulse waveforms of these different peaks will be slightly different, it is necessary to use an averaging method to obtain these time parameters. The averaging method here is to take out the time parameter values of each pulse waveform and then average the time parameters of these pulse waveforms to give a set of definite time parameter values. Systolic blood pressure (SBP) and diastolic blood pressure (DBP) can then be calculated using the three parameters PTT, Pt, and Dt of the pulse waveform signal. Equations (1) and (2) are those we use for the calculation of systolic and diastolic blood pressures, wherein
ln is a natural logarithmic function, the values of the coefficients A, B, C, D, E, F, G, and H are obtained by using a regression method of
nonlinear least squares. In this method, vascular pulse waveforms of 29 subjects are obtained using the proposed dual-FBG power detection scheme to determine their
three parameters—PTT, Pt, and Dt—and their blood pressures (referred to as reference pressures) are
measured by the commercial blood pressure monitor OMRON model HEM-FL31 (which can also measure heart rate).
Then, the unknown coefficients A, B, C, D, E, F, G, and H of Equations (1) and (2) are determined to give the minimum discrepancy between the calculated blood pressure values (using the two equations) and the reference pressure values over all of the 29 subjects.
5. Conclusions and Discussion
We have presented a fiber-optic power-detection scheme for blood pressure and heart rate measurement, wherein dual FBGs with one embedded in a silicone sheet for protection are used to sense vascular pulsation. Pulse waveforms in accordance with vascular pulsation are obtained by detecting the optical power proportional to the overlapped area of the reflection spectrum of the sensing FBG and the transmission spectrum of the other FBG.
Two models for blood pressure estimation are used here: first, with pulse transit time considered only, and second, with the consideration of pulse transit time (PTT), pulse ascending time (Pt), and pulse descending time (Dt) in modeling the blood pressure equations. In the estimation of blood pressures of twenty-nine subjects, the first model provides mean errors of 0 mmHg (for SBP) and −0.03 mmHg (for DBP), while the second model provides mean errors of 0.72 mmHg (for SBP) and 0.83 mmHg (for DBP). The calculated values and reference values of SBP (DBP) are related with a correlation coefficient of 0.8803 (0.8566) for the first model with only pulse transit time used for modeling. However, the second model with two additional pulse parameters considered provides the correlation coefficients of SBP and DBP of 0.9339 and 0.9343, respectively, indicating that the calculated BP values and reference BP values are closer to each other for the 29 subjects, with respect to the case when only PTT is used for modeling.
The area of the slash region (spectrally overlapping region) would not change with the ambient temperature because the two FBGs were placed near each other, and, accordingly, their Bragg wavelengths shifted the same amount as the temperature varied. We have carried out an experiment of blood pressure measurement on a subject to see the effect of ambient temperature with the same measurement setup as the present work except that the silicone sheet was shorter and the U-shaped box was pressed by a strap wrapped around the wrist instead of a clamp. At room temperature (24 °C), the three temporal parameters were 0.256 s (PTT), 0.1325 s (Pt), and 0.189 s (Dt), compared with 0.259 s (PTT), 0.1304 s (Pt), and 0.193 s (Dt) obtained at 45 °C. SBP and DBP were determined by a different estimation model to be 110.3 mmHg and 79.0 mmHg at room temperature and 109.2 mmHg and 77.7 mmHg at 45 °C, in contrast to the reference values of 110 mmHg (SBP) and 78 mmHg (DBP) obtained by an OMRON commercial instrument at room temperature. It can be seen that the measurement setup was stable against temperature variation.
The work of [
21] also used only pulse transit time to model BP equations and estimated SBP and DBP both to within ±4 mmHg for 17 subjects. We have used their model to calculate the SBP and DBP of our 29 subjects using the PTT values listed in
Table 1. The calculated values of SBP and DBP for the 29 subjects relate to the reference values of their SBP and DBP not so well as those calculated values for the case when PTT, Pt, and Dt are considered for modeling.
Figure 12 shows the correlation plots of calculated BP values against reference BP values. The correlation coefficients are 0.8567 for SBP and 0.6681 for DBP. Also, it can be seen that the errors between calculated SBP (DBP) and reference SBP (DBP) for 6 (13) subjects reach above 8 mmHg. In particular, the errors reach above 11 mmHg for four subjects in the estimation of SBP and reach above 12 mmHg for five subjects in the estimation of DBP.
In [
21], the SBP and DBP followed the same forms in Equations (1) and (2) with E = F = 0; however, with different coefficient values of A, B, C, D, G, and H from those values for the first case in the presented study. Specifically, coefficients were A = 189.7, B = 23.8, C = 8.7, D = 3.0, G = 239.6, and H = 54.4 in their study. When the PTT values of the 29 subjects are put into their equations, larger errors are found compared with the results of [
21]. This situation might result from the fact that the BP model in [
21] was established for those 17 subjects who were healthy as BP is concerned (except one having 135 mmHg SBP). This established BP model might cause slight failure in predicting the BP for a group of subjects having larger BP variations.
When PTT, Pt, and Dt are used for estimation, errors with 5 mmHg are also observed for some subjects. These large errors would arise because inappropriate pulse waveforms are obtained for some reasons. If the U-shaped box is not placed in the right position, for example, one leg of it touching the silicone sheet above the sensing FBG, the pulse waveform would be distorted. On the other hand, if the clamp presses the U-shaped box and, accordingly, the wrist is too tight, the BPs would be measured incorrectly because of artery contraction. We carefully operated the test by gradually increasing the clamping force until clear pulse waveforms were obtained, thus avoiding pressing the wrist too hard. Also, the position of the sensing FBG in the silicone sheet was marked in the test to avoid misplacement of the U-shaped box. We believe that the slight error of 5 mmHg in the BP measurement with PTT, Pt, and Dt all considered in the estimation model for the 29 subjects was caused by the difference between the BPs acquired from the two hands, especially when the BPs were taken by inflation and deflation of a cuff around the right arm, in which case the blood vessel could be closed temporarily and this affect the BP measurement on the left hand.


