
Delamination Detection in CFRP Stringers with A0-Mode Lamb Wave Curvature


Abstract
1. Introduction
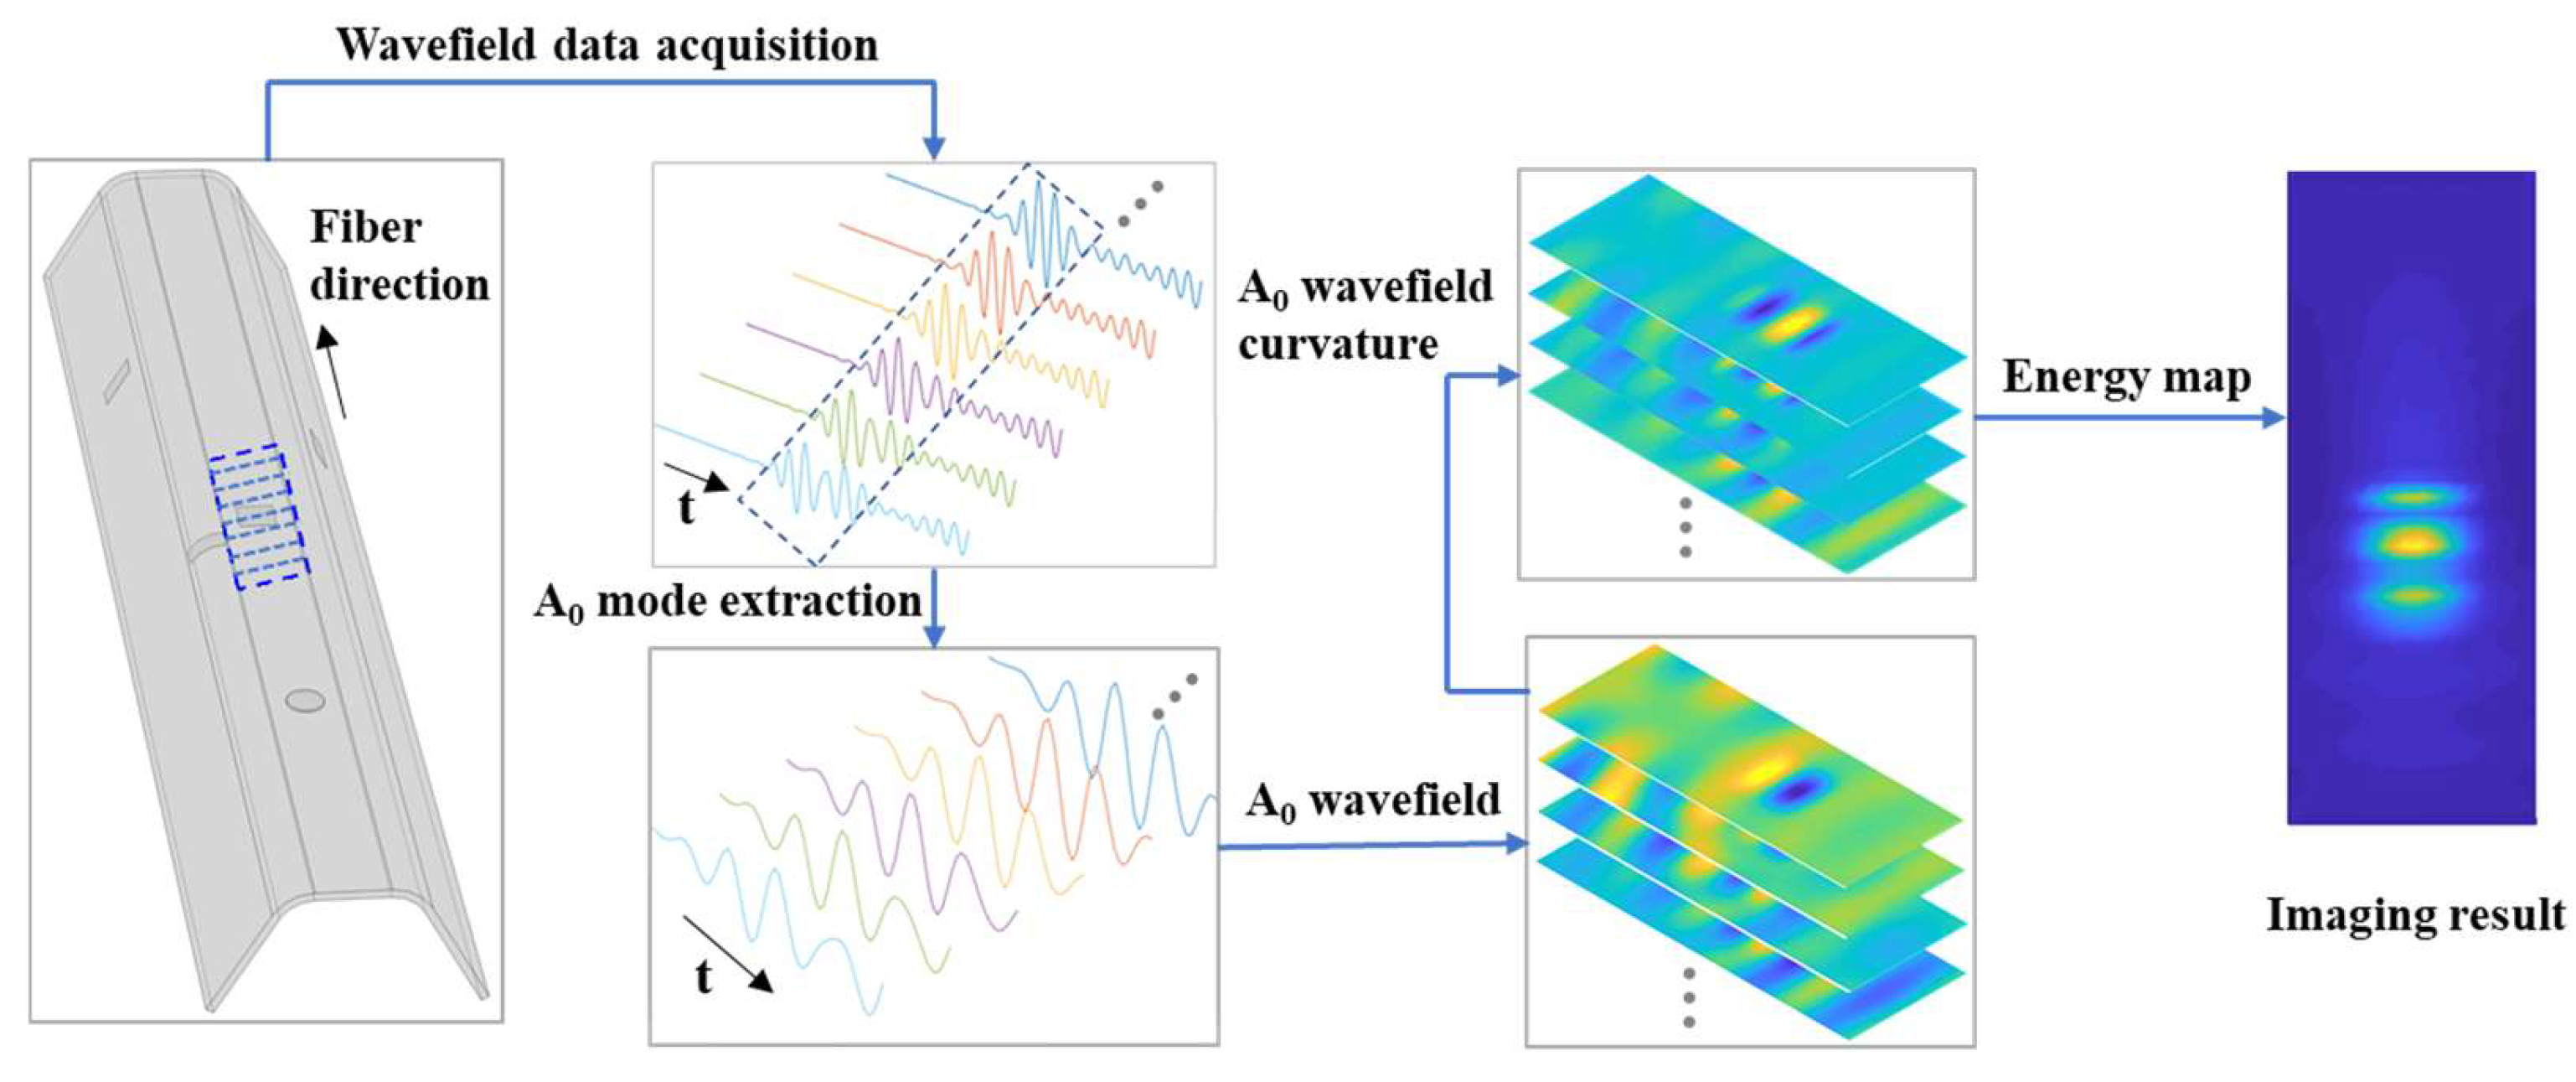
2. Imaging Method
3. Simulations
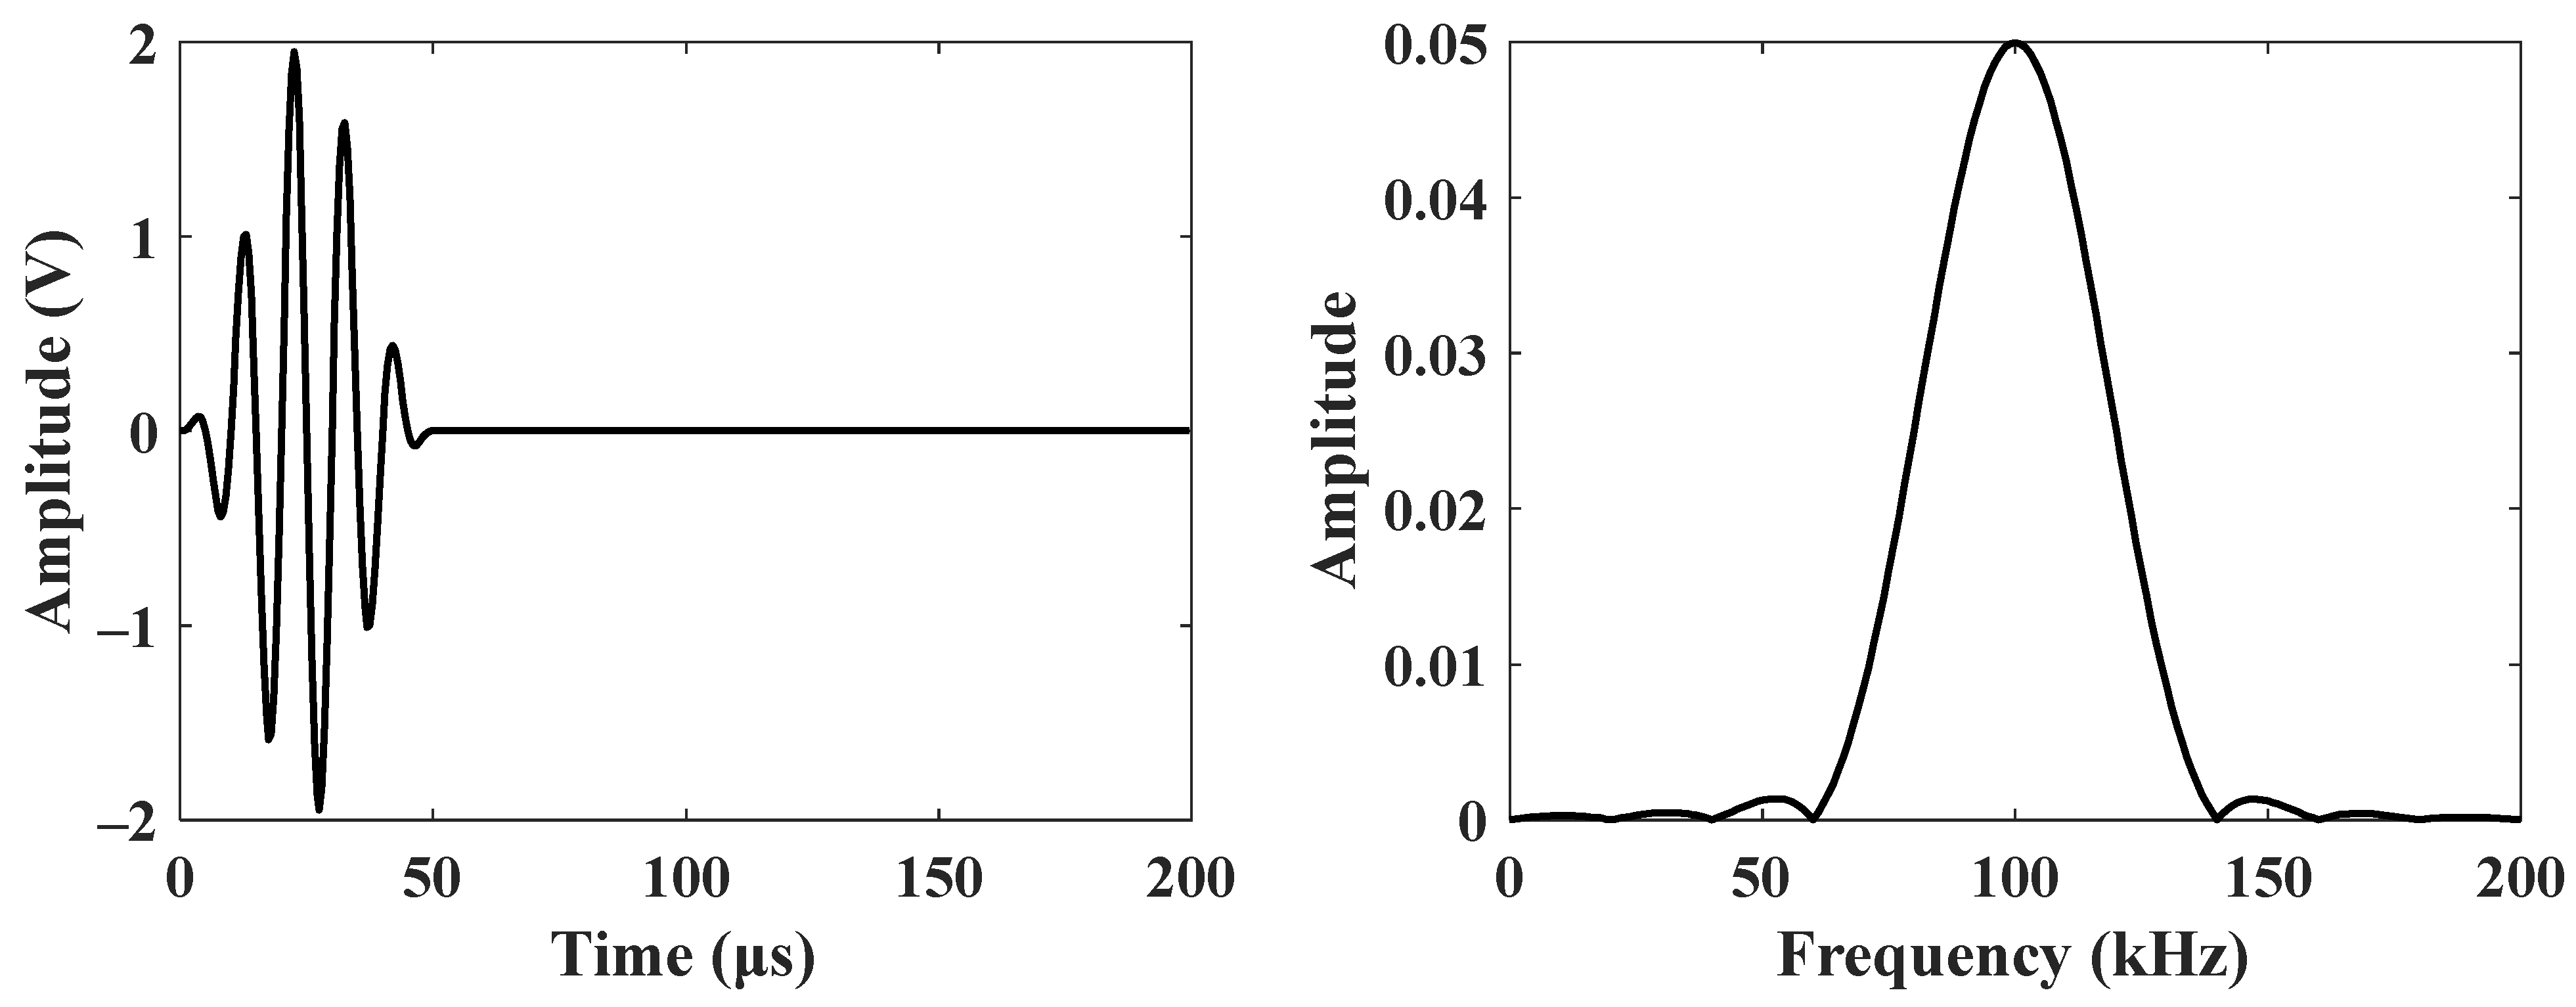
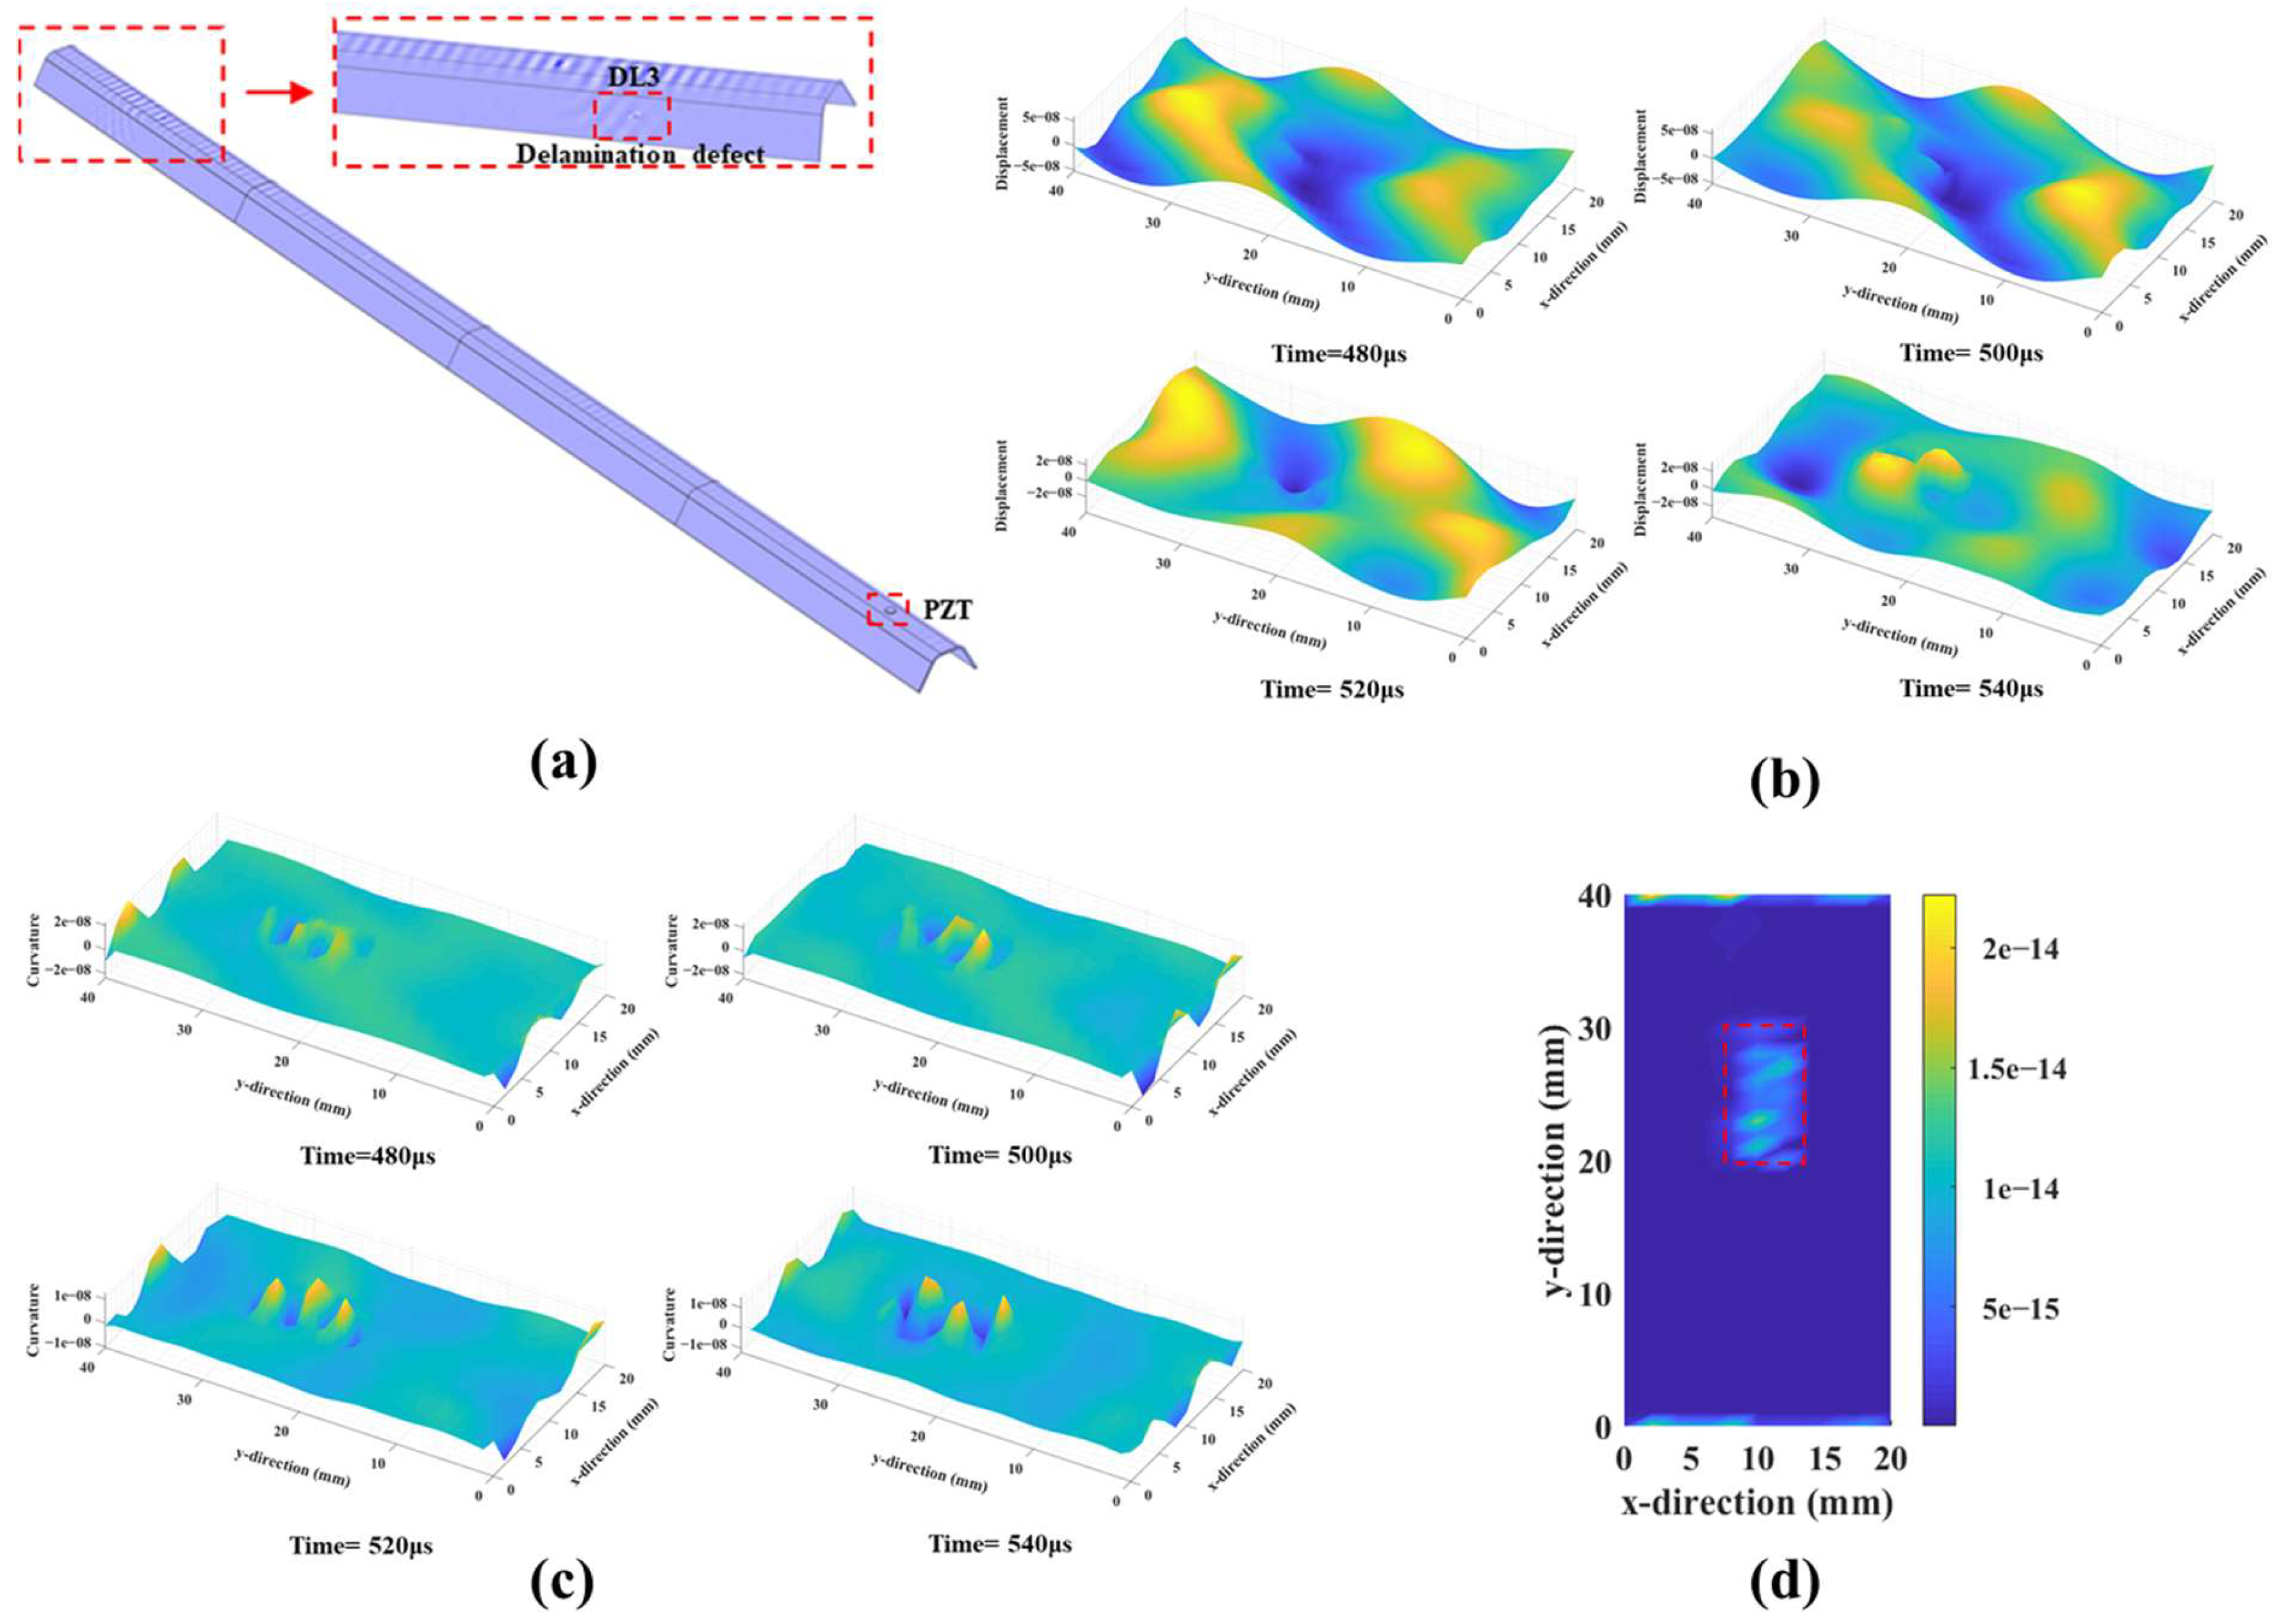
3.1. Simulation Model
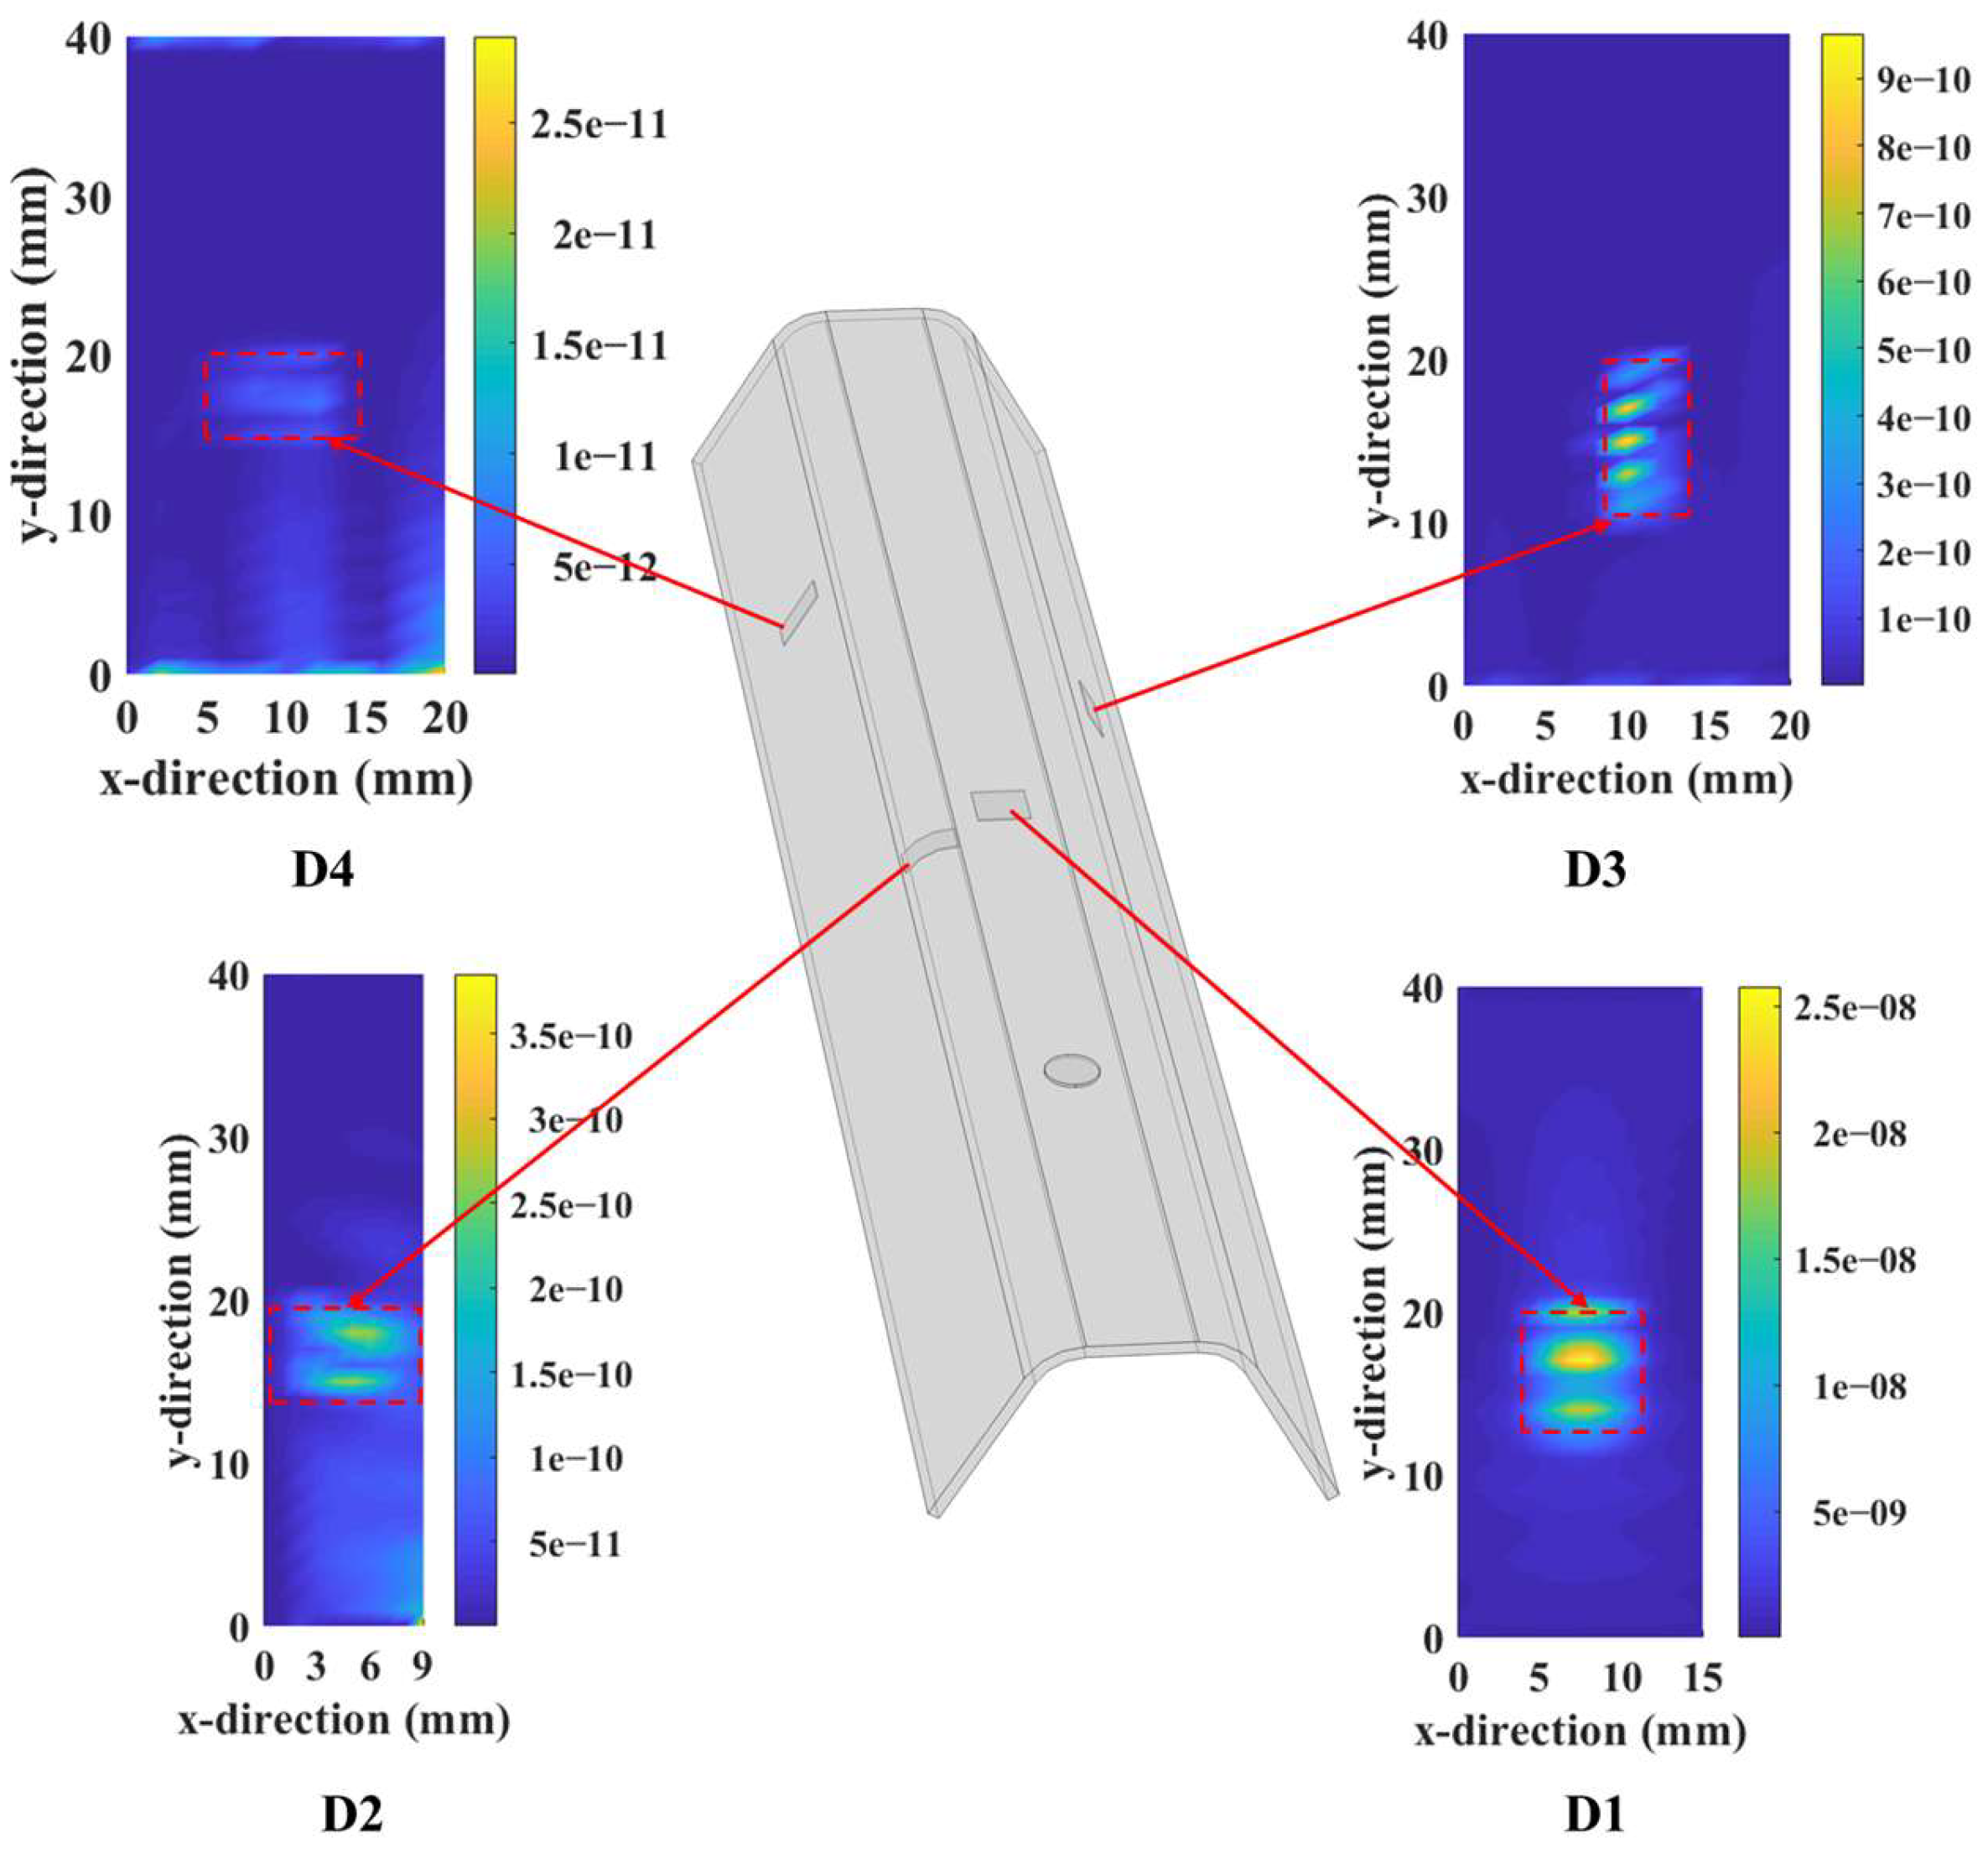
3.2. Simulation Results
4. Experiments
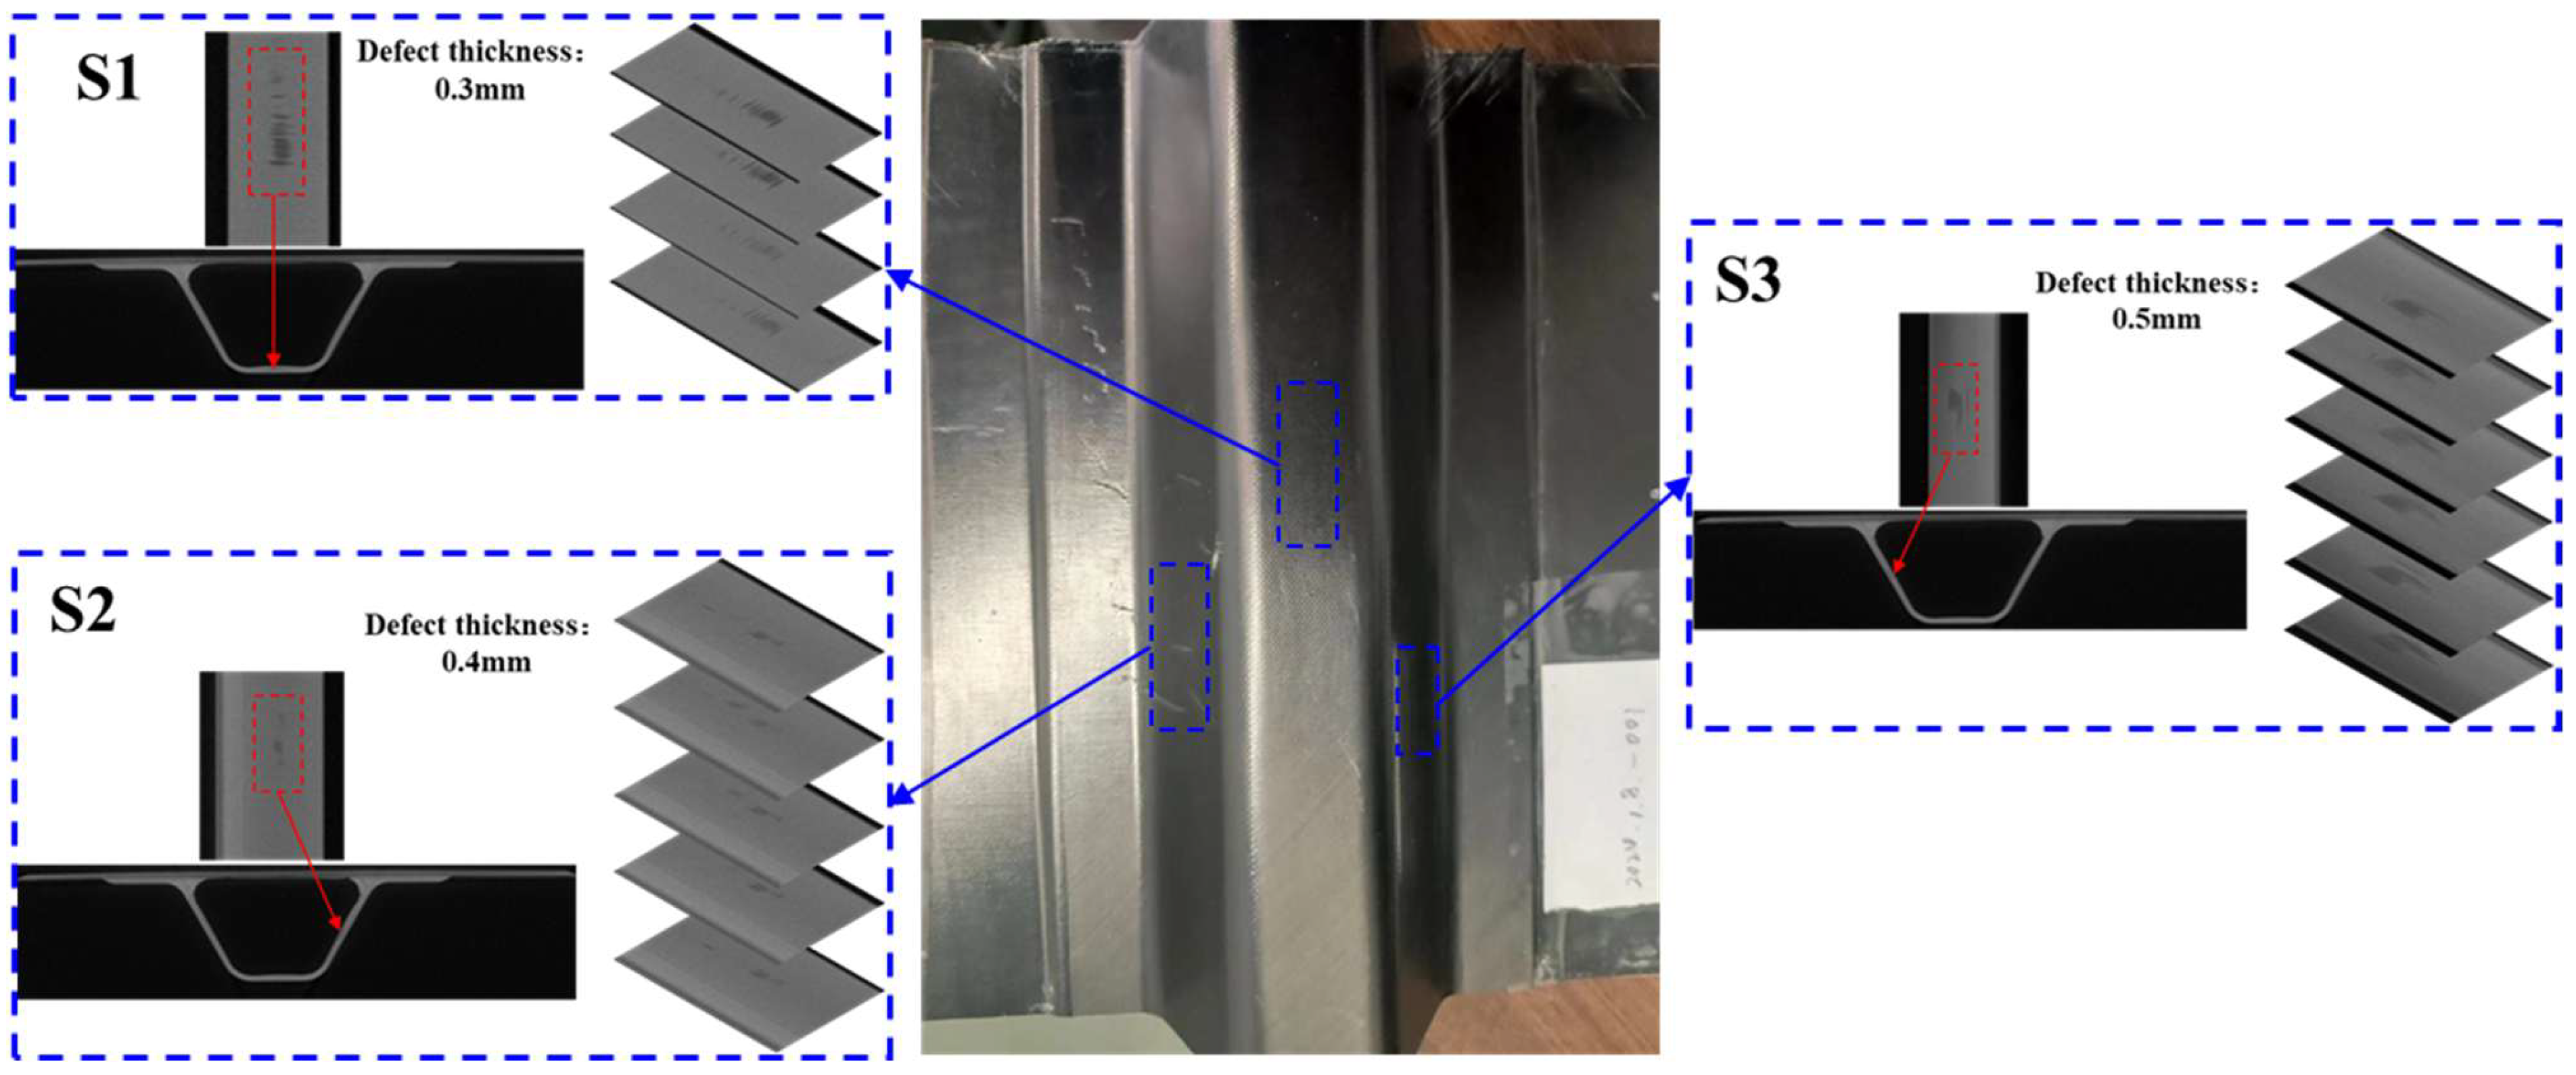
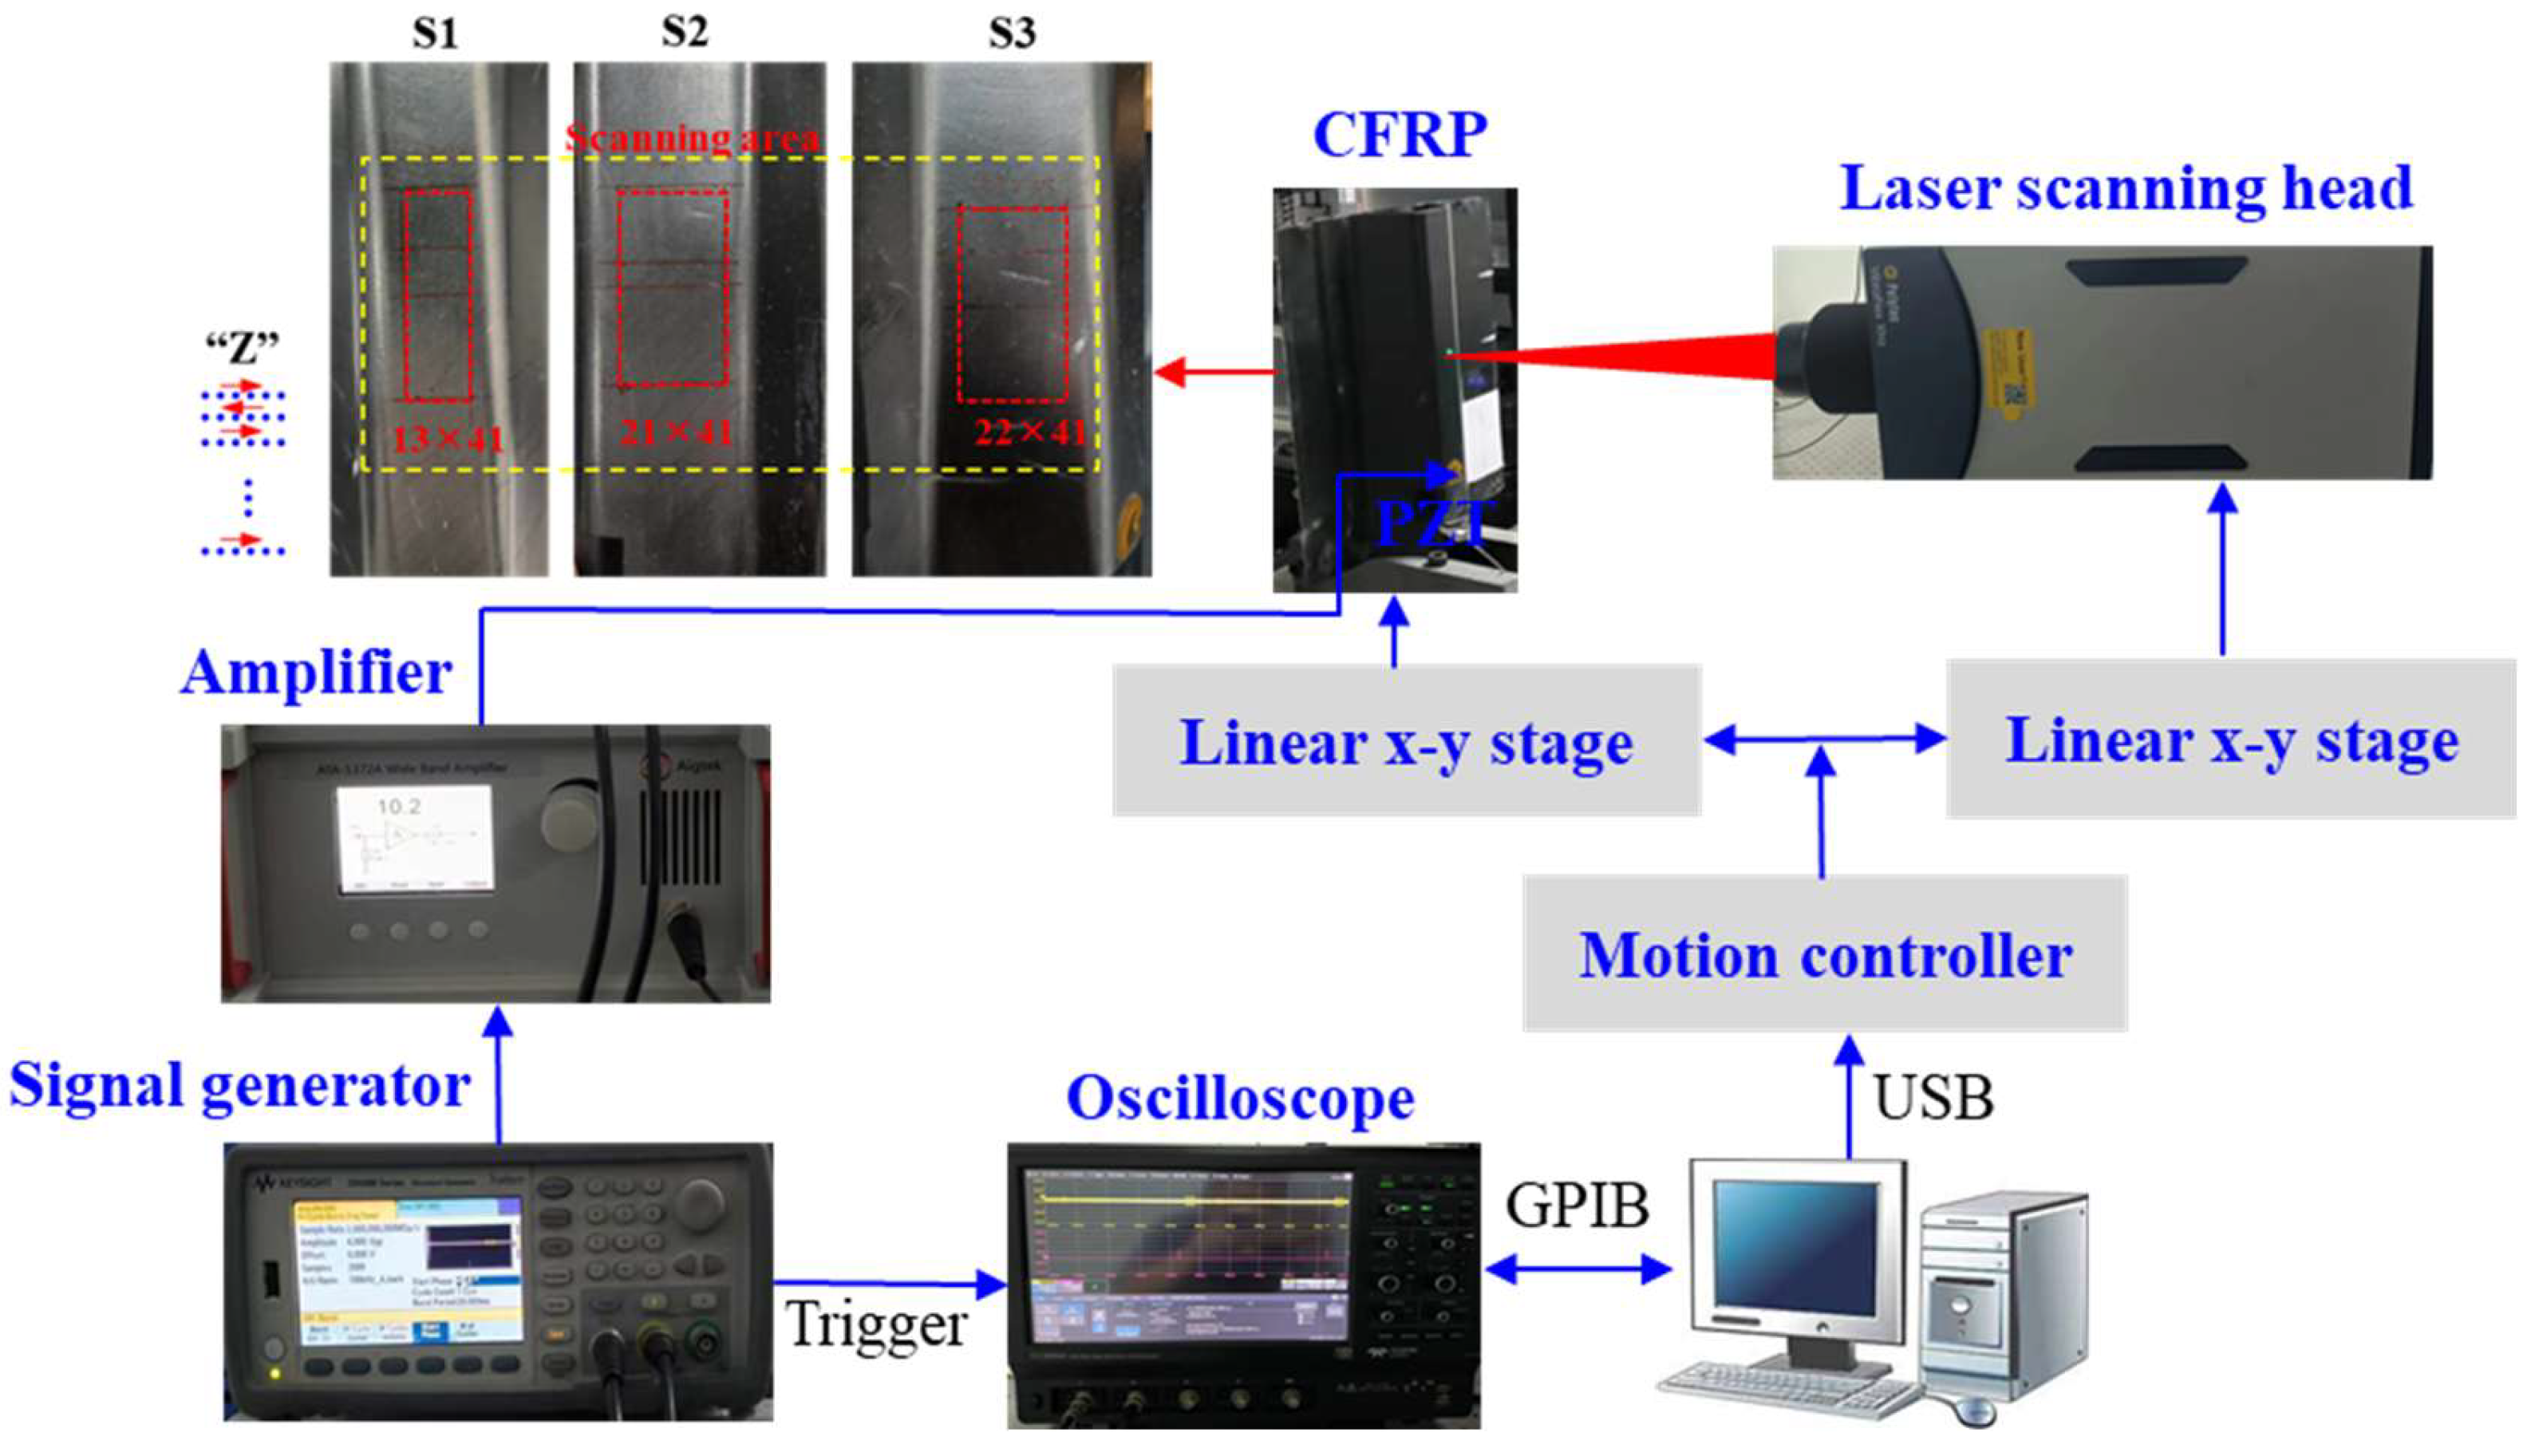
4.1. Experimental Setup
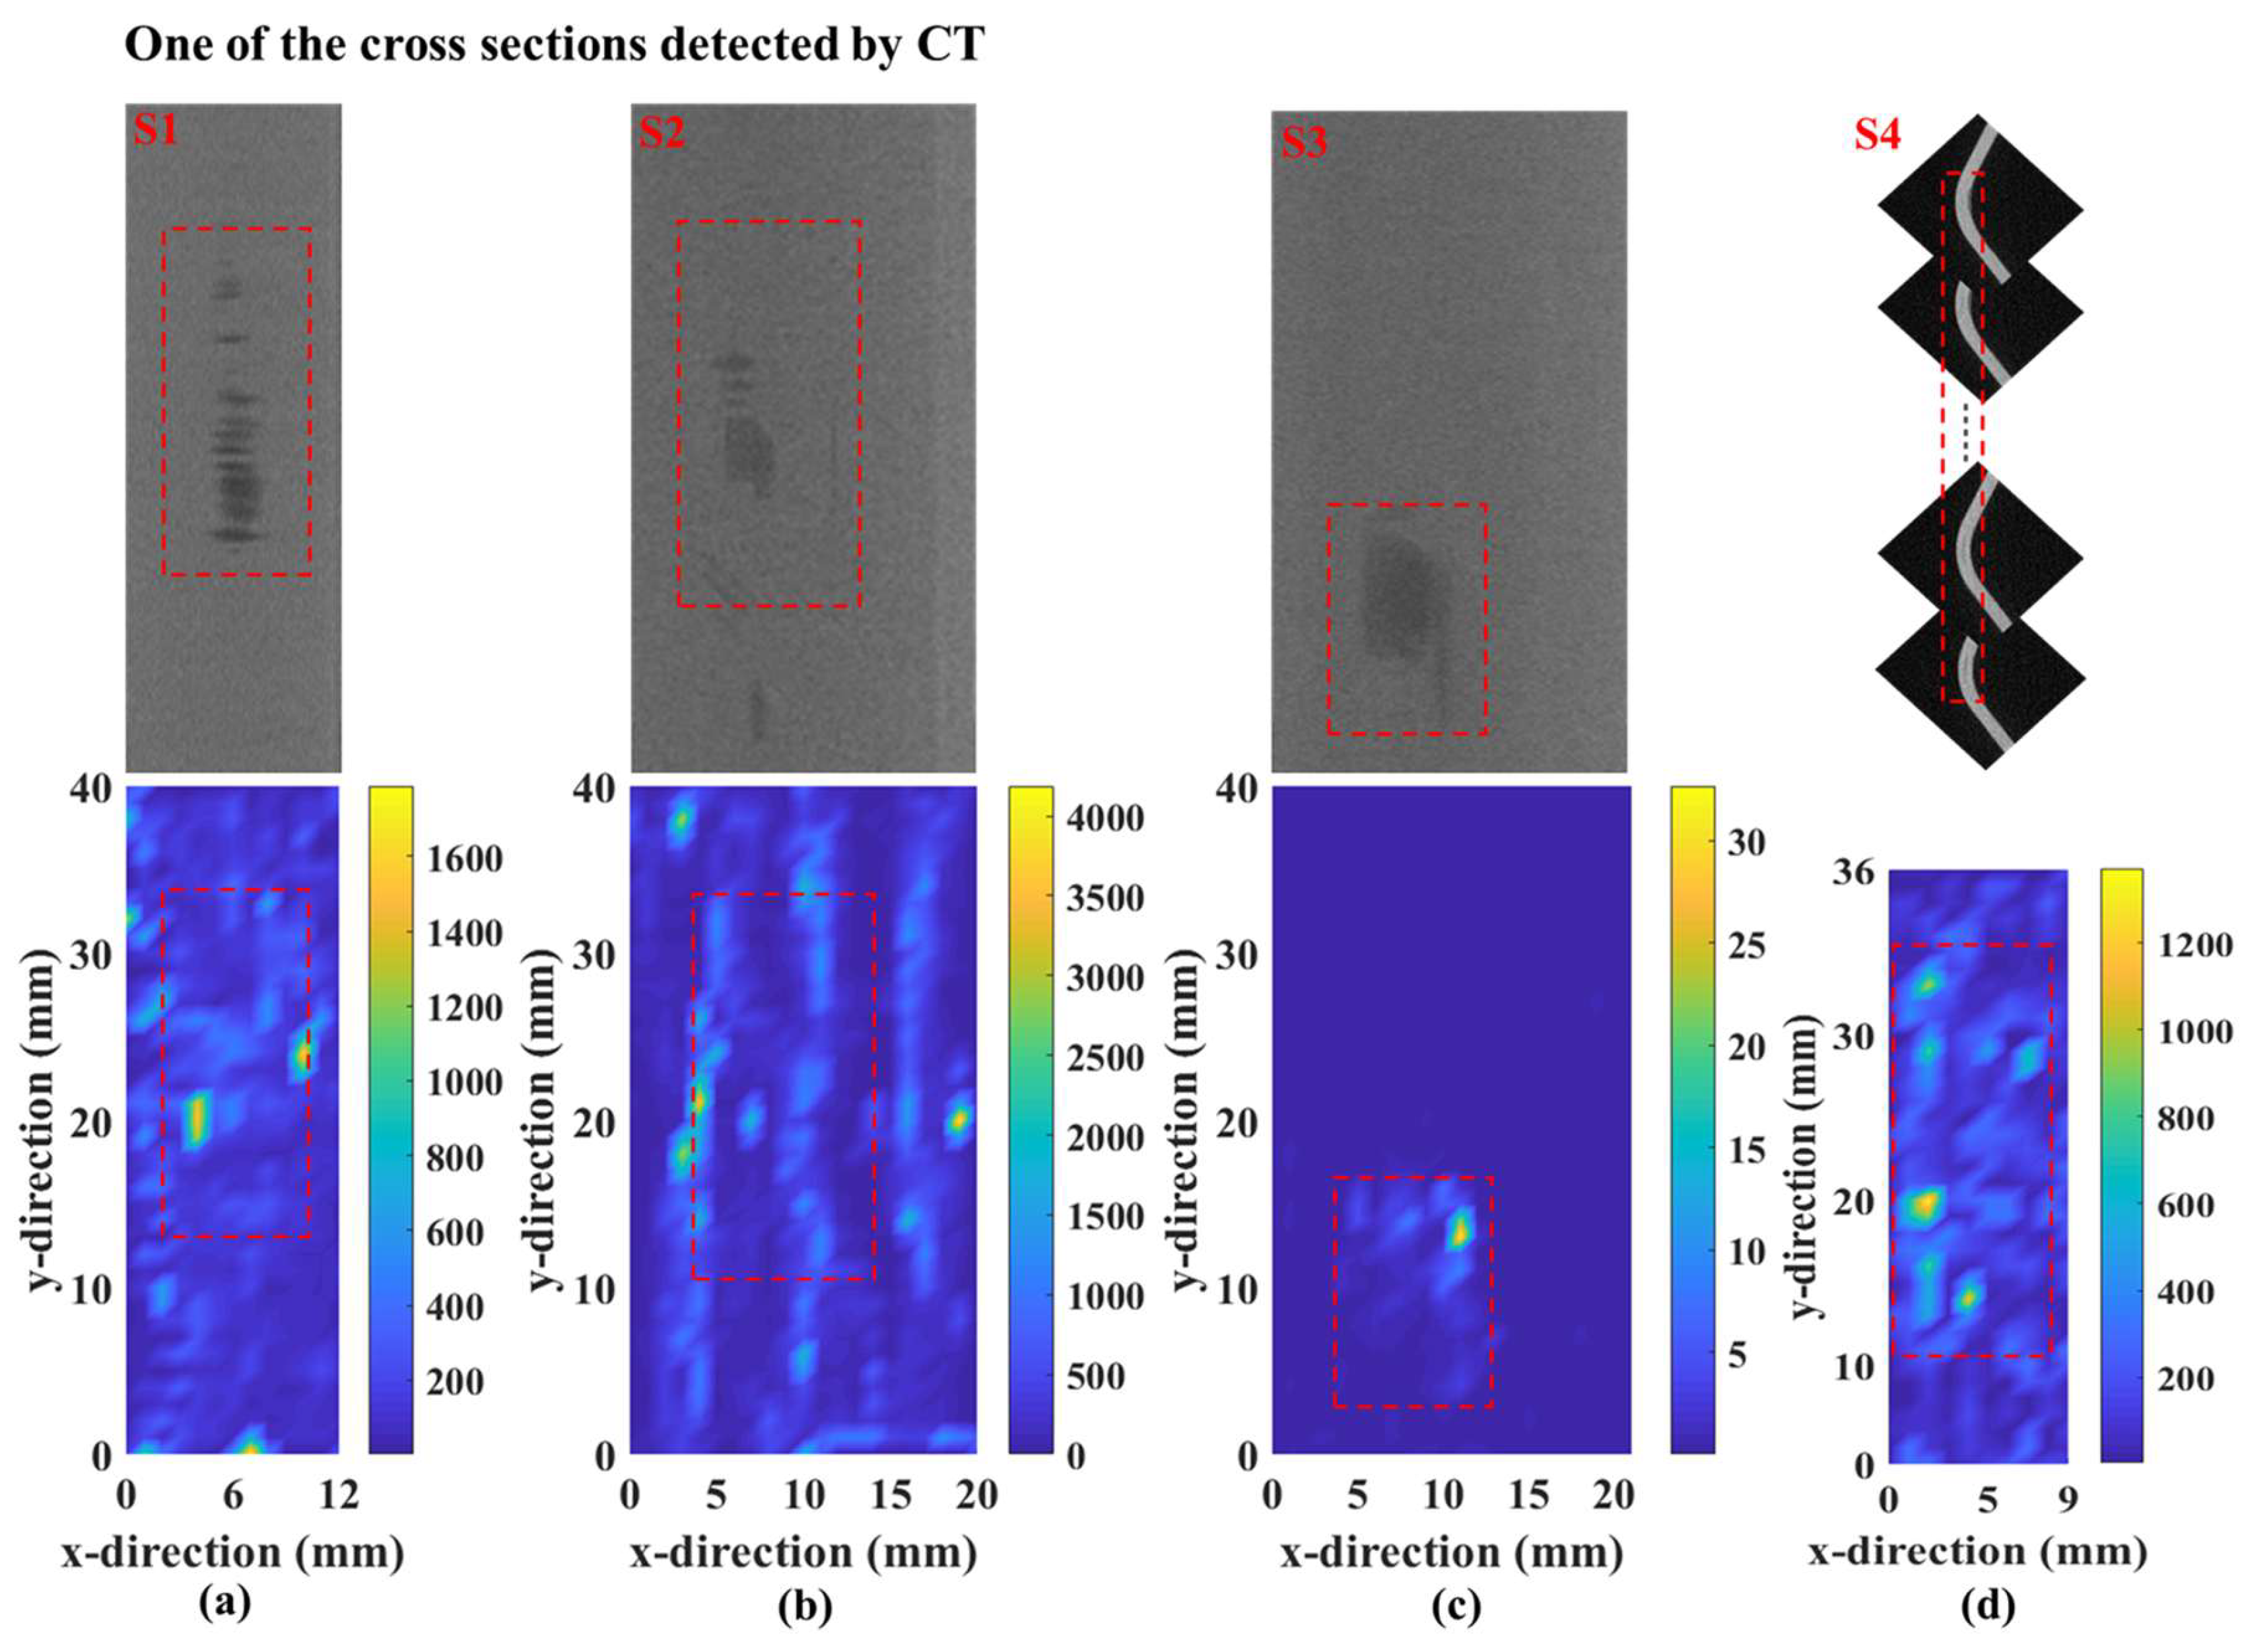
4.2. Damage Imaging Results
5. Discussion and Conclusions
Author Contributions
Funding
Institutional Review Board Statement
Informed Consent Statement
Data Availability Statement
Acknowledgments
Conflicts of Interest
References
- Azad, M.M.; Munyaneza, O.; Jung, J.; Sohn, J.W.; Han, J.W.; Kim, H.S. Damage Localization and Severity Assessment in Composite Structures Using Deep Learning Based on Lamb Waves. Sensors 2024, 24, 8057. [Google Scholar] [CrossRef] [PubMed]
- Tumsys, O.; Draudviliene, L.; Zukauskas, E. Detailed Determination of Delamination Parameters in a Multilayer Structure Using Asymmetric Lamb Wave Mode. Sensors 2025, 25, 539. [Google Scholar] [CrossRef]
- Zeng, X.; Zhao, B.; Liu, X.; Yu, Y.; Guo, J.; Qing, X. Lamb wave-based damage assessment for CFRP composite structures using a CHMM-based damage localization algorithm and a damage quantitative expression. Mech. Syst. Signal Process. 2023, 184, 109750. [Google Scholar] [CrossRef]
- Hervin, F.; Fromme, P. Guided wave skew velocity correction in anisotropic laminates. Ultrasonics 2023, 133, 107047. [Google Scholar] [CrossRef]
- Zhang, H.; Wang, F.; Lin, J.; Hua, J. Lamb wave-based damage assessment for composite laminates using a deep learning approach. Ultrasonics 2024, 141, 107333. [Google Scholar] [CrossRef] [PubMed]
- Zhao, G.; Jiang, M.; Luo, Y.; Sui, Q. Third harmonic approximate phase velocity matching nonlinear early fatigue damage detection. Measurement 2022, 189, 110518. [Google Scholar] [CrossRef]
- Su, C.; Bian, H.; Jiang, M.; Zhang, F.; Sui, Q. Research on composites damage identification based on power spectral density and lamb wave tomography technology in strong noise environment. Compos. Struct. 2022, 289, 115466. [Google Scholar] [CrossRef]
- Sun, L.; Wei, J.; Peng, C.; Ju, Z.; Lv, S.; Zhang, F.; Zhang, L.; Jia, L.; Jiang, M. Modified Lamb Wave Delay Factor-Based Multiply–Sum Probabilistic Diagnostic Imaging Algorithm of Composite Structures. IEEE Trans. Instrum. Meas. 2023, 72, 6004713. [Google Scholar] [CrossRef]
- Memmolo, V.; Monaco, E.; Boffa, N.D.; Maio, L.; Ricci, F. Guided wave propagation and scattering for structural health monitoring of stiffened composites. Compos. Struct. 2018, 184, 568–580. [Google Scholar] [CrossRef]
- Migot, A.; Mei, H.; Giurgiutiu, V. Numerical and experimental investigation of delaminations in a unidirectional composite plate using NDT and SHM techniques. J. Intell. Mater. Syst. Struct. 2020, 32, 1781–1799. [Google Scholar] [CrossRef]
- Rabbi, M.S.; Teramoto, K.; Ishibashi, H.; Roshid, M.M. Imaging of sub-surface defect in CFRP laminate using A(0)-mode Lamb wave: Analytical, numerical and experimental studies. Ultrasonics 2023, 127, 106849. [Google Scholar] [CrossRef]
- Wilcox, P.D.; Lowe, M.; Cawley, P. Mode and transducer selection for long range Lamb wave inspection. J. Intell. Mater. Syst. Struct. 2001, 12, 553–565. [Google Scholar] [CrossRef]
- Huo, H.; He, J.; Guan, X. A Bayesian fusion method for composite damage identification using Lamb wave. Struct. Health Monit. 2020, 20, 2337–2359. [Google Scholar] [CrossRef]
- Hua, J.; Gao, F.; Li, W. Local wavenumber imaging with low-sampled wavefield for delamination characterization in composite plate. NDT E Int. 2023, 137, 102867. [Google Scholar] [CrossRef]
- Zhang, H.; Sun, J.; Rui, X.; Liu, S. Delamination damage imaging method of CFRP composite laminate plates based on the sensitive guided wave mode. Compos. Struct. 2023, 306, 116571. [Google Scholar] [CrossRef]
- Juarez, P.D.; Leckey, C.A. Multi-frequency local wavenumber analysis and ply correlation of delamination damage. Ultrasonics 2015, 62, 56–65. [Google Scholar] [CrossRef]
- Purcell, F.A.F.; Pearson, M.R.; Eaton, M.J.; Pullin, R. Lamb wave mode spectroscopy on complex structures with amplitude-based feature detection. NDT E Int. 2022, 130, 102649. [Google Scholar] [CrossRef]
- Jin, H.; Li, J.; Li, W.; Qing, X. Identification of multi-defects in an arched composite structure by the corrected probabilistic diagnostic imaging with the fused damage index. J. Intell. Mater. Syst. Struct. 2021, 33, 799–810. [Google Scholar] [CrossRef]
- Moll, J.; Kexel, C.; Kathol, J.; Fritzen, C.-P.; Moix-Bonet, M.; Willberg, C.; Rennoch, M.; Koerdt, M.; Herrmann, A. Guided Waves for Damage Detection in Complex Composite Structures: The Influence of Omega Stringer and Different Reference Damage Size. Appl. Sci. 2020, 10, 3068. [Google Scholar] [CrossRef]
- Jain, M.; Kapuria, S. Efficient zigzag theory-based spectral element model for guided waves in composite structures containing delaminations. Compos. Struct. 2023, 325, 117585. [Google Scholar] [CrossRef]
- Spytek, J.; Mrowka, J.; Pieczonka, L.; Ambrozinski, L. Multi-resolution non-contact damage detection in complex-shaped composite laminates using ultrasound. NDT E Int. 2020, 116, 102366. [Google Scholar] [CrossRef]
- Kudela, P.; Wandowski, T.; Malinowski, P.; Ostachowicz, W. Application of scanning laser Doppler vibrometry for delamination detection in composite structures. Opt. Lasers Eng. 2017, 99, 46–57. [Google Scholar] [CrossRef]
- Saito, O.; Sen, E.; Okabe, Y. 2D slowness visualization of ultrasonic wave propagation for delamination detection in CFRP laminates. NDT E Int. 2022, 131, 102696. [Google Scholar] [CrossRef]
- Sha, G.; Xu, H.; Radzieński, M.; Cao, M.; Ostachowicz, W.; Su, Z. Guided wavefield curvature imaging of invisible damage in composite structures. Mech. Syst. Signal Process. 2021, 150, 107240. [Google Scholar] [CrossRef]
- Sha, G.; Xu, H.; Radzieński, M.; Cao, M.; Ostachowicz, W. Wavelet-aided guided wavefield imaging of delaminations in laminated composite plates. Smart Mater. Struct. 2020, 29, 105029. [Google Scholar] [CrossRef]
- Kudela, P.; Radzieński, M.; Ostachowicz, W. Identification of cracks in thin-walled structures by means of wavenumber filtering. Mech. Syst. Signal Process. 2015, 50–51, 456–466. [Google Scholar] [CrossRef]
- Yang, C.; Ye, L.; Su, Z.; Bannister, M. Some aspects of numerical simulation for Lamb wave propagation in composite laminates. Compos. Struct. 2006, 75, 267–275. [Google Scholar] [CrossRef]
- Saito, O.; Yu, F.; Okabe, Y. Dispersion relation of Lamb waves in cross-ply composite laminates using multi-layered models. Compos. Struct. 2021, 264, 113691. [Google Scholar] [CrossRef]
- Patra, S.; Ahmed, H.; Saadatzi, M.; Banerjee, S. Experimental verification and validation of nonlocal peridynamic approach for simulating guided Lamb wave propagation and damage interaction. Struct. Health Monit. 2019, 18, 1789–1802. [Google Scholar] [CrossRef]
- Mei, H.; Migot, A.; Haider, M.F.; Joseph, R.; Bhuiyan, M.Y.; Giurgiutiu, V. Vibration-Based In-Situ Detection and Quantification of Delamination in Composite Plates. Sensors 2019, 19, 1734. [Google Scholar] [CrossRef]
- Zhao, G.; Yu, Z.; Wu, S.; Wang, H.; Chen, J.; Peng, H.-X. Ultrasonic full guided wavefield for damage detection in curved CFRP parts. Compos. Commun. 2024, 49, 101994. [Google Scholar] [CrossRef]
- Hervin, F.; Maio, L.; Fromme, P. Guided wave scattering at a delamination in a quasi-isotropic composite laminate: Experiment and simulation. Compos. Struct. 2021, 275, 114406. [Google Scholar] [CrossRef]
- Sohn, H.; Dutta, D.; Yang, J.Y.; Park, H.J.; DeSimio, M.; Olson, S.; Swenson, E. Delamination detection in composites through guided wave field image processing. Compos. Sci. Technol. 2011, 71, 1250–1256. [Google Scholar] [CrossRef]
- Zarei, A.; Pilla, S. Laser ultrasonics for nondestructive testing of composite materials and structures: A review. Ultrasonics 2024, 136, 107163. [Google Scholar] [CrossRef]


| E11/GPa | E22/GPa | E33/GPa | G12/GPa | G13/GPa | G23/GPa | v12 | v13 | v14 |
|---|---|---|---|---|---|---|---|---|
| 148.67 | 9.29 | 9.29 | 8.48 | 8.48 | 5.7 | 0.27 | 0.27 | 0.41 |
Disclaimer/Publisher’s Note: The statements, opinions and data contained in all publications are solely those of the individual author(s) and contributor(s) and not of MDPI and/or the editor(s). MDPI and/or the editor(s) disclaim responsibility for any injury to people or property resulting from any ideas, methods, instructions or products referred to in the content. |
© 2025 by the authors. Licensee MDPI, Basel, Switzerland. This article is an open access article distributed under the terms and conditions of the Creative Commons Attribution (CC BY) license (https://creativecommons.org/licenses/by/4.0/).
Share and Cite
Zhao, G.; Zeng, Y.; Yu, Z.; Sun, K.; Chen, J. Delamination Detection in CFRP Stringers with A0-Mode Lamb Wave Curvature. Sensors 2025, 25, 1915. https://doi.org/10.3390/s25061915
Zhao G, Zeng Y, Yu Z, Sun K, Chen J. Delamination Detection in CFRP Stringers with A0-Mode Lamb Wave Curvature. Sensors. 2025; 25(6):1915. https://doi.org/10.3390/s25061915
Chicago/Turabian StyleZhao, Gaozheng, Yike Zeng, Zhenyang Yu, Kaihua Sun, and Jian Chen. 2025. "Delamination Detection in CFRP Stringers with A0-Mode Lamb Wave Curvature" Sensors 25, no. 6: 1915. https://doi.org/10.3390/s25061915
APA StyleZhao, G., Zeng, Y., Yu, Z., Sun, K., & Chen, J. (2025). Delamination Detection in CFRP Stringers with A0-Mode Lamb Wave Curvature. Sensors, 25(6), 1915. https://doi.org/10.3390/s25061915