1. Introduction
Our world today is surrounded by a vast array of electronic devices that are revolutionizing how we live and work. In this context, the IoT is emerging as a groundbreaking technology that is reshaping industries and making life smarter through intelligent, and highly connected devices. IoT is enhancing areas like healthcare monitoring, environmental tracking, water management, smart agriculture, and smart homes [
1,
2]. Specifically, IoT enables diverse physical devices to communicate and collaborate with one another, seamlessly transferring data across numerous networks without the need for human intervention [
3,
4]. IoT is embedded with several components such as sensors, actuators, software, processors, and many other technologies which enable devices and systems to connect and communicate over the Internet. According to [
5], it is estimated that by the year 2030, the number of connected IoT devices will reach 29 billion, signifying a difference of about 20.4 billion compared to 2019. This surge is attributed to the growing dependence of households and businesses on embedded technologies. In terms of sector-specific distribution, the industrial and manufacturing domain leads in IoT device adoption, accounting for 40.2% of the total. The medical sector closely follows, constituting 30.3% of IoT devices usage. Other sectors include retail, contributing 8.3%, security with 7.7%, and transportation with 4.1% of the overall distribution of IoT equipment [
6]. This surge is further fueled by the widespread adoption of Internet connectivity and the emergence of innovative technologies such as cloud, edge, and fog computing.
The increasing inter-connectivity of these devices also brings forth unprecedented security challenges, particularly in safeguarding IoT networks from malicious activities. One of the paramount concerns is the timely and accurate detection of intrusion within IoT networks, a pivotal aspect in ensuring the integrity and security of these interconnected systems [
7,
8]. Interconnected IoT devices have become susceptible targets for malicious threats due to their operation with low power and computation management. Distributed Denial of Service (DDoS) and eavesdropping are some of the most catastrophic attacks against IoT [
9]. Traditional security methods, such as encryption, firewalls, and access control, often prove ineffective in securing these devices; they become time-consuming and insufficient in vast networks with numerous interconnected devices where each component introduces its own vulnerability, challenging the effectiveness of traditional security measures [
3]. An additional layer of defense for safeguarding an IoT network against security attacks can be achieved through the implementation of an Intrusion Detection System (IDS), serving as a secondary line of defense [
10].
An IDS is a highly effective tool for monitoring and analyzing a device’s behavior. IDS is commonly used as an additional layer of security to safeguard systems and networks. They monitor events for suspicious activity, offering early warnings of potential threats. This proactive approach helps reduce damage and limit the impact of successful intrusion attempts. As an extra line of defense, IDSs play a crucial role in maintaining the security and integrity of networks and systems [
11]. By mapping user-behavior patterns on the network, IDS can identify abnormal activities, indicating a deviation from normal device or user behavior. IDS can continuously scan events across various network systems, analyzing them to detect behavioral changes and uncover potential security incidents with the aim of providing timely responses to threats [
10]. Intrusion detection is determined by its deployment method and detection methodology. Depending on deployment, an IDS can be either host-based, network-based, or hybrid-based. In terms of detection method, it may be signature-based, anomaly detection-based, statistical-based, rule-based, state-based, heuristic-based, specification-based, or hybrid detection [
3,
12]. In response to the challenges of detecting intrusion, machine learning (ML) emerges as a promising method, capable of discerning irregular patterns in network behaviour. There are many solutions in the literature that utilise ML methods to detect IoT network intrusion [
13,
14,
15]. In this domain, ensemble-based methods have been identified as promising approaches for developing robust IDS (see, for example, the studies in [
3,
7,
10,
13,
16,
17,
18]). For instance, the authors of [
3] developed an ensemble model for IDS that leverages ML methods such as Logistic Regression (LR), Naive Bayes (NB), and decision tree (DT). Using the CICIDS2017 intrusion detection dataset, the ensemble model achieved an accuracy of 88.96% and 88.92% for multi-class and binary classification respectively. Awotunde et al. [
7] propose ensemble methods that considered XGBoost, bagging, Extra Trees, Random Forest, and AdaBoost using ToN-IoT datasets. Seven telemetry datasets, including Fridge, Thermostat, GPS Tracker, Modbus, Motion Light, Garage Door, and Weather are explored to develop the ensemble models. Hazman et al. [
19] proposed an IDS framework that employed Boruta-based feature-selection method. The features selected from Boruta were used to train an AdaBoost ensemble algorithm based on two IDS datasets (i.e., NSL-KDD and BoT-IoT). This approach is based on a binary classification problem and does not consider multi-class classification tasks. Even though the model produces promising results, Boruta feature selection was time consuming, which may not be applicable for real-time IoT settings. In [
18], an ensemble model that leverages DT, Rprop MLP, and LR was developed using voting and stacking methods. Feature-selection methods using correlation-coefficient scoring and recursive feature elimination (RFE) were employed to select important features for IDS. Synthetic Minority Oversampling Technique (SMOTE) was utilized to balance the distribution of samples per class in the BoT-IoT and TON-IoT datasets used in the study. This approach considers only the binary classification task and neglect multi-class classification.
Although many ensemble-based methods have been proposed for IDS development, these studies neglect the fact that the transparency of IDS models plays a significant role in IDS adoption by stakeholders. Explainable IDS will assist security analysts to understand what constitutes abnormal behaviour in IoT network and what needs to be done to proactively mitigate future attacks. In some use cases, such as law enforcement, criminal investigation, and forensic analysis, where IDS is considered as a useful tool to understand digital evidence, explainable IDS is worth considering. Gaining insights into the reason and logic behind the decision of an IDS to flag a specific event as intrusion can aid security practitioners in assessing the system’s effectiveness and creating more cyber-resilient solutions. While some studies considered multi-class classification problems, others neglect the need to explore such approach for developing effective IDS solutions. Considering the resource-constrained nature of IoT devices, the need for real-time detection capability and a lightweight security framework has become necessary. This paper aims to address the aforementioned research issues identified in the previous studies. In this paper, we propose a framework that integrates transparent ensemble methods that do not only detect intrusion based on binary and multi-class classifications, but also leverage a rule-induction approach to provide explainability. More clearly, this paper contributes in the following ways:
It investigates the performance of five ensemble methods to develop an efficient IDS solution for IoT network environment;
It integrates rule induction for knowledge extraction to provide explanations for the outcomes of the ensemble models, thus aiding better understanding of the models’ predictions;
It provides extensive evaluation results based on two network-intrusion datasets.
The remaining parts of this paper are organized as follows.
Section 2 focuses on related works in intrusion detection for IoT.
Section 3 provides a detailed discussion on the methodology used in our study, including a discussion of the ensemble methods, and the rule-induction method for model explanations.
Section 4 presents a comprehensive discussion of the various results obtained, how we compare the proposed methods with the related studies in the domain of IDS development for IoT, and the limitations of our study. Finally,
Section 5 concludes the paper and offers future research directions.
2. Related Works
This section provides a comprehensive review of existing studies that focused on IDS development for IoT networks. As observed, several studies focused on ML methods such as traditional, ensemble, and deep learning approaches.
Yakub et al. [
20] proposed a ML-based IDS for IoT network attacks, employing the UNSW-NB15 dataset. The research focused on feature scaling using Min–Max normalization and PCA for feature selection. Six ML models, including XGBoost and CatBoost, were evaluated, with PCA-XGBoost exhibiting the highest accuracy of 99.99%. The study emphasizes the reduction of communication overhead, and the proposed system proves effective in detecting various network-attack scenarios. The authors suggest adopting an ensemble model with a novel dataset suitable for the IoT environment to design IDS that is tailored to the IoT situation. The study in [
9] investigates ML classification algorithms to secure IoT against DoS attacks, emphasizing anomaly-based IDS. Various classifiers, such as RF and Extreme Gradient Boosting, were tested on the CIDDS-001, UNSW-NB15, and NSL-KDD datasets. The paper introduces statistical assessments using Friedman and Nemenyi tests, shedding light on the performance of classifiers. The performance results and statistical tests reveal that classification and regression trees and the Extreme Gradient Boosting classifier show the best trade-off between prominent metrics and response time, making them suitable choice for building IoT-specific anomaly-based IDSs.
Diro et al. [
21] conducted an extensive literature review of anomaly detection in IoT. They highlight challenges in securing heterogeneous IoT devices and propose the integration of blockchain for collaborative learning. The paper evaluates supervised ML algorithms like K-Nearest Neighbour (KNN) and unsupervised approaches, emphasizing the drawbacks of classical algorithms and resource limitations in IoT. Banaamah et al. [
22] focused on deep learning models, including Convolutional Neural Network (CNN), Long Short-Term Memory (LSTM), and Gated Recurrent Unit (GRU), for IoT intrusion detection. While highlighting the benefits of deep learning, the study acknowledges challenges, such as the need for massive training data. The proposed methods demonstrate high accuracy, with LSTM at 99.8% and a false alarm of 0.02%, outperforming CNN with 99.7% and a false alarm of 0.03, while GRU achieved 99.6% with a false alarm of 0.04%. However, the study notes limitations related to network load and execution-time increase with a Deep Neural Network (DNN). Saba et al. [
23] addressed the security challenges posed by IoT and proposed a CNN-based approach for anomaly-based IDS tailored for IoT environments. The study emphasizes the inadequacy of traditional intrusion detection technologies due to resource constraints in IoT devices. Their research contributes by categorizing attacks through deep learning, proposing an IDS framework for IoT networks. The CNN model, validated on the BoT-IoT dataset, demonstrates accuracy of 95.55% in classifying various traffic types. However, the authors acknowledge that significant research is still required for advancements in IoT to have a better threat-detection rate with IoT progression in the industry, suggesting the potential for refining the model.
The DNN solution has also been studied by Ahmad et al. [
12]. The approach explores various deep learning models based on the IoT-Botnet 2020 dataset. The study underscores the efficiency of DNN in learning complex features and achieving a high detection accuracy of 99.01% with a false-alarm rate of 3.9%. Notably, the authors identify a challenge in detecting minority-class labels efficiently, highlighting a potential area for future research in multi-class classification scenarios. Sarhan et al. [
24] explored the impact of feature dimensions on classification performance across diverse datasets. Their study addresses the unreliability of Network Intrusion Detection Systems (NIDS) in IoT networks, focusing on the generalizability of feature-extraction algorithms and ML models across different NIDS datasets. The authors advocate for further investigation into finding an optimal feature-selection approach and ML classifiers. Susilo et al. [
25] proposed a DNN method as a means to enhance IoT security, focusing on the detection of DoS attacks. The study employed BoT-IoT dataset by evaluating RF, CNN, and Multi-Layer Perceptron (MLP) algorithms. RF and CNN provided the best results in terms of AUC-ROC metric. The authors discuss the potential of integrating these algorithms into NIDS for real-time mitigation. Hanif et al. [
26] addressed authentication challenges in IoT by proposing an Artificial Neural Network (ANN)-based threat-detection model. The proposed ANN model, trained on the UNSW-NB15 dataset, achieved 84% accuracy and an average False-Positive Rate (FPR) of 8% in classifying diverse attacks. The challenges in this study relate to low accuracy and high false alarm.
In [
27], a three-layer IDS for IoT devices in smart homes is proposed, employing a supervised ML approach. The IDS distinguishes between benign and malicious network activities, identifies malicious packets, and classifies the type of attack. The study evaluates the system on a smart-home test bed with popular IoT devices, showcasing its ability to automatically detect and classify attacks. A DT based on the J48 algorithm emerges as a promising classifier. J48 achieved an F-measure of 99.7%, 97.0%, and 99.0% across all three experiments.
Abbas et al. [
3] proposed an ensemble model for IDS that considers LR, NB, and DT algorithms. The ensemble model achieved 88.96% and 88.92% accuracy for multi-class and binary classification, respectively, based on CICIDS2017 dataset. The performance of different ensemble methods using bagging and boosting DT techniques was explored in [
10]. The authors observed that Light Gradient Boosting (LGB) algorithm produced the best results in terms of speed and AUC-ROC score for multi-class IDS solution. Awotunde et al. [
7] developed ensemble models based on XGBoost, bagging, Extra Trees, Random Forest, and AdaBoost using thw ToN-IoT dataset. Odeh et al. [
17] proposed an ensemble model that utilize voting policy to integrate deep learning models such as CNNs, LSTM, and GRUs.
Danso et al. [
13] utilized a SelectKbest feature-selection approach combined with Chi-Squared to identify discriminating features for IDS. ML algorithms such as kNN, Support Vector Classification (SVC), and NB were combined to develop an ensemble model using voting, stacking, boosting methods. It was observed that the accuracy of the stacking method (i.e., 99.87%) on CICIDS2017 gave the best performance, but performs the least well in precision and FPR when compared with the bagging method for the classification task investigated in the study. In [
16], an ensemble model for binary classification of IDS is proposed. The approach utilize voting and stacking methods for RF, DT, LR, and kNN algorithms, achieving accuracy of 98.63% based on the stacking method.
Hazman et al. [
19] proposed an IDS framework that employed a Boruta-based feature-selection method. The features selected from Boruta were used to train an AdaBoost ensemble algorithm based on NSL-KDD and BoT-IoT IDS datasets. This approach is based on a binary classification problem and does not consider a multi-class classification task. One limitation of this approach is the computational complexity of the Boruta feature-selection approach for IoT intrusion detection in real-time environment. In [
18], an ensemble model based on DT, Rprop MLP, and LR was developed using voting and stacking methods. Feature-selection methods using correlation-coefficient scoring and RFE were employed to select important features for IDS. To address a class imbalance problem, the study utilized the SMOTE technique on both BoT-IoT and TON-IoT datasets. The study considers only the binary classification task and neglects multi-class classification, which is also beneficial for developing effective IDS.
Hassan et al. [
28] incorporated Local Interpretable Model-agnostic Explanations (LIME) and SHapley Additive exPlanations (SHAP) to provide model explanations for IDS in a Vehicular Ad-hoc Networks (VANETs) environment. The study leveraged a machine learning pipeline that consider correlation-based feature selection and a Random Forest classifier to achieve a classification accuracy of 100% for identifying normal and malicious traffic in VANETs. An explanation of the rules for security threats, based on a natural language-generation strategy using hybrid prompt learning, has been given in [
29]. The goal of the study was to prevent the privacy and security risks associated with automation rules that may potentially compromise the security of a trigger-action systems such as IoT.
In contrast to the existing studies, this paper proposes an IDS framework that integrates model explainability for transparency and accountability, which is achieved through the integration of a rule-induction method. We investigate five lightweight ensemble methods to address the resource-constrained nature of IoT devices. This will subsequently support the development of real-time IDS solutions. The proposed approach can help security analysts and end-users to understand what constitutes abnormal behaviors in IoT networks, as well as how to deploy mitigation strategies to reduce threat impacts. In this study, we consider both binary and multi-class classification problems and provide an explanation for each category of classification task.
3. Materials and Methods
This section provides a detailed discussion on the different components of the proposed framework for IDS in this study. Different methods have been investigated to achieve the objectives of this research, as highlighted in
Section 1.
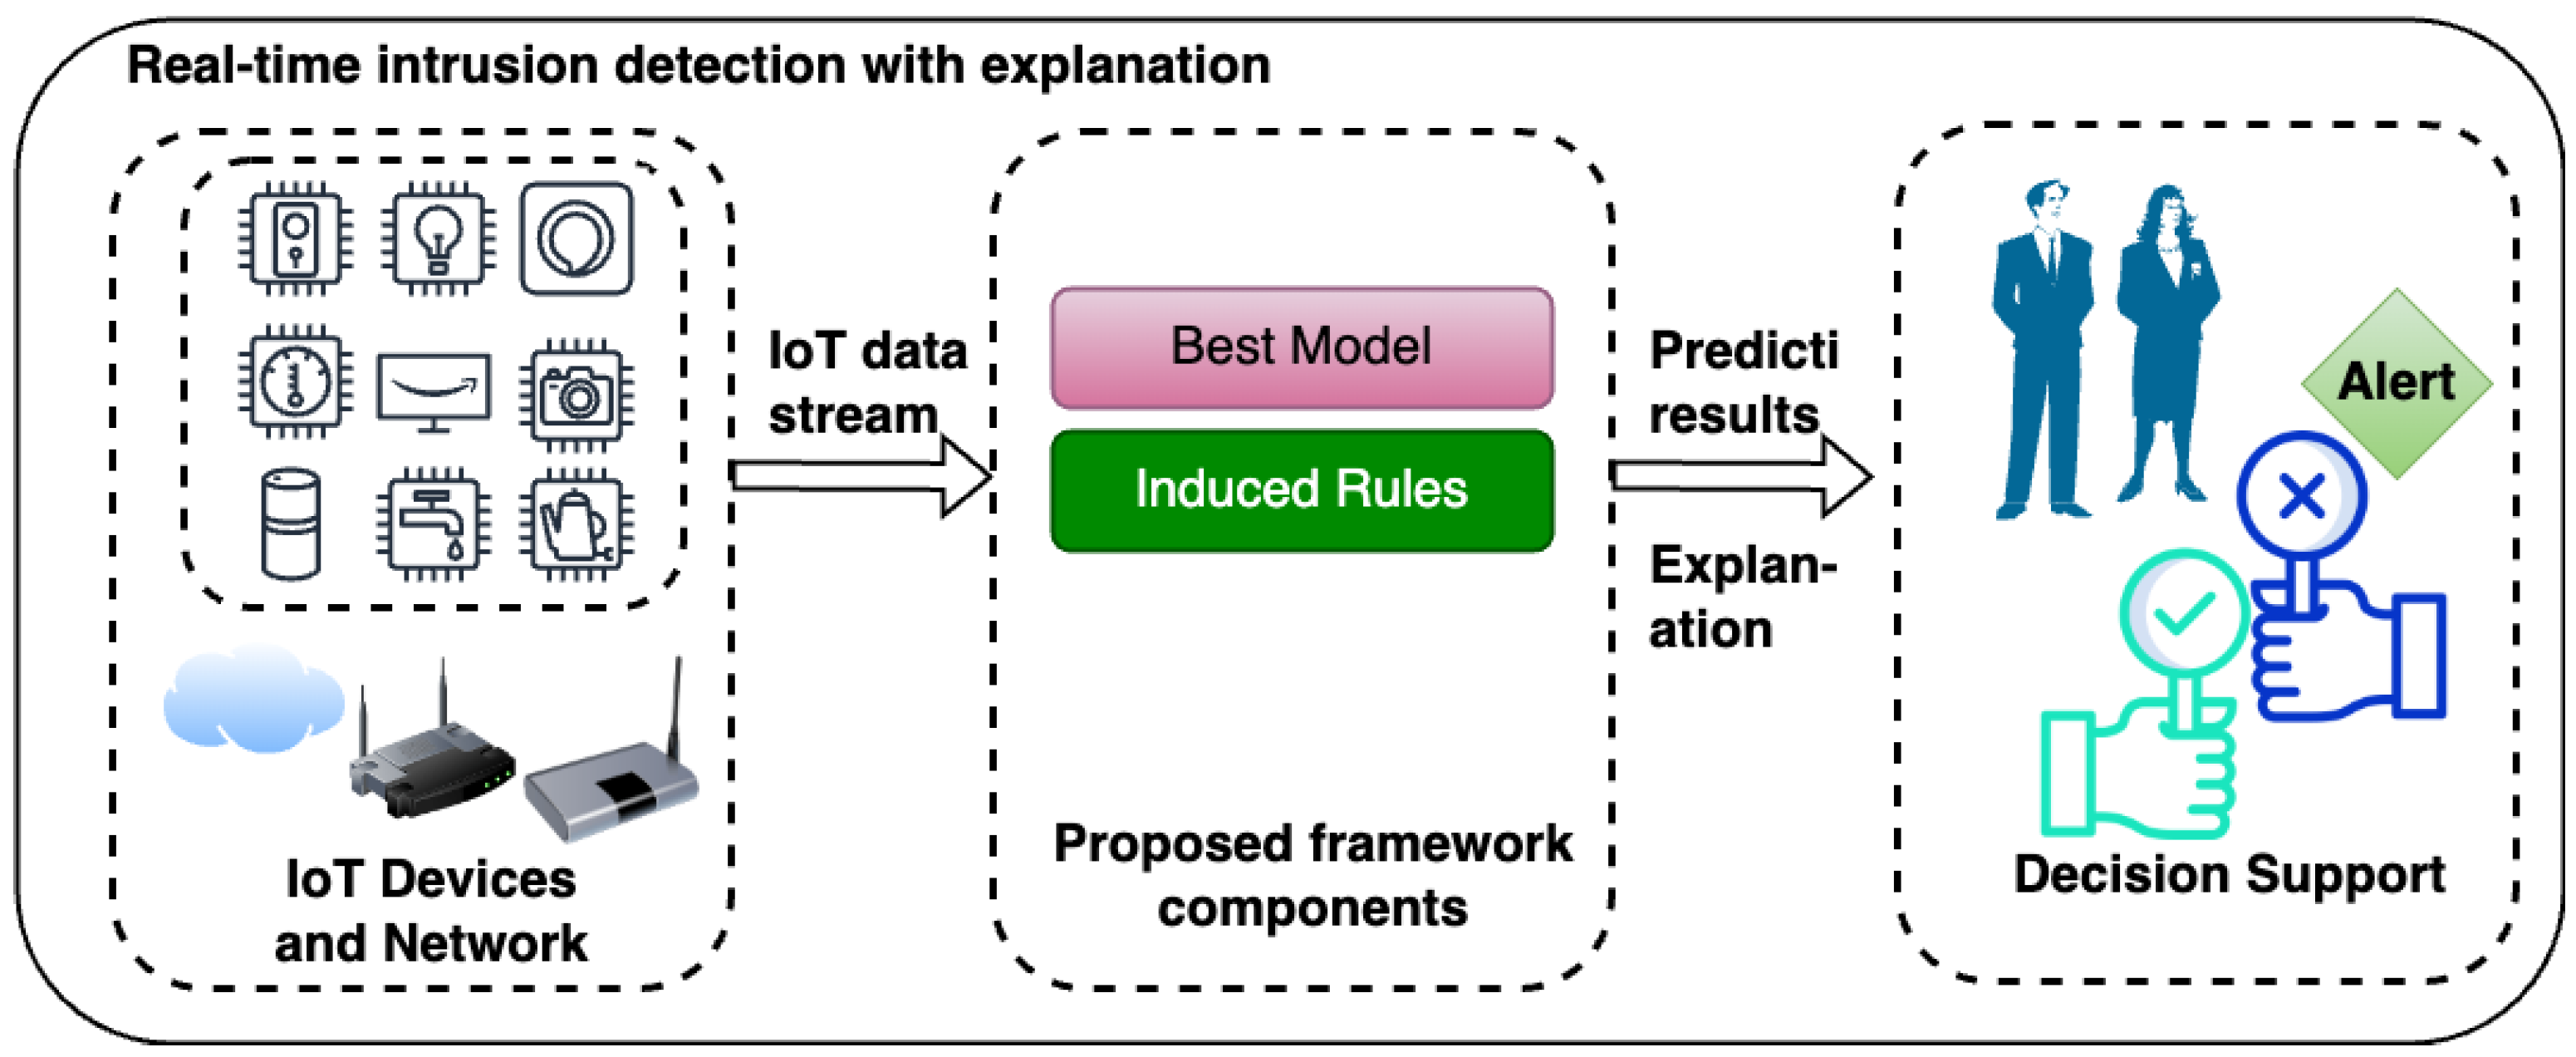
Figure 1 shows the main pipeline of the proposed framework. It consists of data collection from the IoT network environment, data preparation, ensemble models, classification type, model evaluation, and model explanation. Each stage is described in detail in the subsequent sections. The main focus of the proposed framework is to develop IDSs that leverage the feature importance of decision-tree-based models integrated in the ensemble algorithms to provide model explanations and transparency. The proposed framework also targets both binary and multi-class classification based on ensemble learning methods. As shown in
Figure 2, the best model according to the proposed framework is then used to detect intrusion in IoT environment. In addition to detecting normal and attack cases using the best proposed ensemble model, the rule induced from the real-time intrusion detection can be used to further aid decision making by IoT security analysts and end-users.
3.1. Dataset Description
This study utilized two publicly available datasets that have been widely used in the literature for intrusion detection in IoT networks. The first dataset is CIC-IDS2017 [
30], which can be downloaded at
https://www.unb.ca/cic/datasets/ids-2017.html (accessed on 24 December 2024). This dataset contains 2,830,743 samples with 79 features, including the label features that described both normal samples and the attack cases. There are 15 class labels, including the normal case. The attack scenarios range from DDoS, DoS Hulk, DoS GoldenEye, DoS slowloris, web-attack brute force, and so on, as presented in
Table 1. This table shows the class distribution in the CIC-IDS2017 dataset with the benign (normal) class having the largest proportion, and this is followed by the DOS Hulk attack.
The second dataset is the CICIoT2023 that is publicly available for download at
https://www.unb.ca/cic/datasets/iotdataset-2023.html (accessed on 24 December 2024). CICIoT2023 is a large-scale dataset for testing a wide range of network intrusion attacks. This dataset contains 45,019,234 samples with 40 features, including the label features that describe both normal (i.e., BENIGN) samples and attack cases (see
Table 2). There are 33 attack cases in the dataset, with DDoS-ICMP-Flood constituting the largest proportion (15.312%), as shown in
Table 2. Uploading attack has the lowest proportion according to the table. For a detailed discussion of the different attacks in the dataset, the reader is referred to [
31].
There are 14 and 33 attack cases in CIC-IDS2017 and CICIoT2023, respectively. According to
Table 1 and
Table 2, some of these attack are grouped as follows:
Backdoor malware: This is a typical web-based attack that enables the attacker to use backdoor malware to gain unauthorized access to IoT devices. The malware, usually called a “backdoor”, hides itself such that the attacker can use an undisclosed entry point to gain access to the system. A typical example is the backdoor malware in the CICIoT2023 dataset.
Botnet: Botnet attacks involve the use of a command and control architecture, which permits the attacker to take control of operations from vulnerable IoT devices called “zombie bots” from a remote location. This attack can be used to launch DDoS and other exploitations.
Browser hijacking: This is a web-based application attack that allows attacker to modify the browser settings. This includes changing the default home page, setting a default search engine, and bookmarking certain websites to take advantage of unwanted advertisements [
31].
Command Injection: This attack is an attack against web/mobile applications, such as the one used to control IoT devices that injects malicious commands into the application input field. The objective is to have unauthorized access to sensitive parts of the application.
Denial of Service (DoS)/Distributed Denial of Service (DDoS): While a DoS attack uses a single machine to compromise the target device, DDoS, on the other hand, leverages multiple machines in a coordinated manner to execute a denial of the service attack targeting the victim’s device. For instance, in [
31], one Raspberry Pi machine executed a flooding attack against IoT devices, while multiple Raspberry Pis were employed to execute DDoS attacks using an SSH-based master–client setup. This type of attack has different variations, including DDoS-ICMP-Flood, DDoS-UDP-flood, DDoS-TCP-flood, DDoS-SYN-flood, among others (see
Table 1 and
Table 2).
Brute force: This attack uses a combination of characters in several trials to crack passwords or login credentials. When a wordlist is used to aid in slowing down the time that would be taken by a brute force, then such an attack is called a dictionary attack. One of the vulnerabilities of IoT devices is a weak password [
32], which is leveraged by attacker to execute a brute-force attack against the target login platform.
Domain Name Server (DNS) Spoofing: DNS spoofing attack, also called a DNS cache-poisoning attack, is used by the attacker to manipulate DNS records to redirect legitimate users or requests to malicious websites that mimic the users’ intended destination. The attack enables the attacker to gain access to sensitive information and spread malicious software.
Mirai Botnet: This is a DDoS attack that targets thousands of IoT devices such as printers, baby monitors, IP cameras, and so on, turning them into malicious botnets or Zombie bots [
33].
PortScan: This attack is used by the attacker to determine which port is open, closed, or filtered. It is a type of information-gathering attack or reconnaissance attack in which a series of packets is sent to a target machine to ascertain the status of the ports running on that machine. A tool such as Nmap [
34] can be used for this purpose. In the CICIoT2023 dataset, this attack is referred to as vulnerability scan [
31].
Reconnaissance: A reconnaissance attack is an information-gathering attack which allows the attacker to gather data before the actual attack is executed. This can help the attacker gain more insights on the target machine as to what needs to be done to execute successful attack.
SQL Injection: In SQL injection, an attacker uses an SQL query in the input fields of the web application. This causes the application to disclose sensitive information from the database. This attack can be used to execute commands on the database server.
Uploading: Attackers use uploading attack to leverage vulnerabilities related to web application, which allows for the uploading of malicious files such as malware code, backdoor, and so on to gain unauthorized access on the target application.
Cross-site Scripting (XSS): This attack enables the attacker to inject malicious client-side script into a web application that control the IoT devices. This script is executed by the user’s browser and it allows the attacker to steal sensitive information such as cookies, session tokens, and other sensitive data.
3.2. Data Preparation
Data preparation is a crucial step in developing ML models for IDS. In this study, this stage involves extracting relevant features from the dataset, data cleaning, and data scaling. In the first case, we used the features extracted from the dataset as provided by the authors of the datasets. This phase involves extracting relevant features from the raw packet data that are collected from the IoT network environment. In the case of CICIoT2023, 33 attacks were implemented in an IoT topology comprising 105 devices. Basically, the raw data are in the form of
.pcap files processed to extract relevant features for data analysis [
31]. After feature extraction, we performed data cleaning.
Data cleaning is an important step to ensure that the data used to develop machine learning models for IDS is free from redundant information in order to expedite the learning process when employing ML algorithms. This process basically involves removing irrelevant features that could negatively impact model performance, converting categorical features to numerical features, and addressing the missing values. In the case of CIC-IDS2017, one duplicate feature (i.e., Fwd Header Length) was removed from the dataset, leaving 77 features excluding the class label. Two features, FlowBytes and FlowPackets, have infinity values and these were converted to NaN. Furthermore, there are 308,381 duplicate samples out of 2,830,743 total samples in the dataset after merging the different files in the MachineLearningCVE directory. These duplicate values were removed and all missing values were filled using kNN imputation with 2 neighbours. The proportion of the missing values constitute 3128 samples after dropping the duplicate rows. Label encoding was employed to encode the class label (i.e., the target variable). The label-encoding method involves converting categorical variables into discrete numerical values. For instance, the benign class is assigned a numeric value of 0 while an attack is given a class of 1, as in the case of binary classification.
For the CICIoT2023 dataset, the data cleaning involves removing a total of 24,013,505 duplicate samples from the the dataset. This is to avoid bias and over-fitting during training and to ensure that the trained model can generalize to unseen samples [
35,
36]. This dataset contains about 53.34% of duplicate samples. The rate feature has infinity values, which was replaced with NaN. Thereafter, all missing values were filled using using kNN imputation with two neighbours. The proportion of the missing values constitute 1526 samples. Similarly, we applied the label-encoding method to encode the class label. For the purpose of clarity, we focused only on the binary classification task for this dataset by assigning all intrusion samples into attack class. Thus, we have both benign and attack classes.
Furthermore, for data scaling, we used Min–Max data normalization technique to minimize model bias. This is necessary because some features may have significantly larger values than others, potentially leading to biased model results. Equation (
1) shows how to compute the normalize values for the data using Min–Max which will generate new values for each column in the dataset in the close interval of [0, 1]. This technique ensures that features with smaller values are not overshadowed by those features that contain larger values for their columns, thereby producing a more balanced dataset for model development. For each dataset, a ratio of 70/30 percent is used for training and testing sets, respectively.
where
x is a specific value of a feature before scaling, min
and max
are the minimum and maximum observed value for the features, respectively, and
is the new normalized value for the feature.
3.3. Ensemble Algorithms
As discussed earlier, this study adopted five ensemble algorithms to develop classification models for IDSs in an IoT environment. Ensemble algorithms are powerful ML algorithms that combine predictions from multiple models to improve overall performance and robustness [
17]. By aggregating diverse models, ensemble algorithms reduce over-fitting, enhance accuracy, and handle data complexities better than individual models [
16]. There are three main types, bagging, boosting, and stacking. Bagging (Bootstrap Aggregating) creates multiple models in parallel using random subsets of the data and aggregates their predictions. A typical example is Random Forest, which is a popular bagging algorithm. Boosting builds models sequentially, where each new model corrects the errors of the previous weak learners. Boosting algorithms include Gradient Boosting, AdaBoost, and XGBoost among others. They are widely used for reducing bias and variance, yielding highly accurate models. Both bagging and boosting employ homogeneous classifier to build the final predictive model; hence, they are termed homogeneous ensemble methods. Conversely, stacking ensemble algorithms combine predictions from multiple base models with different architecture (i.e., heterogeneous) using a meta-model learner. In this study, we employed five ensemble algorithms which belong to both bagging and boosting methods.
Figure 3 gives the summary of the selected ensemble methods.
The five ensemble algorithms are Random Forest (bagging), AdaBoost (boosting), XGBoost (boosting), LightGBM (boosting), and CatBoost (boosting). The justification for adopting these classification methods is their performances as reported in different domains including IDS [
16]. In addition, this study integrates model explainability in the proposed framework by leveraging ensemble methods that use decision trees as the default weak learners, where in this case bagging and boosting methods are ideal candidates for our selection.
3.3.1. Random Forest
Random Forest is a highly effective and versatile machine learning algorithm known for its accuracy and adaptability to diverse datasets. As an ensemble method, it combines predictions from multiple decision trees using the bagging technique, where trees are trained on bootstrap subsets of data [
10]. Each node in a tree selects the best predictor randomly, adding a layer of randomness that enhances robustness against over-fitting. Random Forest builds numerous decision trees, each contributing to the final prediction through majority voting for classification tasks. As the number of trees increases, the generalization error stabilizes, ensuring consistent performance. Notably, Random Forest often delivers promising results with minimal parameter tuning, such as controlling tree depth or the number of instances per node. Its resilience to noise and over-fitting makes it widely applicable across domains. For model training, Random Forest operates in
, where
t is the number of trees in the forest,
m is the number of features, and
n is the number of training samples. This algorithm operates in
when used for inferencing (i.e., for classification), where
d is the depth of the trees. This can be approximated to
in balanced trees. This complexity makes Random Forests efficient for many practical applications. Nevertheless, as the number of trees or the size of the dataset increases, the computational cost may become significant. Therefore, it is important to investigate both the training and inference times of each ensemble algorithm based on the two datasets employed in this study to understand their practical implications for IoT environments. In
Section 4, we provide a detailed analysis of these training and inference times for each ensemble algorithm.
3.3.2. AdaBoost
Adaptive Boosting (AdaBoost) is a an ensemble learning algorithm designed to improve weak learners by sequentially combining them into a strong classifier. Unlike Random Forest, AdaBoost assigns weights to training instances, focusing on samples misclassified by previous iterations as presented in
Figure 3. Each weak learner is trained to correct these errors, and the final model aggregates predictions with weighted voting based on the learners’ accuracy [
37]. AdaBoost dynamically adjusts to challenging data points, focusing on those harder to classify. While sensitive to noisy data and outliers, its adaptability and simplicity make it effective for binary and multi-class classification tasks. Adaboost has
computational complexity for model training, where
t, in this case, represents the number of weak learners,
n is the number of training samples, and
m is the number of features. For inference, the algorithm has
complexity, where
d is the depth of the trees.
3.3.3. XGBoost
Extreme Gradient Boosting (XGBoost) is a highly efficient and scalable ensemble algorithm designed for supervised learning tasks. It extends traditional boosting by employing a gradient-boosted decision tree (GBDT) framework optimized for performance and flexibility [
38]. XGBoost builds models iteratively, where each new tree minimizes a custom loss function by adjusting weights and improving predictions. The objective function in XGBoost is a combination of loss and regularization as given in Equation (
2)
where
is the loss function, measuring the difference between predictions
and the actual targets
.
regularizes the complexity of the model as defined by:
where
T is the number of leaves,
w is the leaf weights, and
and
are regularization parameters. XGBoost uses techniques like tree pruning and parallel processing, and it can handle sparse data. XBGoost operates in
, where
t is the number of the trees,
d is the depth of the tree,
x is the number of non-missing entries in the training data, and
n is the number of training samples. For model inference, XGBoost operates in
in the worst case and
for a balanced tree, where
l is number of leaves in a tree. The algorithm employed a histogram-based split method to optimize its computational cost. XGBoost also introduces a sparsity-aware approach for parallel tree learning [
39]. This characteristic makes XGBoost a useful candidate for real-time applications such as for IDS deployment in IoT environment.
3.3.4. LightGBM
Light Gradient Boosting Machine (LightGBM) is a high-performance ensemble algorithm for gradient boosting that specializes in speed and efficiency. It constructs decision trees sequentially by optimizing an objective function. A key innovation in LightGBM is the leaf-wise tree growth algorithm, which splits the leaf with the highest loss reduction, as opposed to level-wise splitting. This approach yields deeper trees and better accuracy while maintaining computational efficiency [
40]. The worst-case computational complexity of LightGBM is
, where
t is the number of trees,
n is the number of training samples,
b is the number of histogram bins, and
d is the maximum depth of each tree. The worst-case inference time takes
while for a balanced tree, it has
, where
l is the number of leaves per tree. The use of histogram binning and leaf-wise growth makes LightGBM a faster algorithm to train large datasets, making it applicable for real-time applications like IDS for IoT environments [
40].
3.3.5. CatBoost
Categorical Boosting (CatBoost) is a gradient boosting framework designed to handle categorical data efficiently without requiring extensive preprocessing like one-hot encoding. It builds decision trees sequentially while minimizing a custom loss function. One of the main features of CatBoost is its Ordered Boosting, which prevents over-fitting by using permutation-based sampling during training. It also implements symmetry constraints in tree structures to accelerate learning and maintain robust generalization. Its ease of use and ability to reduce over-fitting make it one of the preferred ensemble algorithms for gradient boosting [
41]. Similarly, CatBoost operates in
, where
t is the number of trees,
n is the number of training samples,
b is the number of bins (used for feature quantization), and
d is the maximum depth of each tree. The inference time also takes
in the worst case. CatBoost uses ordered boosting to reduce over-fitting and speeds up training process; it enhances performance for large datasets [
42], making it applicable for an IDS in the IoT.
3.4. Classification
This study focuses on developing a classification model that can be deployed to detect intrusion in an IoT network. While a majority of the studies in the literature focused on deploying only binary classification approach for IDS, we evaluate the proposed framework using both binary and multi-class classification tasks. The binary classification entails grouping all the attacks in the two datasets into benign and attack categories. The multi-class classification develops ML models to detect different types of attacks such as DDoS, Bot, Infiltration, PortScan, and so on. It is important to mention that we implement both binary and multi-class classification on the CIC-IDS2017 dataset and binary classification on the CICIoT2023 dataset. The purpose is to evaluate the proposed framework across different scenarios while also maintaining promising performance considering the different classification algorithms.
3.5. Evaluation Metrics
This study employed different evaluation metrics to evaluate the performance of the proposed framework. We used evaluation metrics such as accuracy, precision, recall, F1-score, AUC-ROC, and MCC. These metrics are computed based on the confusion matrix that consists of true positive (TP), true negative (TN), false positive (FP), and false negative (FN) as the elements of the matrix. TP is the number of attacks that are correctly predicted as attacks. TN is the number of normal (i.e benign) cases that are correctly predicted as normal. FN is the number of attacks that are mistakenly predicted as normal while FP is the number of normal cases that are wrongly predicted as attacks.
Given the different elements of the confusion matrix, several evaluation metrics can be computed as follows. For instance, accuracy is the percentage of correctly classifies attack and normal cases. This is computed by dividing the number of correct predictions over the data by the total number of predictions as follows:
In the context of intrusion detection, precision evaluates how accurately the model identifies actual intrusions among all flagged events. It is calculated by dividing the number of correctly detected intrusions (TP) by the total number of events flagged as intrusions (both TP and FP). A high precision value indicates that the model minimizes false alarms while accurately detecting genuine intrusions. Precision is calculated as:
Recall metric measures how effectively the model identifies all actual intrusion attempts. It is calculated by dividing the number of correctly detected intrusions (TP) by the total number of actual intrusions, which includes both TP and missed intrusions (FN). A high recall indicates the model’s ability to minimize undetected intrusions, ensuring most security breaches are flagged. Recall is calculated as:
F1-score is the ratio of recall and precision. It determines the harmonic mean of precision and recall. F1-score is a metric that balances precision and recall to provide a single measure of a model’s performance. It is particularly useful when both FP (false alarms) and FN (missed intrusions) are critical. It is also useful to measure model performance in the presence of imbalanced data distribution, which is the case of the two datasets that we employed in this study. This metric is calculated as:
The AUC-ROC metric is the area under the ROC curve. It sums up how well a model can produce relative scores to discriminate between intrusion or normal events across all classification thresholds. The value of AUC-ROC ranges between 0 and 1, where
means a random guess, and 1 signifies a perfect prediction result. The last performance metric, MCC, is a statistical metric that evaluates the quality of classification models by considering all elements of the confusion matrix (i.e., TP, TN, FP, and FN). It provides a balanced measure even for imbalanced datasets, as it accounts for the proportionality of intrusion and normal events. The MCC yields a value between
and
, where
indicates perfect predictions, 0 suggests no better accuracy than random guessing, and
reflects total disagreement between predictions and actual outcomes. This metric is calculated as:
In addition, we reported the False-Positive Rate (FPR) and False-Negative Rate (FNR) of each model. We also computed the training and inference time to evaluate the applicability of the models for IoT environments.
3.6. Model Explanation
This study integrates model explainability in the proposed framework. It extends existing studies by providing model transparency and explainability, a feature that has been less addressed by the existing studies on IDS in IoT. To achieve this goal, we integrate rule induction for model explanation in the proposed framework (see
Figure 1. Explainable Artificial Intelligence (XAI) is the field of AI that provides explanations for model decisions [
43]. This is to enforce transparency and trust as well as to promote human-understandable explanations for decision support. This study adopts a rule-induction method to provide model explanation. Rule induction is a ML technique used to extract interpretable and human-readable rules from datasets or ML models [
44,
45]. These rules, often in the form of
if–then statements, describe patterns and relationships within the data. The goal of rule induction is to create a concise set of rules that accurately represent the decision-making process while maintaining clarity.
By transforming data or model outcomes into understandable insights, this will promote transparency and trust regarding what constitute intrusion or normal events. Since the ensemble algorithms considered in this study employed decision trees as their weak learners, we integrate Algorithm 1 into the proposed framework, which induces rules from a decision-tree model. This helps us to gain better understanding of the decisions from the classification algorithms in the form of
if–then rules.
| Algorithm 1: Rule Induction for Model Explanation |
![Sensors 25 01845 i001]() |
Algorithm 1 begins by taking the trained decision-tree model (i.e., tree), features used to train the model, and the target classes. In the case of binary classification, the target class is either 0 or 1 (i.e., benign or attack). A list containing all the feature names extracted from the trained decision-tree model is created along with two variables to keep track of the rules. A recursive process is then established to traverse both the left and right parts of the decision tree. The process continues until all the features have been expanded. The generated paths in the form of list are iterated to produce concatenated
if–then rules with their corresponding number of samples covered by the rules, as well as the accuracy of coverage in the form of probabilities. In terms of computational complexity, Algorithm 1 operates in
, where
n is the number of nodes and
d is the depth of the tree. Since we leverage the built-in feature selection of the decision-tree algorithm, it is expected that the algorithm will use minimal number of features to construct the decision tree for rule induction, which will speed up the rule-extraction process. In addition, the maximum depth of the tree was controlled during the modeling stage based on the hyperparameter of the ensemble algorithm to reduce model complexity. Hence, the rule-induction algorithm is applicable in IoT environments. This approach enables us to provide explanations for the decision to classify an event as intrusion or benign from the trained decision-tree model. We validate the algorithm in
Section 4.2.3.
3.7. Experimental Setup
In this study, different experiments were conducted to ascertain the efficacy of the proposed framework. Regarding the hyperparameters of each classification algorithm, we set the number of estimators of the ensemble algorithms to 100. The learning rate of AdaBoost was set to 1. XGBoost max-depth, subsample, and eta were set to 6, 0.5, and 0.3, respectively. The remaining hyperparameters of the algorithms were used in their default settings. These configurations yielded promising results in our case. The data were split into a 70/30 train–test ratio, where 70% was used to train the ensemble algorithms and 30% was used for testing.
As stated earlier, this study evaluated the performance of the proposed framework based on two publicly available IoT datasets for intrusion detection. All experiments have been performed on MacBook Pro with Apple M2 chip and 16 GB RAM. The ML algorithms were implemented in Conda environment.
5. Conclusions and Future Work
This paper addressed the challenges of detecting intrusion within IoT network by proposing a framework that incorporates ensemble learning and model explainability to address both binary and multi-class classification problems. This study contributes a scalable, explainable IDS framework for IoT networks. Five ensemble algorithms, namely, Random Forest, AdaBoost, XGBoost, LightGBM, and CatBoost, have been studied. To address model explainability, this study integrates a rule-induction method into the proposed framework. The model explainability is based on rule induction from a decision tree, which is the core weak learner of the ensemble algorithms that were considered in this study. Through rigorous experiments to ascertain the performance of the proposed framework, the results show that XGBoost classifier produced the best results. The classification results for both binary and multi-class classification on two publicly available intrusion detection datasets further confirmed that the proposed framework maintained good performance based on the different evaluation metrics and as compared with the state-of-the-art studies. The models’ low inference times make the proposed framework suitable for resource-constrained devices.
The induced rules from the rule-induction algorithm will help not only security analysts and other stakeholders in smart homes, but also help the end-users to understand the decisions made by an IDS system under different circumstances, and to identify network intrusions. Model explainability is crucial for providing an understanding of how an IDS system works, and of how its decisions are made. Our method promotes a better accuracy and a higher level of transparency in the presence of different attack scenarios (i.e., for both binary and multi-class cases).
However, the scalability of our approach to massive IoT networks remains untested. Future work should focus on deep learning methods in connection to Local Interpretable Model-agnostic Explanations (LIME) and SHapley Additive exPlanations (SHAP). The possibility of integrating LIME and SHAP with our proposed framework can be investigated in future research, since both methods provide model-agnostic explanations. In addition, we will focus on exploring more IoT datasets to broaden the understanding of the different attacks and how to effectively explain their patterns based on a robust model explainability approach. Furthermore, a more user-friendly way of presenting attack explanations, such as natural language descriptions, could be interesting to consider.


