
Research on a Novel AC/DC Hybrid Microgrid Based on Silicon Controlled Converters and Polarity Reversal Switches

 , ,
, ,
Abstract
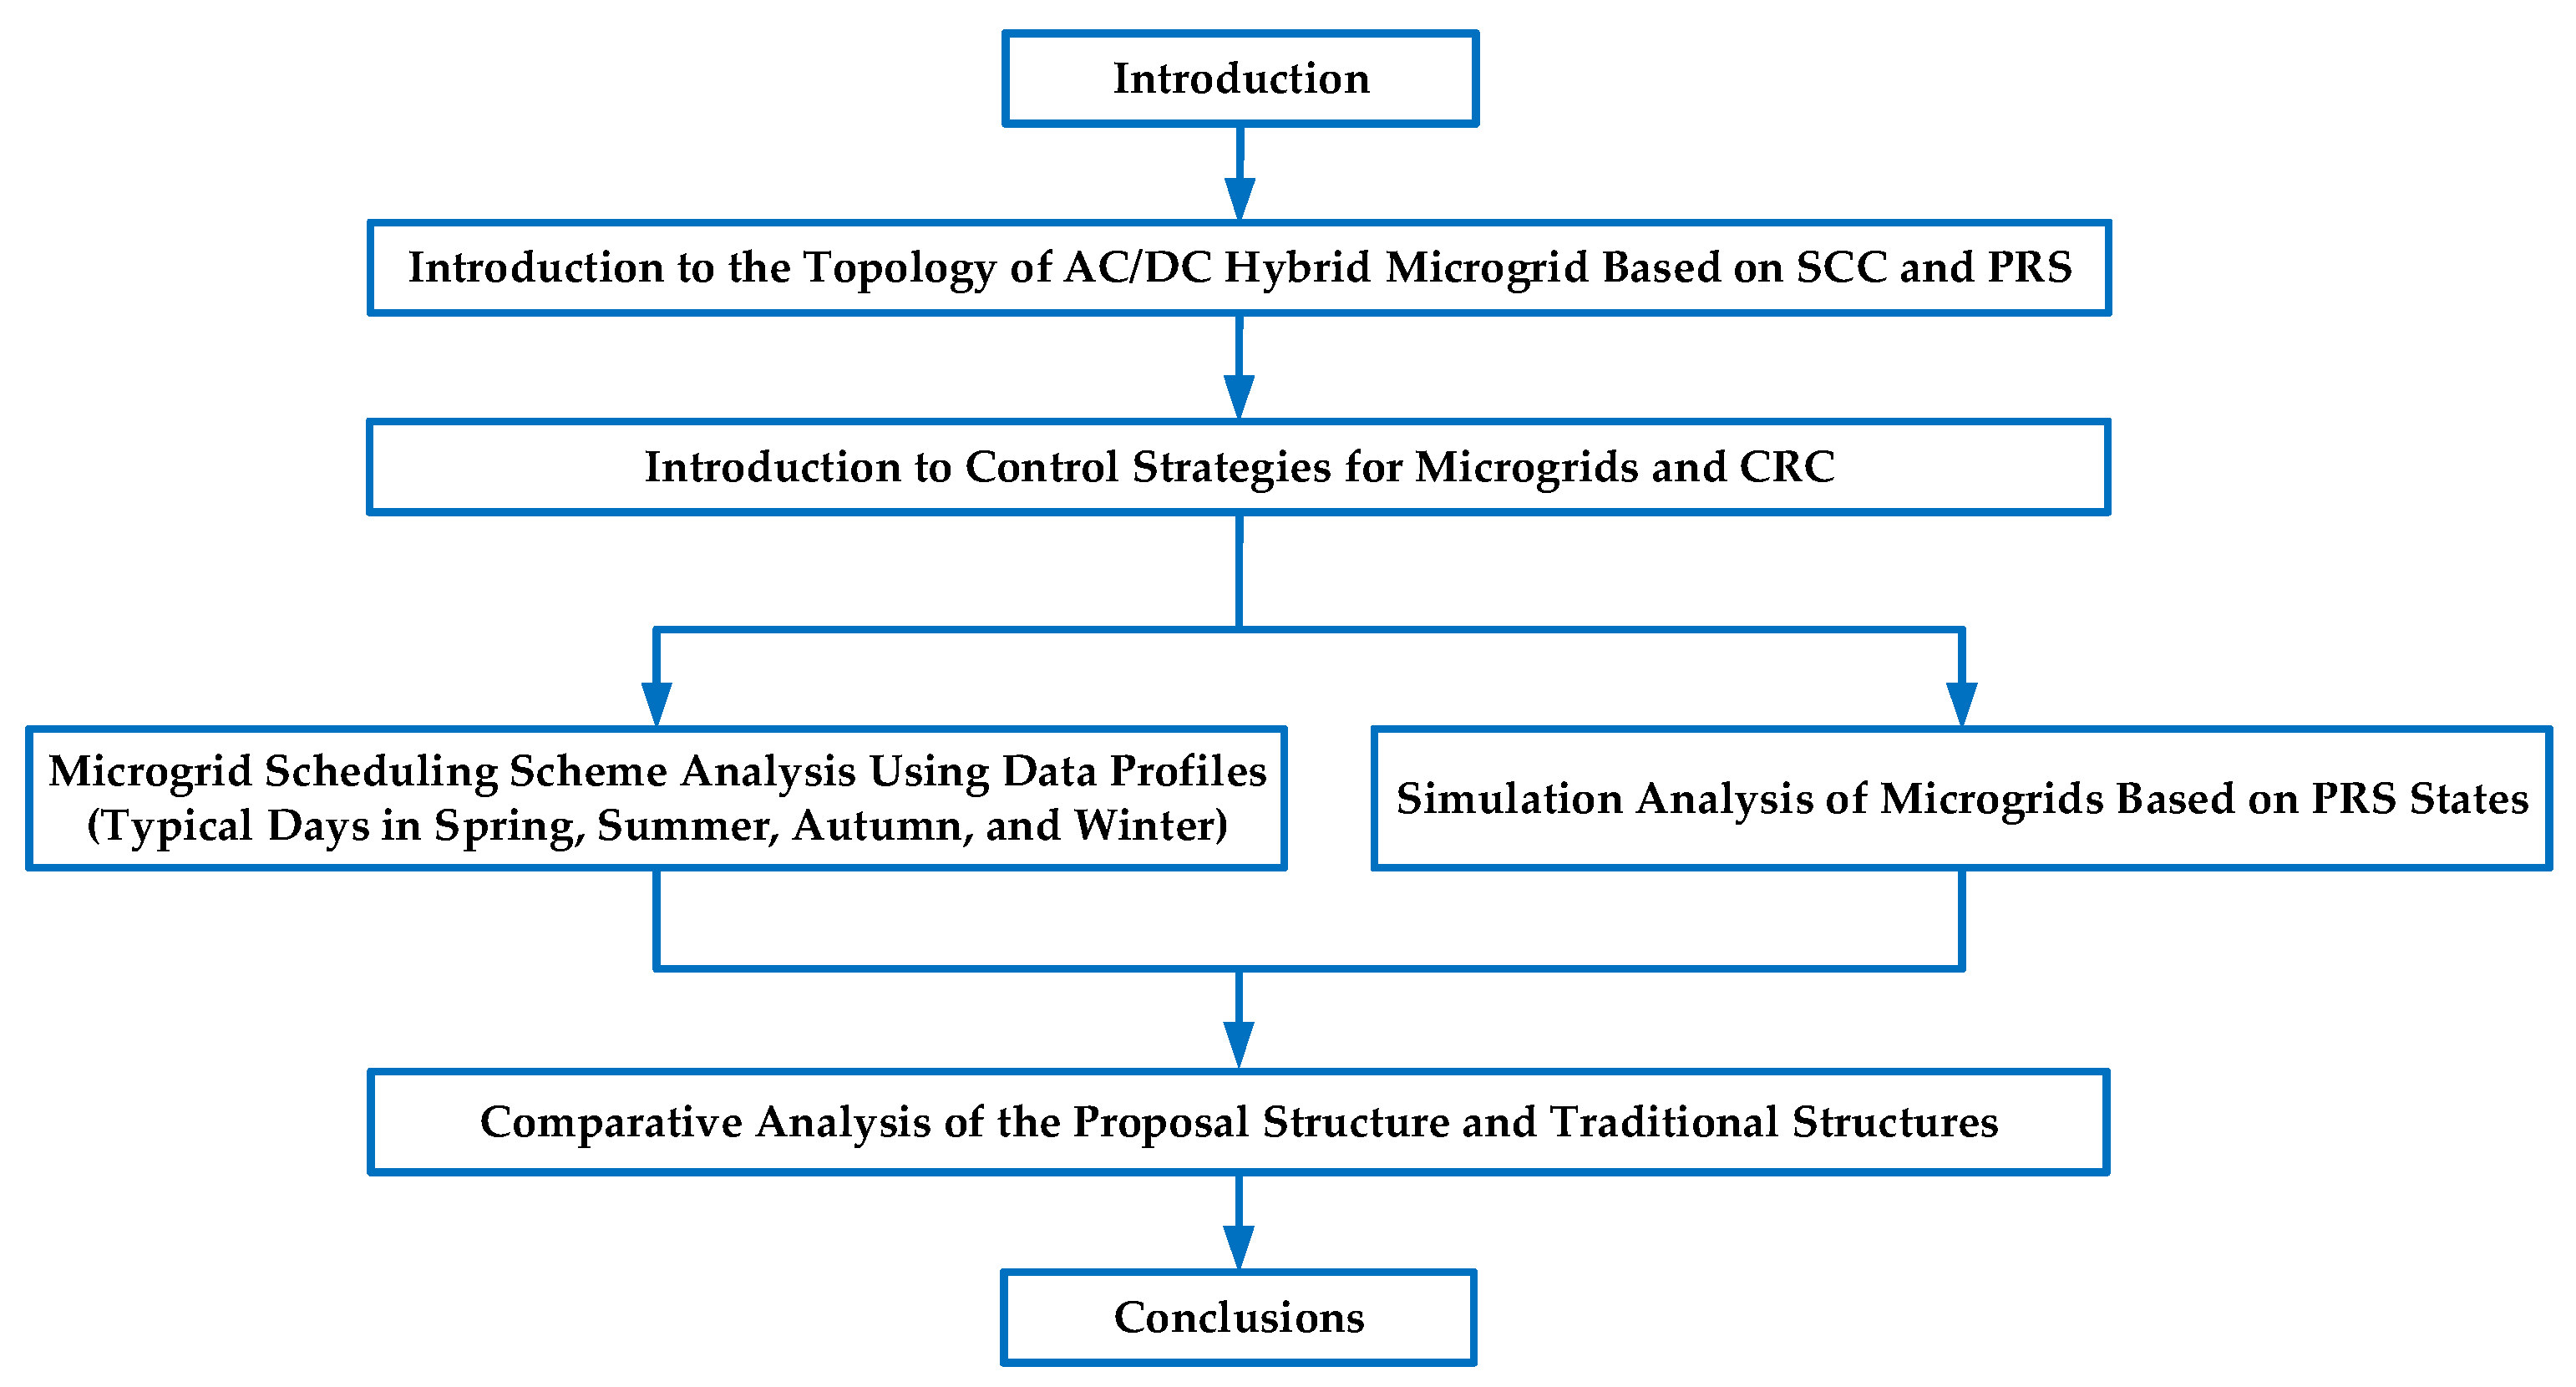
1. Introduction
- This paper proposes a novel AC/DC hybrid microgrid structure based on the SCC and PRS, with detailed control strategies for different PRS states.
- This paper studies the wind–PV-ESS coordinated configuration scheme for typical days throughout the four seasons, discusses the control strategy of PRS for these typical days, and verifies the feasibility of the proposed novel microgrid structure through simulations.
- This paper enhances the energy efficiency of the microgrid by reducing conversion losses, stabilizing voltage, and improving the absorption capacity of renewable energy, ultimately resulting in cost savings and reduced reliance on external grids.
2. Principle of the AC/DC Hybrid Microgrid Based on the SCC and PRS
2.1. Topology of the AC/DC Hybrid Microgrid Based on the SCC and PRS
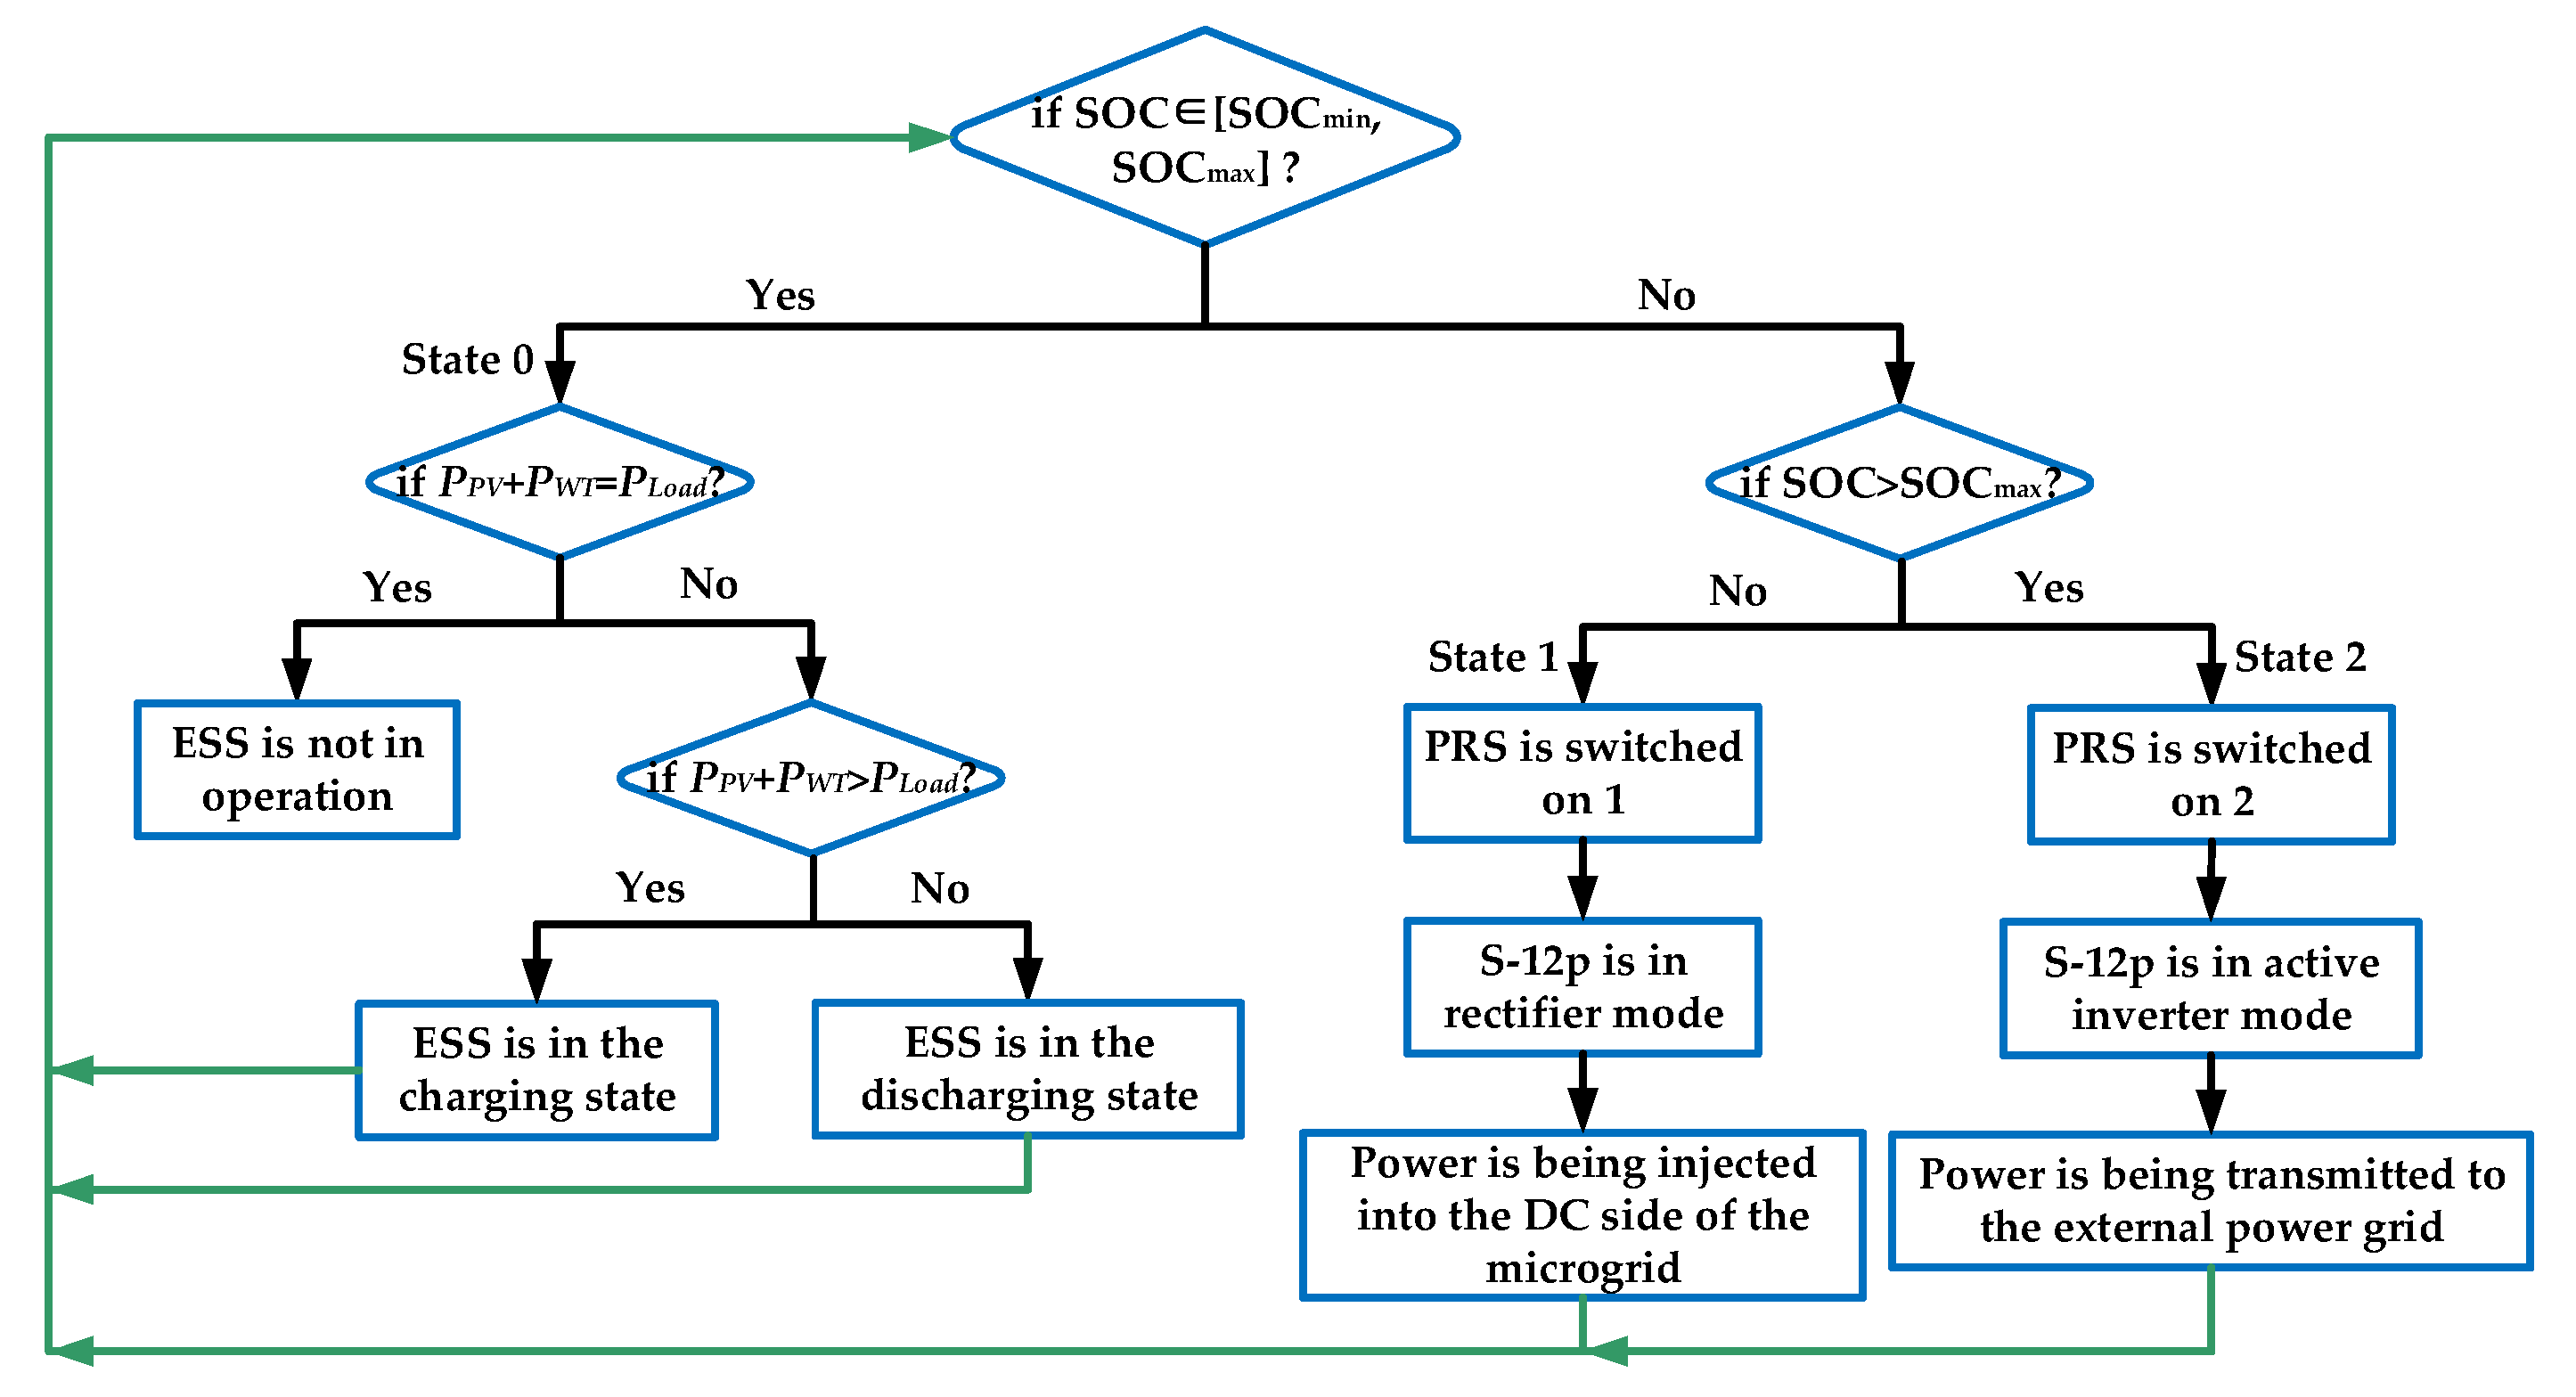
2.2. Control Strategy of the AC/DC Hybrid Microgrid Based on the SCC and PRS
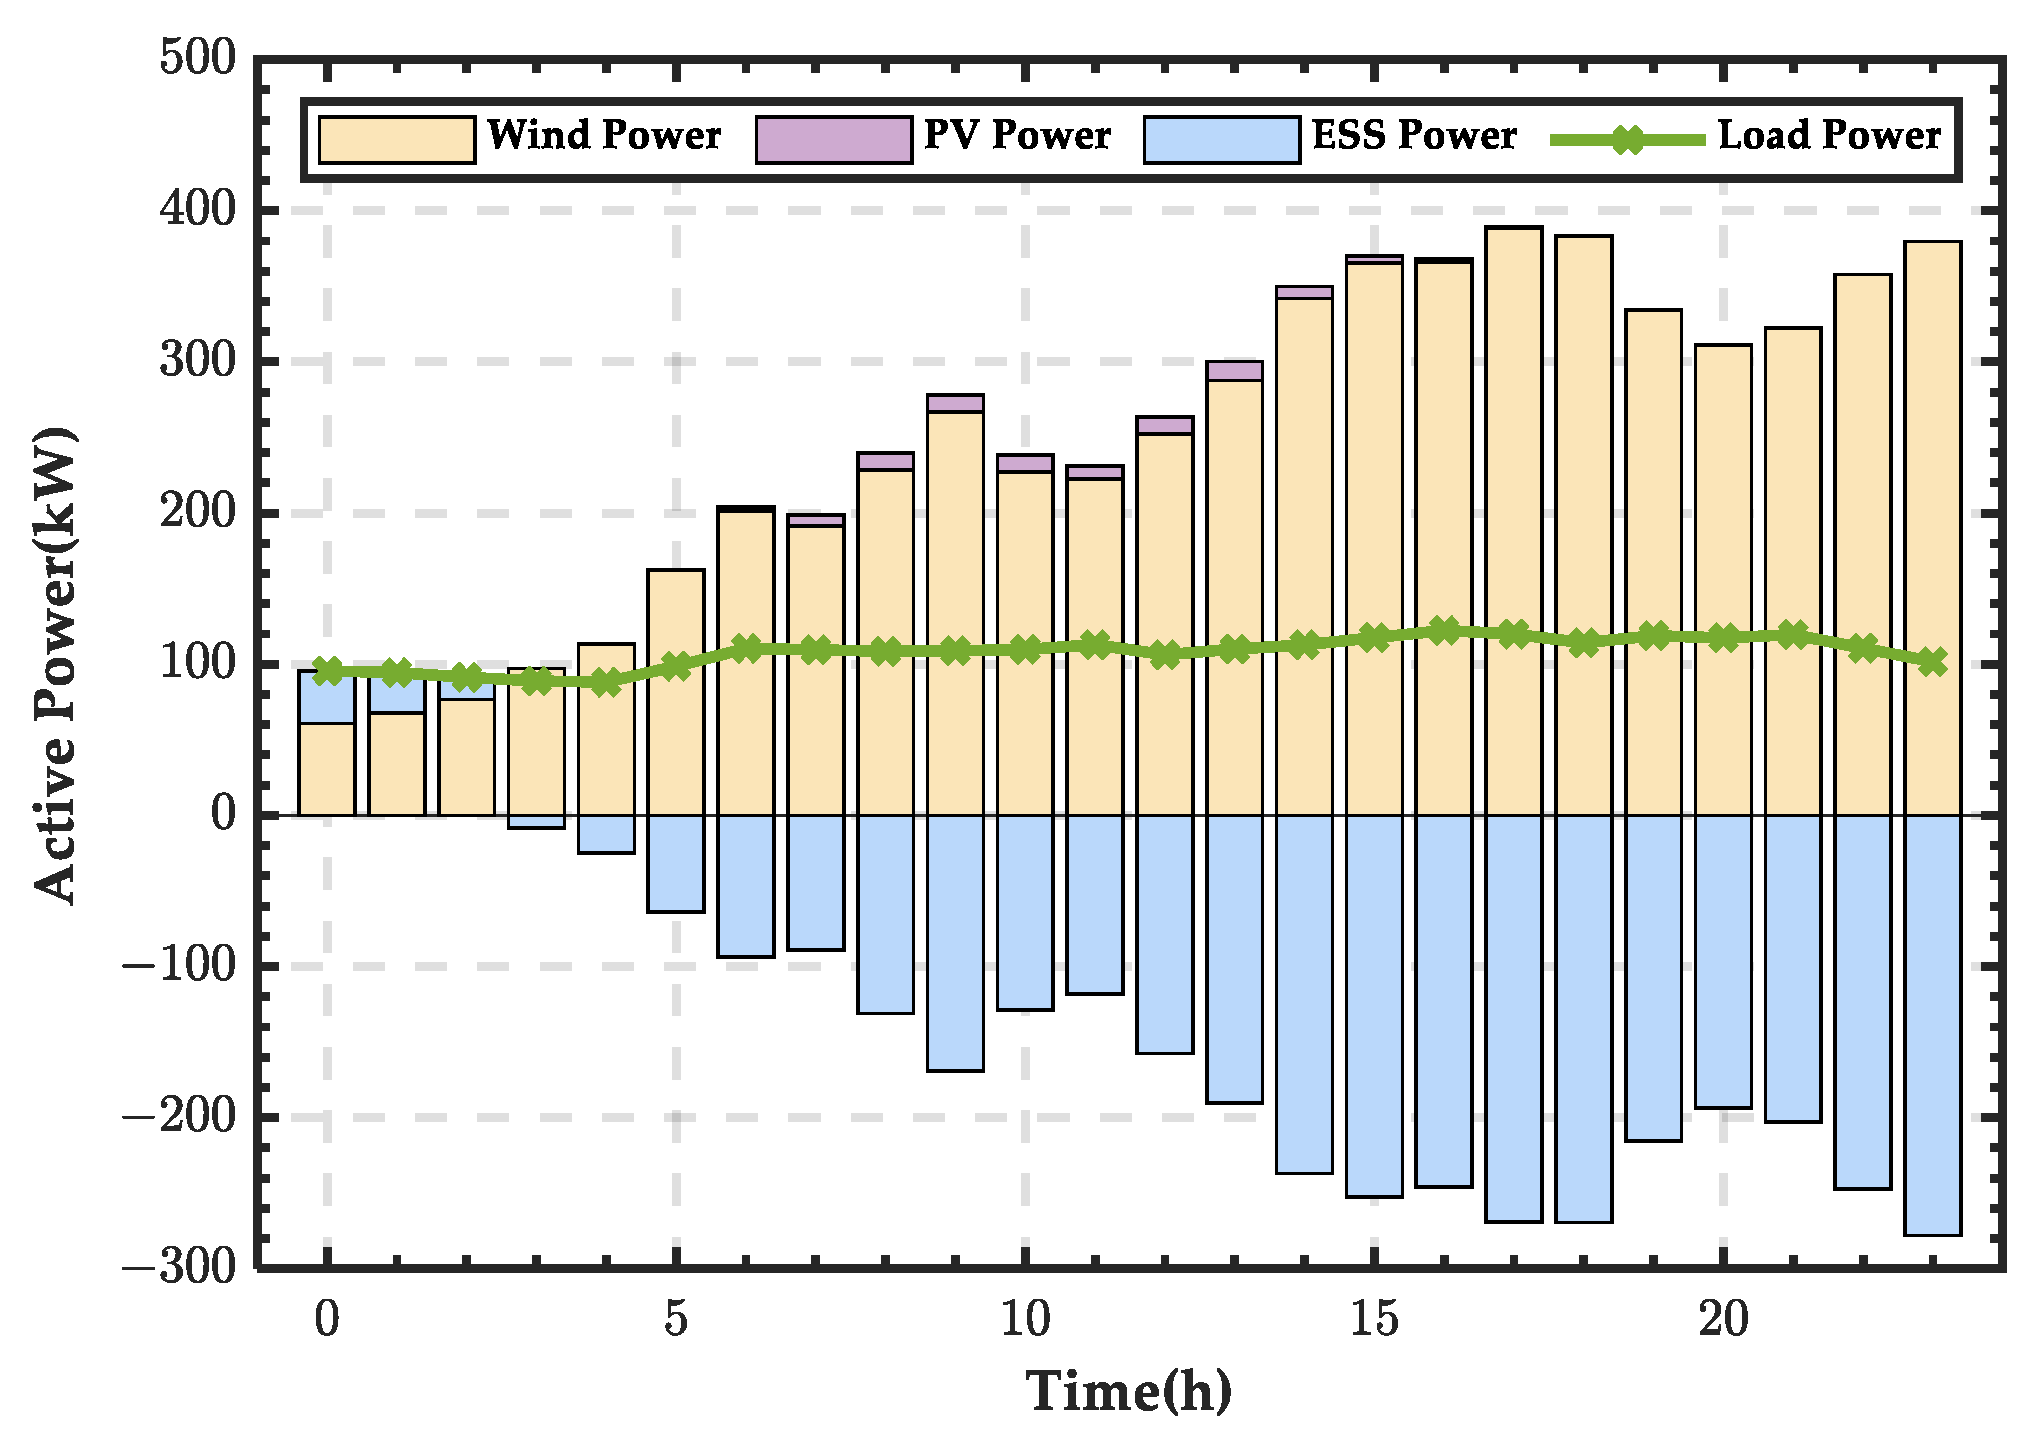
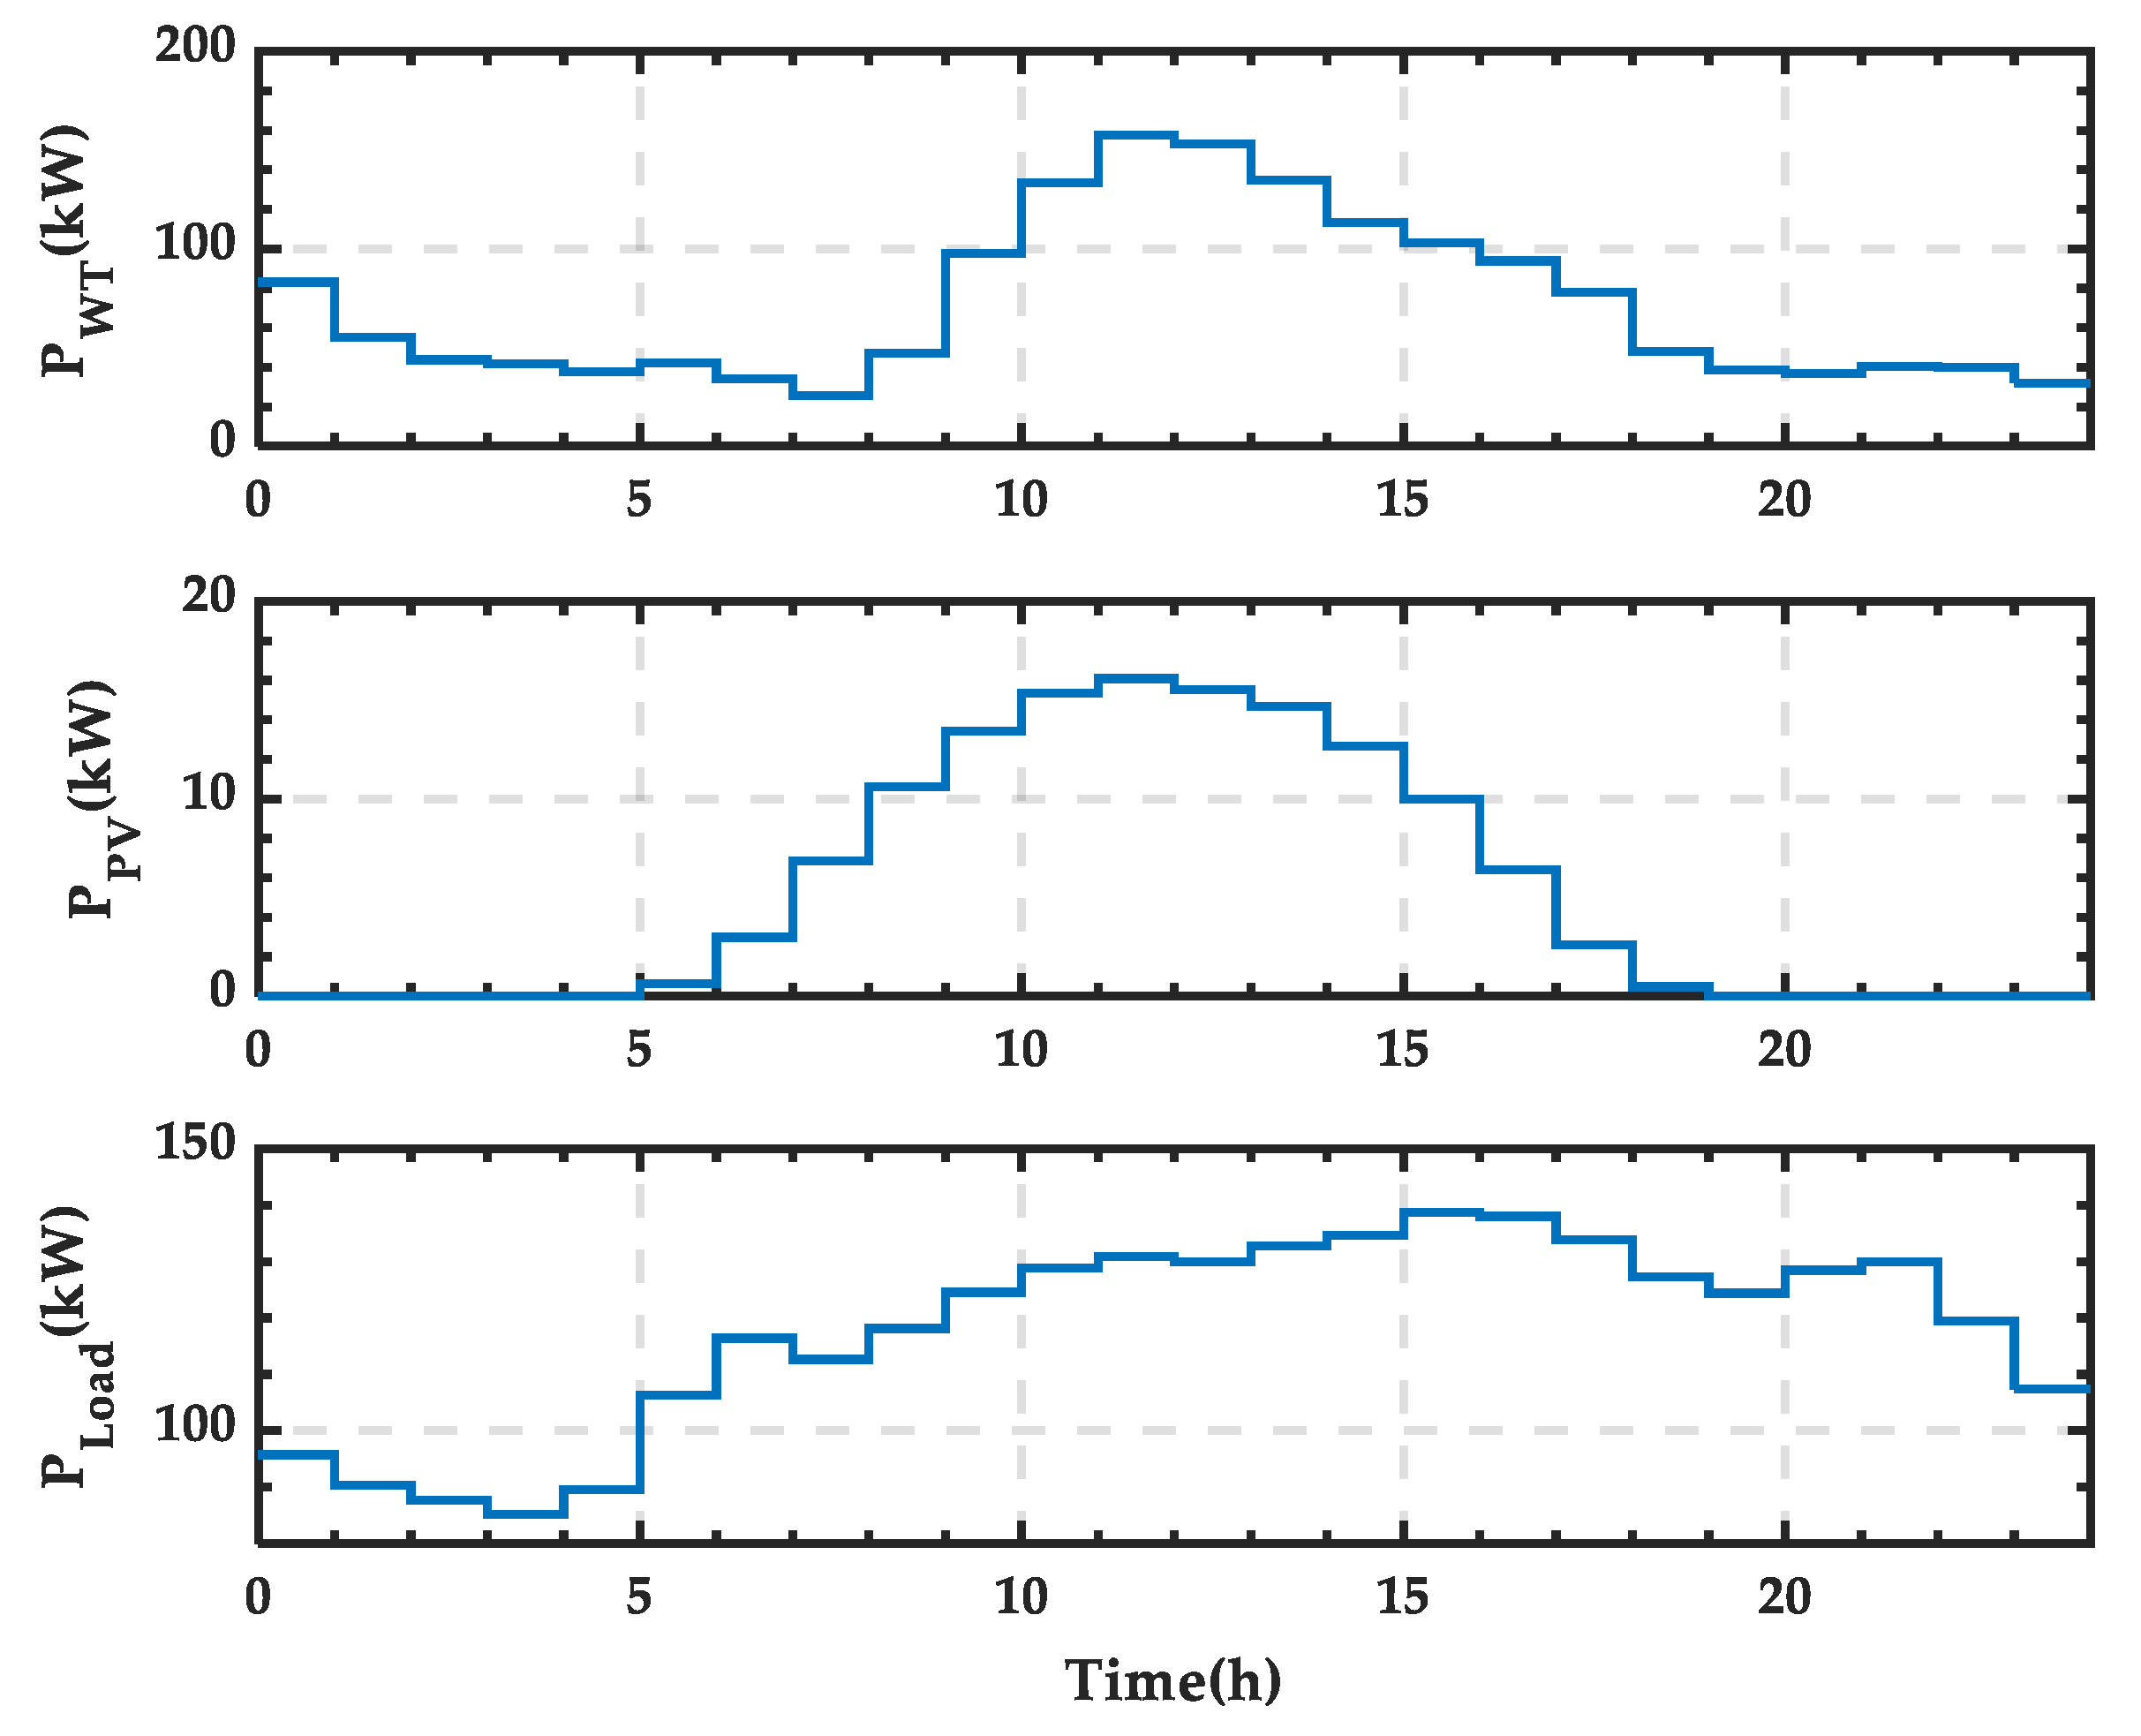
3. Microgrid Scheduling Scheme Analysis Using Data Profiles
3.1. Typical Day in Spring
3.2. Typical Day in Summer
3.3. Typical Day in Autumn
3.4. Typical Day in Winter
3.5. Comparison and Analysis of Microgrid Energy on Typical Days
4. Microgrid Simulation Analysis
4.1. Simulation Analysis When PRS Is in State 0
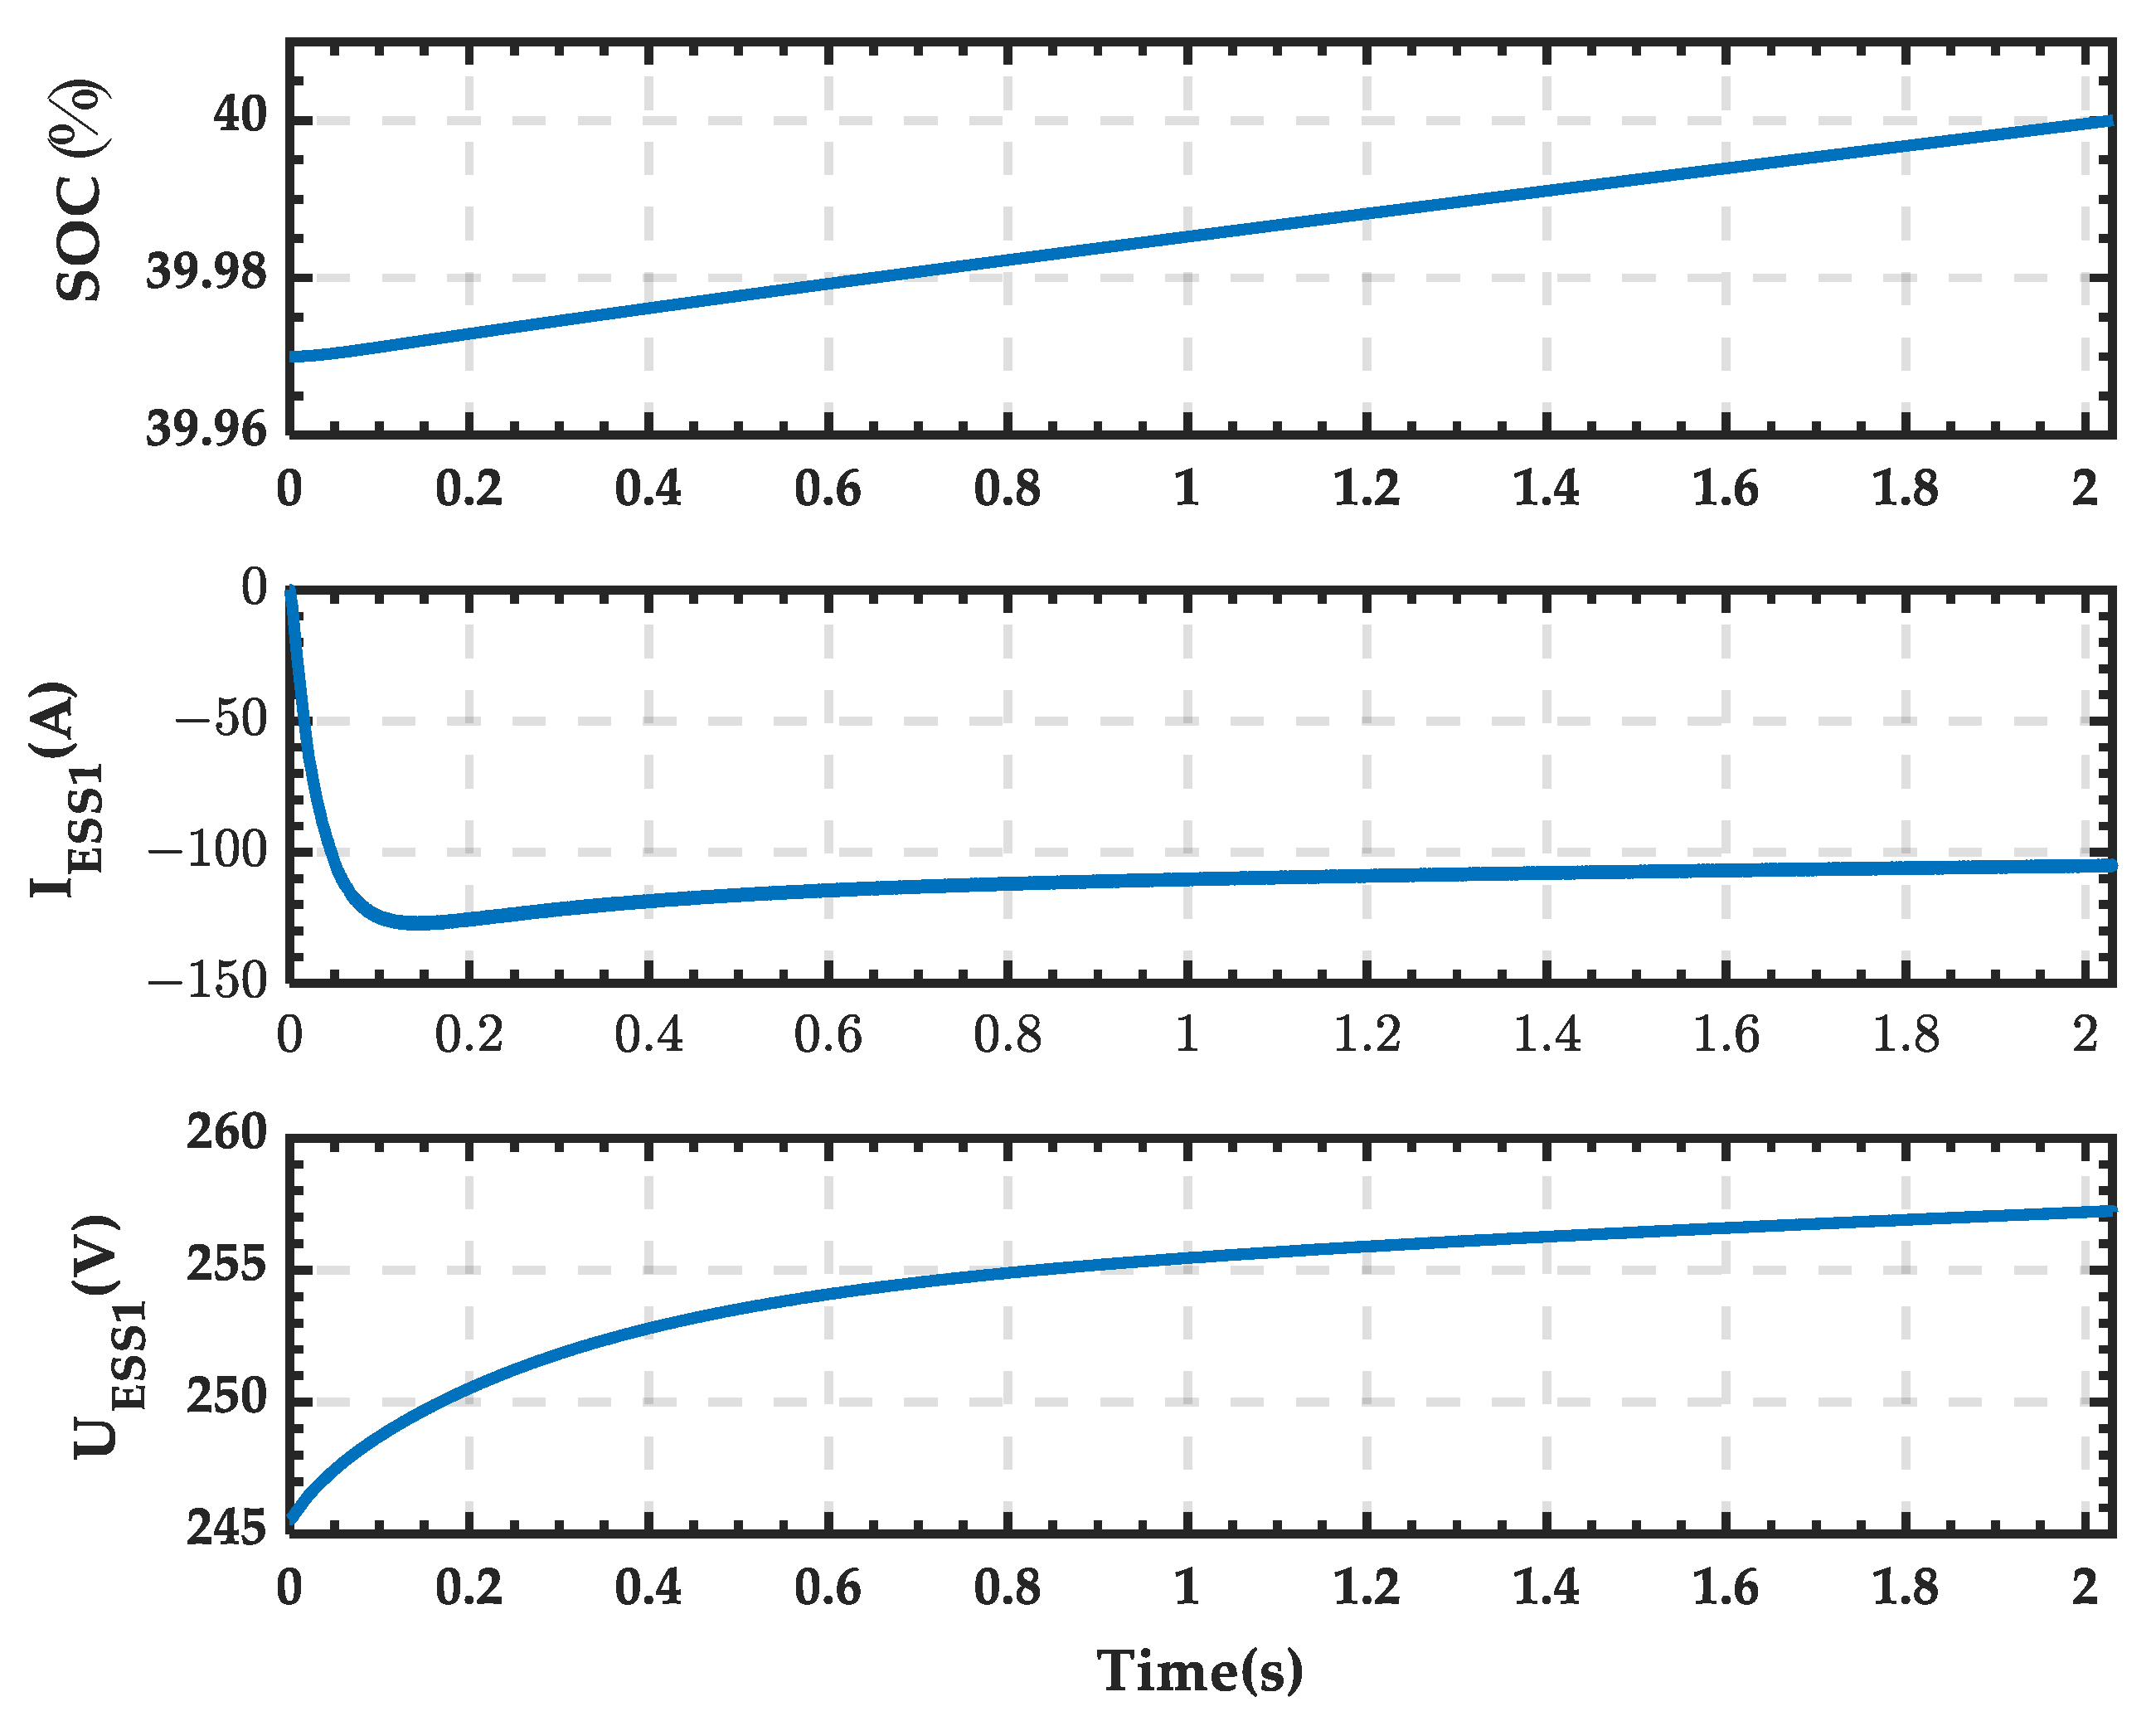
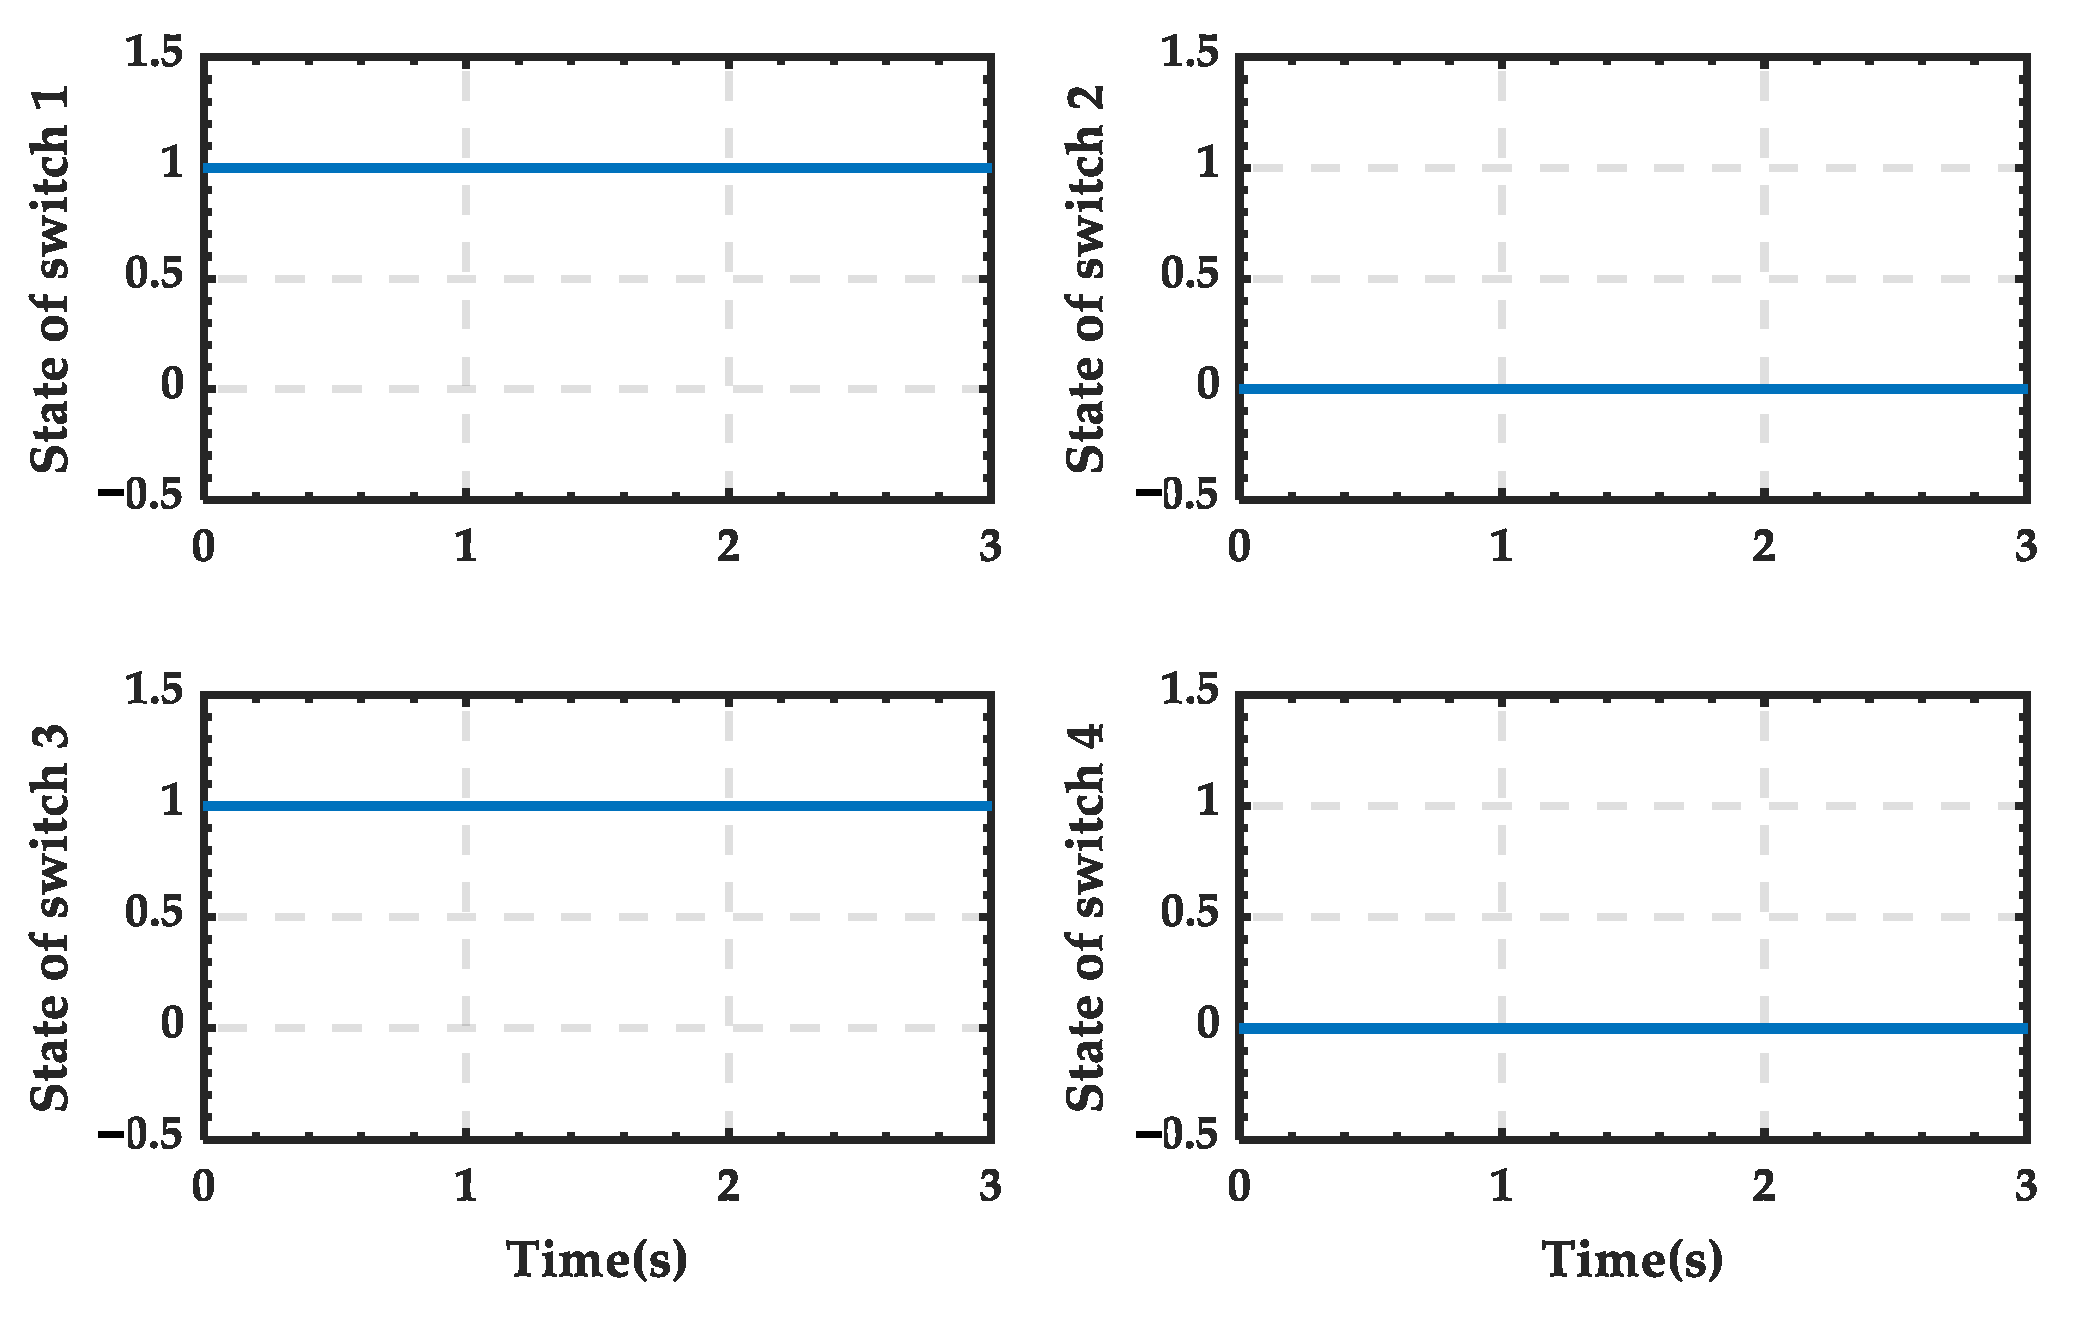
4.2. Simulation Analysis When PRS Is in State 1
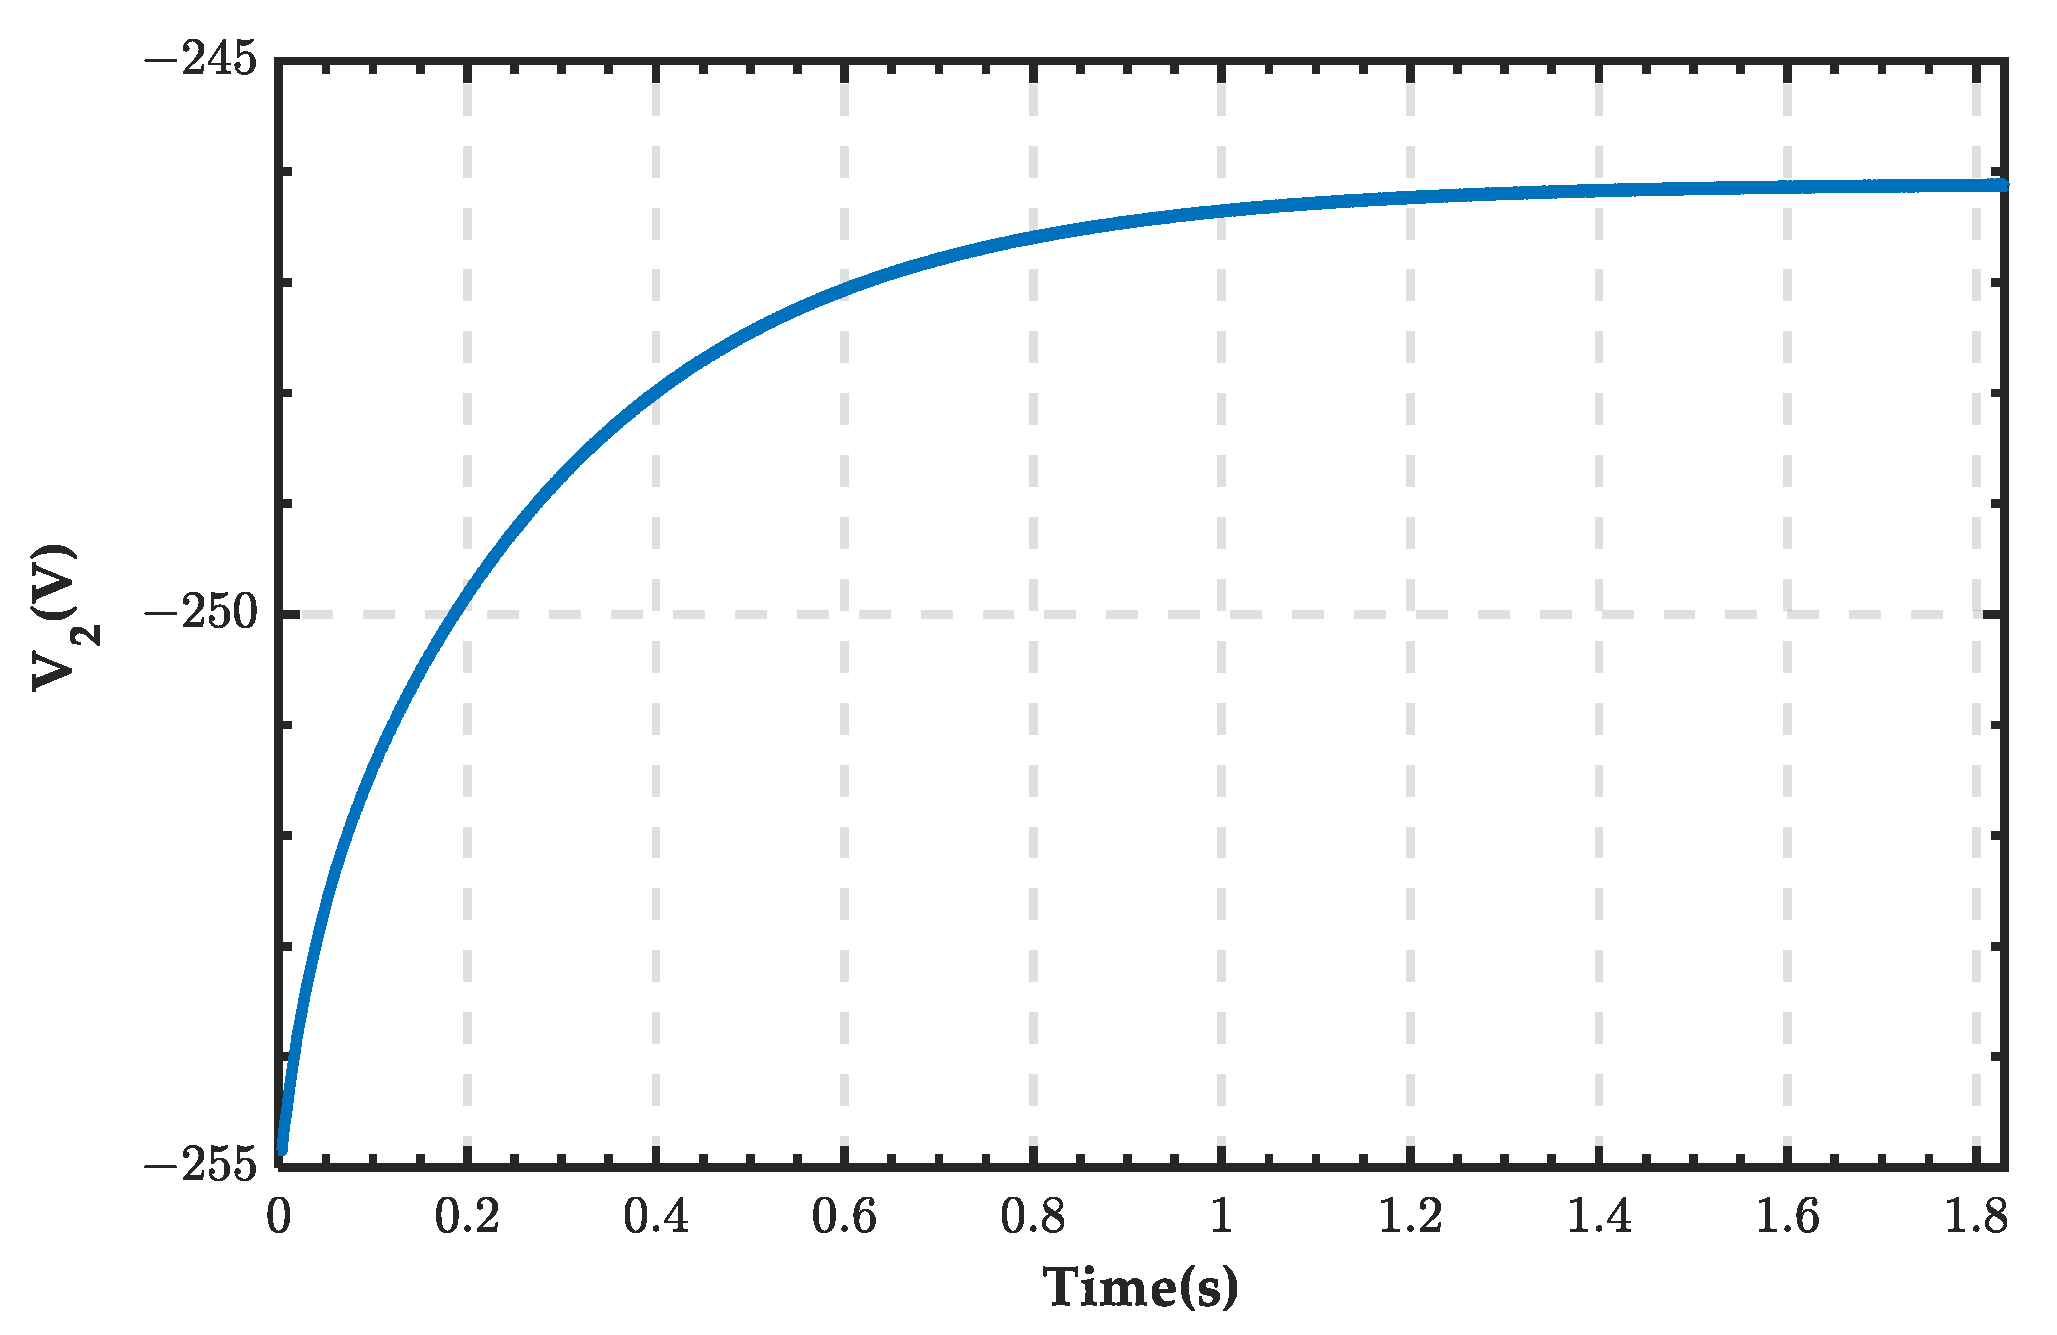
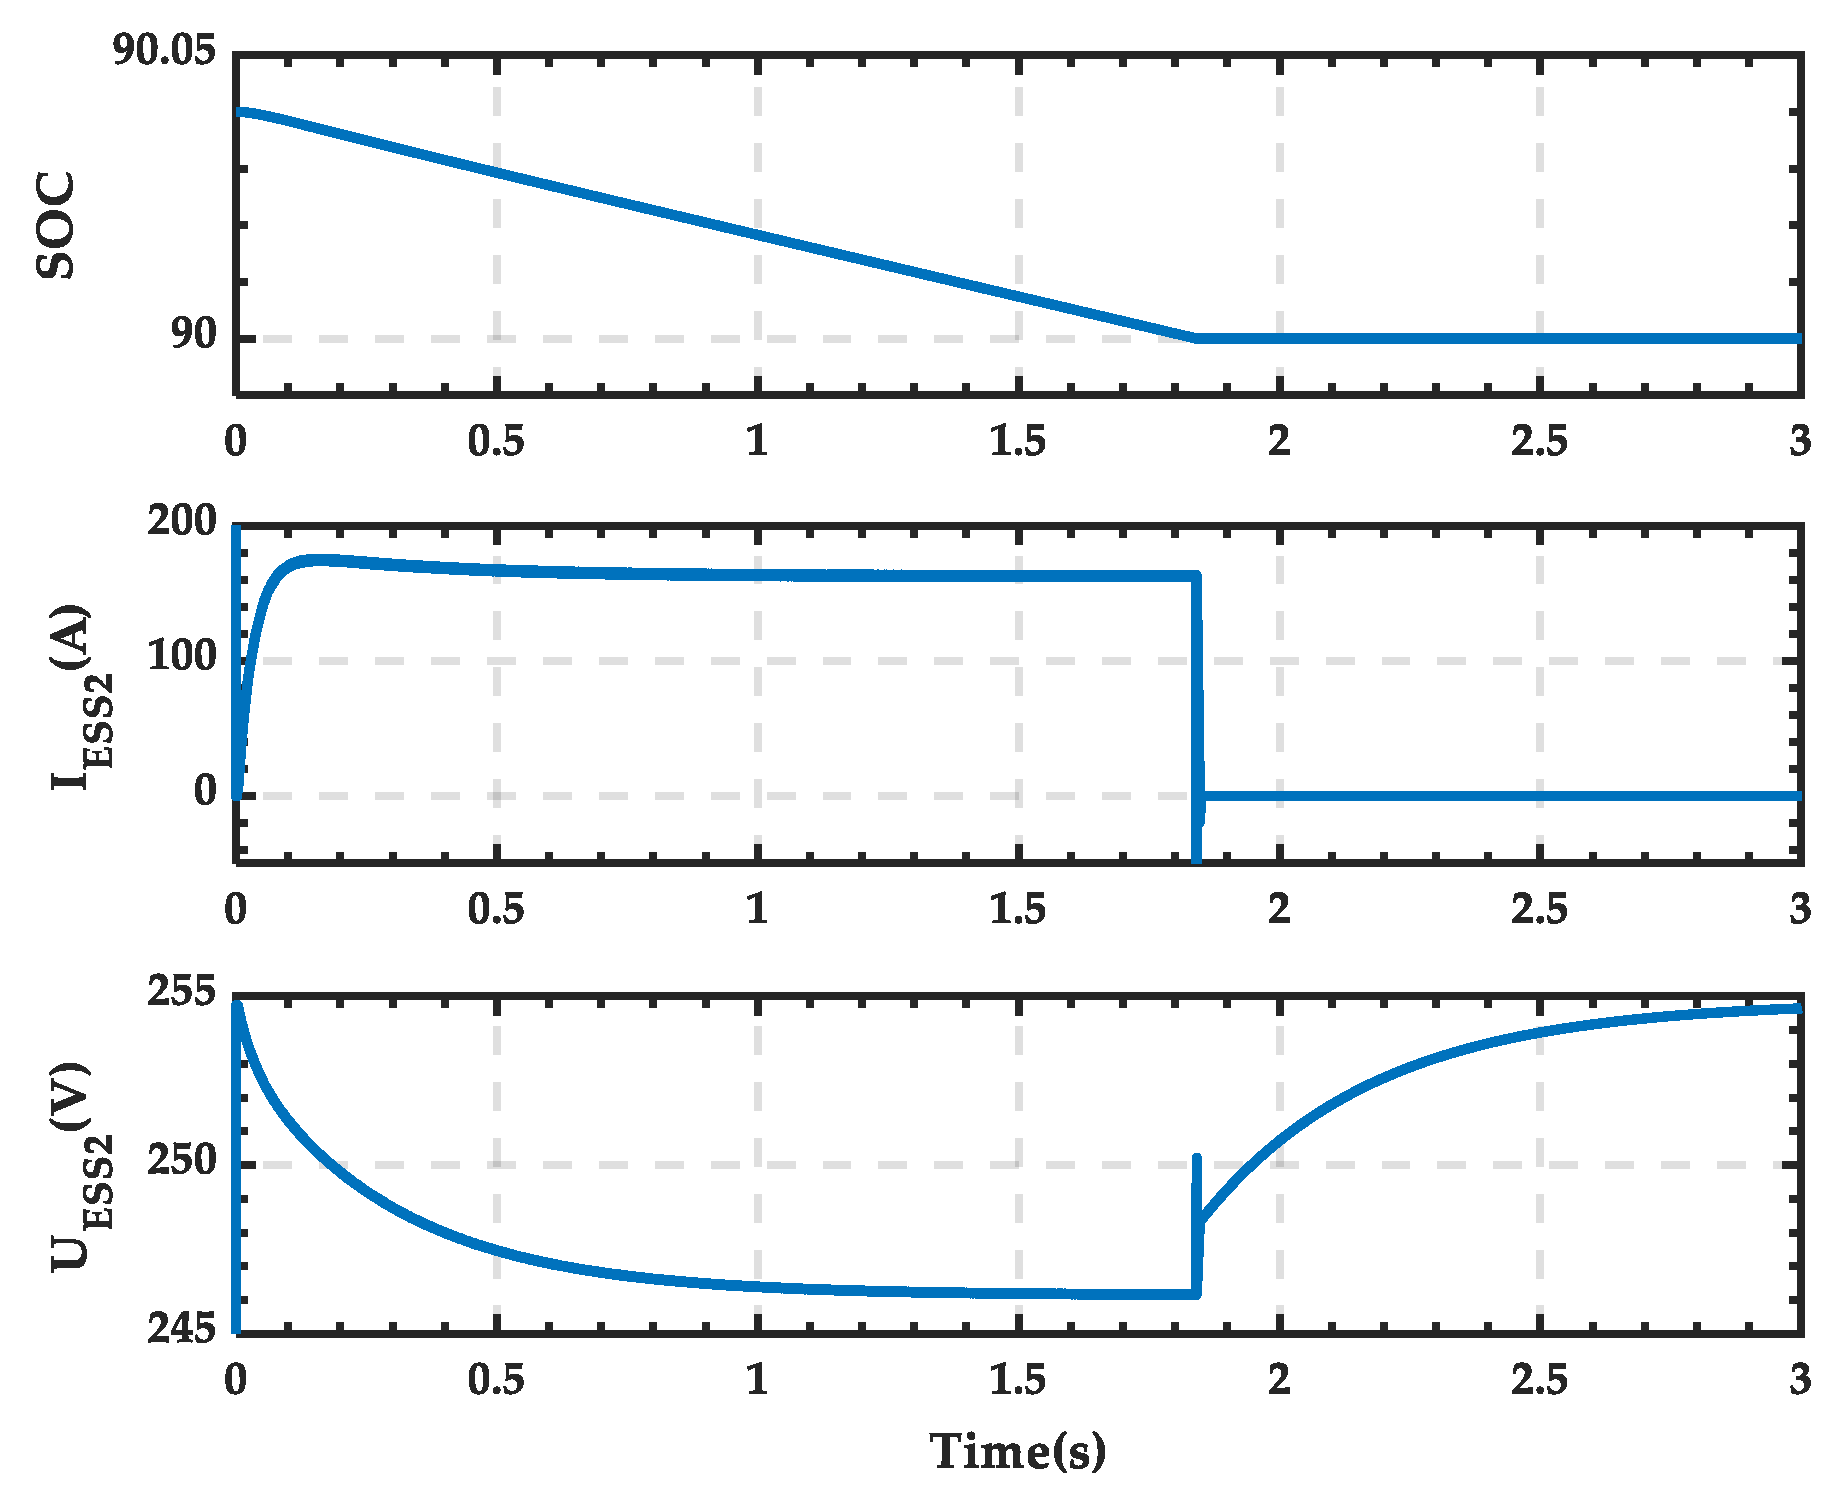
4.3. Simulation Analysis When PRS Is in State 2
5. Comparisons Between the Proposal Structure and Traditional Structures
6. Conclusions
- (1)
- In terms of frequency, SCC can quickly adjust the power, which is beneficial for maintaining the frequency stability of the AC section. The coordination between the PRS and ESS enables rapid charging and discharging during frequency fluctuations, enhancing the frequency regulation ability.
- (2)
- In terms of inertia, the combined use of the CRC and ESS can achieve rapid adjustment of the DC bus voltage, thereby simulating a virtual inertia effect. When there are power fluctuations, the ESS can respond quickly and provide the necessary power support, thus improving the dynamic response performance of the system.
- (3)
- In terms of multi-energy interactions, the introduction of SCC and PRS makes the energy flow between the AC and DC sections more flexible and controllable. The microgrid can flexibly integrate different types of distributed energy sources and ESSs. By adjusting the control strategy, the optimal scheduling and utilization of these energy sources can be achieved, thus enhancing the overall flexibility and reliability of the system.
Author Contributions
Funding
Institutional Review Board Statement
Informed Consent Statement
Data Availability Statement
Conflicts of Interest
References
- Li, X.; Wang, L.; Yan, N.; Ma, R. Cooperative Dispatch of Distributed Energy Storage in Distribution Network With PV Generation Systems. IEEE Trans. Appl. Supercond. 2021, 31, 0604304. [Google Scholar] [CrossRef]
- Luo, C.; Huang, Y.-F.; Gupta, V. Stochastic Dynamic Pricing for EV Charging Stations With Renewable Integration and Energy Storage. IEEE Trans. Smart Grid. 2018, 9, 1494–1505. [Google Scholar] [CrossRef]
- Li, J.; Xue, Y.; Tian, L.; Yuan, X. Research on Optimal Configuration Strategy of Energy Storage Capacity in Grid-Connected Microgrid. Protect. Control Mod. Power Syst. 2017, 2, 35. [Google Scholar] [CrossRef]
- Li, X.; Hui, D.; Lai, X. Battery Energy Storage Station (BESS)-Based Smoothing Control of Photovoltaic (PV) and Wind Power Generation Fluctuations. IEEE Trans. Sustain. Energy 2013, 4, 464–473. [Google Scholar] [CrossRef]
- Shuai, H.; Li, F.; Pulgar-Painemal, H.; Xue, Y. Branching Dueling Q-Network-Based Online Scheduling of a Microgrid With Distributed Energy Storage Systems. IEEE Trans. Smart Grid 2021, 12, 5479–5482. [Google Scholar] [CrossRef]
- Beheshtaein, S.; Cuzner, R.M.; Forouzesh, M.; Savaghebi, M.; Guerrero, J.M. DC microgrid protection: A comprehensive review. IEEE J. Emerg. Sel. Top. Power Electron. 2019, 1-1. [Google Scholar] [CrossRef]
- Jiang, Q.; Xue, M.; Geng, G. Energy management of microgrid in grid-connected and stand-alone modes. IEEE Trans. Power Syst. 2013, 28, 3380–3389. [Google Scholar] [CrossRef]
- Rashidirad, N.; Mahseredjian, J.; Kocar, I.; Karaagac, U.; Saad, O. MANA-Based Load-Flow Solution for Islanded AC Microgrids. IEEE Trans. Smart Grid 2023, 14, 889–898. [Google Scholar] [CrossRef]
- Qi, Y.; Deng, H.; Liu, X.; Tang, Y. Synthetic inertia control of grid-connected inverter considering the Synchronization dynamics. IEEE Trans. Power Electron. 2022, 37, 1411–1421. [Google Scholar] [CrossRef]
- Jiang, W.; Zhang, X.; Guo, F.; Chen, J.; Wang, P.; Koh, L.H. Large-signal stability of interleave boost converter system with constant power load using sliding-mode control. IEEE Trans. Ind. Electron. 2020, 67, 9450–9459. [Google Scholar] [CrossRef]
- Li, X.; Jiang, W.; Wang, J.; Wang, P.; Wu, X. An Autonomous Control Scheme of Global Smooth Transitions for Bidirectional DC-DC Converter in DC Microgrid. IEEE Trans. Energy Convers. 2021, 36, 950–960. [Google Scholar] [CrossRef]
- Gupta, A.; Doolla, S.; Chatterjee, K. Hybrid AC–DC Microgrid: Systematic Evaluation of Control Strategies. IEEE Trans. Smart Grid 2018, 9, 3830–3843. [Google Scholar] [CrossRef]
- Zhang, K.; Su, M.; Liu, Z.; Han, H.; Zhang, X.; Wang, P. A Distributed Coordination Control for Islanded Hybrid AC/DC Microgrid. IEEE Syst. J. 2023, 17, 1819–1830. [Google Scholar] [CrossRef]
- Liu, X.; Wang, P.; Loh, P.C. A hybrid AC/DC microgrid and its coordination control. IEEE Trans. Smart Grid 2011, 2, 278–286. [Google Scholar]
- Martínez-Parrales, R.; Fuerte-Esquivel, C.R.; Alcaide-Moreno, B.A.; Acha, E. A VSC-based Model for Power Flow Assessment of Multi-terminal VSC-HVDC Transmission Systems. J. Mod. Power Syst. Clean Energy 2021, 9, 1363–1374. [Google Scholar] [CrossRef]
- Zhang, C.; Mardani, M.M.; Dragičević, T. Adaptive Multi-Parameter-Tuning for Online Stabilization Control of Grid-Tied VSC: An Artificial Neural Network-Based Method. IEEE Trans. Power Deliv. 2022, 37, 3428–3431. [Google Scholar] [CrossRef]
- Mitra, B.; Chowdhury, B.; Manjrekar, M. HVDC transmission for access to off-shore renewable energy: A review of technology and fault detection techniques. IET Renew. Power Gener. 2018, 12, 1563–1571. [Google Scholar] [CrossRef]
- Karmakar, S.; Singh, B. Multi-MPPT 72-Pulse VSC Based High-Power Grid Interfaced Solar PV Plant with Distributed DC-Coupled Battery Energy Storage. IEEE Trans. Energy Convers. 2024, 39, 37–48. [Google Scholar] [CrossRef]
- Narayanan, V.; Kewat, S.; Singh, B. Solar PV-BES Based Microgrid System with Multifunctional VSC. IEEE Trans. Ind. Appl. 2020, 56, 2957–2967. [Google Scholar] [CrossRef]
- Lachichi, A.; Junyent-Ferre, A.; Green, T.C. Comparative Optimization Design of a Modular Multilevel Converter Tapping Cells and a 2L-VSC for Hybrid LV ac/dc Microgrids. IEEE Trans. Ind. Appl. 2019, 55, 3228–3240. [Google Scholar] [CrossRef]
- Sharma, R.K.; Mishra, S. Dynamic Power Management and Control of a PV PEM Fuel-Cell-Based Standalone ac/dc Microgrid Using Hybrid Energy Storage. IEEE Trans. Ind. Appl. 2018, 54, 526–538. [Google Scholar] [CrossRef]
- Feng, W.; Yang, J.; Liu, Z.; Wang, H.; Su, M.; Zhang, X. A unified distributed control scheme on cost optimization for hybrid AC/DC microgrid. In Proceedings of the 2018 IEEE 4th Southern Power Electronics Conference (SPEC), Singapore, 10–13 December 2018. [Google Scholar]
- Zhou, Q.; Shahidehpour, M.; Li, Z.; Che, L.; Alabdulwahab, A.; Abusorrah, A. Compartmentalization Strategy for the Optimal Economic Operation of a Hybrid AC/DC Microgrid. IEEE Trans. Power Syst. 2020, 35, 1294–1304. [Google Scholar] [CrossRef]
- Zhou, Q.; Shahidehpour, M.; Li, Z.; Xu, X. Two-Layer Control Scheme for Maintaining the Frequency and the Optimal Economic Operation of Hybrid AC/DC Microgrids. IEEE Trans. Power Syst. 2019, 34, 64–75. [Google Scholar] [CrossRef]
- Sebastian, C.R.; Rajeevan, P.P. Load-Commutated SCR-Based Current Source Inverter Fed Induction Motor Drive with Open-End Stator Windings. IEEE Trans. Ind. Electron. 2018, 65, 2031–2038. [Google Scholar] [CrossRef]
- Cheng, J.; Xiang, D.; Fang, C.; Hu, Z. Power Mode Division Control Strategy for AC/DC Microgrids Considering SOC. Energies 2025, 18, 417. [Google Scholar] [CrossRef]
- 62mm C-Series Module with the Fast IGBT2 for High-Frequency Switching and Pre-Applied Thermal Interface Material. Available online: https://www.infineon.com/dgdl/Infineon-FF200R12KS4P-DataSheet-v03_00-CN.pdf?fileId=5546d462700c0ae601709b2761c57c36 (accessed on 13 February 2025).


| Operational State | Conditions |
|---|---|
| State 0 | SOC ∈ [SOCmin, SOCmax], no trigger pulse applied to the SCC |
| State 1 | SOC < SOCmin, α < 90° |
| State 2 | SOC > SOCmax, α > 90° |
| Typical Day | Wind Power Energy (kWh) | PV Energy (kWh) | ESS Energy (kWh) | External Grid Energy (kWh) | Load Energy (kWh) |
|---|---|---|---|---|---|
| Spring | 6006.13 | 91.67 | −586.15 | −2923.39 | 2458.85 |
| Summer | 1711.13 | 128.35 | 879.28 | 261.38 | 2831.13 |
| Autumn | 776.04 | 103.25 | 879.82 | 1016.60 | 2636.93 |
| Winter | 1256.14 | 79.62 | 830.03 | 730.78 | 2751.75 |
| Number | Component Name | Parameters | Main Function Description | |
|---|---|---|---|---|
| 1 | Three-Phase Source | Phase-to-phase voltage Phase angle of phase A | 380 V 0 ° | To simulate the external power grid supply. |
| 2 | Three-Phase VI Measurement | Voltage measurement Current measurement | phase-to-ground yes | To measure the three-phase voltage and current signals output by the power supply. |
| 3 | Three-Phase Transformer (Two Windings) | Nominal power Frequency V1/V2 Connection | 1 × 10⁴ VA 50 Hz 380/130 V Yg/Yg (Yg/D1) | To perform voltage transformation and power transmission. |
| 4 | Universal Bridge (SCR) | Number of bridge arms Forward voltage Vf | 3 1.2 V | To perform the conversion between AC and DC power, and to enable energy interaction between the DC and AC sections of the microgrid. |
| 5 | Pulse Generator (SCR) | Generator type Winding connection | 12-pulse D1 | To generate the triggering pulses required for the 12-pulse SCC. |
| 6 | Inductance Ls | Inductance | 10 mH | To filter and stabilize the output DC voltage. |
| 7 | Ideal Switch | Internal resistance Ron Initial state | 1 mΩ 0 | To simulate the function of the PRS. |
| 8 | Battery | Type Nominal voltage Rated capacity Batterty response time | Lead–Acid 250 V 200 Ah 1 s | To simulate the Lead–Acid battery. |
| 9 | Mosfet | FET resistance Ron Diode resistance Rd | 0.1 Ω 0.01 Ω | To achieve on/off control of the current under the control of the input signal. |
| 10 | Inductance Lb | Inductance | 3 mH | To store energy and achieve the function of voltage boosting. |
| 11 | CRC Controller | KP Ki Saturation1 Saturation2 Repeating sequence | 6 8 [−0.2, 11] [−11, 0.2] [0, 5 × 10⁻⁴] | To enable bidirectional energy interaction between the ESS system and the DC section. |
| 12 | Capacitance Cbus | Capacitance | 16,000 μF | To store energy and smooth fluctuations in the DC-bus voltage. |
| 13 | PV Array | Terminal voltage Temperature | 250 V 25 °C | To convert PV energy into electric energy. |
| 14 | Capacitance Cpv | Capacitance | 100 μF | To filter and stabilize the DC voltage output from PV array. |
| 15 | Inductance Lpv | Inductance | 0.2 H | To store power and achieve the function of voltage boosting. |
| 16 | Diode | Resistance Ron Forward voltage Vf | 1 mΩ 0.8 V | To isolate, continue current flow, and prevent backflow current. |
| 17 | PWM Generator (DC-DC) | Switching frequency | 5000 Hz | To provide trigger pulses for the MOSFET of the BOOST circuit. |
| 18 | Load | Vload RloadA, RloadC RloadB | 220 V 30 Ω 40 Ω | To serve as the loads connected to the DC bus of the microgrid. |
| 19 | Breaker | Breaker resistance Ron Snubber resistance Rs Snubber capacitance | 0.01 Ω 1 × 10⁶ Ω inf | To disconnect the wind module from the DC bus in order to simulate the loss of wind energy. |
| 20 | PMSG | Stator phase resistance Armature inductance Voltage constant Wind speed | 5 mΩ 2 mH 1451 7 m/s | To convert mechanical energy into electric energy. |
| 21 | Universal Bridge (IGBT) | Number of bridge arms Forward voltage [Vf Vfd] | 3 [1.2 V 0.8 V] | To rectify and achieve the transmission of wind turbine electric energy to the DC bus. |
| 22 | Current Measurement | — | — | To measure the current signals. |
| 23 | Voltage Measurement | — | — | To measure the voltage signals. |
| 24 | Scope | — | — | To display and record signals during the simulation process. |
Disclaimer/Publisher’s Note: The statements, opinions and data contained in all publications are solely those of the individual author(s) and contributor(s) and not of MDPI and/or the editor(s). MDPI and/or the editor(s) disclaim responsibility for any injury to people or property resulting from any ideas, methods, instructions or products referred to in the content. |
© 2025 by the authors. Licensee MDPI, Basel, Switzerland. This article is an open access article distributed under the terms and conditions of the Creative Commons Attribution (CC BY) license (https://creativecommons.org/licenses/by/4.0/).
Share and Cite
Lei, Y.; Yang, F.; Ren, J.; Yang, Z.; Wang, X.; Chen, Q.; Jin, X.; Wang, S. Research on a Novel AC/DC Hybrid Microgrid Based on Silicon Controlled Converters and Polarity Reversal Switches. Sensors 2025, 25, 1766. https://doi.org/10.3390/s25061766
Lei Y, Yang F, Ren J, Yang Z, Wang X, Chen Q, Jin X, Wang S. Research on a Novel AC/DC Hybrid Microgrid Based on Silicon Controlled Converters and Polarity Reversal Switches. Sensors. 2025; 25(6):1766. https://doi.org/10.3390/s25061766
Chicago/Turabian StyleLei, Yang, Fan Yang, Jiaxuan Ren, Zhichun Yang, Xinchen Wang, Qianchen Chen, Xuan Jin, and Shaorong Wang. 2025. "Research on a Novel AC/DC Hybrid Microgrid Based on Silicon Controlled Converters and Polarity Reversal Switches" Sensors 25, no. 6: 1766. https://doi.org/10.3390/s25061766
APA StyleLei, Y., Yang, F., Ren, J., Yang, Z., Wang, X., Chen, Q., Jin, X., & Wang, S. (2025). Research on a Novel AC/DC Hybrid Microgrid Based on Silicon Controlled Converters and Polarity Reversal Switches. Sensors, 25(6), 1766. https://doi.org/10.3390/s25061766