
Experimental Research on and Optimization of Plasma Emitter Sources

Abstract
1. Introduction
2. Methods
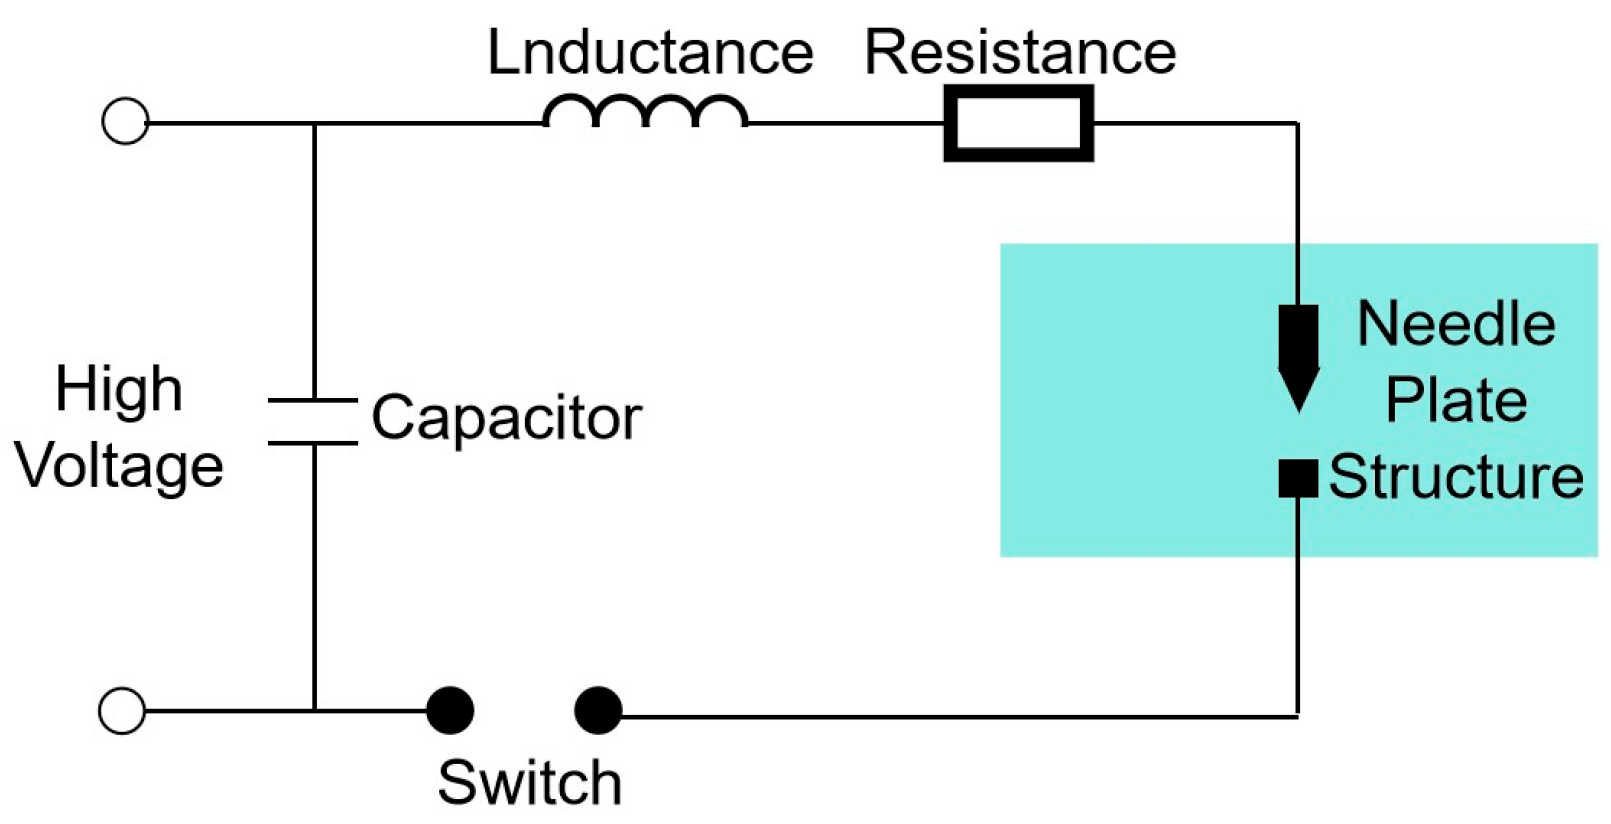
2.1. Principle
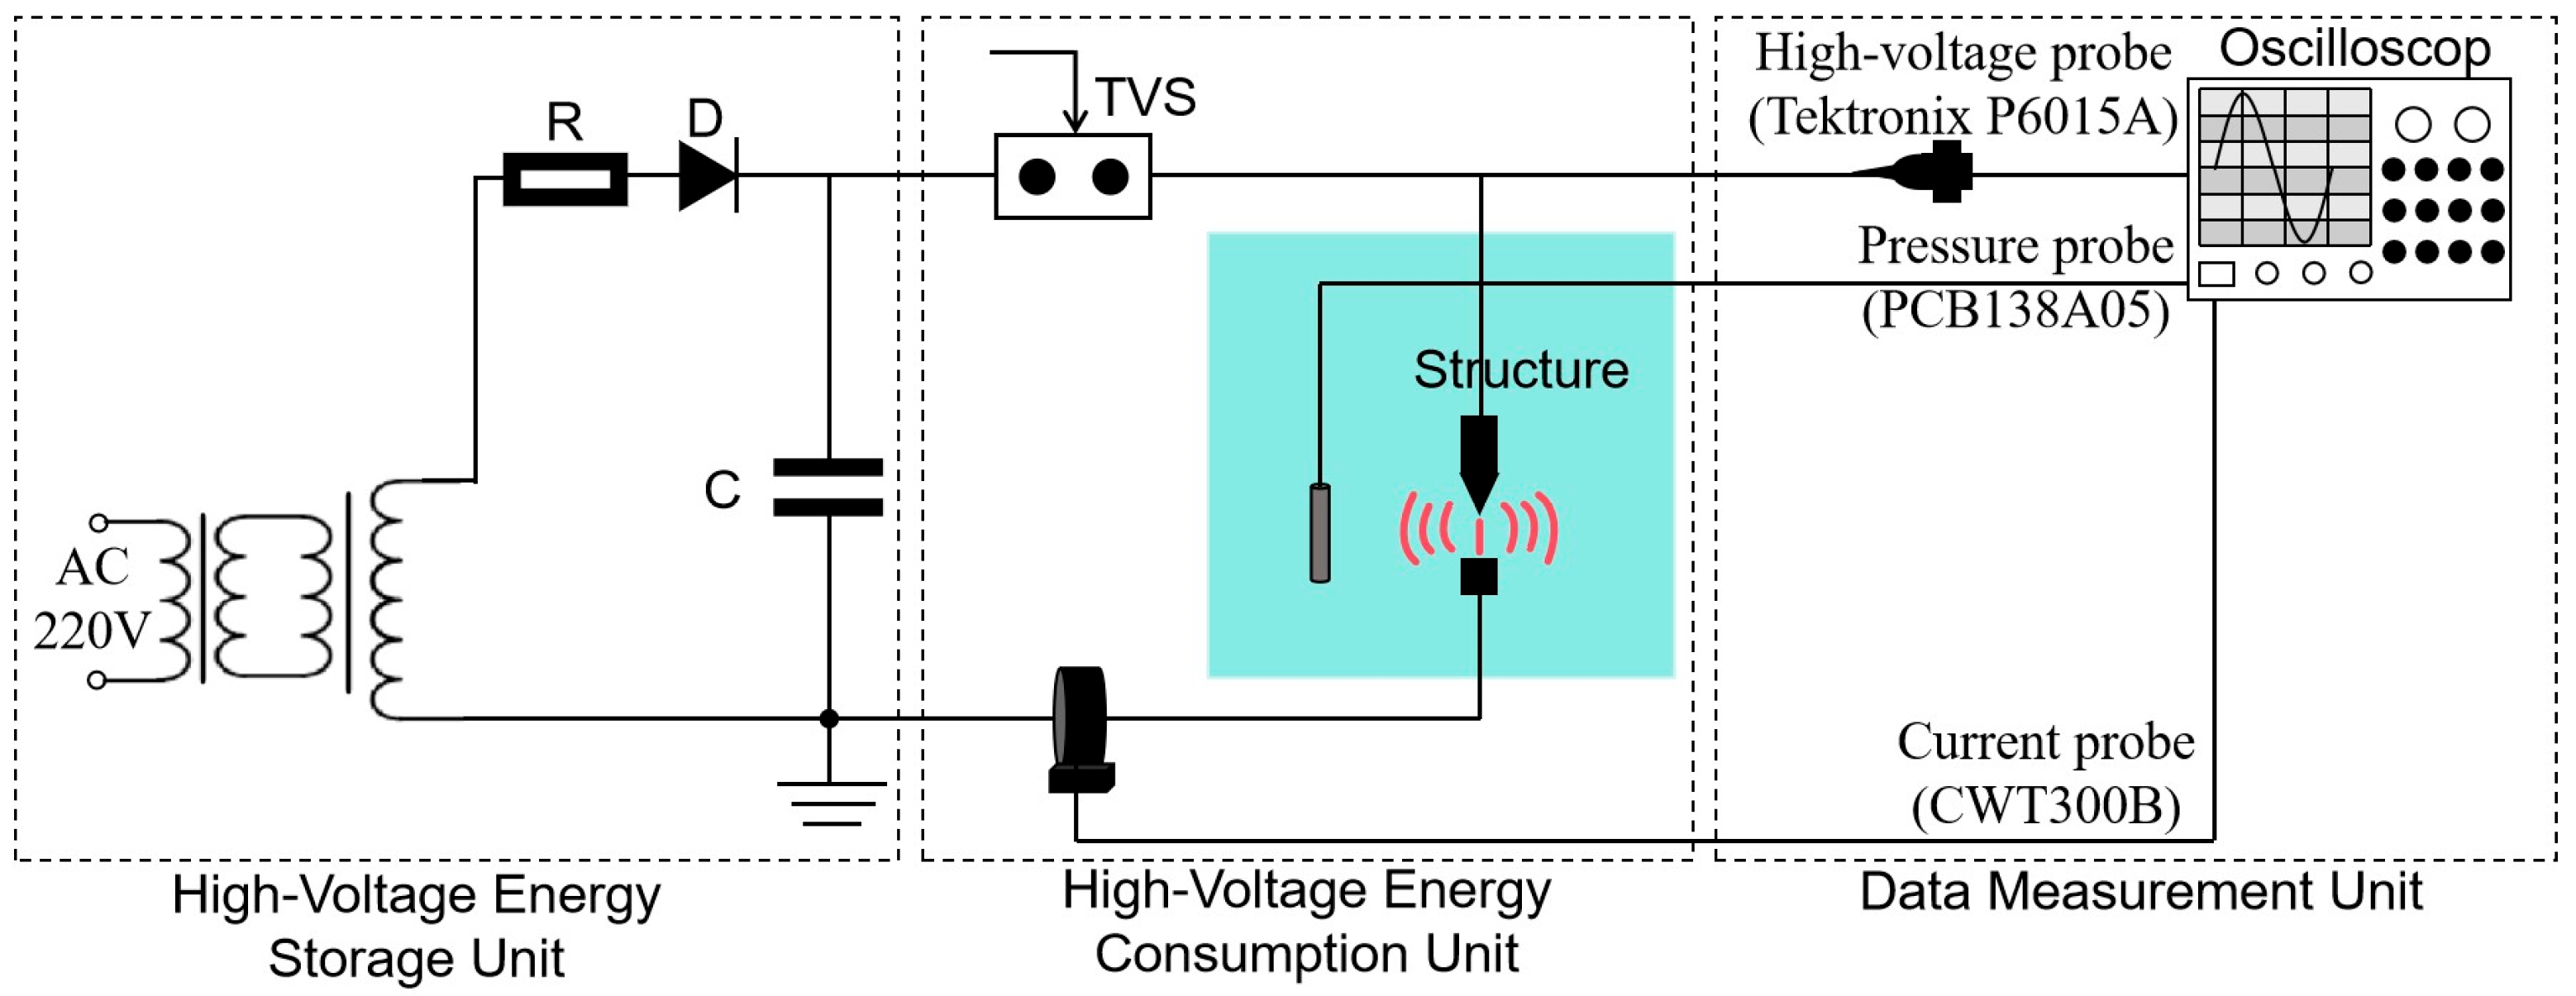
2.2. Experiment
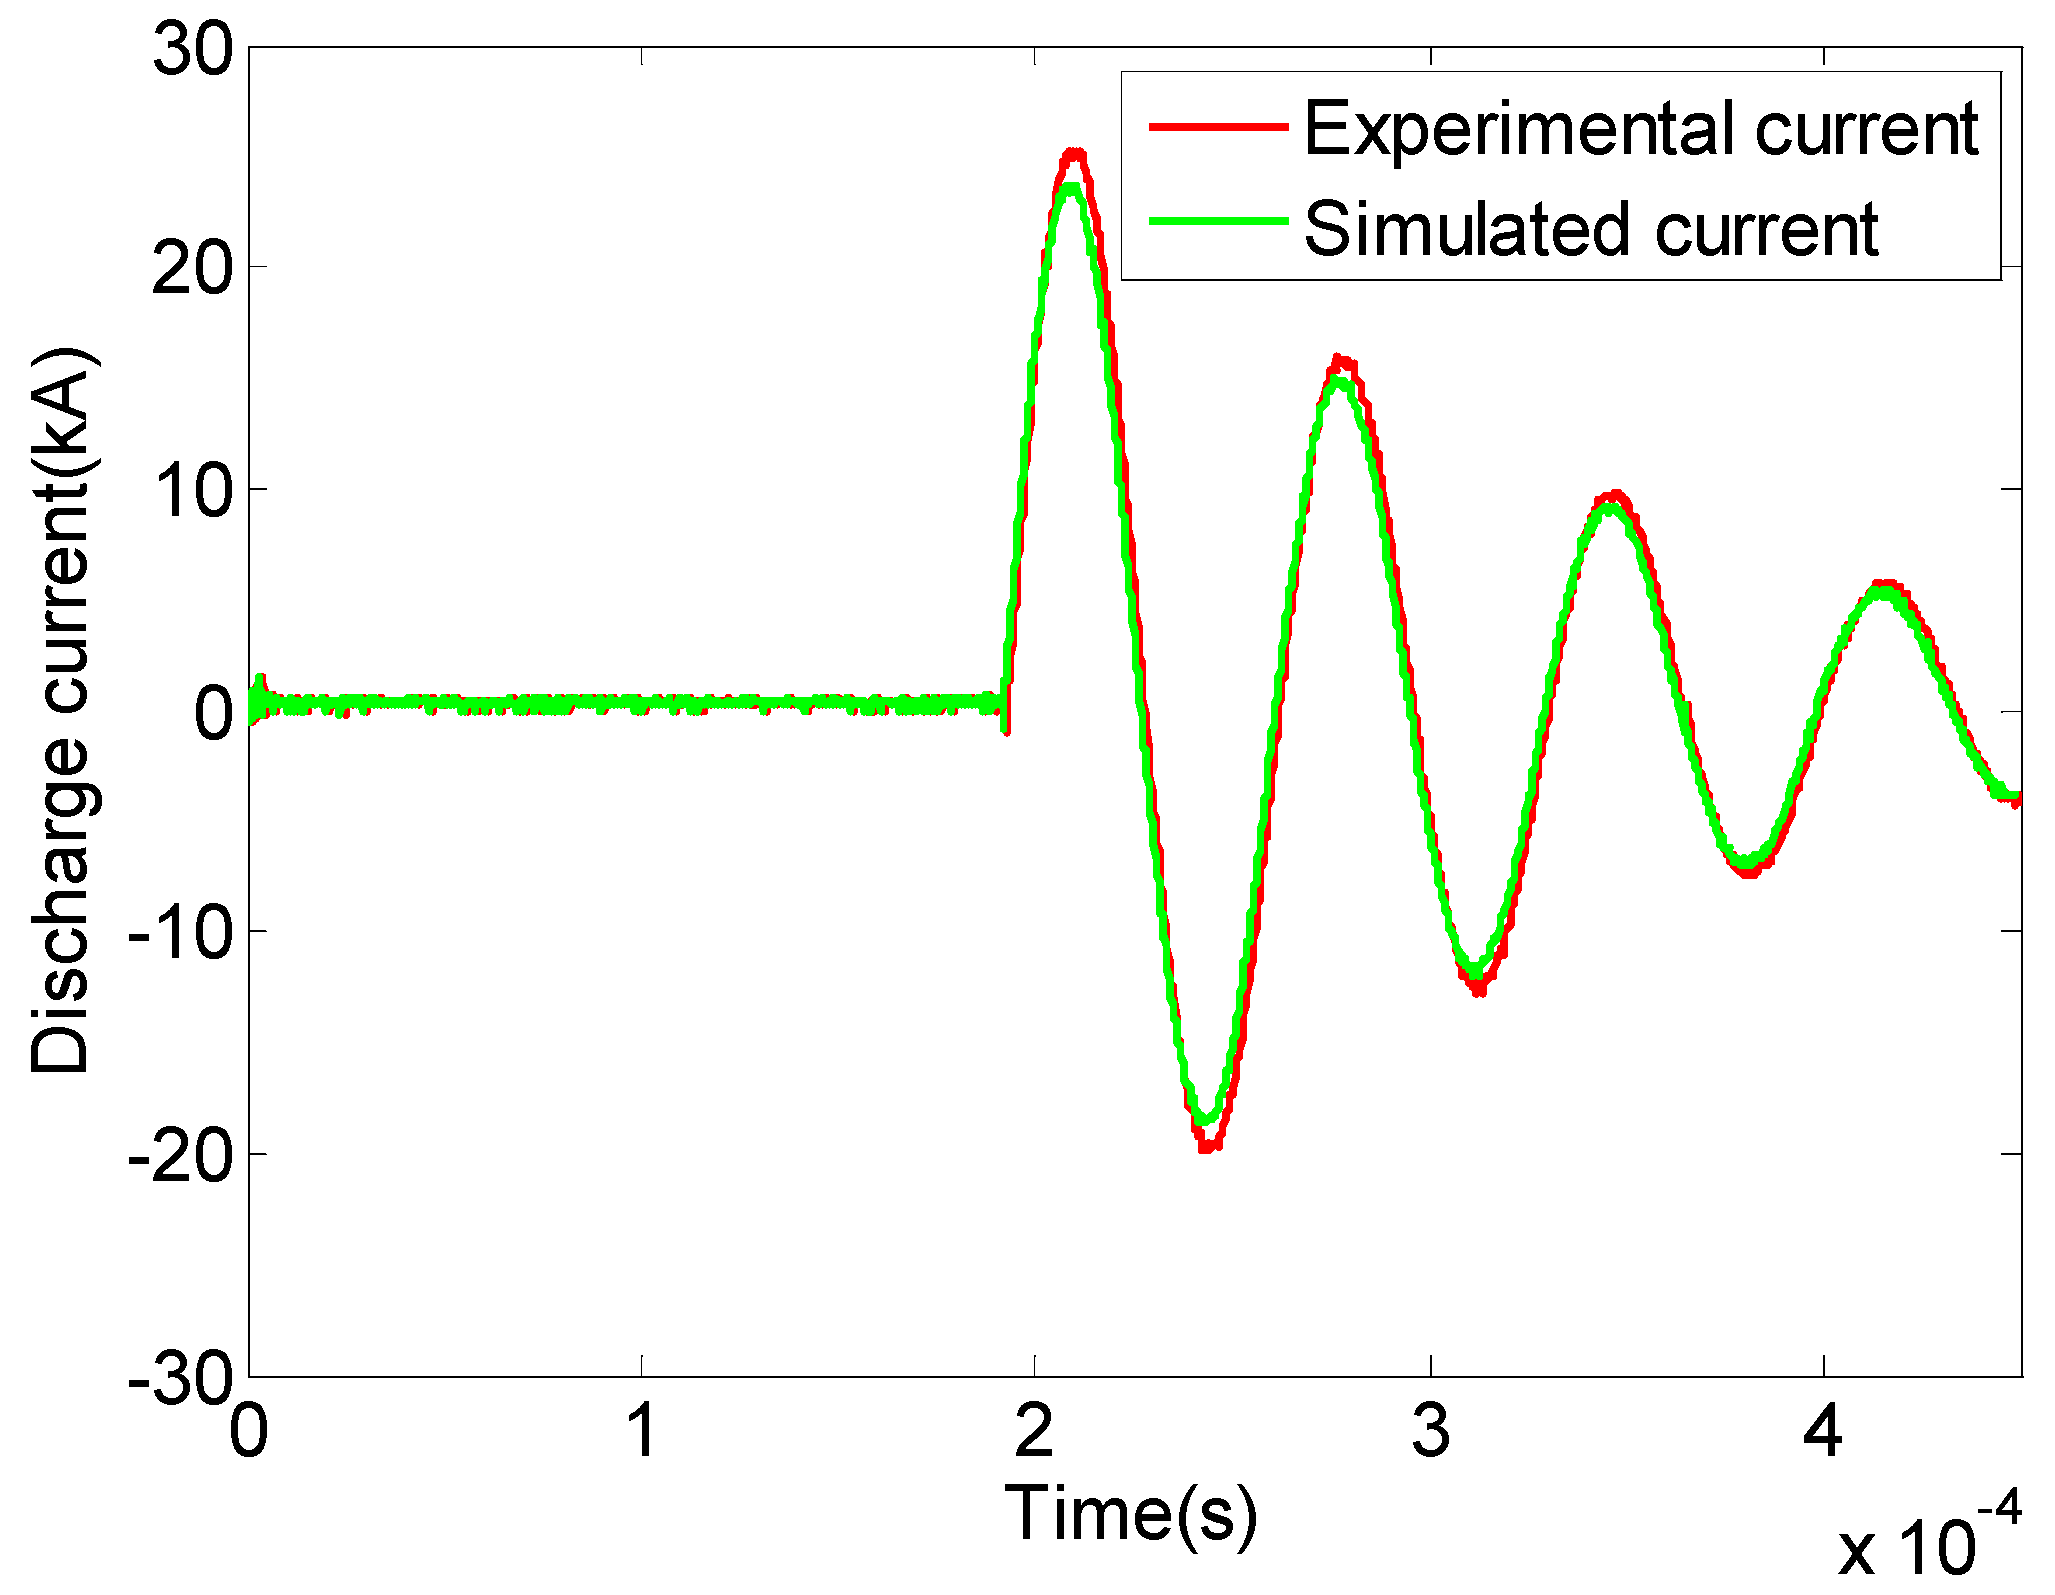
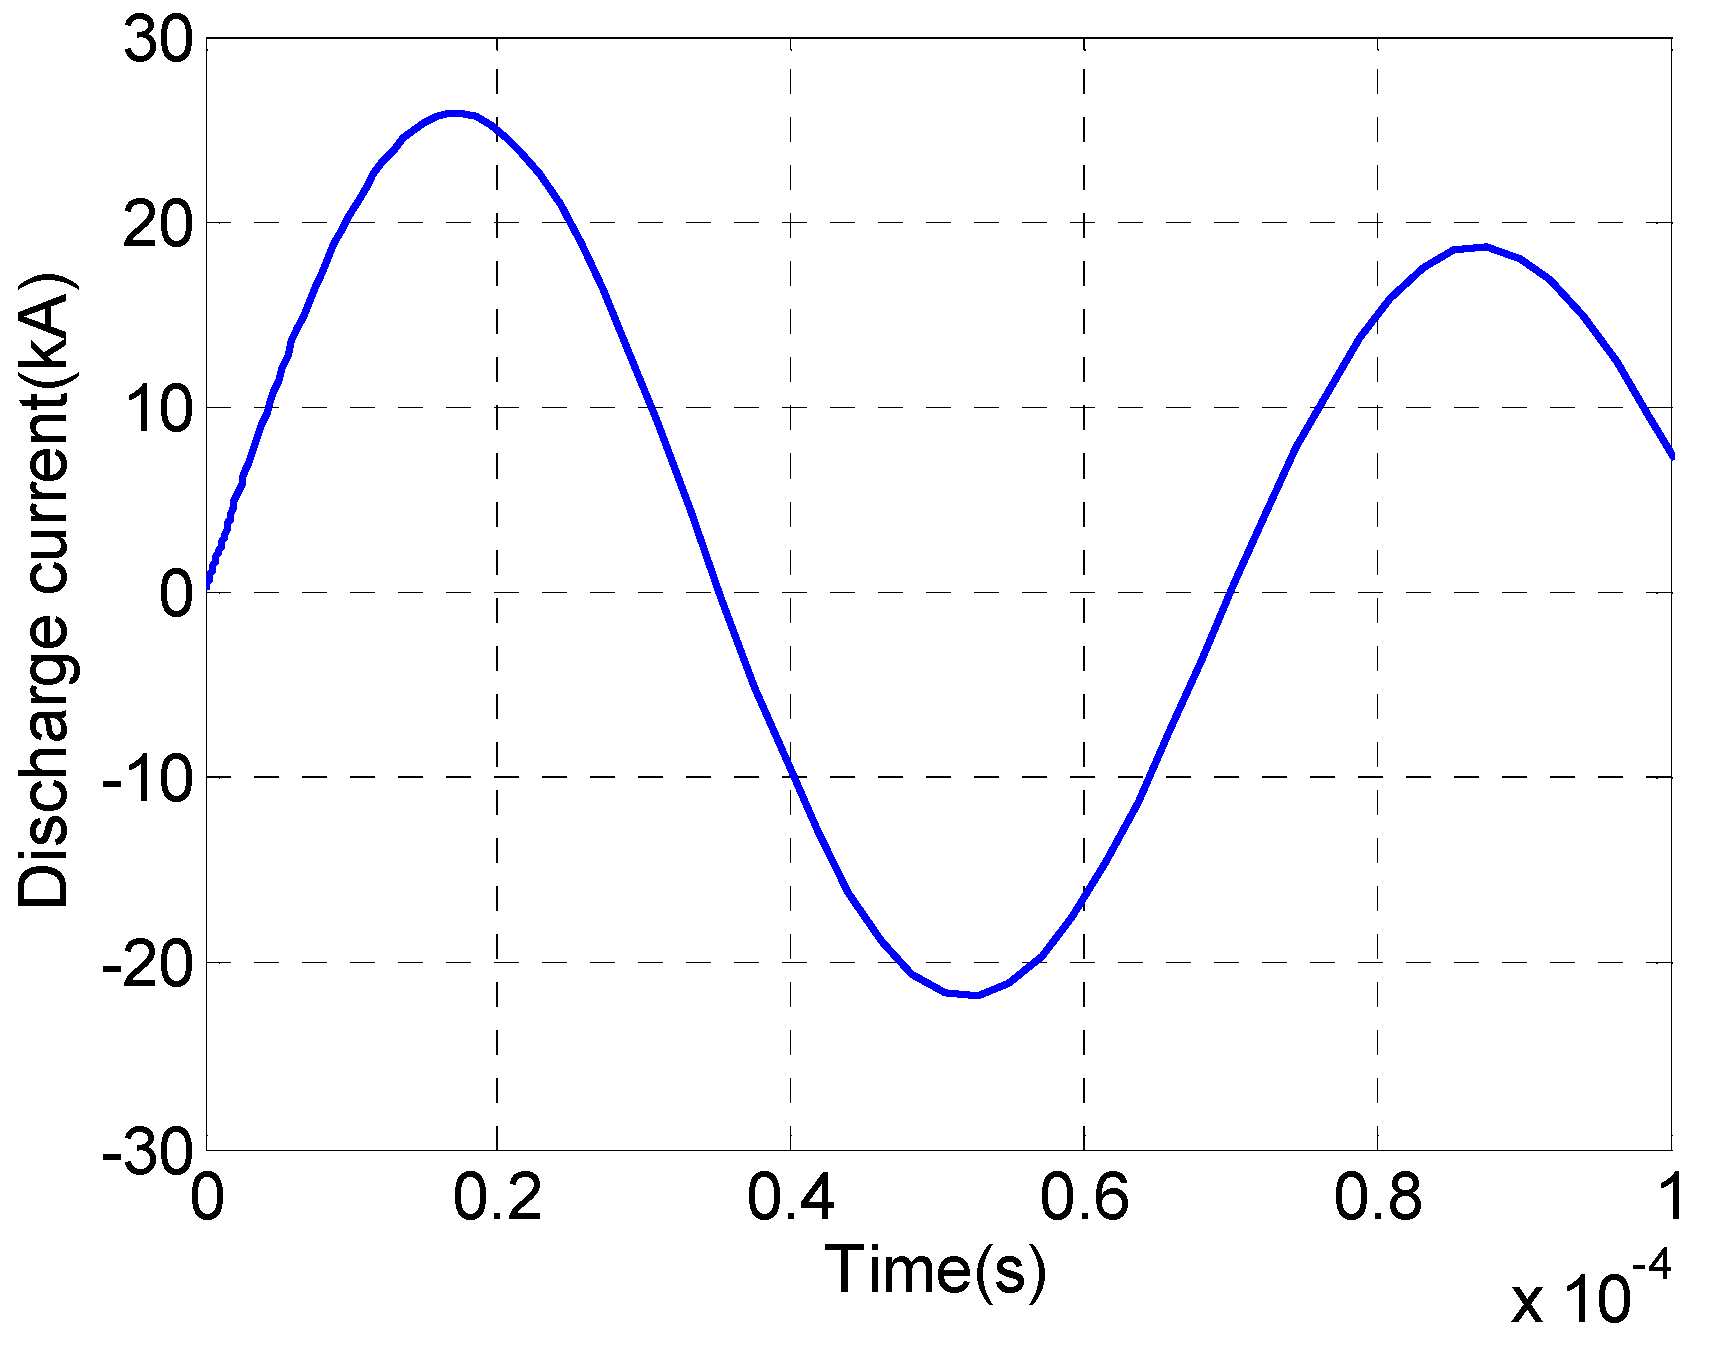
2.3. Results
3. Enhancement
3.1. Validation
3.2. Enhancement
3.3. Results
4. Discussion
5. Conclusions
- (1)
- Traditional acoustic detection relies on piezoelectric emitters. The radiation frequency of these emitters is constrained by the limited downhole space, fixed within the range of 0 kHz to 25 kHz. Additionally, low radiation energy allows for detection only within a few tens of meters around the wellbore. This limitation makes them inadequate for future exploration of deeper reservoirs, smaller-scale formations, and more complex conventional and unconventional hydrocarbon reservoirs.
- (2)
- A plasma emitter was proposed, and discharge experiments of the plasma needle–plate emitter in liquid were conducted. The needle–plate emitter achieved a conductive breakdown discharge in a water medium, with the first impulse wave peak measured by a PCB pressure sensor reaching 5 MPa.
- (3)
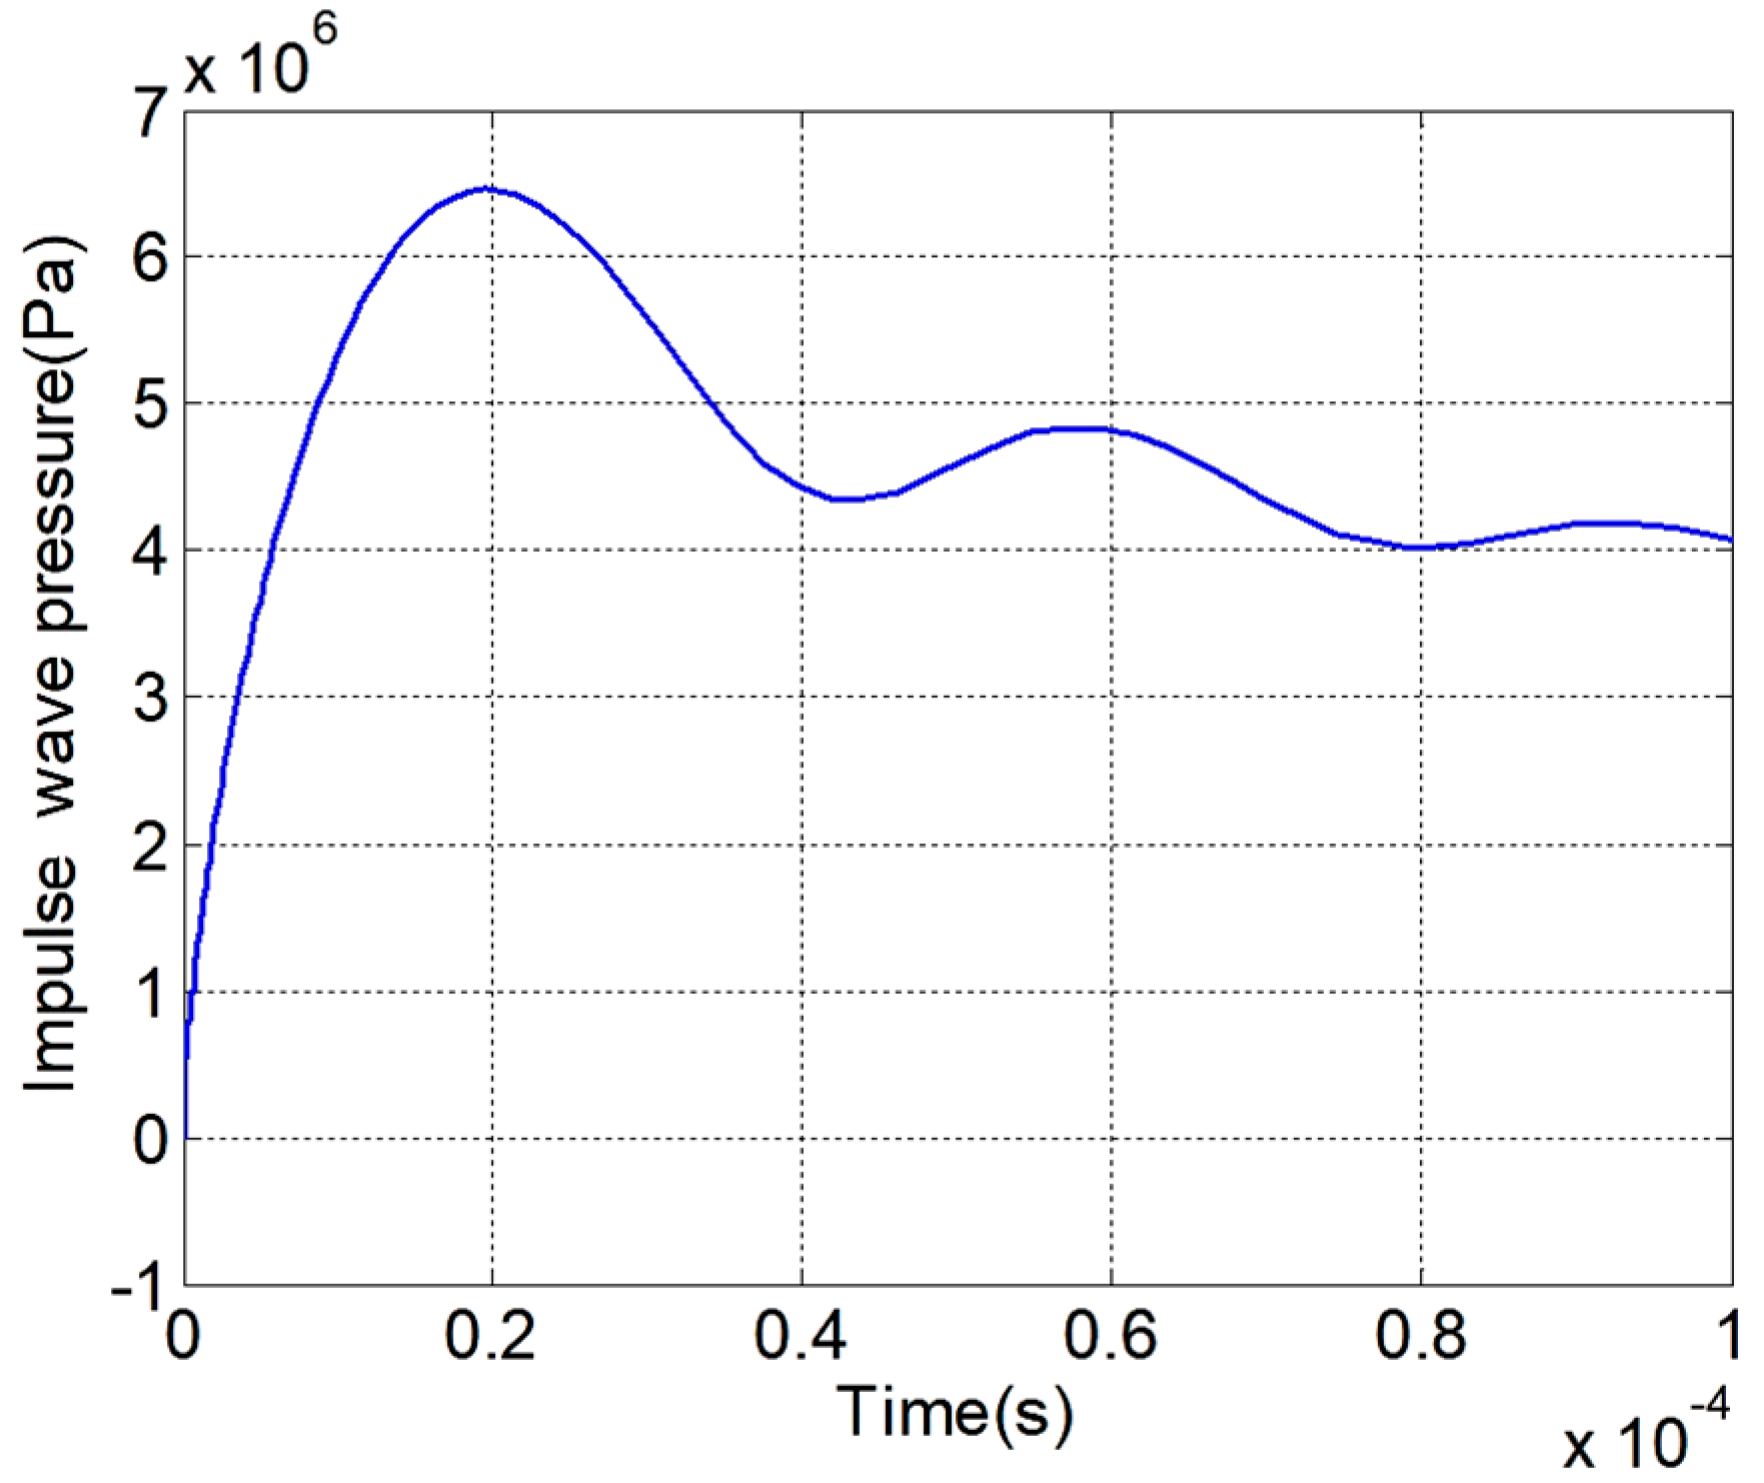
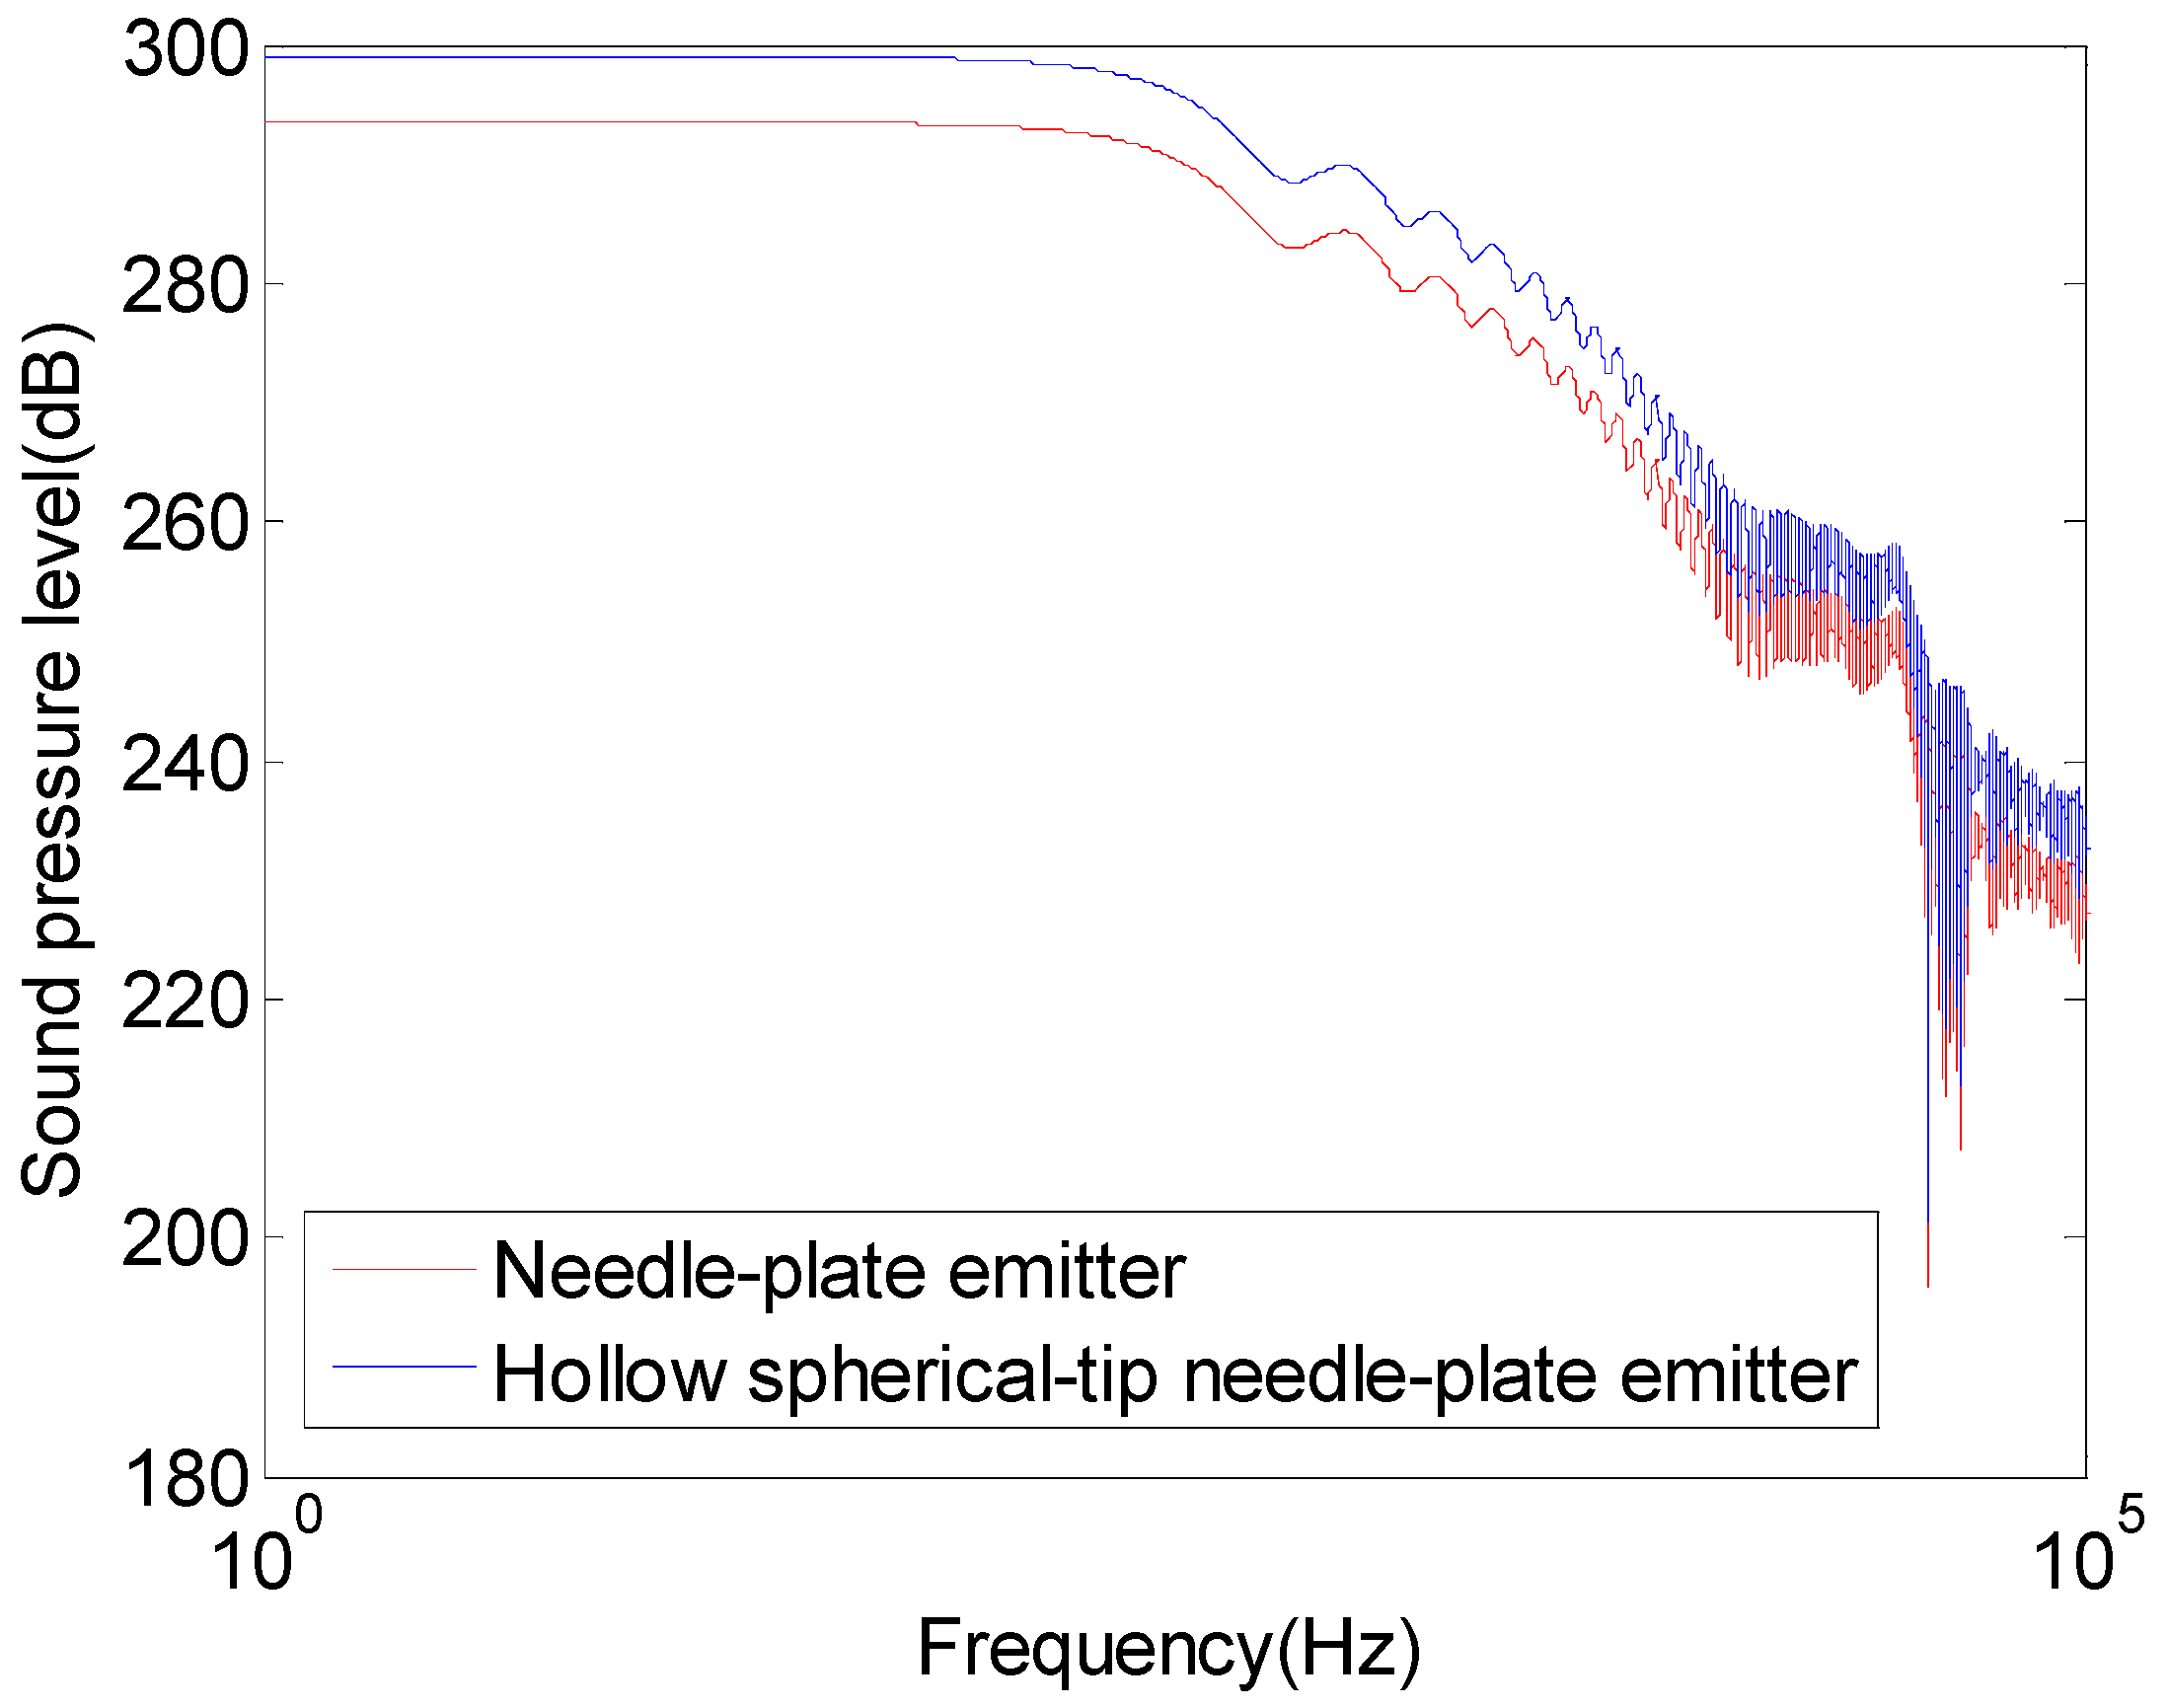
- The structure of the needle–plate emitter was innovatively improved. A cylindrical cavity was introduced at the center of the needle structure, forming a hollow needle design. Additionally, a spherical tip was added to the needle’s tip, resulting in a spherical-tip needle structure. This optimization led to the development of a novel hollow spherical-tip needle–plate emitter. Compared with the needle–plate emitter, the impulse wave amplitude of the hollow spherical-tip needle–plate emitter increased by 27.2%, the electromechanical conversion efficiency improved by 28.1%, and the radiation frequency band can cover up to 100 kHz.
- (4)
- The novel hollow spherical-tip needle–plate emitter enables long-range and high-precision acoustic wave transmission. It can detect small structures such as residual oil, thin interlayers and tiny fractures, as well as large structures such as oil–water–gas interfaces and large fractures at distances of hundreds of meters. It has enormous application potential in onshore and offshore oil and gas exploration and unconventional resource development. This study presents a preliminary investigation of the hollow spherical-tip needle–plate emitter. Future work will focus on a detailed examination of the effects of different hollow and spherical-tip structure sizes on the emitter’s performance, aiming to determine the optimal structural parameters. Additionally, a physical prototype of the hollow spherical-tip needle–plate emitter will be fabricated for discharge experiments.
Author Contributions
Funding
Institutional Review Board Statement
Informed Consent Statement
Data Availability Statement
Conflicts of Interest
References
- Yuan, S.; Wang, Q. New progress and prospect of oilfields development technologies in China. Pet. Explor. Dev. 2018, 45, 698–711. [Google Scholar] [CrossRef]
- Zhang, Q.; Lv, S.; Xu, Y.; Tan, Q.; Fang, H.; Xu, P. Current status and prospects of research on development seismic technologies for oil and gas fields: A case study of Jiyang Depression. Pet. Geol. Recovery Effic. 2024, 31, 130–141. [Google Scholar]
- Mu, L.; Chen, Y.; Xu, A.; Wang, R. Technological progress and development directions of PetroChina overseas oil and gas field production. Pet. Explor. Dev. 2020, 47, 124–133. [Google Scholar] [CrossRef]
- Turolla, A.; Zampato, M.; Correra, S.; Schenato, L.; Palmieri, L. High Bandwidth Distributed Acoustic Sensing for Microcrack Detection. In Proceedings of the International Petroleum Technology Conference, Dhahran, Saudi Arabia, 12–14 February 2024. [Google Scholar]
- He, Y.; Ma, H.; Deng, F.; Sun, L.; Yang, D.; Wang, Y.; Jin, Y.; Lin, G. Application of seismic wavelet decomposition and reconstruction technology in thin reservoir prediction. Fault-Block Oil Gas Field 2024, 31, 319–325. [Google Scholar]
- Wang, W.; Yang, L.; Sang, P.; Shen, Y. Research progress of oil reservoir description characteristics and new technology. Petrochem. Ind. Appl. 2024, 43, 11–14+18. [Google Scholar]
- Shao, Y. Wave Propagation in a Fluid-Filled Borehole Surrounded by an Anisotropic Elastic Solid. Master’s Thesis, Harbin Institute of Technology, Harbin, China, 2017. [Google Scholar]
- Li, N.; Liu, P.; Wu, H.; Li, Y.; Zhang, W.; Wang, K.; Feng, Z.; Wang, H. Development and prospect of acoustic reflection imaging logging processing and interpretation method. Pet. Explor. Dev. 2024, 51, 731–742. [Google Scholar] [CrossRef]
- Mickael, M.W.; Barnett, C.; Diab, M.S. Azimuthally Focused LWD Sonic Logging for Shear Wave Anisotropy Measurement and Borehole Imaging. In Proceedings of the SPE Annual Technical Conference and Exhibition, San Antonio, TX, USA, 8–10 October 2012. [Google Scholar]
- Marek, K.; Paul, B.; Doug, S. Phase velocity processing for acoustic logging-while-drilling full waveform data. In Proceedings of the SPWLA 42nd Annual Logging Symposium, Houston, TX, USA, 17–20 June 2001. [Google Scholar]
- Zhang, C.; Chen, H.; Hu, H.; Wang, J. A study on the dominating signal types sensed by the transducers of monopole acoustic logging-while-drilling. J. Appl. Acoust. 2020, 39, 804–809. [Google Scholar]
- Li, J.; Liu, X.; Luo, B.; Sun, Z.; Qiu, A.; Luo, Y. Evaluation on Application Effect of Homemade LWD Acoustic Logging Tool. Pet. Tubul. Goods Instrum. 2022, 8, 38–43. [Google Scholar]
- Wu, B.; Dong, J.; Xu, X.; Du, Q.; Zhai, Y.; Chen, H.; Chao, Y.; Zhang, W. Dipole acoustic remote detection (ARD) logging and its application in fracture-cave reservoir. J. Phys. Conf. Ser. 2024, 2822, 012058. [Google Scholar] [CrossRef]
- Tan, B.H.; Tang, X.M.; Wei, Z.T.; Cao, J.J.; Su, Y.D. Dominant frequency bang and reflected wave field of LWD dipole shear wave remote detection. Acta Pet. Sin. 2016, 37, 1152–1159. [Google Scholar]
- Li, D.; Qiao, W.; Che, X.; Ju, X. Study on the response of dipole reflected acoustic imaging the near-borehole cave. J. Appl. Acoust. 2019, 38, 767–773. [Google Scholar]
- Zhang, K. Research on Near Probe High Precision Acquisition System for Borehole Acoustic Reflection Logging. Master’s Thesis, China University of Petroleum (East China), Qingdao, China, 2022. [Google Scholar]
- Li, G.; Chai, X.; Ju, X.; Qiao, W.; Ji, C.; Han, M.; Li, W. Azimuth Remote Exploration Acoustic Reflection Imaging Logging Tool. Well Logging Technol. 2018, 42, 221–226. [Google Scholar]
- Ben, J.; Che, X.; Qiao, W.; Ju, X.; Wang, Z.; Lu, J.; Men, B. Application of Near-Borehole Geologic Reflector Evaluation Using Azimuthal Acoustic Reflection Imaging Logging. Well Logging Technol. 2021, 45, 23–29. [Google Scholar]
- Rao, B.; Tang, X.M.; Su, Y.D. Theoretical calculation and mechanism analysis for component waves of acoustic logging while drilling in transversely isotropic formations. Chin. J. Geophys. 2022, 65, 3198–3212. [Google Scholar]
- Han, B.; Li, D.; Fan, Q. Application of Orthogonal Multipole Array Acoustic Logging in Coalfield Exploration—With No.7 Well Area of Guqiao Coal Mine in Huainan as an Examplar. Technol. Innov. Appl. 2021, 02, 20–25+30. [Google Scholar]
- Che, X.; Zhao, T.; Qiao, W.; Lyu, W.; Fan, J. Fracture identification and evaluation based on multi-pole acoustic logging. Oil Gas Geol. 2020, 41, 1263–1272. [Google Scholar]
- Pan, M. On the fault resolution and application of MPAL dipole sonic wave instrument. Inn. Mong. Petrochem. Ind. 2020, 46, 19–21. [Google Scholar]
- Chen, M.; Sun, D.; Xie, X.; Gao, Y.; Wang, F.; Liu, J. Progress and prospect of acoustic logging while drilling technologies. World Pet. Ind. 2023, 30, 32–41. [Google Scholar]
- Zuo, C.; Qiao, X.; Che, X.; Yang, S. Evaluation of azimuth cement bond quality based on the arcuate phased array acoustic receiver station. J. Pet. Sci. Eng. 2020, 195, 107902. [Google Scholar] [CrossRef]
- Zhu, C.; Li, B.; Shi, P.; Ding, G. Research on Acoustic Characteristics of Piezoelectric Composites with Gradient Distribution of Piezoelectric Ceramics. Noise Vib. Control 2024, 44, 1–7. [Google Scholar]
- Jiang, M. Research on Electromagnetic Low-Frequency Flexuralmonopole Acoustic Logging Transmitting Transducer. Master’s Thesis, China University of Petroleum, Beijing, China, 2023. [Google Scholar]
- Sun, J.; Zhao, A.; Wang, Y.; Wang, B.; Ma, X. Anti-frogman defence system of strategic point underwater. Appl. Sci. Technol. 2020, 47, 94–98. [Google Scholar]
- Lei, X. Experimental Study on Impulse Characteristics of Downhole Liquid ElectricPulse. Master’s Thesis, Xi’an Shiyou University, Xi’an, China, 2018. [Google Scholar]
- Feng, Z.; Lan, S.; Xiong, L. Numerical Calculation Research on Pulse Discharge Process of Tungsten Electrode in Water. Electr. Switchg. 2024, 62, 21–26. [Google Scholar]
- Chen, Y.; Zheng, Y.; Meng, H.; Shen, T.; Liang, J.; Zhou, W. Temperature Effect on Tip-plate Discharge Characteristics of SF6/CF4 Gas Mixture. High Volt. Appar. 2024, 60, 61–68. [Google Scholar]
- Xing, Y.; Dong, M.; Liu, Y.; Hu, Y.; Li, Q.; Xu, Y. Discharge Characteristics and Gas Production Laws of Ester Insulating Oil Under Needle-plate Electrode. Power Syst. Technol. 2024, 48, 405–416. [Google Scholar]
- Sunka, P.; Babický, V.; Clupek, M.; Lukes, P.; Simek, M.; Schmidt, J.; Cernák, M. Generation of chemically active species by electrical discharges in water. Plasma Sources Sci. Technol. 1999, 8, 56–64. [Google Scholar] [CrossRef]
- Ilie, S.; Letitia, G.; Iustin, G.; Sorin, B.; Lucian, D. Experimental characterization of multi-point corona discharge devices for direct ozonization of liquids. J. Electrost. 2002, 54, 207–214. [Google Scholar]
- Zhou, G.Y. Study on Influence of Shock Waves Induced byUnderwater Pulse Current Discharges. Master’s Thesis, Huazhong University of Science and Technology, Wuhan, China, 2018. [Google Scholar]
- Wu, M.; Liu, Y.; Lin, F.; Liu, S.; Sun, J. Characteristics analysis of electrohydraulic shockwave. High Power Laser Part. Beams 2020, 32, 116–122. [Google Scholar]
- Qian, Y.; Feng, Y.; Huang, M.; Song, X. Formation and Growth of Plasma Channels Generated by Discharge of High Voltage Nanosecond Pulse in Water: A Simulation Study. Chin. J. Vac. Sci. Technol. 2019, 39, 1119–1129. [Google Scholar]
- Yin, K.Q. Study on Corona Discharge Charactcristios of Short Air Gap Based on Plasma Chemistry Model. Master’s Thesis, Shandong University of Technology, Zibo, China, 2023. [Google Scholar]
- Wang, C. Emission Spectra of Corona Dischargewith Submillimeter Gap. Master’s Thesis, Harbin University of Science and Technology, Harbin, China, 2023. [Google Scholar]
- Li, D.H. A Simulation Study on SLC Electrode Characteristics of Plasma Impulse Sound Source. Master’s Thesis, Xi’an Shiyou University, Xi’an, China, 2023. [Google Scholar]
- Tong, D.; Zhu, X.; Zou, X.; Wang, X. Numerical Simulation of the Preheating Process of Pulse Discharge in Water. High Volt. Eng. 2019, 45, 1461–1467. [Google Scholar]
- Yu, Y.; Zhu, X.; Huang, K.; Zou, X.; Wang, X. Experimental Study on Pulse Discharge Characteristics in Water Applied to Oil Plugging and Increasing Production. High Volt. Eng. 2020, 46, 2951–2959. [Google Scholar]
- Chen, X.L.; Jiang, C.; Zhuang, C.X.; Tang, X.M. Response characteristics of monopole sonic log in double casing strings. Chin. J. Geophys. 2020, 63, 4268–4276. [Google Scholar]
- Li, S.; Tang, X.; He, J.; Xu, S.; Sun, F.; Su, Y. Fracture characterization combining acoustic reflection imaging and rock mechanics. Acta Pet. Sin. 2020, 41, 1388–1395. [Google Scholar]
- Zuo, C.J. Research on the Measurement Resolution of Phased Array Acoustic Logging. Ph.D. Thesis, China University of Petroleum, Beijing, China, 2021. [Google Scholar]
- Cao, X.Y. Study on Acoustic Field Characteristics of Multipole Source in Cased Hole in Porous Formation. Master’s Thesis, Jilin University, Jilin, China, 2022. [Google Scholar]


| Structural Part | Parameters |
|---|---|
| Needle tip radius/mm | 0.1 |
| Needle base radius/mm | 0.5 |
| Needle tip height/mm | 1 |
| Needle shaft height/mm | 10 |
| Plate structure radius/mm | 1 |
| Plate structure height/mm | 1 |
| Measured Results | Simulated Results | Relative Error | |
|---|---|---|---|
| Pre-breakdown phase time/ms | 0.19 | 0.181 | −4.74% |
| Peak discharge current/kA | 25 | 25.18 | 0.72% |
| Peak impulse wave intensity/MPa | 5 | 5.08 | 1.60% |
| Electroacoustic energy conversion efficiency | 3.91 | 3.95 | 1.02% |
| Peak Discharge Current (kA) | Maximum Impulse Wave Pressure (MPa) | Electroacoustic Conversion Efficiency (%) | |
|---|---|---|---|
| Needle–Plate Emitter Source | 25.18 | 5.08 | 3.91 |
| Hollow Spherical Tip Needle–Plate Emitter Source | 25.77 | 6.46 | 5.01 |
| Growth Rate | 2.3% | 27.2% | 28.1% |
| Emitter Source | Radiation Frequency | Propagation Attenuation | Detection Range | Detection Resolution | Directional Directivity |
|---|---|---|---|---|---|
| Monopole Emitter [42] | 10–15 kHz | Fast | A few meters | Good | Poor |
| Dipole Emitter [43] | Below 5 kHz | Medium speed | Tens of meters | Poor | Moderate |
| Phased-Array Emitter [44] | 14 kHz | Fast | Tens of meters | Moderate | Good |
| Multipole Emitter [45] | 15–25 kHz | Slow | Tens of meters | Good | Moderate |
| Hollow Spherical-Tip Needle–Plate Emitter | Below 100 kHz | Dependent on frequency, adjustable | Hundreds of meters | Dependent on frequency, adjustable | Good (with focusing device) |
Disclaimer/Publisher’s Note: The statements, opinions and data contained in all publications are solely those of the individual author(s) and contributor(s) and not of MDPI and/or the editor(s). MDPI and/or the editor(s) disclaim responsibility for any injury to people or property resulting from any ideas, methods, instructions or products referred to in the content. |
© 2025 by the authors. Licensee MDPI, Basel, Switzerland. This article is an open access article distributed under the terms and conditions of the Creative Commons Attribution (CC BY) license (https://creativecommons.org/licenses/by/4.0/).
Share and Cite
Gao, X.; Zhou, J.; Du, X. Experimental Research on and Optimization of Plasma Emitter Sources. Sensors 2025, 25, 1715. https://doi.org/10.3390/s25061715
Gao X, Zhou J, Du X. Experimental Research on and Optimization of Plasma Emitter Sources. Sensors. 2025; 25(6):1715. https://doi.org/10.3390/s25061715
Chicago/Turabian StyleGao, Xu, Jing Zhou, and Xiao Du. 2025. "Experimental Research on and Optimization of Plasma Emitter Sources" Sensors 25, no. 6: 1715. https://doi.org/10.3390/s25061715
APA StyleGao, X., Zhou, J., & Du, X. (2025). Experimental Research on and Optimization of Plasma Emitter Sources. Sensors, 25(6), 1715. https://doi.org/10.3390/s25061715