3.1. Experimental Platform
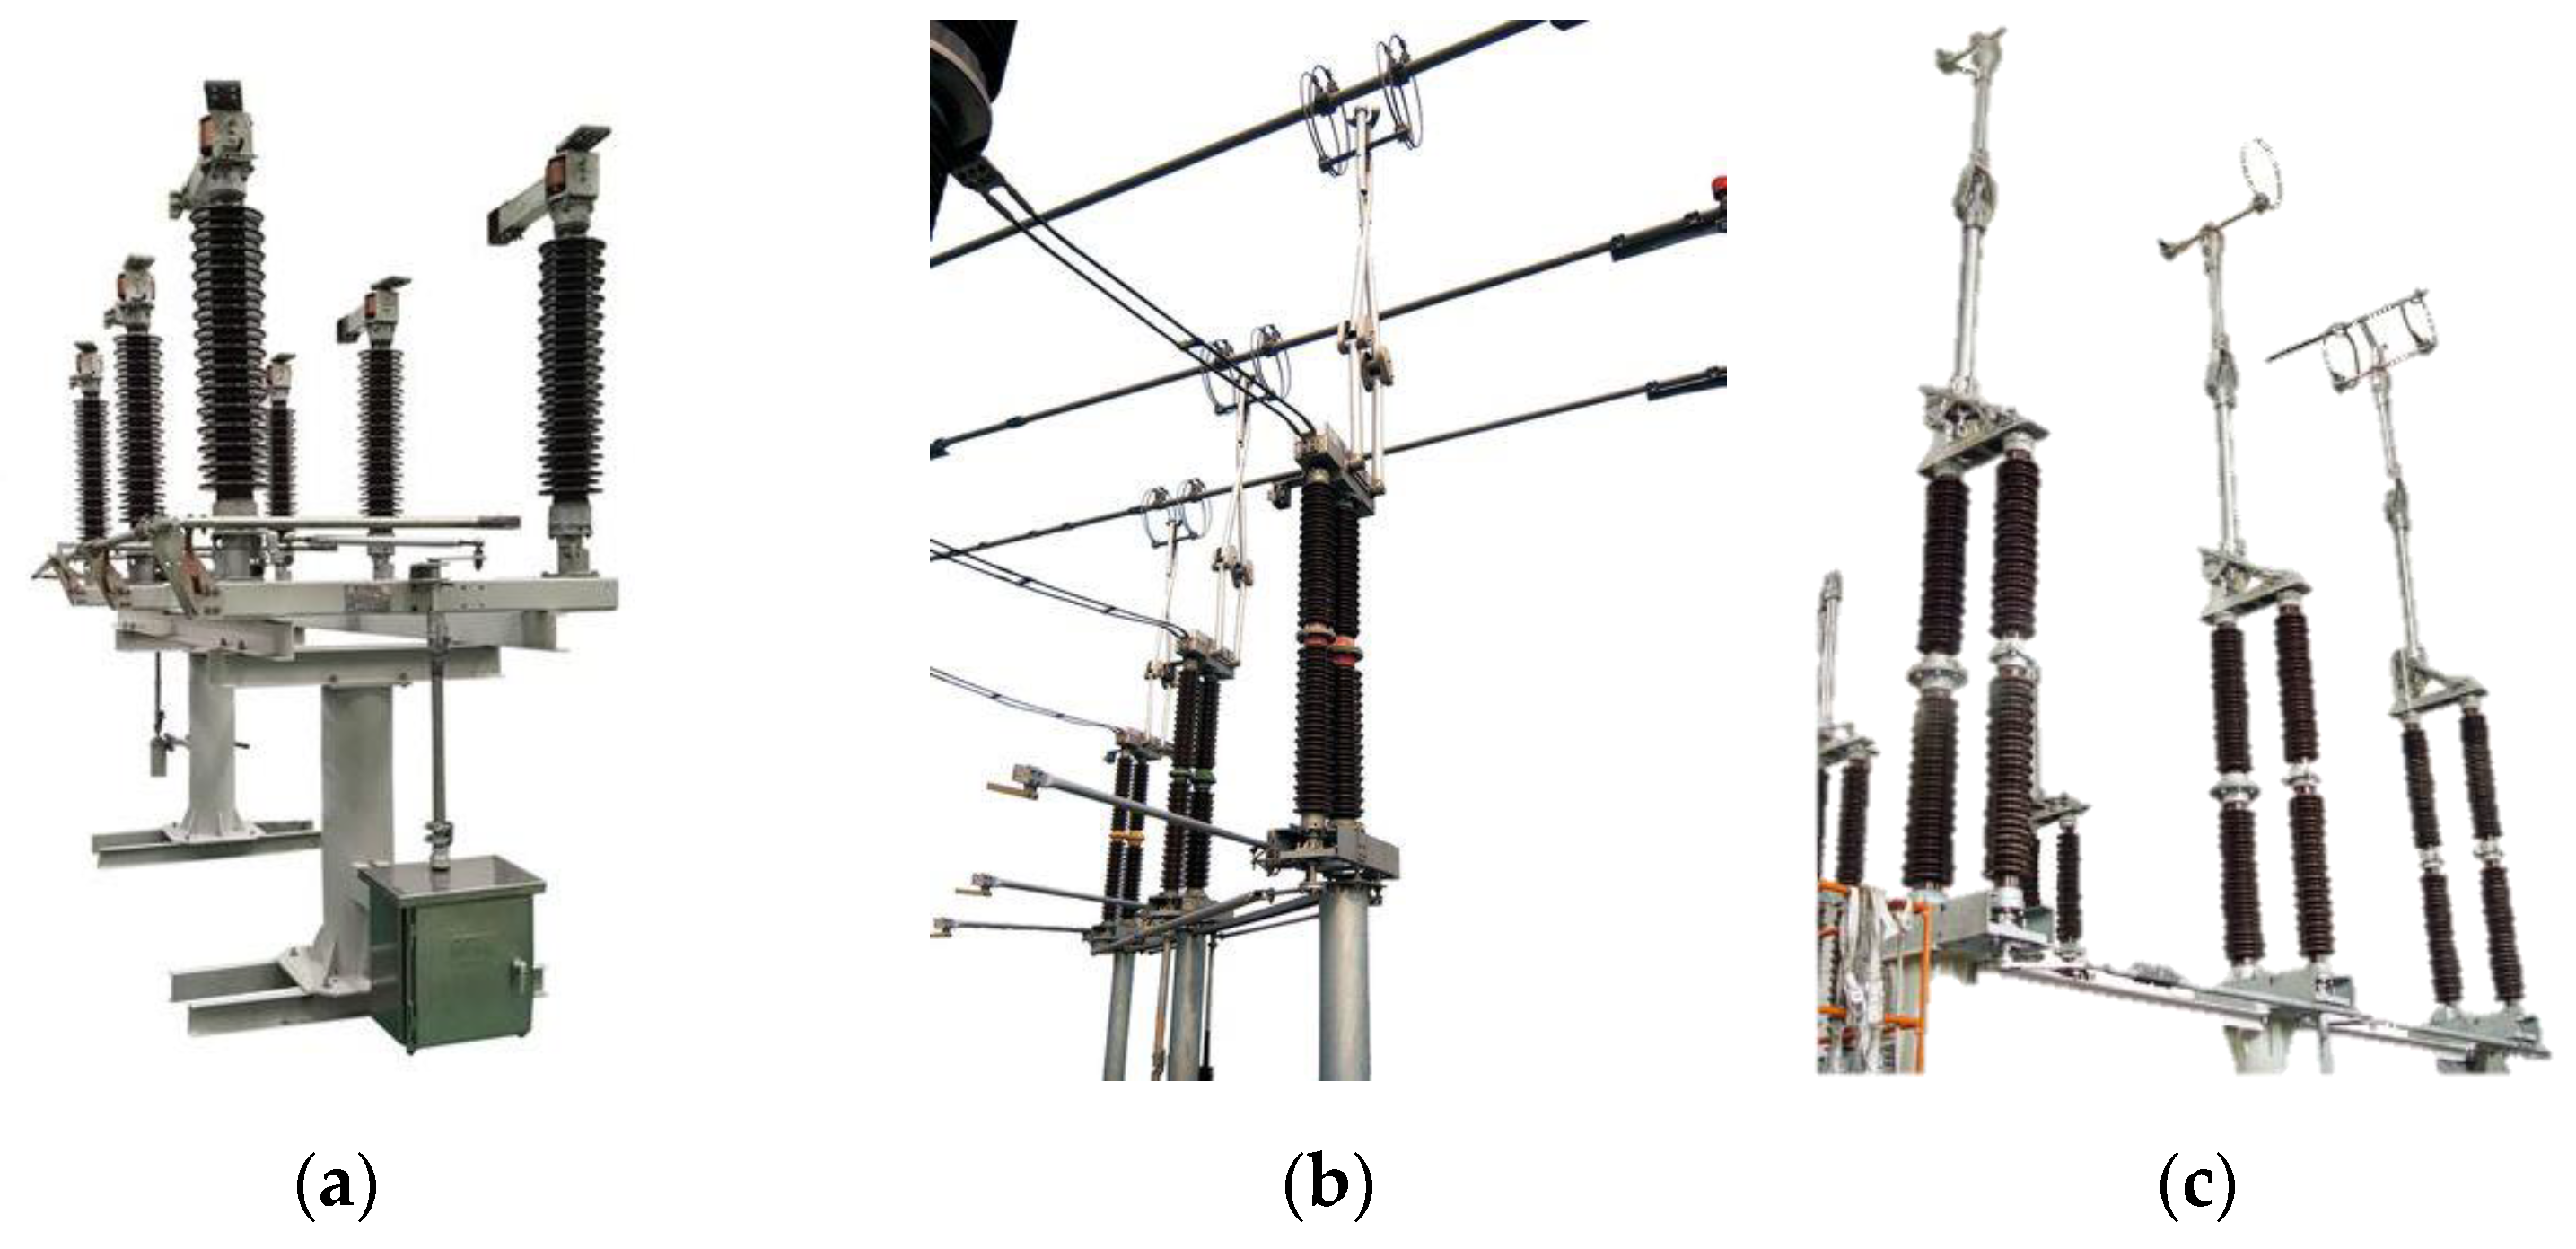
This study uses the GW4-126, GW6-252 and GW22-252 types of HVDs, as shown in
Figure 3. GW4-126 is a double column horizontal rotating structure HVD, where the closing and opening of the contacts are completed by rotation. GW6-252 and GW22-252 are, respectively, single column double arm vertical telescopic structures and single column single arm vertical telescopic HVDs, which achieve circuit opening and closing through vertical separation of contacts. These types of HVDs have been widely adopted in 110 kV and 220 kV substations and transmission lines, making them highly representative of commonly used equipment at these voltage levels.
In this study, the motor power detection system used for data collection consists of open Hall current sensors, electric clamps, an analog signal conversion circuit, a data acquisition card, and a PC, as shown in
Figure 4. The parameters of the signal acquisition device are shown in
Table 2. During the experiment, the system is installed in a centralized control box that houses multiple HVD motor power supplies.
According to substation electrical equipment operation specifications, during HVD’s operation in a substation, personnel should follow the sequence one by one outlined in the operation ticket, meaning that there is only one HVD operating at a time. Therefore, in practical applications, even if the measured branch supplies power to multiple HVDs, the fact that no two HVDs operate simultaneously within a substation will not affect the measurement of action data and the state diagnosis for an individual HVD.
The installation of the sensor for the detection system does not require any modifications to the original circuit of the centralized control box. For the current sensor, it is only necessary to open the sensor, pass the measured cable through the detection hole, and then close the sensor. For voltage acquisition, the power clamp only needs to be clamped to the AC power breakpoint.
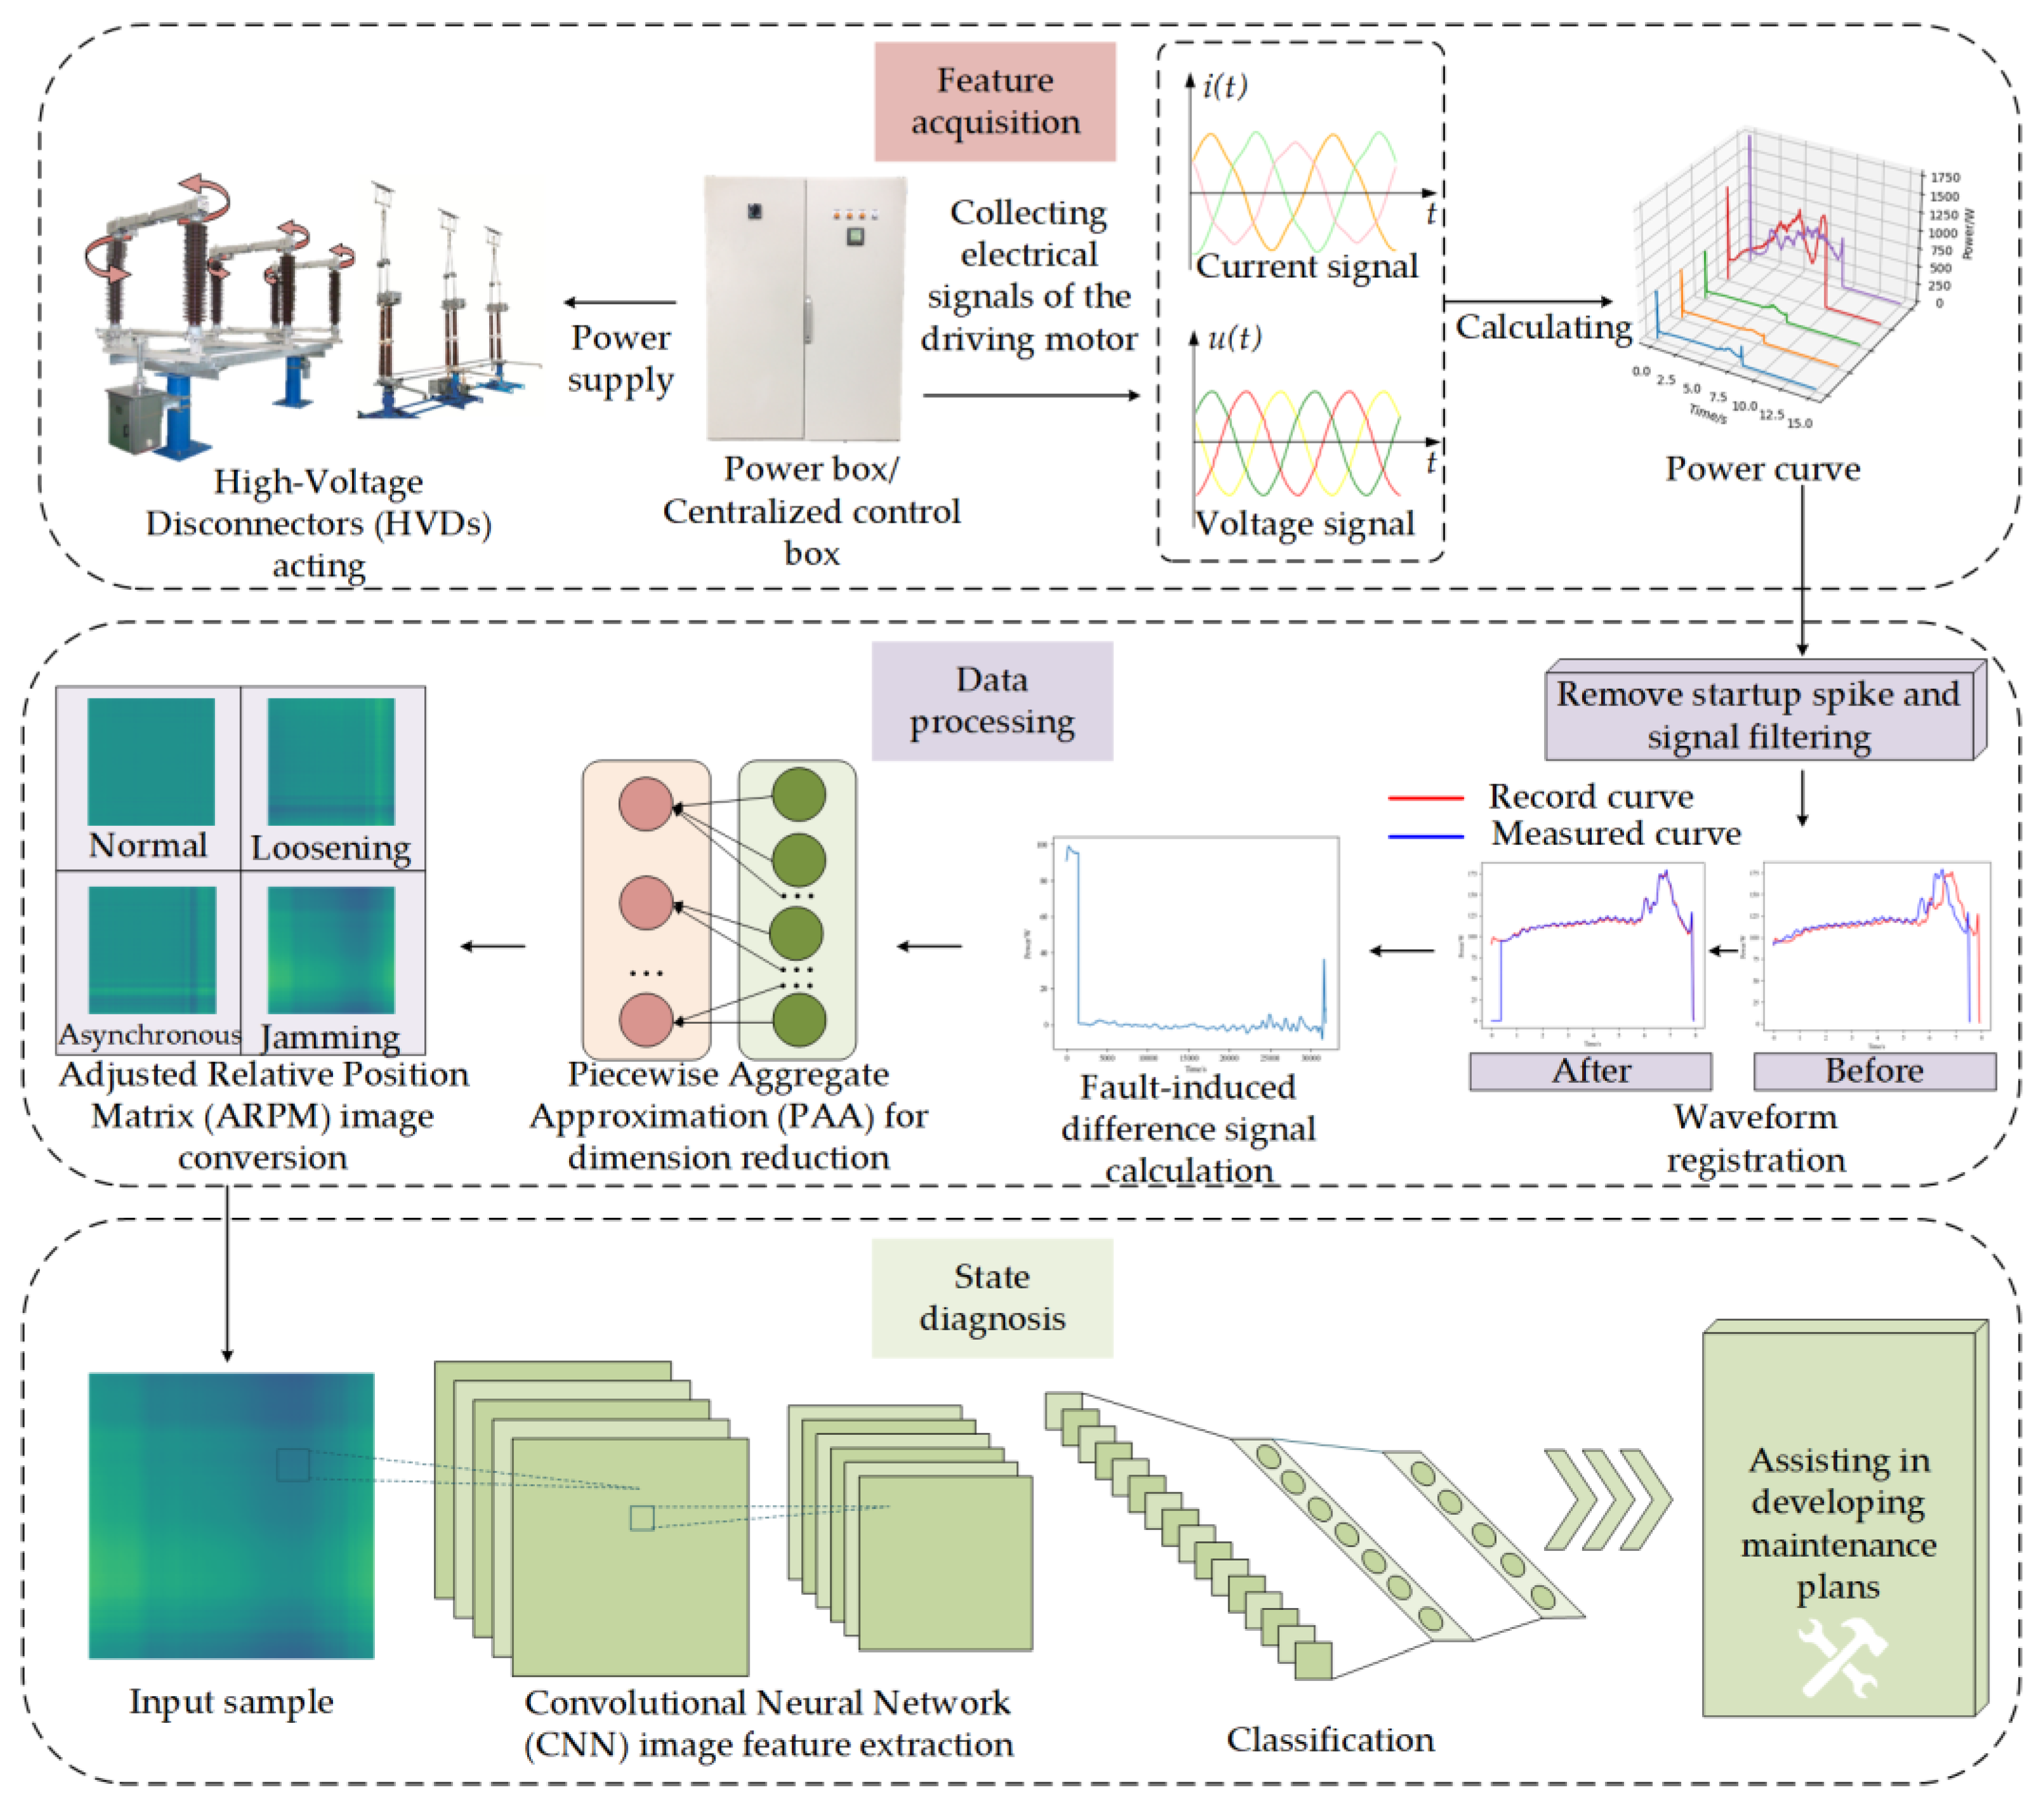
3.3. Data Acquisition and Display
Following the simulation of diverse states of the HVD via the aforementioned methodologies, the three-phase voltage and current data were gathered at an acquisition frequency of 4000 Hz. By repetitively engaging and disengaging the disconnector in identical conditions, multiple sets of sample data were amassed to construct the sample library further.
The operational power signals of HVDs under different operating conditions are shown in
Figure 5. Nevertheless, given that the start-up phase represents an intrinsic motor characteristic with a very brief duration, it typically lacks significant state information regarding the HVD. Therefore, in this study, the peak at startup is removed. From
Figure 5, it can be observed that for signals under the same HVD state, we present the results of three measurements. These results indicate that the operational power signals of the HVD exhibit good repeatability under identical conditions. This is because when the HVD operates under the same mechanical state, the force acting on the rotating spindle of the HVD is relatively stable at the corresponding moment. Only when the mechanical state changes does the torque driving the HVD mechanism vary, resulting in corresponding changes in the motor power. Additionally, the tests revealed that there were no significant differences in the operational signals of the HVD when collected at higher sampling frequencies and bandwidths. Consequently, the subsequent experiments in this study maintained a sampling rate of 4000 Hz. The analysis process for opening and closing operations is similar; however, the closing operation contains more critical information about certain conditions, such as IC. Therefore, this paper will focus primarily on analyzing the closing process of HVDs.
In the NS, the GW4-126 operates with uniform rotation during the initial phase of the mechanism, resulting in stable force on the main shaft. The motor only outputs power to overcome friction, whereas in the later stage, due to the engagement of the contact fingers, the power signal exhibits peaks, with a maximum value of 176 W. Meanwhile, the motors of GW6-252 and GW22-252 overcome the weight of the mechanism during the early operation stage, leading to noticeable fluctuations and an upward trend in power; peaks also occur at the moment of contact engagement. The GW6-252 reaches a maximum power of 747 W during the ascent phase and the GW22-252 peaks at 1289 W during the final contact engagement stage. The average power of GW4-126 is 121 W, GW6-252 is 454 W, and GW22-252 is 745 W. There are significant differences in the action times, maximum and average power, as well as their respective timestamps among the three HVDs. In the IC state, the force conditions affecting the HVD mechanism are largely similar to those in the NS, except that the limit switch is triggered prematurely in the final operation stage. Thus, the signals of three HVDs all closely mirror that of the NS, but with the exception of a segment missing towards the end of the signal. In the TA state of the GW4-126, when the contacts are fitting, the internal contact fingers of phases B and C make contact with the terminals prematurely. This results in the signal initially exceeding and then falling below the NS signal and a slight increase at maximum power. However, the signals of GW6-252 and GW22-252 display slightly different behavior, with the signal first falling below and then exceeding the NS signal. The maximum value of GW6-252 remains nearly unchanged. In contrast, the maximum power of GW22-252 shows a slight increase, but the time at which this maximum occurs has shifted. This difference arises because, during the simulating process, the travel of the phase A mechanism was slightly adjusted to lag behind. Despite this variation, the overall characteristics of both are relatively similar. In the LD state, due to the motors of three HVDs exclusively actuating only one phase mechanism, the force on the main shaft is reduced compared to the NS throughout the operation, so there is a noticeable reduction in the amplitude of the power signal throughout the operation process when compared to the NS. In the case of LJ, the additional tension from the elastic belt increases the torque acting on the HVD mechanism, then the increased force on the HVD mechanism leads to a rise in motor torque, resulting in the overall amplitude of the power signal being higher than under NS. The maximum power of GW4-126 increased to 190 W, while GW6-252 saw an increase to 947 W, and GW22-252 increased to 1583 W. In the SJ state, the impact of the fault on the HVD is consistent with that observed in the LJ state, but this characteristic becomes more pronounced. The maximum power of GW4-126 increased to 219 W, GW6-252 to 997 W, and GW22-252 to 1687 W.
Continuous Wavelet Transform (CWT) is a powerful time-frequency analysis tool, particularly effective in handling non-stationary signals. To further explore the potential time-frequency commonalities in the operational signals of the three HVDs, this study applies CWT for signal analysis. Considering that the operational power signals of the HVDs are transient signals and that the Morlet wavelet exhibits excellent time-frequency localization capabilities, making it especially suitable for processing transient signals, then Morlet wavelet is selected as the wavelet basis. As shown in
Figure 5, the motor power signals of the HVDs contain significant DC components (bias), and there are substantial differences in the overall power amplitudes of the operational signals among the different HVDs. Therefore, before applying CWT, the signals were normalized, and the DC components were filtered out using Fast Fourier Transform (FFT) to prevent the DC component from disproportionately affecting the time-frequency distribution of the signal energy. The CWT results for each operational signal are illustrated in
Figure 6.
From
Figure 6, it can be observed that during operation, the signal frequencies of the three HVDs are primarily concentrated in the ultra-low frequency range (0–1.5 Hz). The frequency distributions of the operational signals for the same HVD under different states are relatively similar. All three HVDs exhibit a strong energy distribution around 0–0.2 Hz, but they show significant differences in other time-frequency characteristics. For GW4-126, the operational signals display a strong energy distribution in the latter half of the operation period, particularly in the 0.35–1.0 Hz range. In the IC, TA, LJ, and SJ states, the signals demonstrate a decreasing trend in energy at 1.4 Hz around 7 s, with the time-frequency characteristics of IC and LJ being quite similar, while SJ also shows a decline in energy at 0.5 Hz. The frequency distribution characteristics of GW22-220 are somewhat similar to those of GW4-126, with operational signals also exhibiting strong energy distribution in the 0.35–1.0 Hz range during the latter half of the operation period. However, GW22-220 does not display the same time-frequency characteristics across different states as GW4-126 does. For instance, GW6-252 shows no significant differences between the LJ state and the NS. The operational signals of GW6-252 differ considerably in time-frequency characteristics from the other two HVDs, primarily exhibiting strong energy distribution in the 0.3–0.8 Hz range during the first half of the operation period. Additionally, the trends observed in the fault state of GW6-252 show almost no commonality with the other two HVDs.
The significant structural differences among the three HVDs result in considerable variations in their motor operation power curves, making it difficult to find commonalities based on specific time-domain features, such as the amplitude of the maximum power, the timing of the maximum values, and the average power. Similarly, in terms of time-frequency characteristics, the three HVDs do not exhibit similar frequency distribution patterns. Consequently, it is challenging to derive features that could unify the common influences of different states on the HVDs from either the time domain or the time-frequency perspective. But it can be seen that characteristic differences caused by the same type of fault are remarkably similar. Thus, this explains that the method employed in this paper, which involves aligning the fault signals with normal signals and then calculating the differences to obtain the FDS, is indeed a reasonable approach.
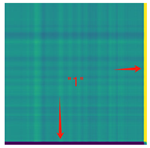
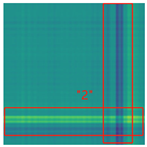
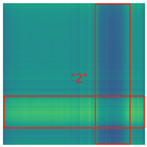
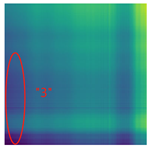
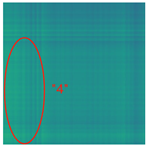
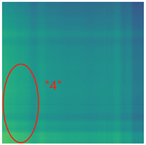
By processing the operational signals under different states and converting them into ARPM two-dimensional plane data, the resulting visualizations are shown in
Table 4, The legend enhances the color differentiation, making the visual distinctions more pronounced. To provide better clarification, features have been highlighted in red.
From
Table 4, it can be observed that the amplitude variations and relative changes in sequence values in the time-series signals are represented in the relative position matrix through the thickness, density, and color intensity of the stripes. Specifically, for the label “1”, it can be observed that in the IC, the ARPMs of the three HVDs exhibits distinct stripes on the right and bottom, indicating significant abnormalities in the final stages of HVDs operation. For label “2”, the ARPMs of the three HVDs in the TA shows an intersection of bright horizontal stripes and dark vertical stripes, demonstrating fluctuations in output magnitude compared to the NS during operation. For label “3”, the ARPMs of all three HVDs appears darker in the marked area under the LD. In contrast, for label “4”, the ARPMs show a localized brightening, which is opposite to the image characteristics of label “3”. This corresponds to the observation that HVDs exhibit greater output in the LJ state compared to the normal state, while showing reduced output in the LD state. For label “5”, the ARPM of the three HVDs displays a similar characteristic to that of label “4”, but with a more pronounced intensity. Due to differences in action time, mechanical design, and fault simulation levels, the positions and shapes of the stripes in the ARPMs are not completely identical for the three HVDs under the same states. However, overall, the ARPM between different classes exhibits distinct stripe color characteristics, which facilitate CNNs in better feature extraction and learning. Meanwhile, for different HVDs under the same state, the RPM demonstrates a high degree of intra-class similarity, aiding the CNN in adapting to and recognizing samples not included in the training set.
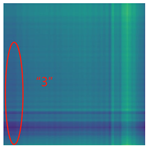
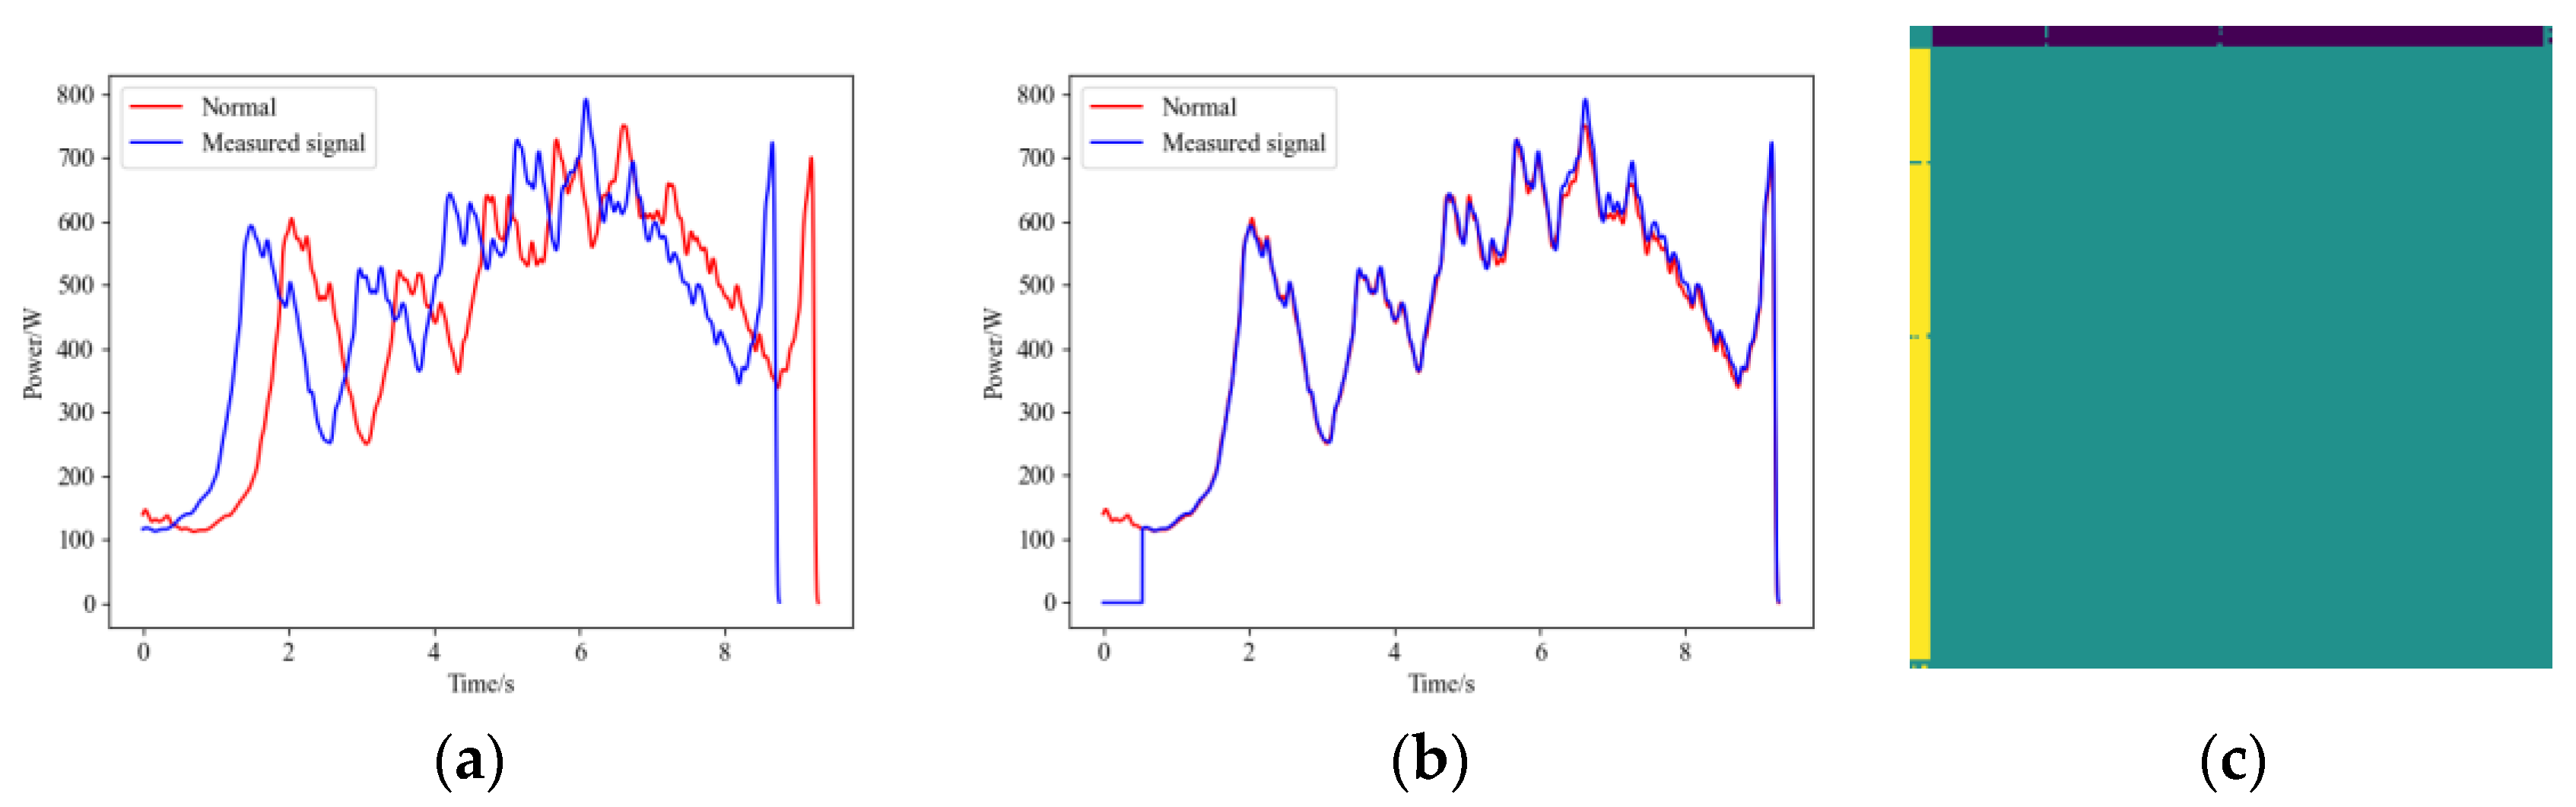
After the HVD undergoes maintenance or adjustment, its mechanism travel may change. Specifically, for the open position of the HVD, there may be no reference travel point, so maintenance personnel typically do not fine-tune it to a precise position. When the HVD’s open position travel is advanced following maintenance or adjustment, its operational signal will appear as shown in
Figure 7a. In this state, the HVD is still considered to be functioning normally. However, if this signal is not properly aligned with the recorded NS signal, resulting in misalignment, the calculated FDS may contain incorrect information, leading to errors in the diagnostic model. The operational signal after proper alignment is shown in
Figure 7b, and the ARPM after the GW22-252 HVD’s travel-changing operational signal is shown in
Figure 7c. In light of this situation, we have also included samples with adjusted travel in the dataset.
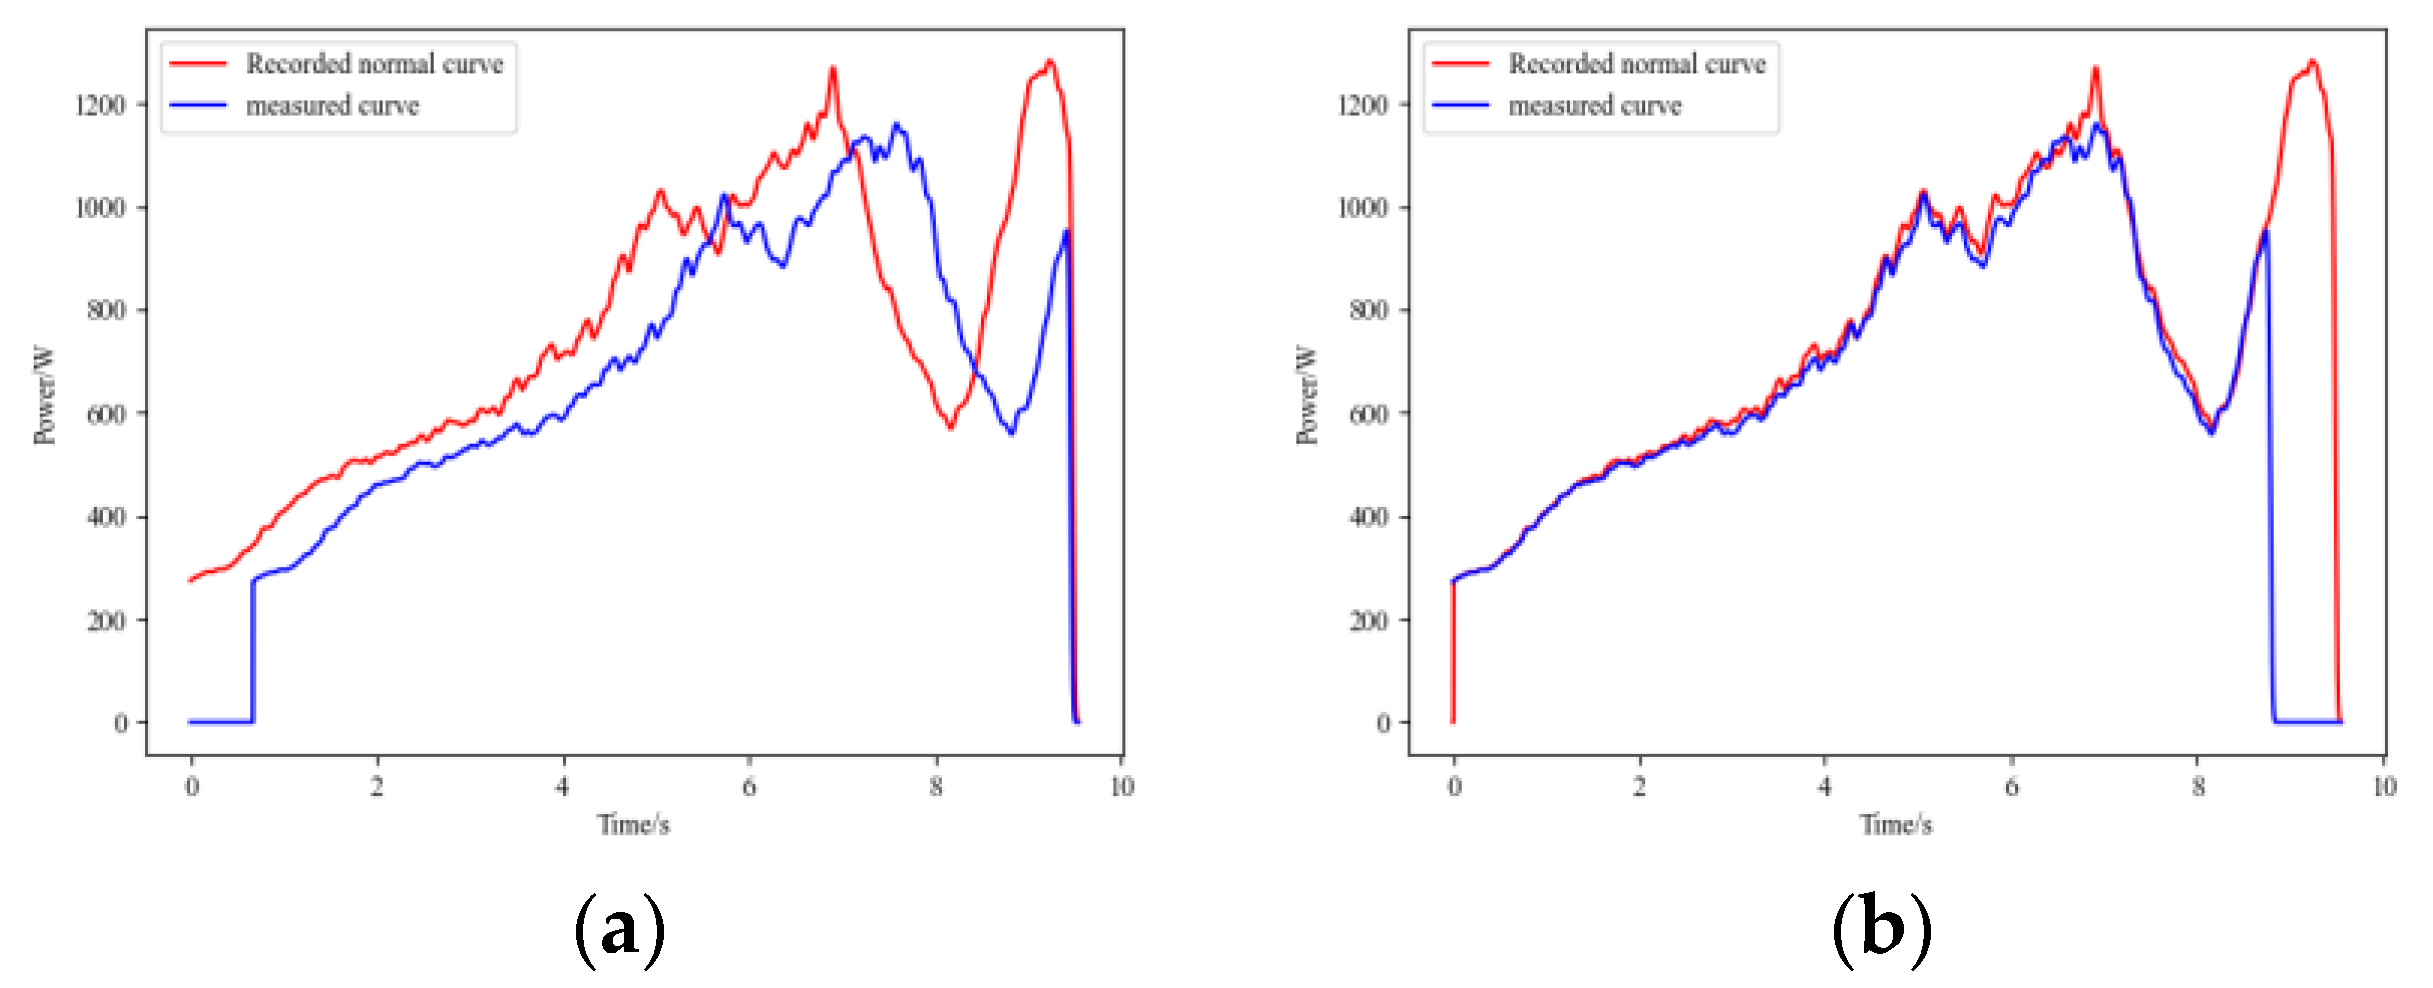
Additionally, if the waveform registration algorithm is unreliable and there are significant errors in curve alignment, the resulting FDS may contain erroneous information.
Figure 8 shows the matching results between the IC signals and normal operational signals for GW22-252, both before and after improvement. It can be observed that the method before improvement exhibits a sharp rise in the latter part of the signal curve, resulting in an excessively high cross-correlation coefficient and leading to alignment errors.
To further investigate the impact of noise on the waveform registration algorithm proposed in this paper, different intensities of Gaussian white noise were added to the HVD operation signals to control the signal-to-noise ratio (SNR). We compared the accuracy of the waveform registration algorithm under different SNR conditions with and without filtering. In terms of filter selection, we chose Gaussian filtering because, while low-pass filtering can introduce ringing effects and lose signal fluctuations’ details, Gaussian filtering quickly smooths the signal while preserving waveform details. The comparative results are shown in
Table 5.
The data indicate that as the SNR decreases, the accuracy of the algorithm without filtering drops rapidly. In contrast, when signal filtering is applied, the robustness of the proposed waveform registration algorithm is significantly enhanced.


