

The Development and Validation of a Novel Smartphone Application to Detect Postural Instability


Abstract
1. Introduction
2. Materials and Methods
2.1. Participants
2.2. Instrumentation and Data Processing
2.2.1. Smartphone Application
2.2.2. Motion Capture (MC)
2.2.3. Force Plate (FP)
2.2.4. Postural Formulae
2.2.5. Postural Task and Protocol
2.2.6. Statistical Analysis
3. Results
4. Discussion
5. Conclusions
Author Contributions
Funding
Institutional Review Board Statement
Informed Consent Statement
Data Availability Statement
Acknowledgments
Conflicts of Interest
References
- Pollock, A.S.; Durward, B.R.; Rowe, P.J.; Paul, J.P. What is balance? Clin. Rehabil. 2000, 14, 402–406. [Google Scholar] [CrossRef] [PubMed]
- Ivanenko, Y.; Gurfinkel, V.S. Human Postural Control. Front. Neurosci. 2018, 12, 171. [Google Scholar] [CrossRef]
- Winter, D. Human balance and posture control during standing and walking. Gait Posture 1995, 3, 193–214. [Google Scholar] [CrossRef]
- Houry, D.; Florence, C.; Baldwin, G.; Stevens, J.; McClure, R. The CDC Injury Center’s response to the growing public health problem of falls among older adults. Am. J. Lifestyle Med. 2016, 10, 74–77. [Google Scholar] [CrossRef]
- Buatois, S.; Gueguen, R.; Gauchard, G.C.; Benetos, A.; Perrin, P.P. Posturography and risk of recurrent falls in healthy non-institutionalized persons aged over 65. Gerontology 2006, 52, 345–352. [Google Scholar] [CrossRef]
- Pletcher, E.R.; Williams, V.J.; Abt, J.P.; Morgan, P.M.; Parr, J.J.; Wohleber, M.F.; Lovalekar, M.; Sell, T.C. Normative Data for the NeuroCom Sensory Organization Test in US Military Special Operations Forces. J. Athl. Train. 2017, 52, 129–136. [Google Scholar] [CrossRef]
- Howcroft, J.; Lemaire, E.D.; Kofman, J.; McIlroy, W.E. Elderly fall risk prediction using static posturography. PLoS ONE 2017, 12, e0172398. [Google Scholar] [CrossRef] [PubMed]
- Richmond, S.B.; Fling, B.W.; Lee, H.; Peterson, D.S. The assessment of center of mass and center of pressure during quiet stance: Current applications and future directions. J. Biomech. 2021, 123, 110485. [Google Scholar] [CrossRef]
- Spaniolas, K.; Cheng, J.D.; Gestring, M.L.; Sangosanya, A.; Stassen, N.A.; Bankey, P.E. Ground Level Falls Are Associated with Significant Mortality in Elderly Patients. J. Trauma Inj. Infect. Crit. Care 2010, 69, 821–825. [Google Scholar] [CrossRef] [PubMed]
- Rhea, C.K.; Yamada, M.; Kuznetsov, N.A.; Jakiela, J.T.; LoJacono, C.T.; Ross, S.E.; Haran, F.J.; Bailie, J.M.; Wright, W.G. Neuromotor changes in participants with a concussion history can be detected with a custom smartphone app. PLoS ONE 2022, 17, e0278994. [Google Scholar] [CrossRef] [PubMed]
- Anthony, E.C.; Kam, O.K.; Klisch, S.M.; Hazelwood, S.J.; Berg-Johansen, B. Balance Assessment Using a Handheld Smartphone with Principal Component Analysis for Anatomical Calibration. Sensors 2024, 24, 5467. [Google Scholar] [CrossRef] [PubMed]
- De Groote, F.; Vandevyvere, S.; Vanhevel, F.; Orban de Xivry, J.J. Validation of a smartphone embedded inertial measurement unit for measuring postural stability in older adults. Gait Posture 2021, 84, 17–23. [Google Scholar] [CrossRef]
- Pinho, A.S.; Salazar, A.P.; Hennig, E.M.; Spessato, B.C.; Domingo, A.; Pagnussat, A.S. Can We Rely on Mobile Devices and Other Gadgets to Assess the Postural Balance of Healthy Individuals? A Systematic Review. Sensors 2019, 19, 2972. [Google Scholar] [CrossRef] [PubMed]
- Hou, Y.R.; Chiu, Y.L.; Chiang, S.L.; Chen, H.Y.; Sung, W.H. Development of a Smartphone-Based Balance Assessment System for Subjects with Stroke. Sensors 2019, 20, 88. [Google Scholar] [CrossRef] [PubMed]
- Rashid, U.; Barbado, D.; Olsen, S.; Alder, G.; Elvira, J.L.; Lord, S.; Niazi, I.K.; Taylor, D. Validity and Reliability of a Smartphone App for Gait and Balance Assessment. Sensors 2021, 22, 124. [Google Scholar] [CrossRef] [PubMed]
- Ting, K.C.; Lin, Y.C.; Chan, C.T.; Tu, T.Y.; Shih, C.C.; Liu, K.C.; Tsao, Y. Inertial Measurement Unit-Based Romberg Test for Assessing Adults with Vestibular Hypofunction. IEEE J. Transl. Eng. Health Med. 2024, 12, 245–255. [Google Scholar] [CrossRef]
- Foulger, L.H.; Reiter, E.R.; Kuo, C.; Carpenter, M.G.; Blouin, J.S. Estimating whole-body centre of mass sway during quiet standing with inertial measurement units. PLoS ONE 2025, 20, e0315851. [Google Scholar] [CrossRef]
- ConsumerAffairs. How Many Americans Own a Smartphone? Available online: https://www.consumeraffairs.com/ (accessed on 15 December 2024).
- Frechette, M.L.; Abou, L.; Rice, L.A.; Sosnoff, J.J. The Validity, Reliability, and Sensitivity of a Smartphone-Based Seated Postural Control Assessment in Wheelchair Users: A Pilot Study. Front. Sports Act. Living 2020, 2, 540930. [Google Scholar] [CrossRef]
- Marshall, C.J.; Ganderton, C.; Feltham, A.; El-Ansary, D.; Pranata, A.; O’Donnell, J.; Takla, A.; Tran, P.; Wickramasinghe, N.; Tirosh, O. Smartphone Technology to Remotely Measure Postural Sway during Double- and Single-Leg Squats in Adults with Femoroacetabular Impingement and Those with No Hip Pain. Sensors 2023, 23, 5101. [Google Scholar] [CrossRef]
- Hsieh, K.L.; Roach, K.L.; Wajda, D.A.; Sosnoff, J.J. Smartphone technology can measure postural stability and discriminate fall risk in older adults. Gait Posture 2019, 67, 160–165. [Google Scholar] [CrossRef] [PubMed]
- Duarte, M.B.; da Costa Moraes, A.A.; Ferreira, E.V.; da Silva Almeida, G.C.; da Rocha Santos, E.G.; Pinto, G.H.L.; de Oliveira, P.R.; Amorim, C.F.; dos Santos Cabral, A.; Saunier, G.; et al. Validity and reliability of a smartphone-based assessment for anticipatory and compensatory postural adjustments during predictable perturbations. Gait Posture 2022, 96, 9–17. [Google Scholar] [CrossRef] [PubMed]
- Patterson, J.A.; Amick, R.Z.; Thummar, T.; Rogers, M.E. Validation of measures from the smartphone sway balance application: A pilot study. Int. J. Sports Phys. Ther. 2014, 9, 135–139. [Google Scholar]
- Mancini, M.; Salarian, A.; Carlson-Kuhta, P.; Zampieri, C.; King, L.; Chiari, L.; Horak, F.B. ISway: A sensitive, valid and reliable measure of postural control. J. Neuroeng. Rehabil. 2012, 9, 59. [Google Scholar] [CrossRef]
- Ozinga, S.J.; Machado, A.G.; Miller Koop, M.; Rosenfeldt, A.B.; Alberts, J.L. Objective assessment of postural stability in Parkinson’s disease using mobile technology. Mov. Disord. 2015, 30, 1214–1221. [Google Scholar] [CrossRef] [PubMed]
- Kosse, N.M.; Caljouw, S.; Vervoort, D.; Vuillerme, N.; Lamoth, C.J.C. Validity and Reliability of Gait and Postural Control Analysis Using the Tri-axial Accelerometer of the iPod Touch. Ann. Biomed. Eng. 2015, 43, 1935–1946. [Google Scholar] [CrossRef] [PubMed]
- Cerrito, A.; Bichsel, L.; Radlinger, L.; Schmid, S. Reliability and validity of a smartphone-based application for the quantification of the sit-to-stand movement in healthy seniors. Gait Posture 2015, 41, 409–413. [Google Scholar] [CrossRef]
- Grouios, G.; Ziagkas, E.; Loukovitis, A.; Chatzinikolaou, K.; Koidou, E. Accelerometers in Our Pocket: Does Smartphone Accelerometer Technology Provide Accurate Data? Sensors 2022, 23, 192. [Google Scholar] [CrossRef] [PubMed]
- Apple Developer Documentation. Getting Raw Accelerometer Events. Available online: https://developer.apple.com/documentation/CoreMotion (accessed on 31 January 2025).
- Ma, C.; Wong, D.; Lam, W.; Wan, A.; Lee, W. Balance Improvement Effects of Biofeedback Systems with State-of-the-Art Wearable Sensors: A Systematic Review. Sensors 2016, 16, 434. [Google Scholar] [CrossRef] [PubMed]
- Moe-Nilssen, R.; Helbostad, J.L. Trunk accelerometry as a measure of balance control during quiet standing. Gait Posture 2002, 16, 60–68. [Google Scholar] [CrossRef] [PubMed]
- Lamoth, C.J.C.; van Lummel, R.C.; Beek, P.J. Athletic skill level is reflected in body sway: A test case for accelometry in combination with stochastic dynamics. Gait Posture 2009, 29, 546–551. [Google Scholar] [CrossRef] [PubMed]
- Whitney, S.L.; Roche, J.L.; Marchetti, G.F.; Lin, C.C.; Steed, D.P.; Furman, G.R.; Musolino, M.C.; Redfern, M.S. A comparison of accelerometry and center of pressure measures during computerized dynamic posturography: A measure of balance. Gait Posture 2011, 33, 594–599. [Google Scholar] [CrossRef]
- Henriksen, M.; Lund, H.; Moe-Nilssen, R.; Bliddal, H.; Danneskiod-Samsøe, B. Test-retest reliability of trunk accelerometric gait analysis. Gait Posture 2004, 19, 288–297. [Google Scholar] [CrossRef] [PubMed]
- Freeman, L.; Gera, G.; Horak, F.B.; Blackinton, M.T.; Besch, M.; King, L. Instrumented Test of Sensory Integration for Balance: A Validation Study. J. Geriatr. Phys. Ther. 2018, 41, 77–84. [Google Scholar] [CrossRef] [PubMed]
- Ghislieri, M.; Gastaldi, L.; Pastorelli, S.; Tadano, S.; Agostini, V. Wearable Inertial Sensors to Assess Standing Balance: A Systematic Review. Sensors 2019, 19, 4075. [Google Scholar] [CrossRef] [PubMed]
- Winter, D.A.; Patla, A.E.; Prince, F.; Ishac, M.; Gielo-Perczak, K. Stiffness Control of Balance in Quiet Standing. J. Neurophysiol. 1998, 80, 1211–1221. [Google Scholar] [CrossRef] [PubMed]
- Sonobe, M.; Inoue, Y. Center of Mass Estimation Using a Force Platform and Inertial Sensors for Balance Evaluation in Quiet Standing. Sensors 2023, 23, 4933. [Google Scholar] [CrossRef] [PubMed]
- Wright, W.G.; McDevitt, J.; Tierney, R.; Haran, F.J.; Appiah-Kubi, K.O.; Dumont, A. Assessing subacute mild traumatic brain injury with a portable virtual reality balance device. Disabil. Rehabil. 2017, 39, 1564–1572. [Google Scholar] [CrossRef]
- Marchetto, J.; Wright, W.G. The Validity of an Oculus Rift to Assess Postural Changes During Balance Tasks. Hum. Factors 2019, 61, 1340–1352. [Google Scholar] [CrossRef] [PubMed]
- Leslie, G.; Portney, M.P.W. Foundations of Clinical Research: Applications to Practice, 3rd ed.; Prentice Hall: London, UK, 2015. [Google Scholar]
- Bland, J.M.; Altman, D.G. Statistical methods for assessing agreement between two methods of clinical measurement. Lancet 1986, 1, 307–310. [Google Scholar] [CrossRef]
- Di Bacco, V.E.; Gage, W.H. Evaluation of a smartphone accelerometer system for measuring nonlinear dynamics during treadmill walking: Concurrent validity and test-retest reliability. J. Biomech. 2023, 151, 111527. [Google Scholar] [CrossRef]


| Age (mean ± sd; range) | 43.0 ± 13.1 yrs.; 20–60 yrs. |
| Gender | M: 11; F: 11 |
| Height | 66.4 ± 4.8 inches |
| Weight | 180.2 ± 40.8 pounds |
| MC vs. Phone | |||
|---|---|---|---|
| Condition (Vision, Surface) | AP Position | ML Position | |
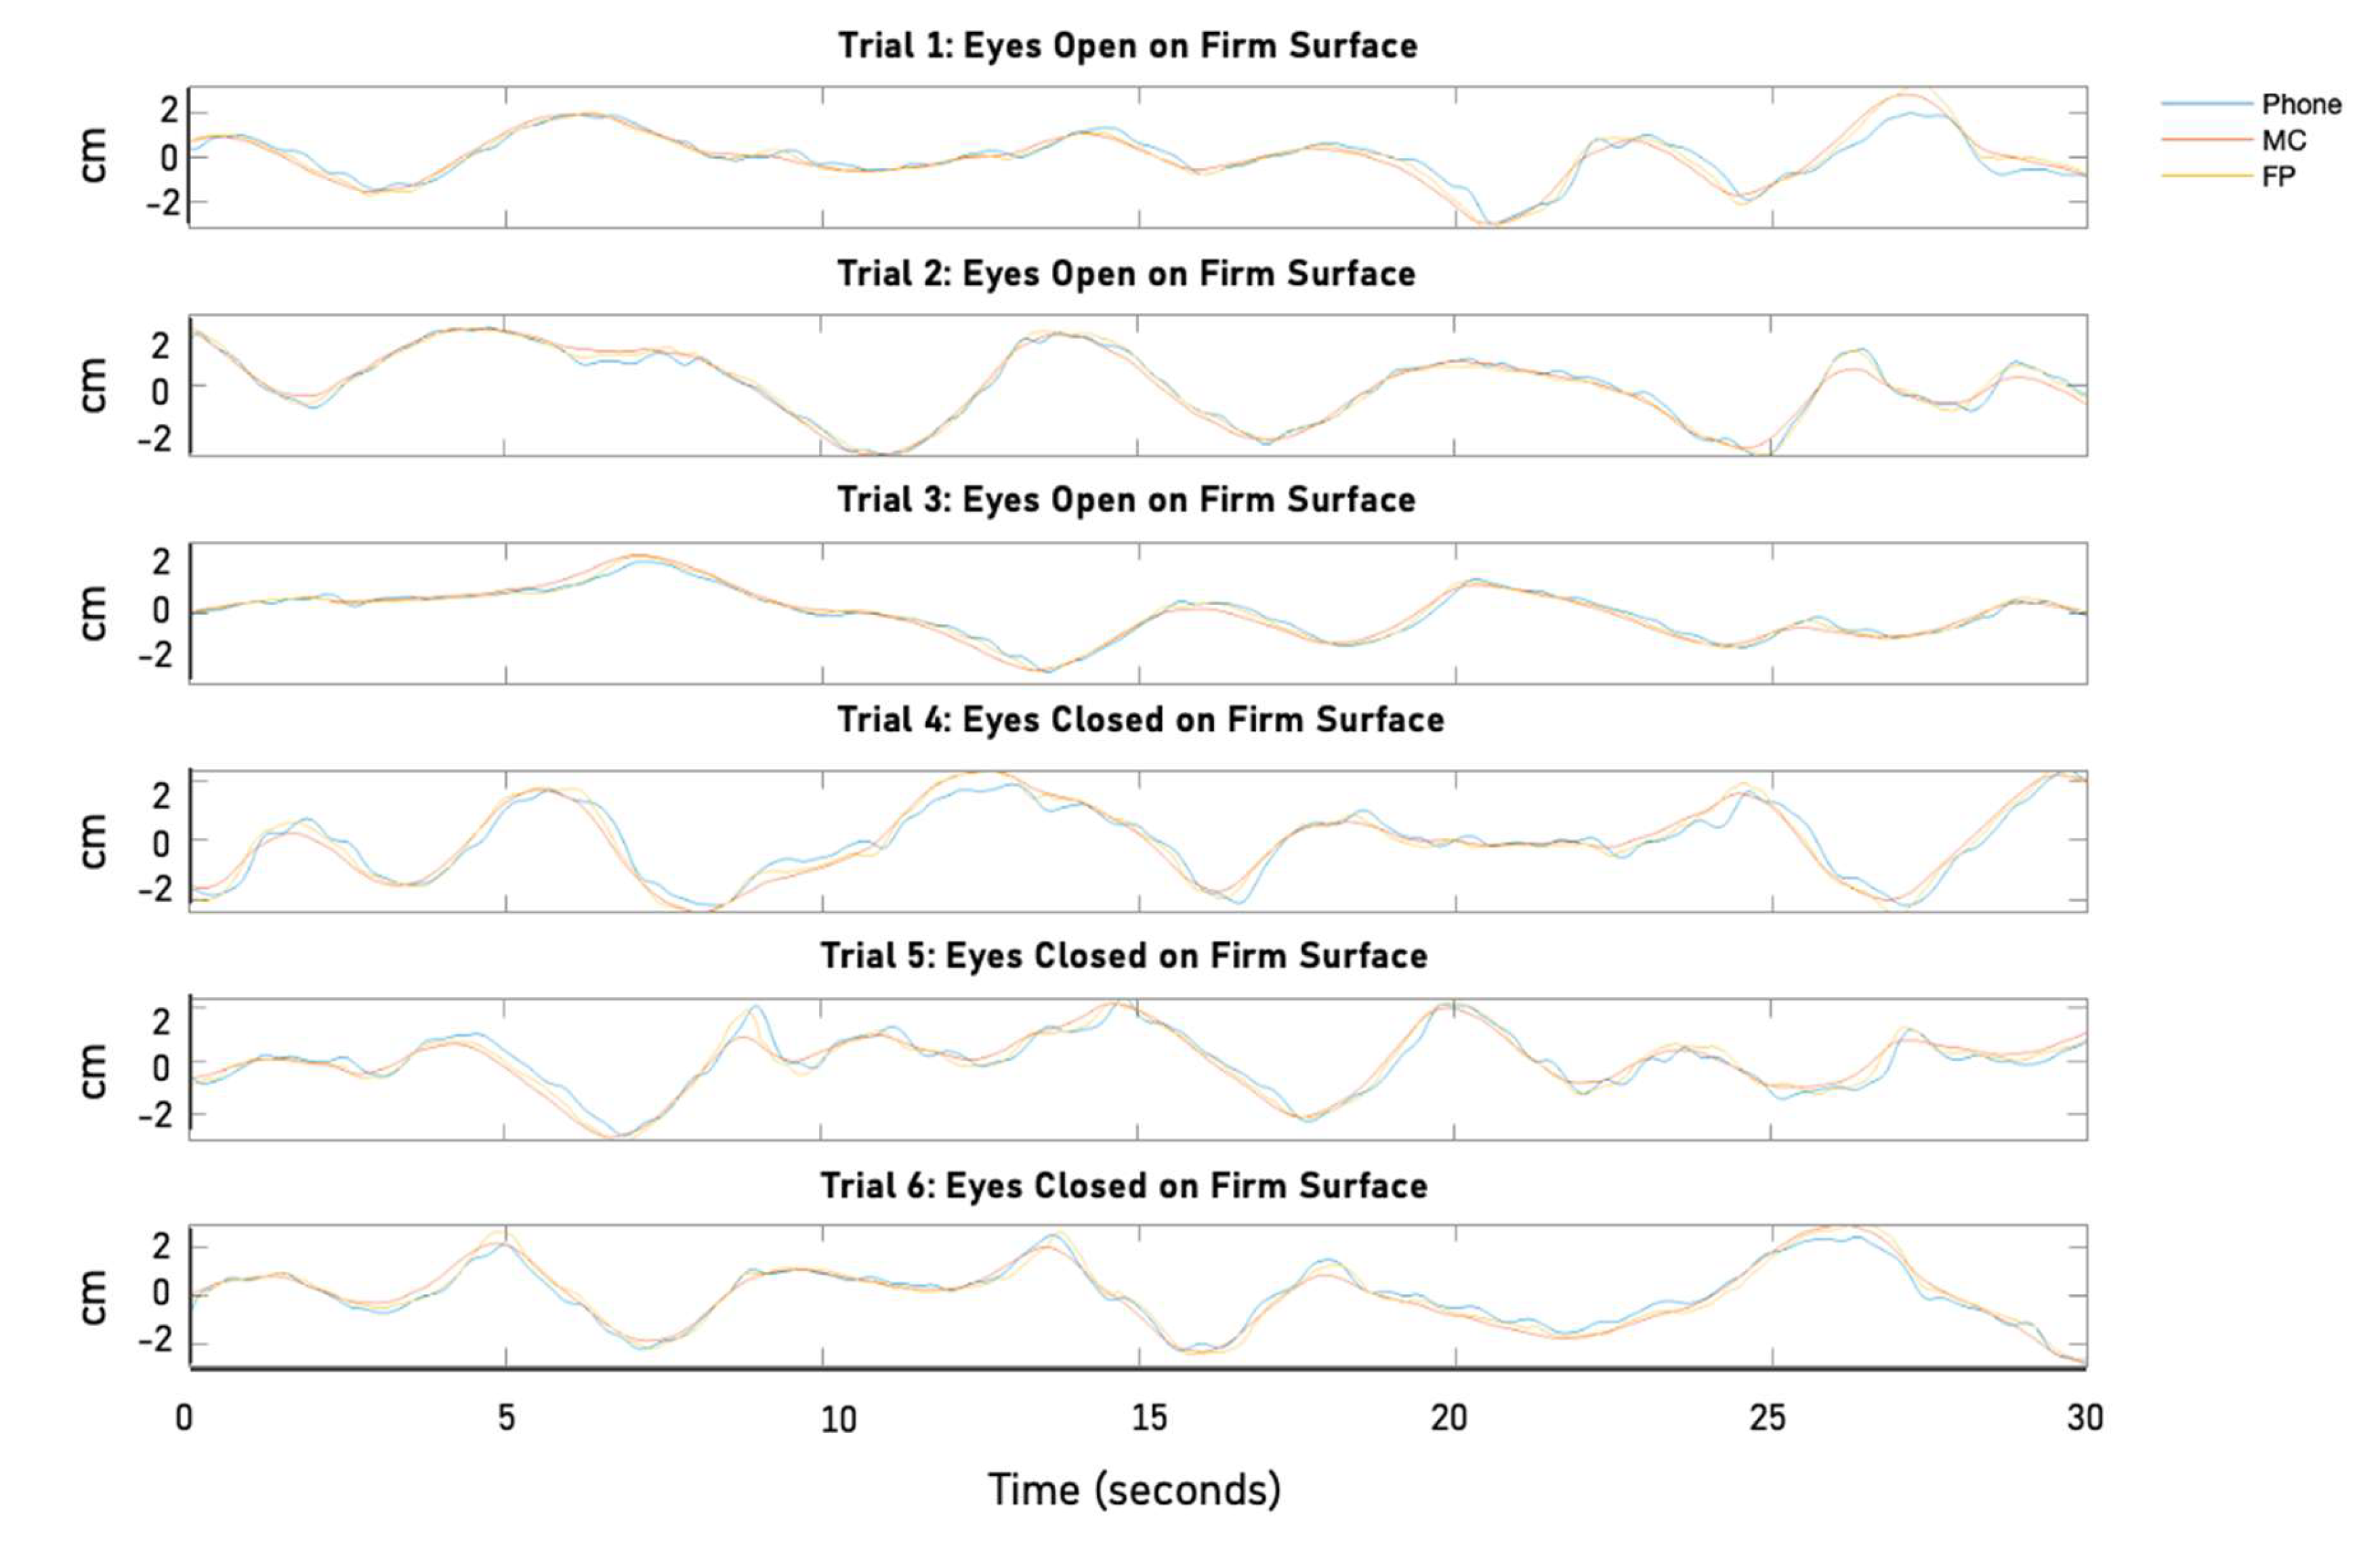
| EO, Firm | r | 0.857 | 0.397 |
| p | <0.001 | 0.003 | |
| EC, Firm | r | 0.886 | 0.432 |
| p | <0.001 | 0.002 | |
| EO, Foam | r | 0.893 | 0.693 |
| p | <0.001 | <0.001 | |
| EC, Foam | r | 0.913 | 0.707 |
| p | <0.001 | <0.001 | |
| Device | Mean ± Standard Deviation | |
|---|---|---|
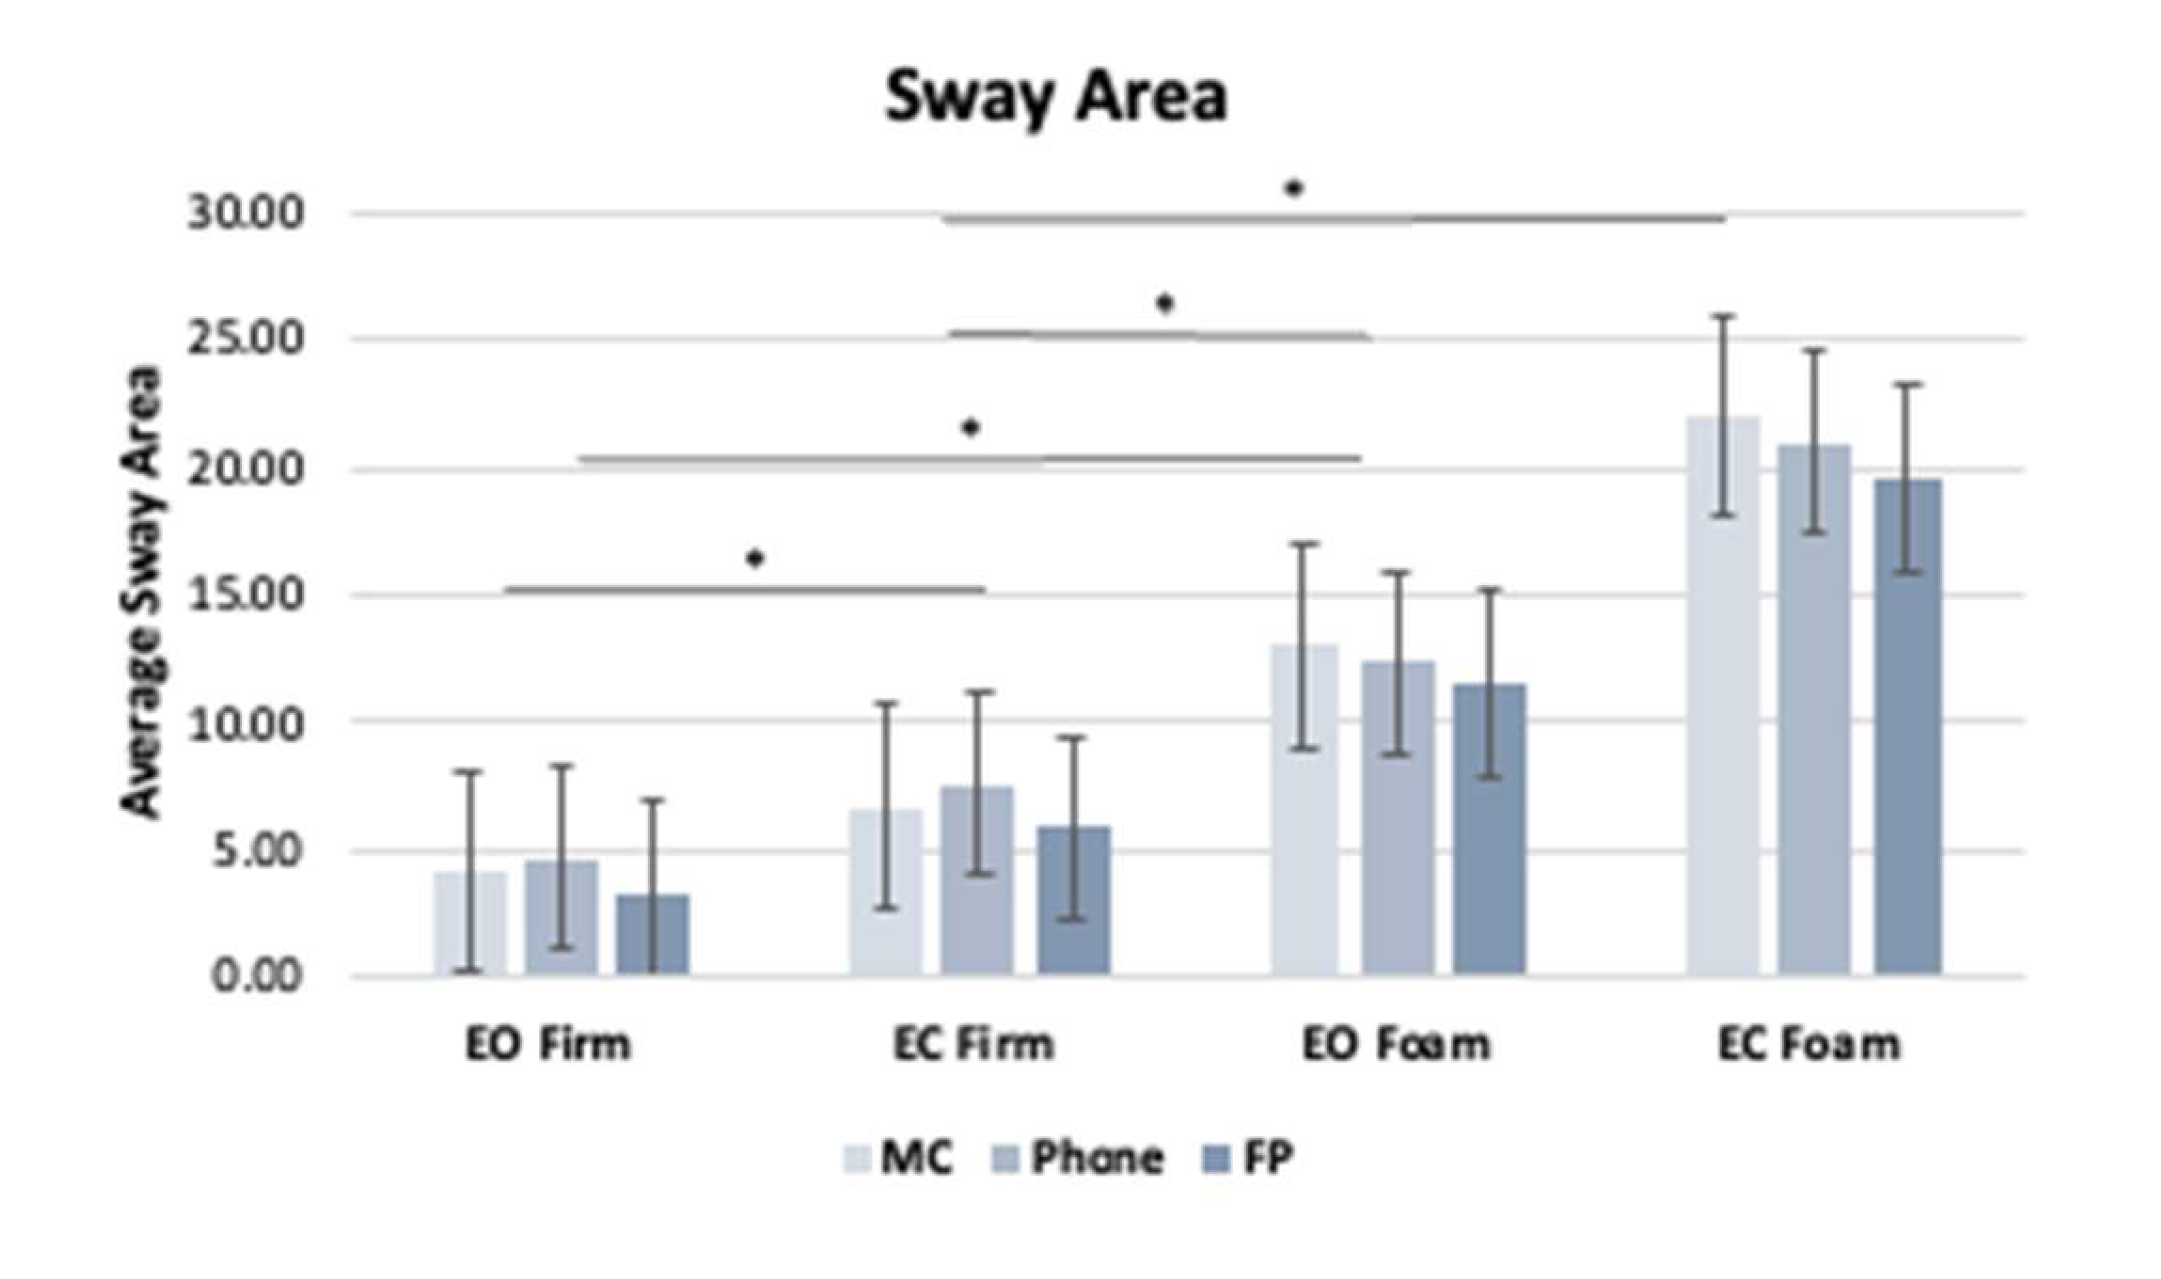
| Sway Area (EO), Firm | MC | 4.11 ± 4.1 |
| Phone | 4.61 ± 4.1 | |
| FP | 3.35 ± 4.5 | |
| Sway Area (EC), Firm | MC | 6.65 ± 9.0 |
| Phone | 7.56 ± 8.4 | |
| FP | 5.87 ± 9.1 | |
| Sway Velocity (EO), Firm | MC | 1.35 ± 1.0 |
| Phone | 1.62 ± 0.8 | |
| FP | 1.27 ± 0.9 | |
| Sway Velocity (EC), Firm | MC | 1.60 ± 1.1 |
| Phone | 2.25 ± 1.2 | |
| FP | 1.84 ± 1.2 | |
| Sway Area (EO), Foam | MC | 13.03 ± 9.03 |
| Phone | 12.38 ± 8.2 | |
| FP | 10.54 ± 9.4 | |
| Sway Area (EC), Foam | MC | 22.02 ± 12.9 |
| Phone | 20.95 ± 12.8 | |
| FP | 17.54 ± 12.9 | |
| Sway Velocity (EO), Foam | MC | 4.11 ± 4.1 |
| Phone | 4.61 ± 4.1 | |
| FP | 3.35 ± 4.5 | |
| Sway Velocity (EC), Foam | MC | 6.65 ± 9.0 |
| Phone | 7.56 ± 8.4 | |
| FP | 5.87 ± 9.1 |
| df | ||||||
|---|---|---|---|---|---|---|
| Variable | Between Groups | Within Groups | F | Sig. | Partial Eta Squared (η2) | |
| Sway Area | Surface Condition | 1 | 21 | 49.54 | <0.001 | 0.70 |
| Device | 1.76 | 36.89 | 6.83 | 0.08 | 0.25 | |
| Visual Condition | 1 | 21 | 30.35 | <0.001 | 0.59 | |
| Sway Velocity | Surface Condition | 1 | 21 | 93.7 | <0.001 | 0.82 |
| Device | 1.69 | 35.62 | 2.84 | 0.07 | 0.12 | |
| Visual Condition | 1 | 21 | 46.06 | <0.001 | 0.69 | |
| ICC (3,1) (95% Confidence Interval) | |||
|---|---|---|---|
| Device | Visual, Surface Condition | Sway Area | Sway Velocity |
| MC | EO, Firm | 0.952 (0.903–0.978) | 0.982 (0.963–0.992) |
| EC, Firm | 0.964 (0.926–0.984) | 0.982 (0.943–0.987) | |
| EO, Foam | 0.904 (0.784–0.952) | 0.957 (0.888–0.983) | |
| EC, Foam | 0.953 (0.703–0.964) | 0.960 (0.908–0.983) | |
| Phone | EO, Firm | 0.930 (0.857–0.969) | 0.978 (0.956–0.990) |
| EC, Firm | 0.964 (0.927–0.984) | 0.977 (0.954–0.990) | |
| EO, Foam | 0.909 (0.815–0.959) | 0.916 (0.818–0.963) | |
| EC, Foam | 0.902 (0.802–0.956) | 0.951 (0.895–0.978) | |
| FP | EO, Firm | 0.900 (0.797–0.955) | 0.979 (0.957–0.990) |
| EC, Firm | 0.962 (0.922–0.983) | 0.976 (0.950–0.989) | |
| EO, Foam | 0.968 (0.935–0.986) | 0.994 (0.986–0.998) | |
| EC, Foam | 0.945 (0.890–0.975) | 0.968 (0.933–0.986) | |
| ICC (3,k) (95% Confidence Interval) | |||
|---|---|---|---|
| Postural Outcome Measure | Surface Condition | MC vs. Phone | FP vs. Phone |
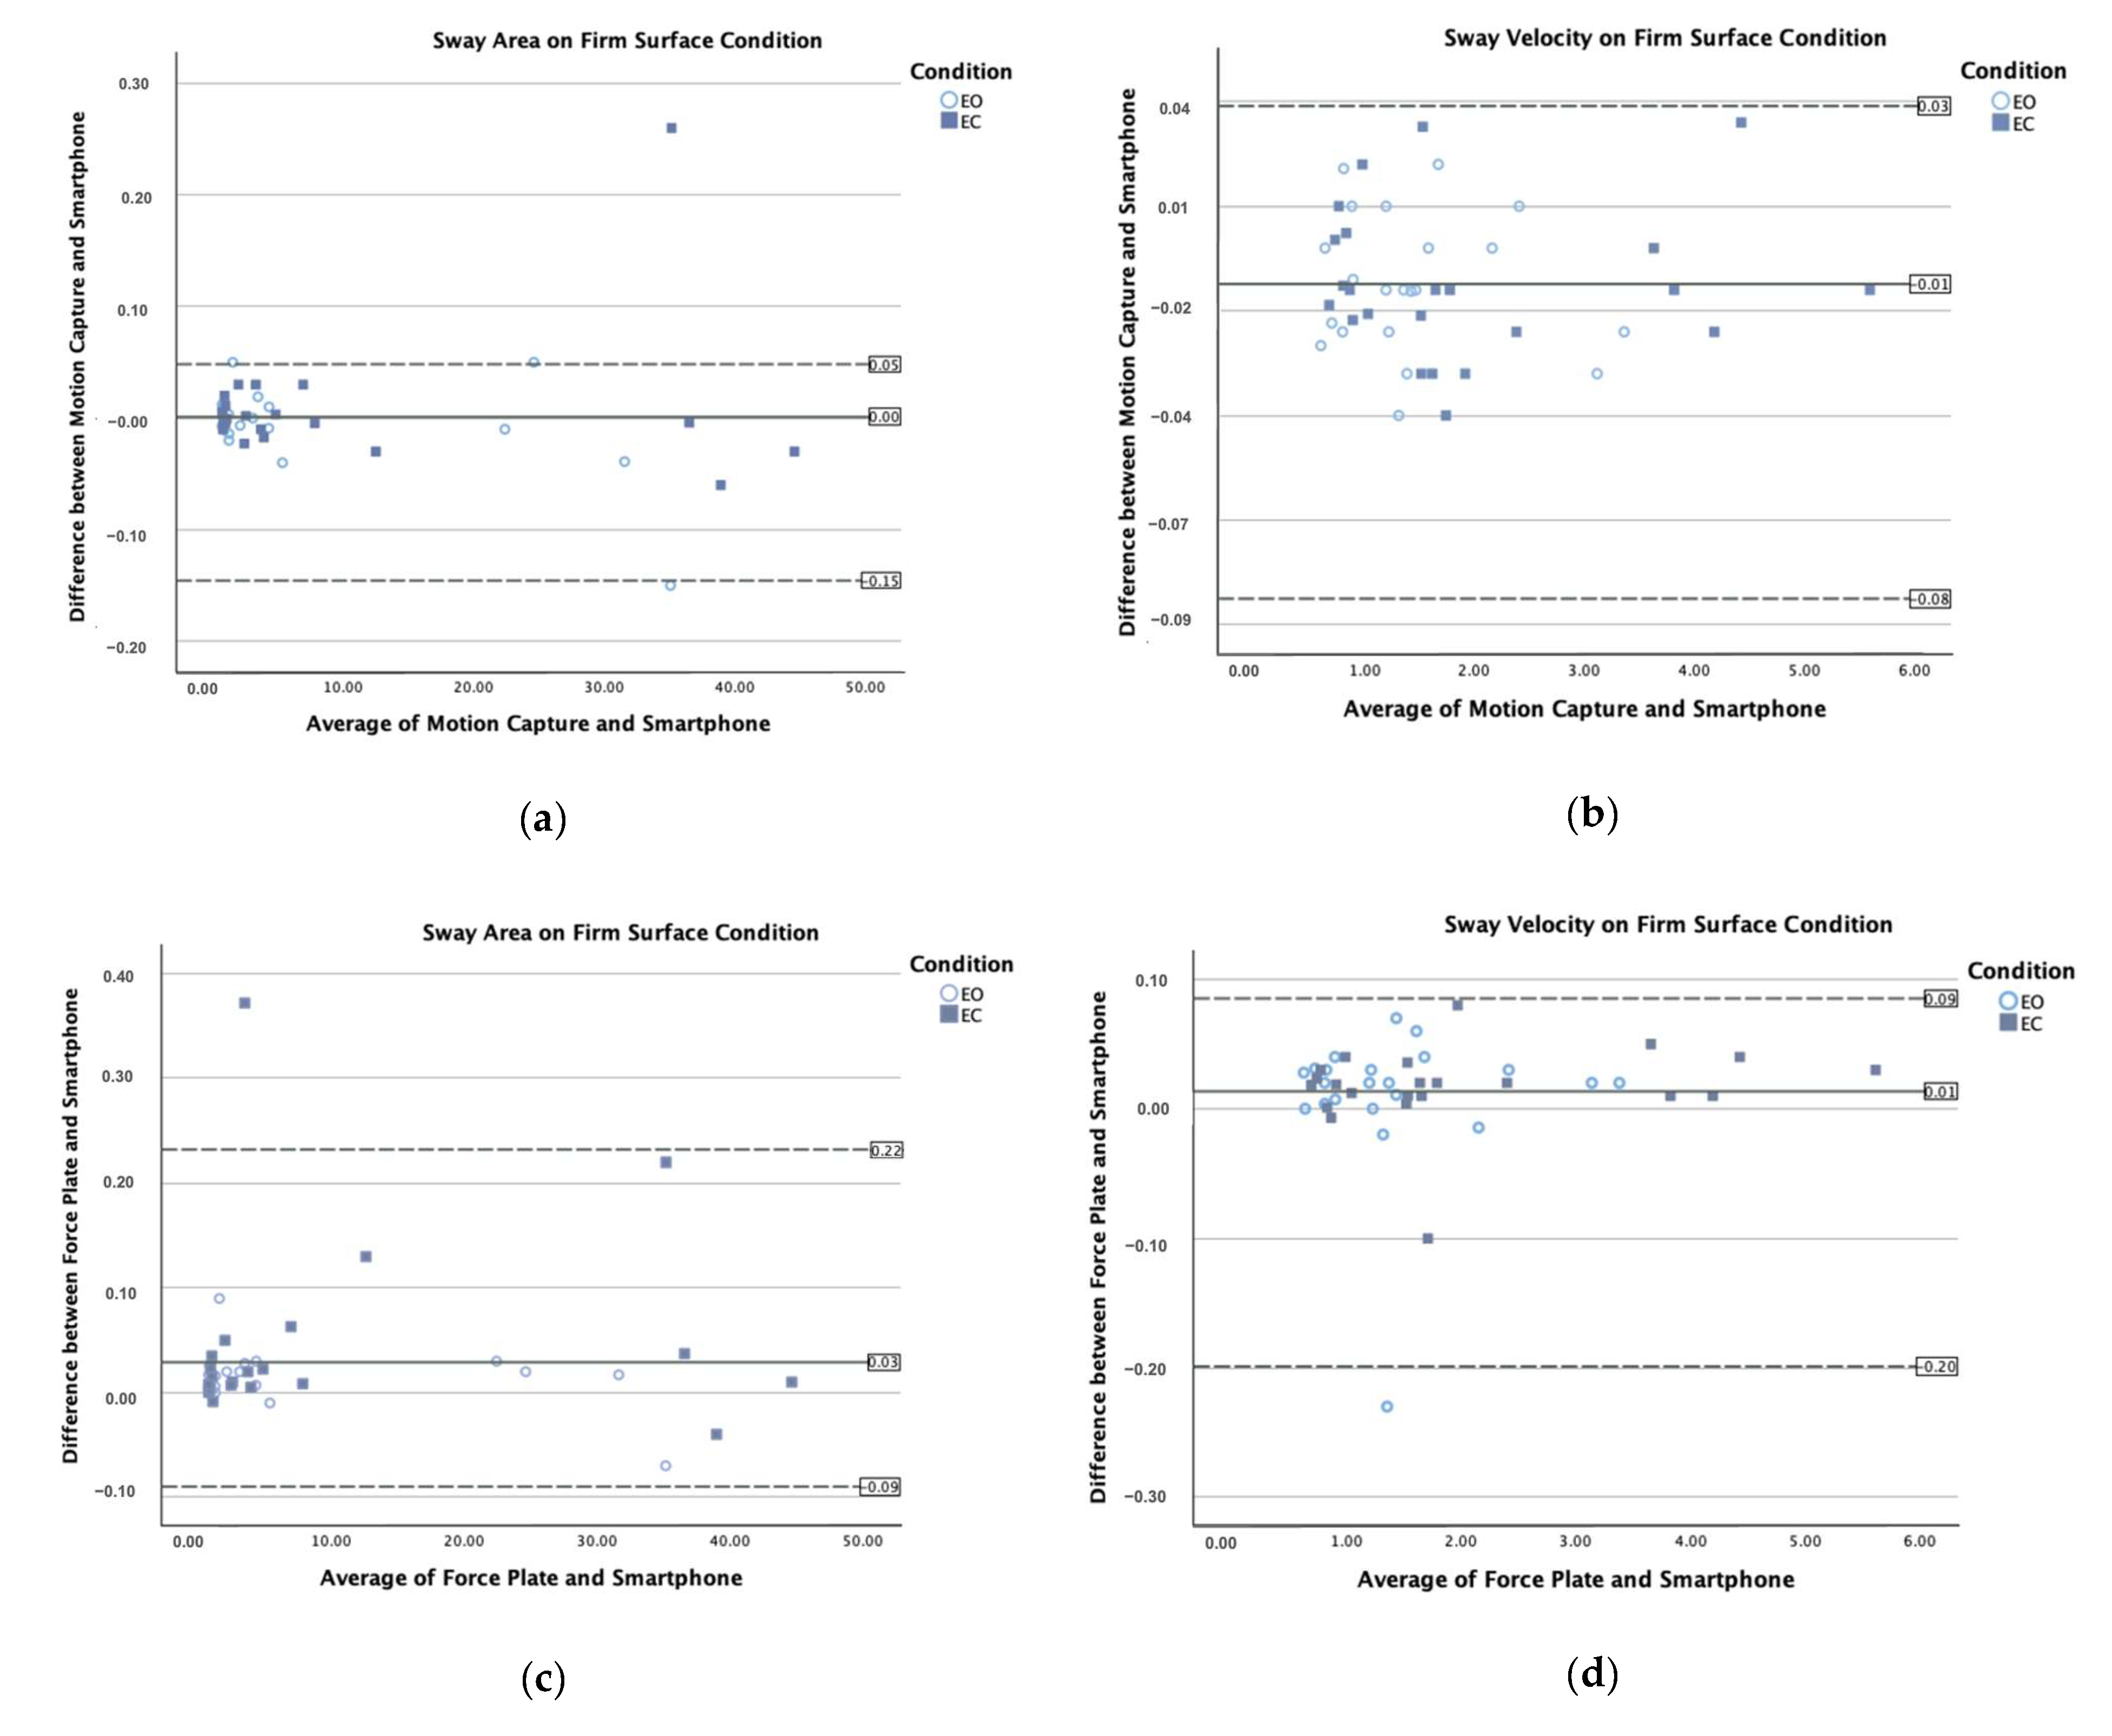
| Sway Area | Firm | 0.753 (0.419–0.897) | 0.729 (0.334–0.888) |
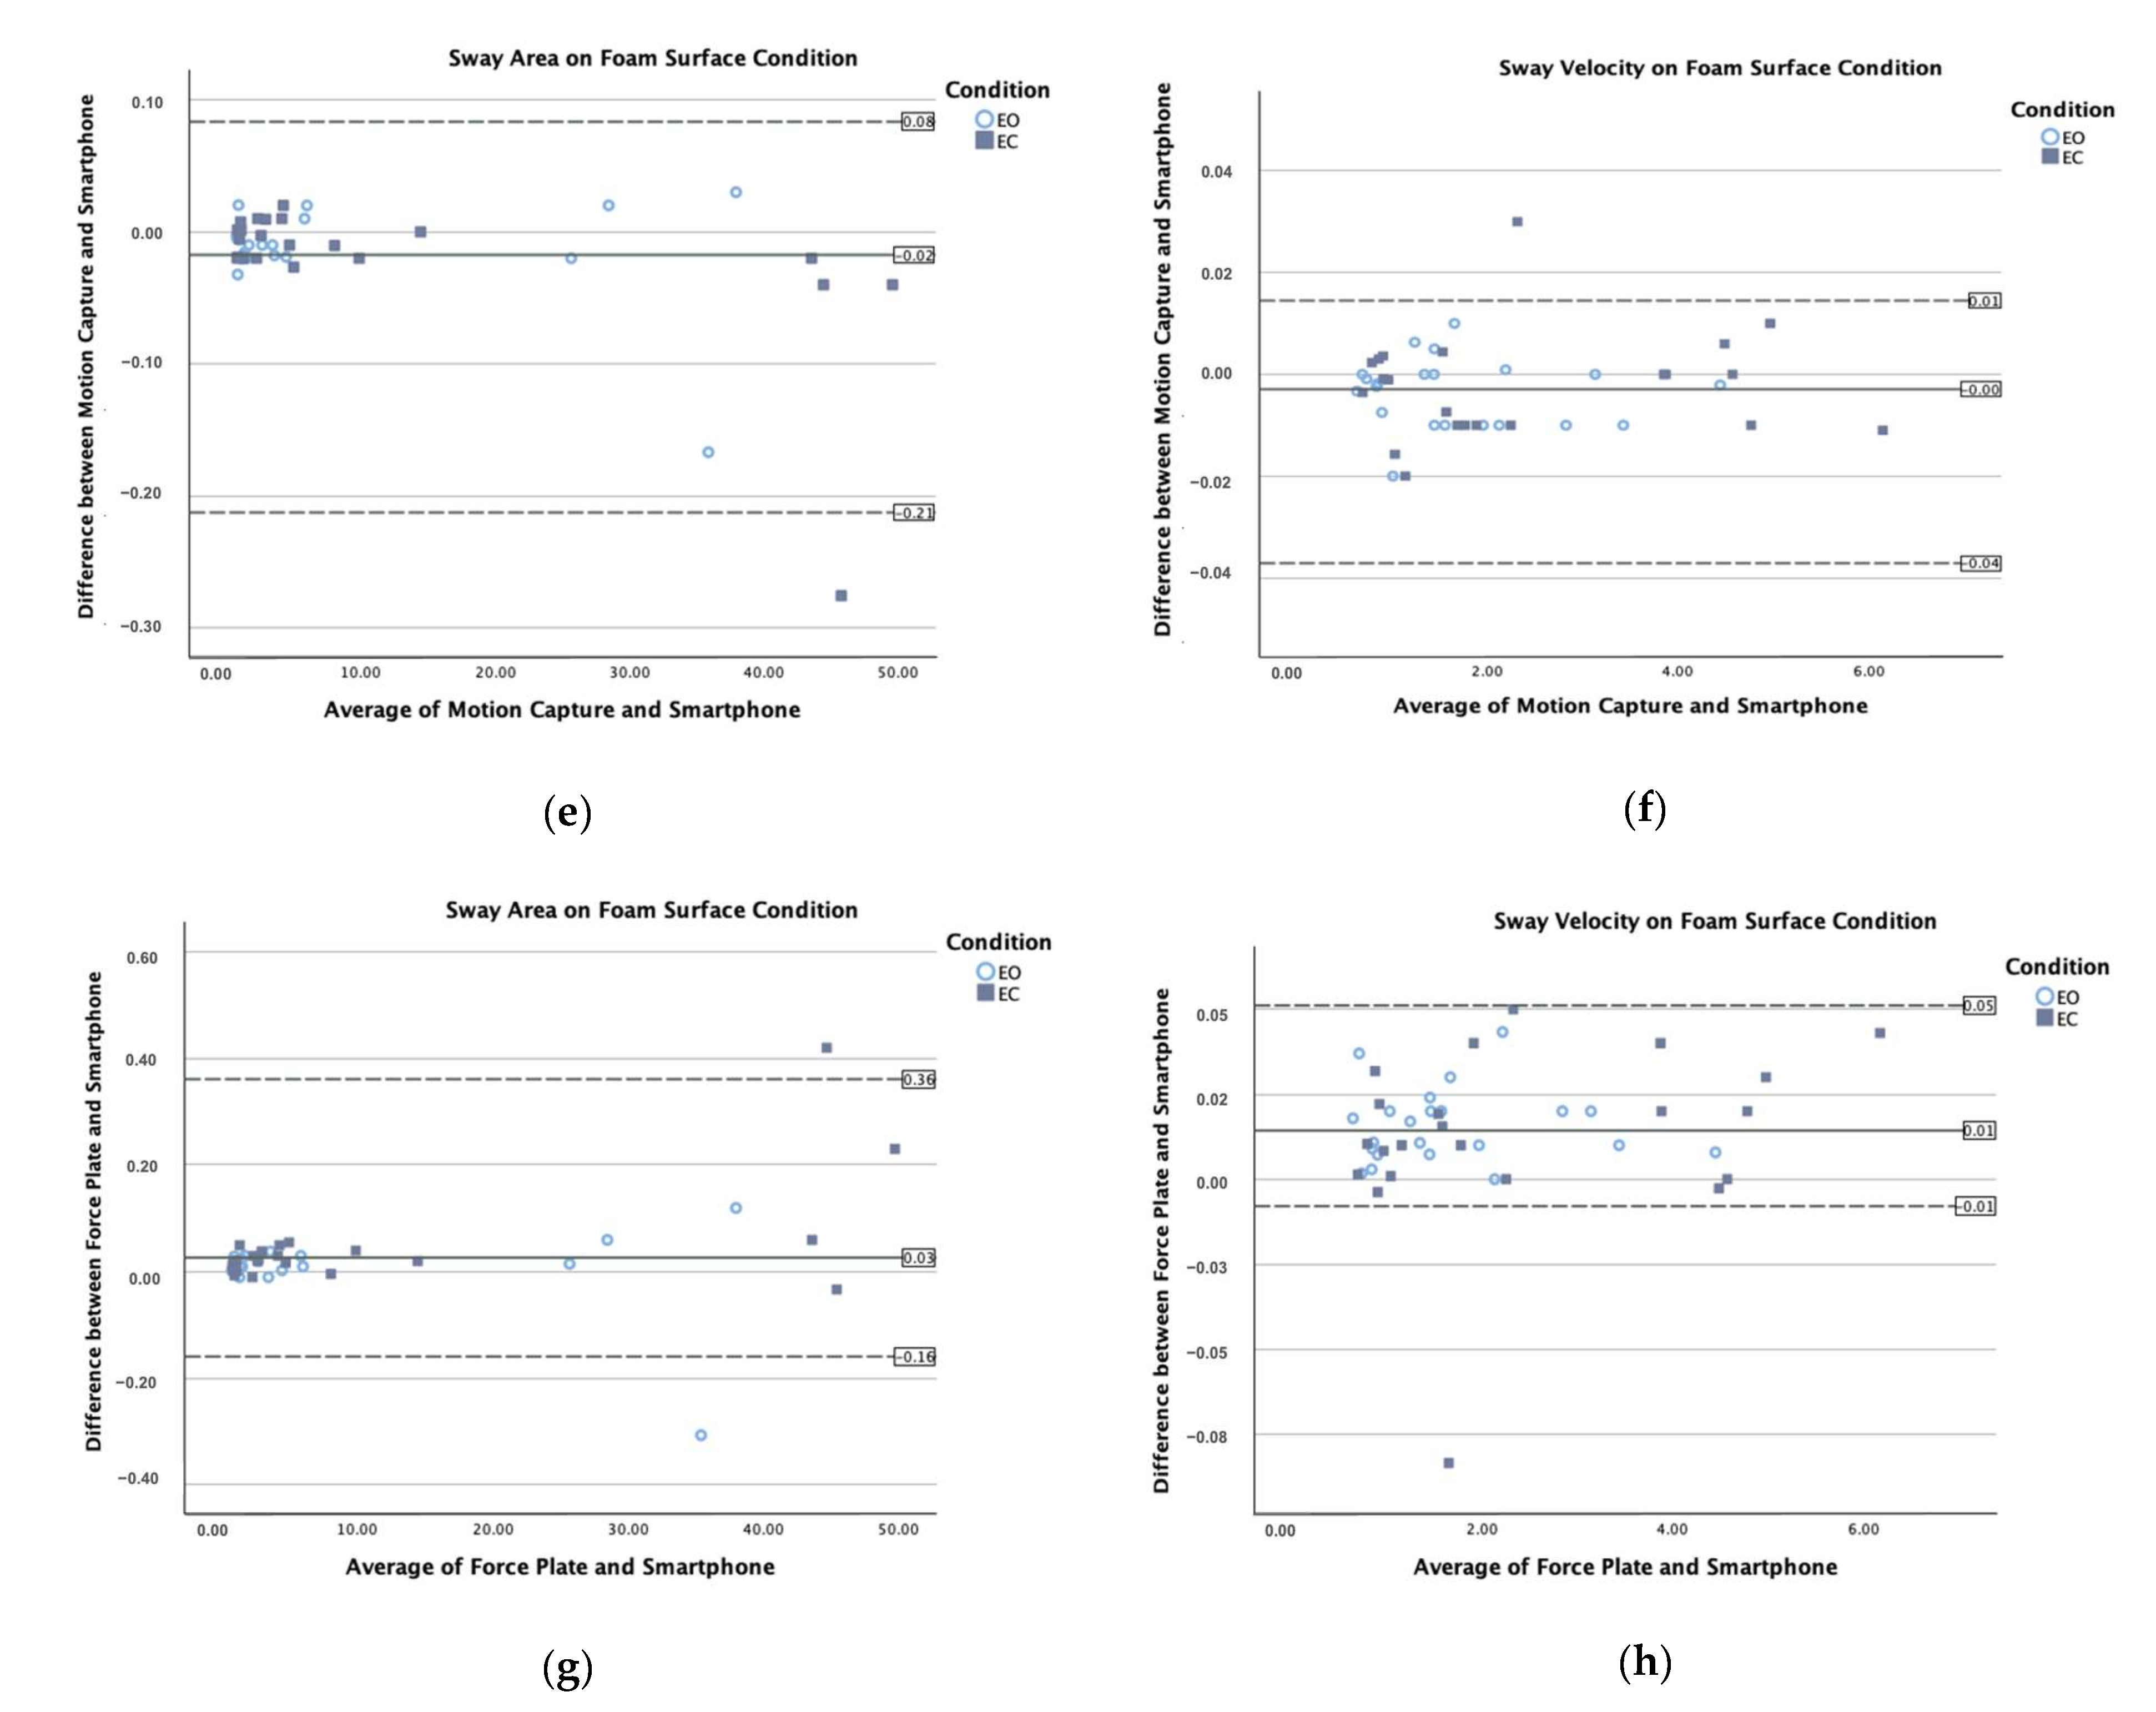
| Foam | 0.826 (0.583–0.927) | 0.839 (0.615–0.933) | |
| Sway Velocity | Firm | 0.715 (0.297–0.883) | 0.598 (0.038–0.833) |
| Foam | 0.968 (0.923–0.987) | 0.828 (0.460–0.936) | |
| ICC (3,k) (95% Confidence Interval) | ||
|---|---|---|
| Postural Outcome Measure | Visual, Surface Condition | |
| EO, Firm | 0.959 (0.908–0.982) | |
| Sway Area | EC, Firm | 0.989 (0.973–0.996) |
| EO, Foam | 0.948 (0.892–0.977) | |
| EC, Foam | 0.940 (0.871–0.974) | |
| EO, Firm | 0.842 (0.682–0.929) | |
| EC, Firm | 0.935 (0.804–0.975) | |
| Sway Velocity | EO, Foam | 0.894 (0.786–0.953) |
| EC, Foam | 0.899 (0.795–0.955) |
Disclaimer/Publisher’s Note: The statements, opinions and data contained in all publications are solely those of the individual author(s) and contributor(s) and not of MDPI and/or the editor(s). MDPI and/or the editor(s) disclaim responsibility for any injury to people or property resulting from any ideas, methods, instructions or products referred to in the content. |
© 2025 by the authors. Licensee MDPI, Basel, Switzerland. This article is an open access article distributed under the terms and conditions of the Creative Commons Attribution (CC BY) license (https://creativecommons.org/licenses/by/4.0/).
Share and Cite
Hussain, S.R.; Wright, W.G. The Development and Validation of a Novel Smartphone Application to Detect Postural Instability. Sensors 2025, 25, 1505. https://doi.org/10.3390/s25051505
Hussain SR, Wright WG. The Development and Validation of a Novel Smartphone Application to Detect Postural Instability. Sensors. 2025; 25(5):1505. https://doi.org/10.3390/s25051505
Chicago/Turabian StyleHussain, Shirin R., and W. Geoffrey Wright. 2025. "The Development and Validation of a Novel Smartphone Application to Detect Postural Instability" Sensors 25, no. 5: 1505. https://doi.org/10.3390/s25051505
APA StyleHussain, S. R., & Wright, W. G. (2025). The Development and Validation of a Novel Smartphone Application to Detect Postural Instability. Sensors, 25(5), 1505. https://doi.org/10.3390/s25051505