
Self-Supervised Learning with Trilateral Redundancy Reduction for Urban Functional Zone Identification Using Street-View Imagery


Abstract
1. Introduction
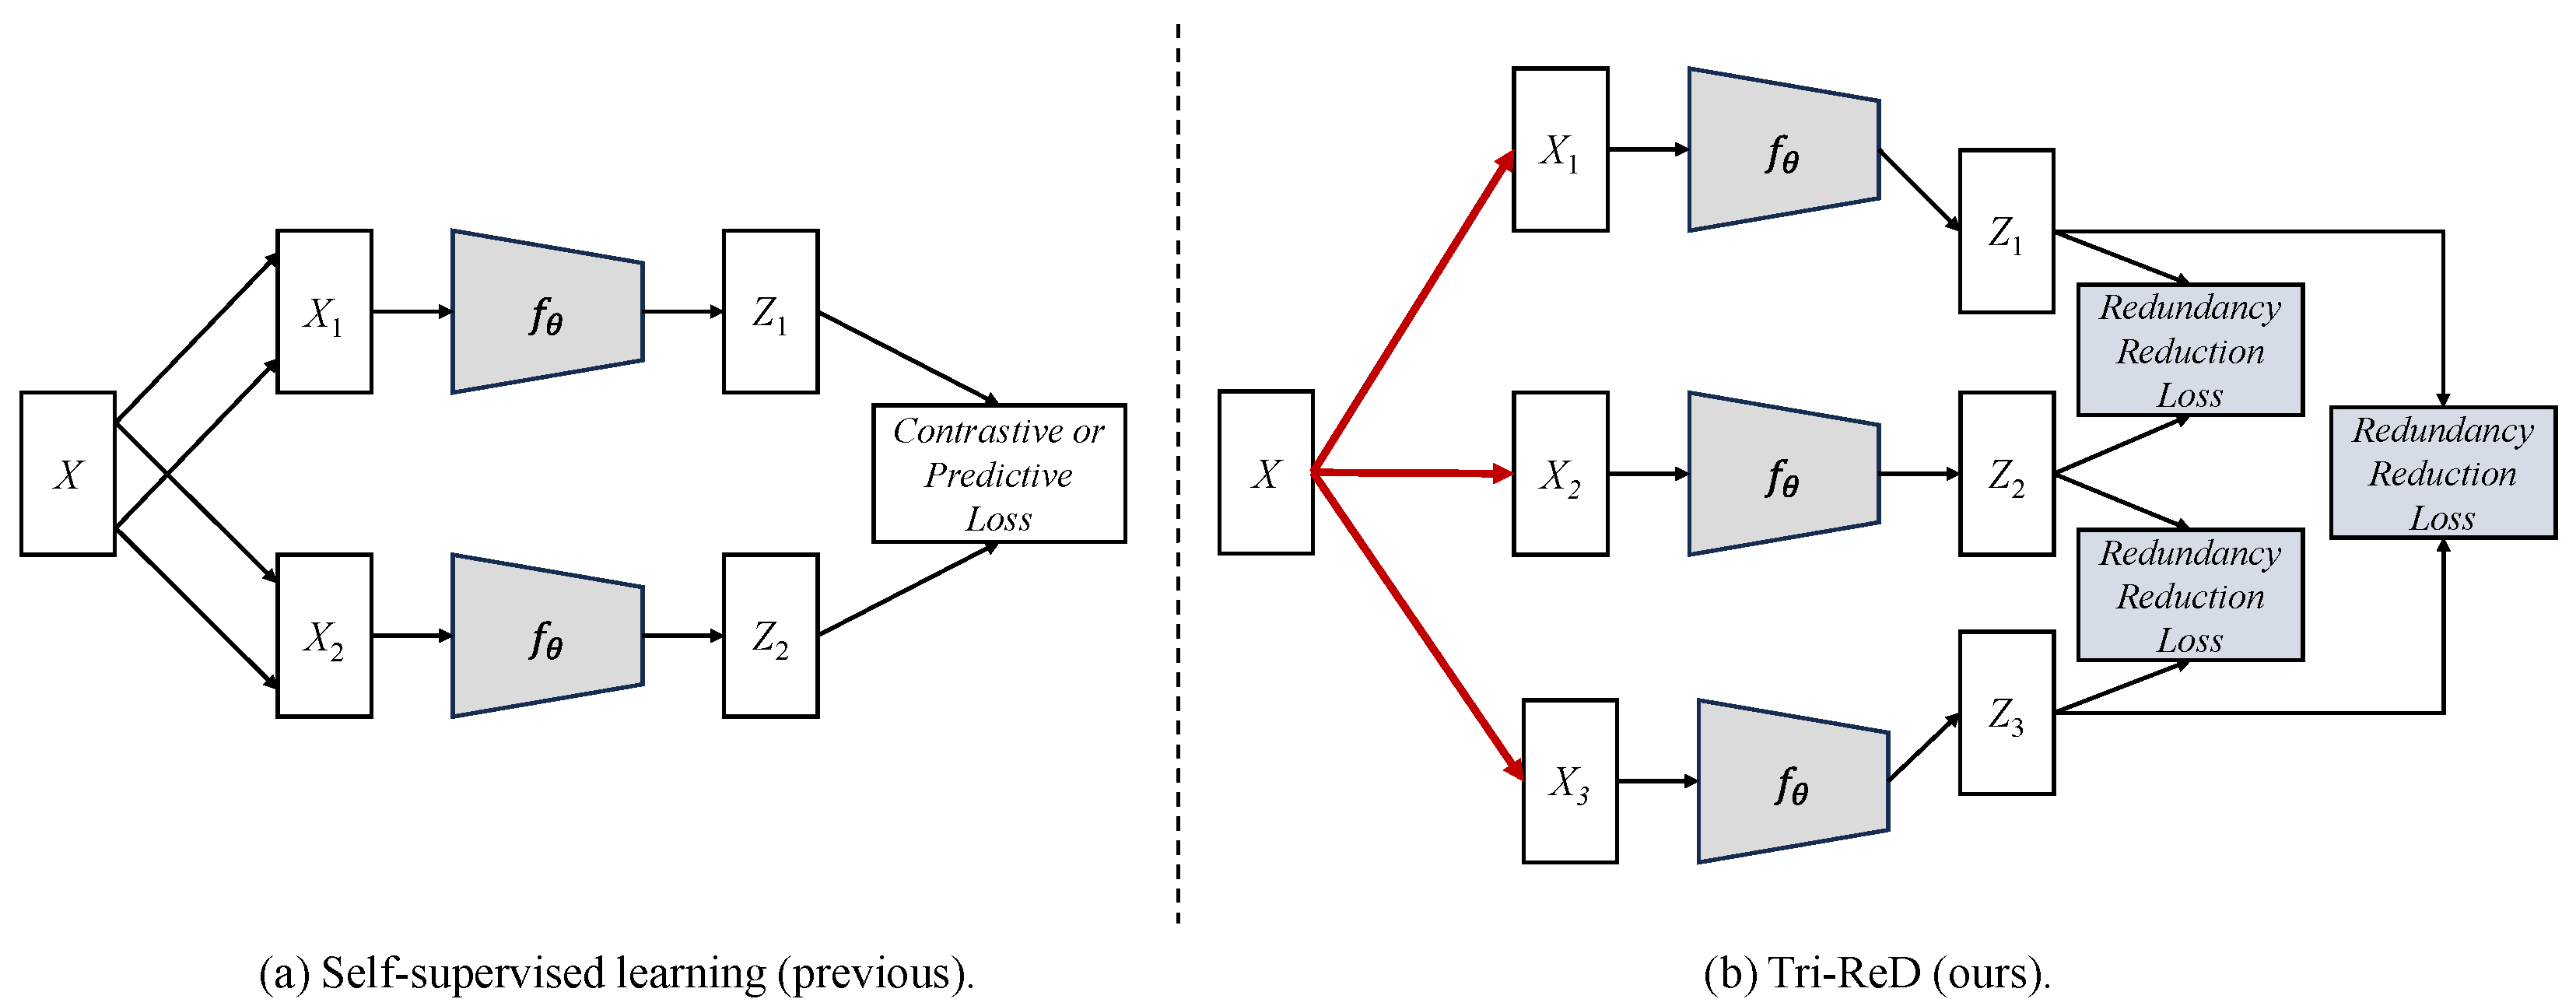
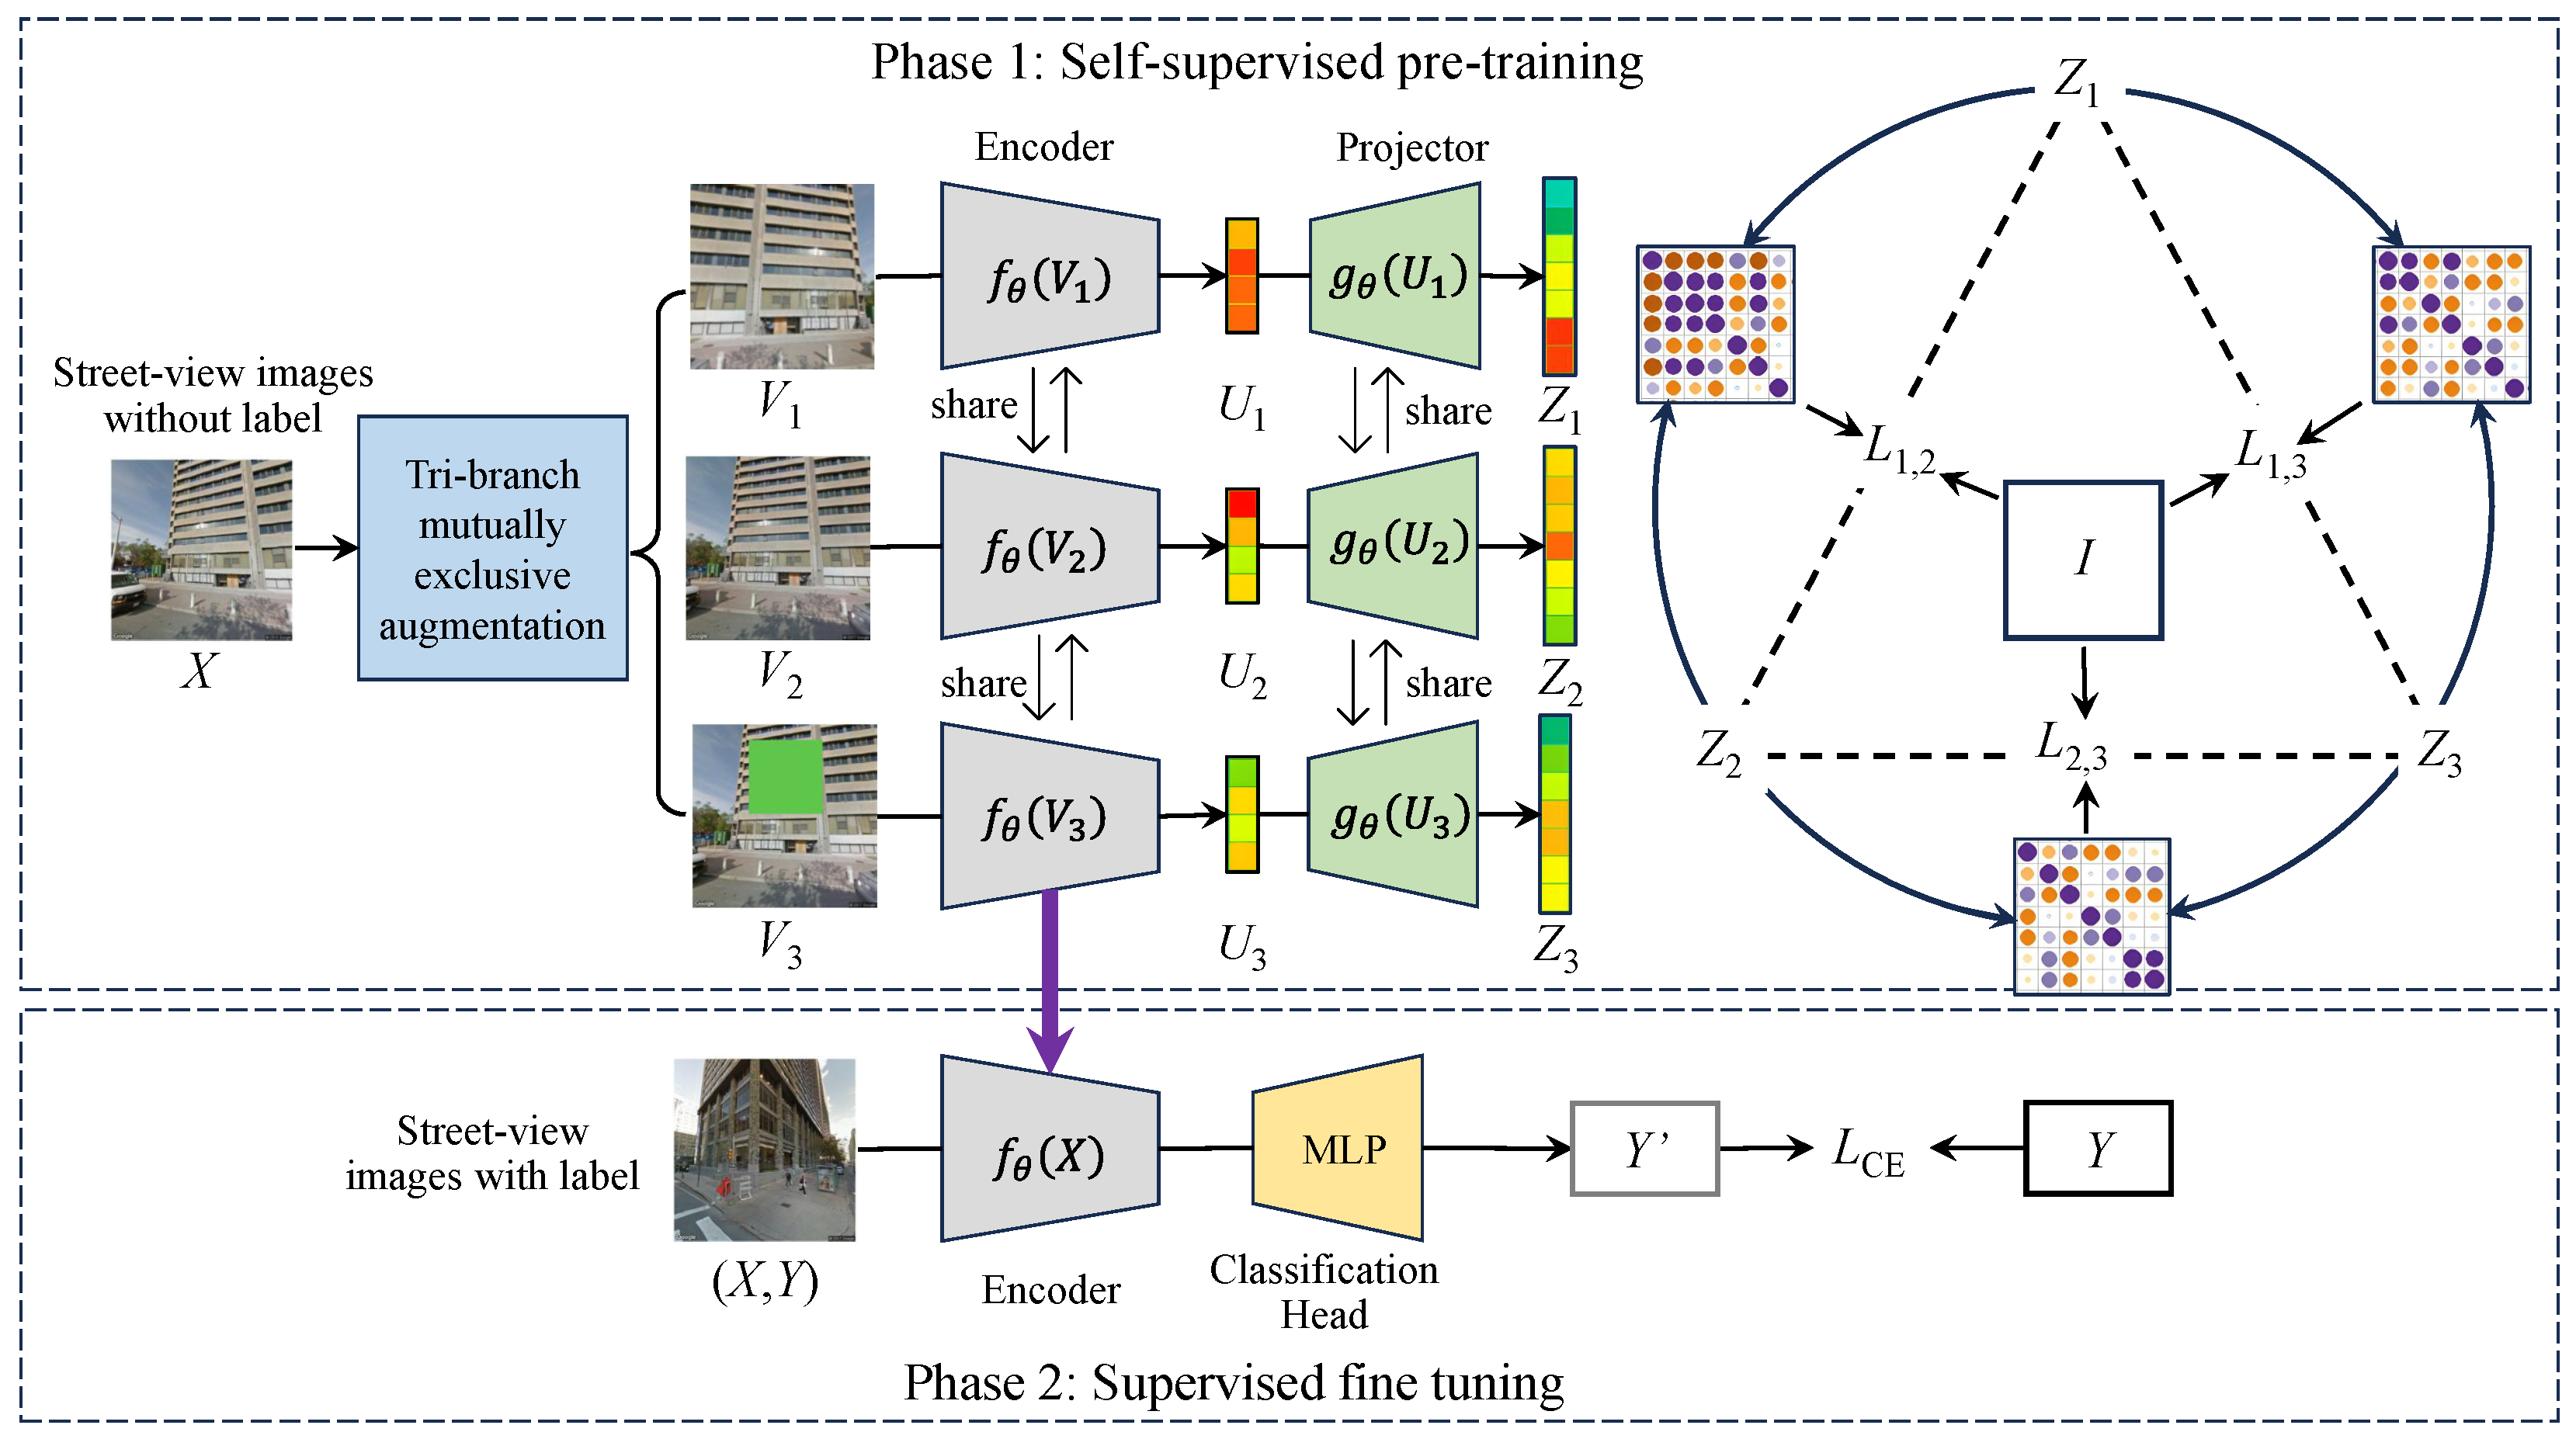
- Trilateral Redundancy Reduction (Tri-ReD) Framework: For street scene image data with fine-grained visual distinctions, traditional dual-path loss in SSL often falls short in representation capability. To ensure that the model captures more comprehensive information, we propose the Tri-ReD framework, which facilitates the learning of invariant features and simultaneously stabilizes the training process.
- Tri-branch Mutually Exclusive Augmentation (Tri-MExA) Strategy: We also propose a Tri-MExA strategy based on the Tri-ReD framework. This strategy can increase the diversity and randomness of data. It does so without relying on excessive strong augmentation techniques, thereby contributing to more stable model training.
- Simulated Vegetation Color Occlusion (SVCO) Data Augmentation: We designed a novel data augmentation method, SVCO. It serves as the third branch, specifically tailored for the SSL of SVIs. This method enhances the model’s suitability for different downstream tasks and avoids excessive differences in data distribution that result in learning irrelevant feature representations.
2. Related Work
2.1. Scene Classification for Urban Functional Zone Identification Using Street-View Images
2.2. Self-Supervised Learning
3. Materials and Methodology
3.1. Dataset Description
3.1.1. Unlabeled Dataset
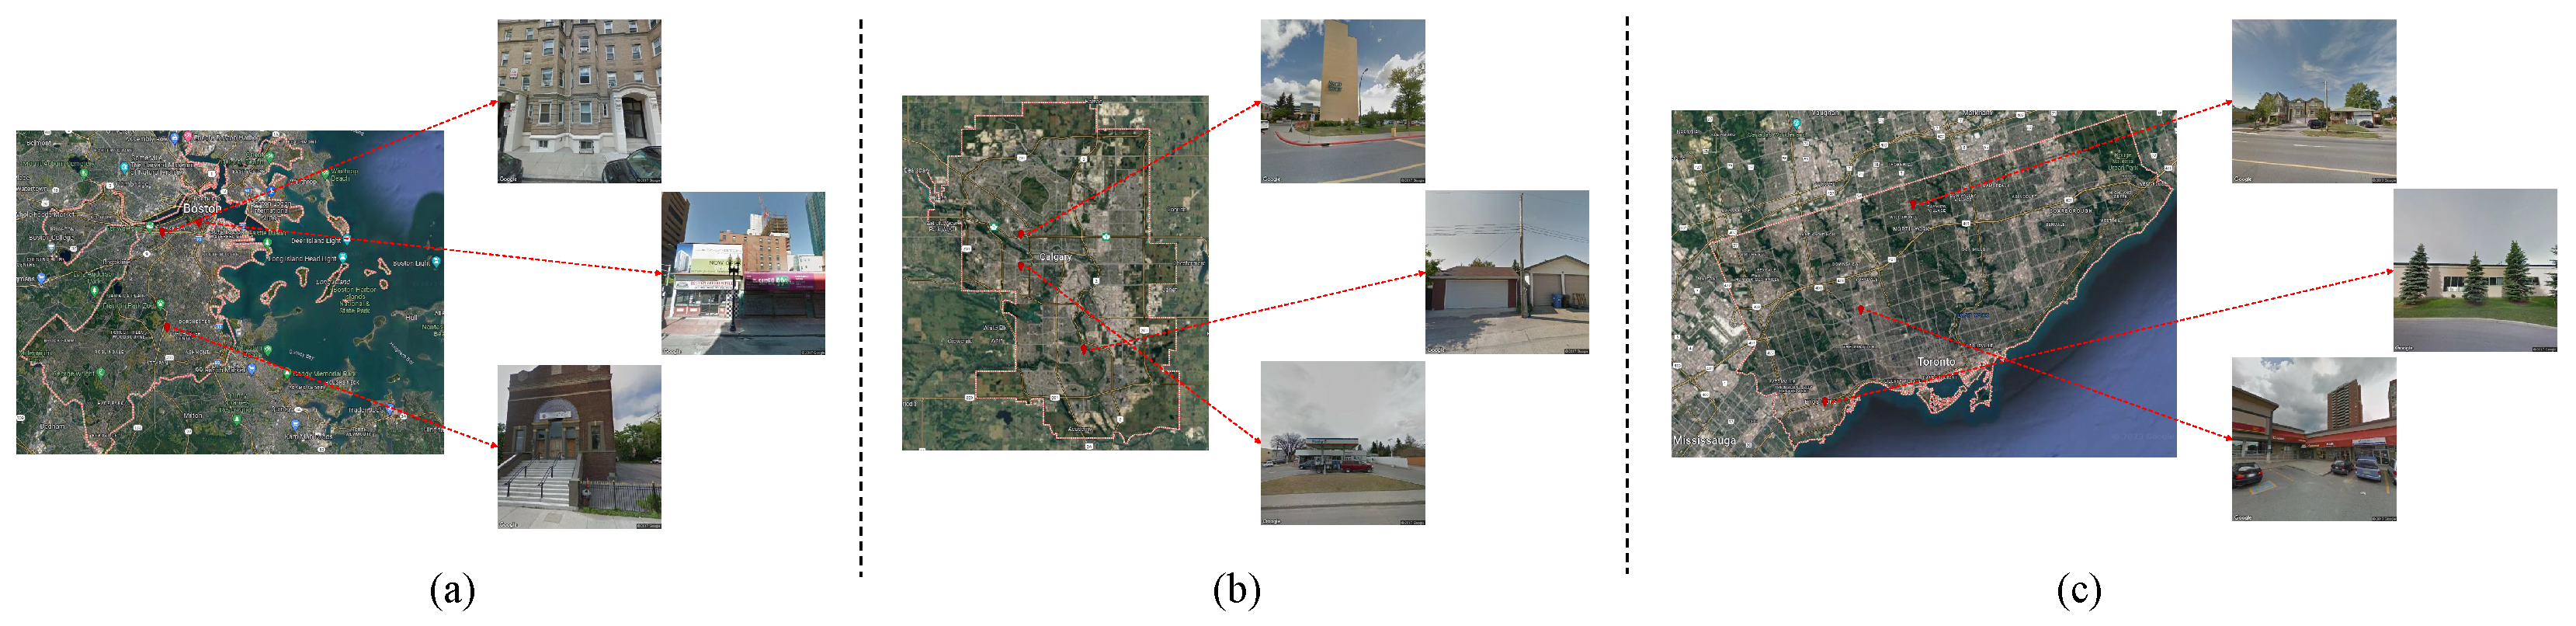
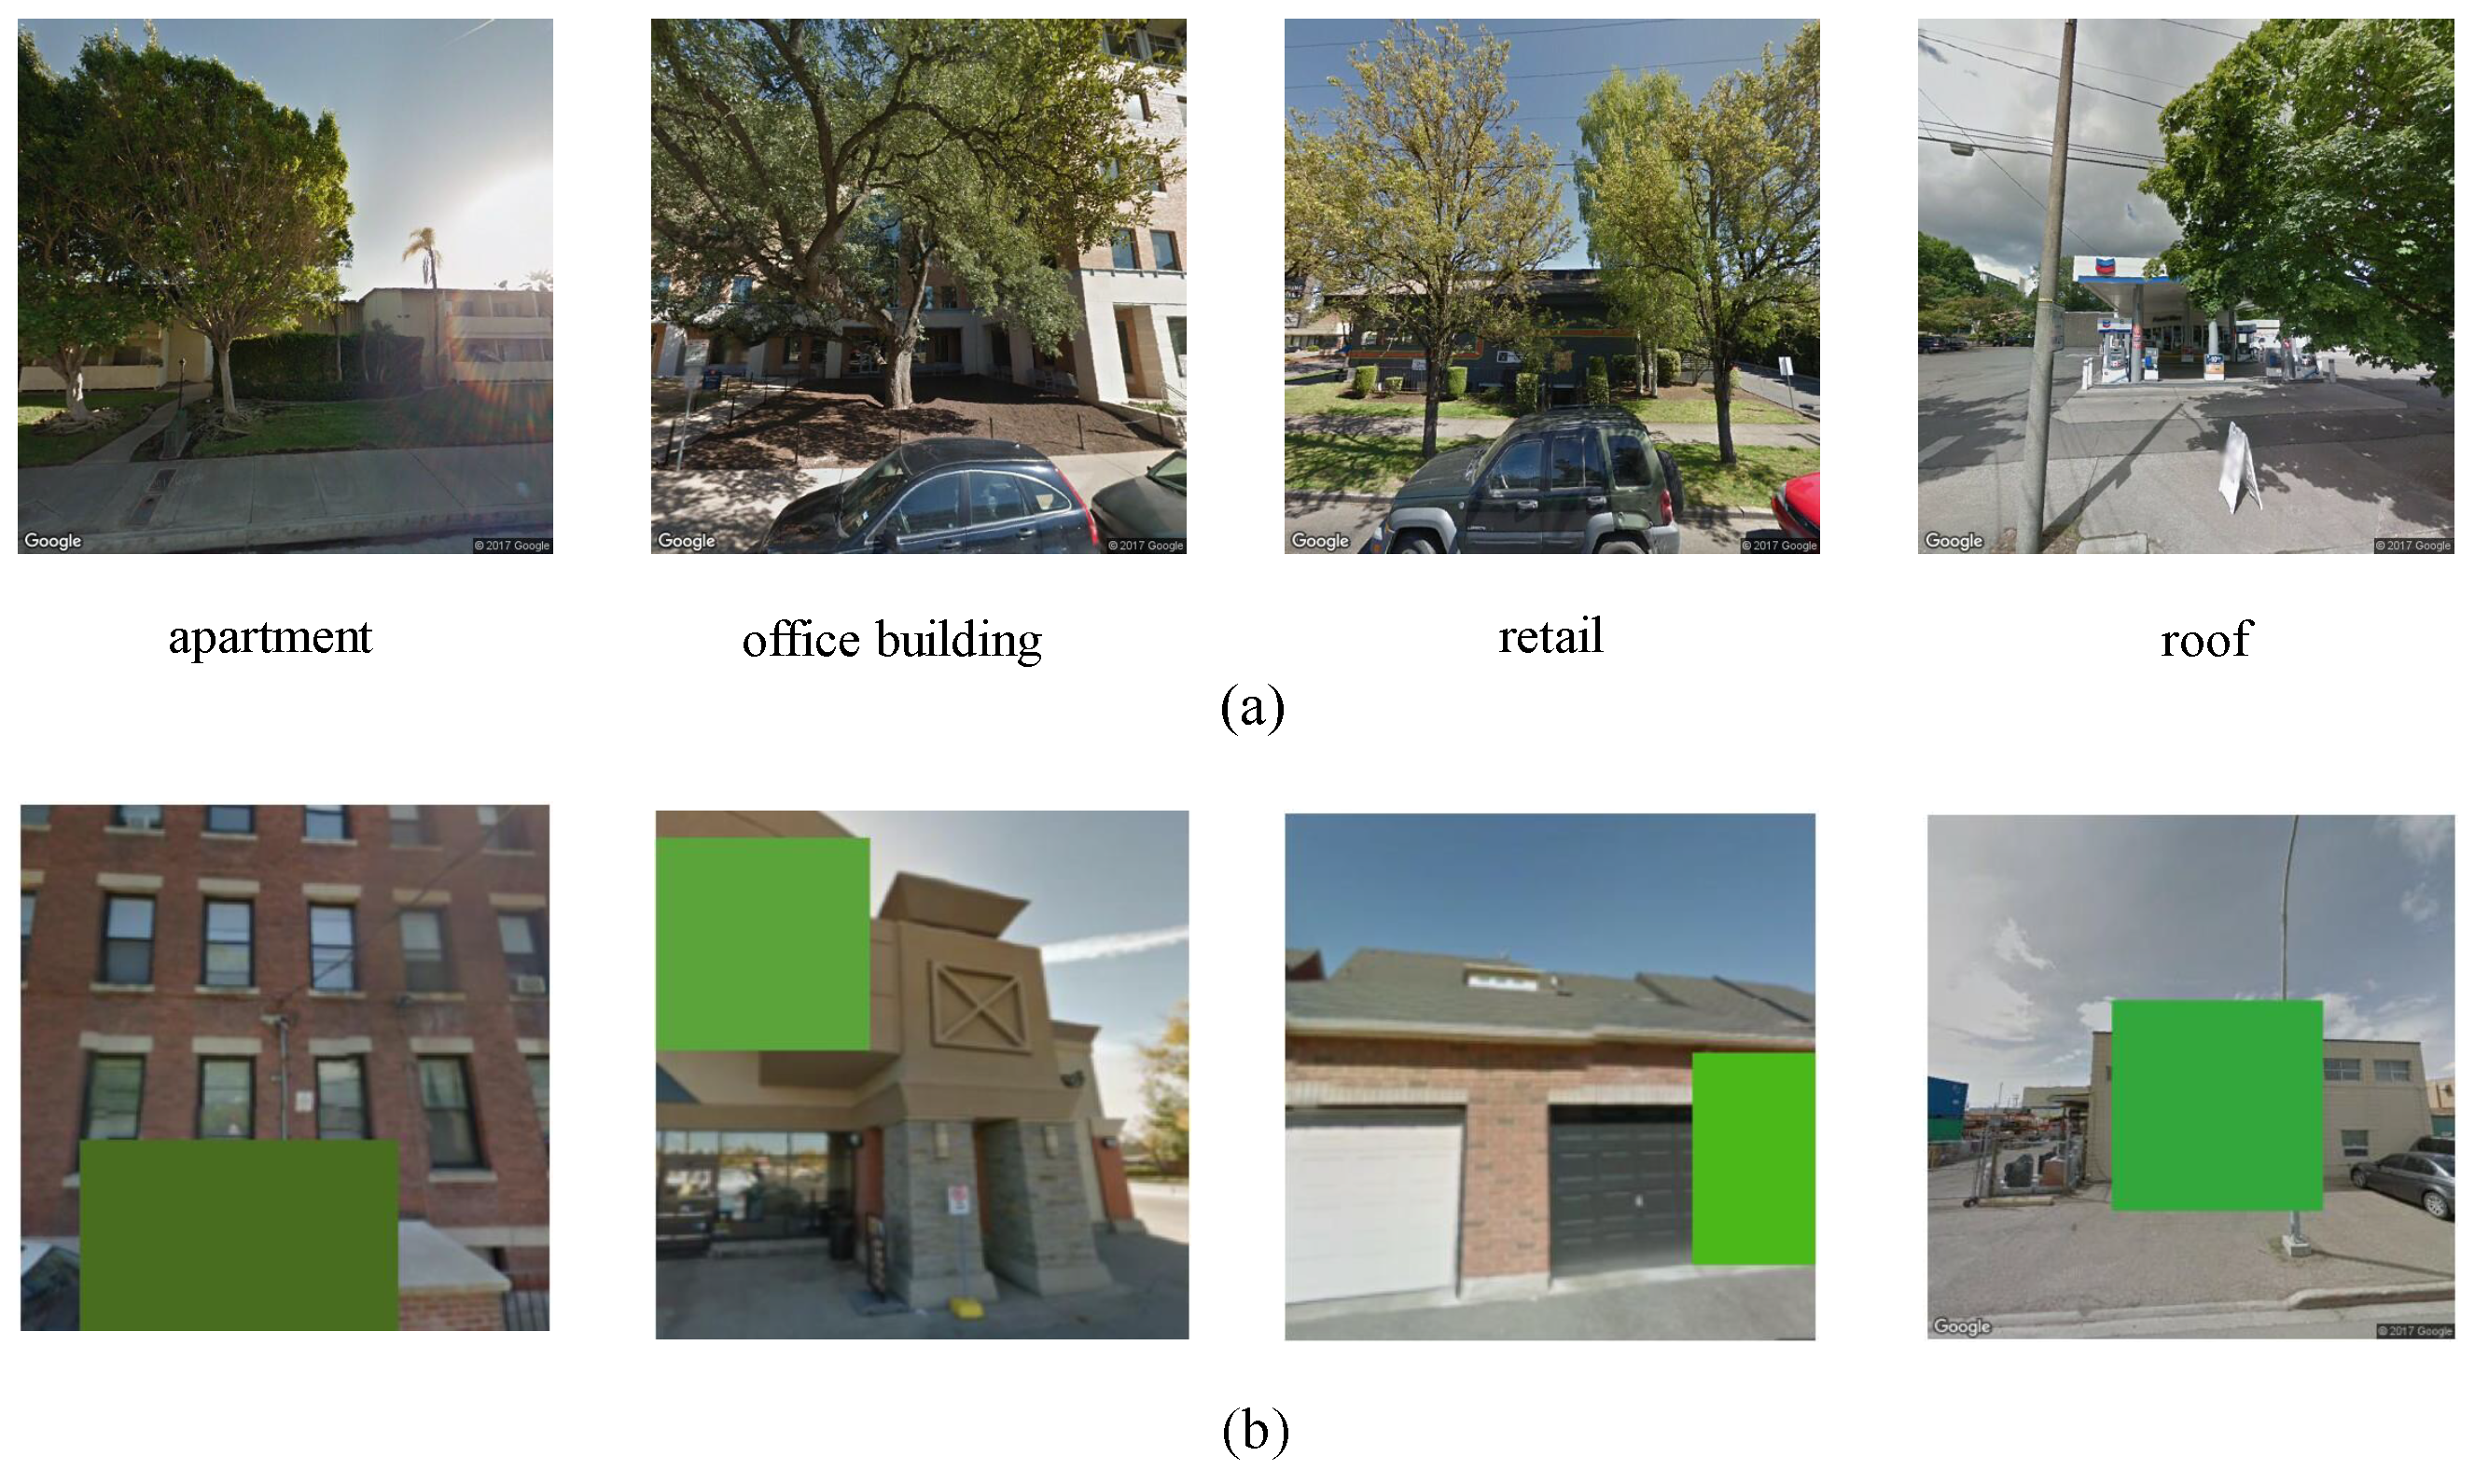
- City-Scale Maps (CSM (CSM & BIC_GSV: https://syncandshare.lrz.de/dl/fiTFS5He9bZsR4Urh8hZGDGg/BIC_GSV.tar.gz (accessed on 25 February 2025))) [9]: The CSM dataset is comprised of 116,491 samples collected from major cities in the United States and Canada, including Boston, Calgary, and Toronto. The specific geographical locations of three samples from each of these cities are presented in Figure 3.
3.1.2. Labeled Dataset
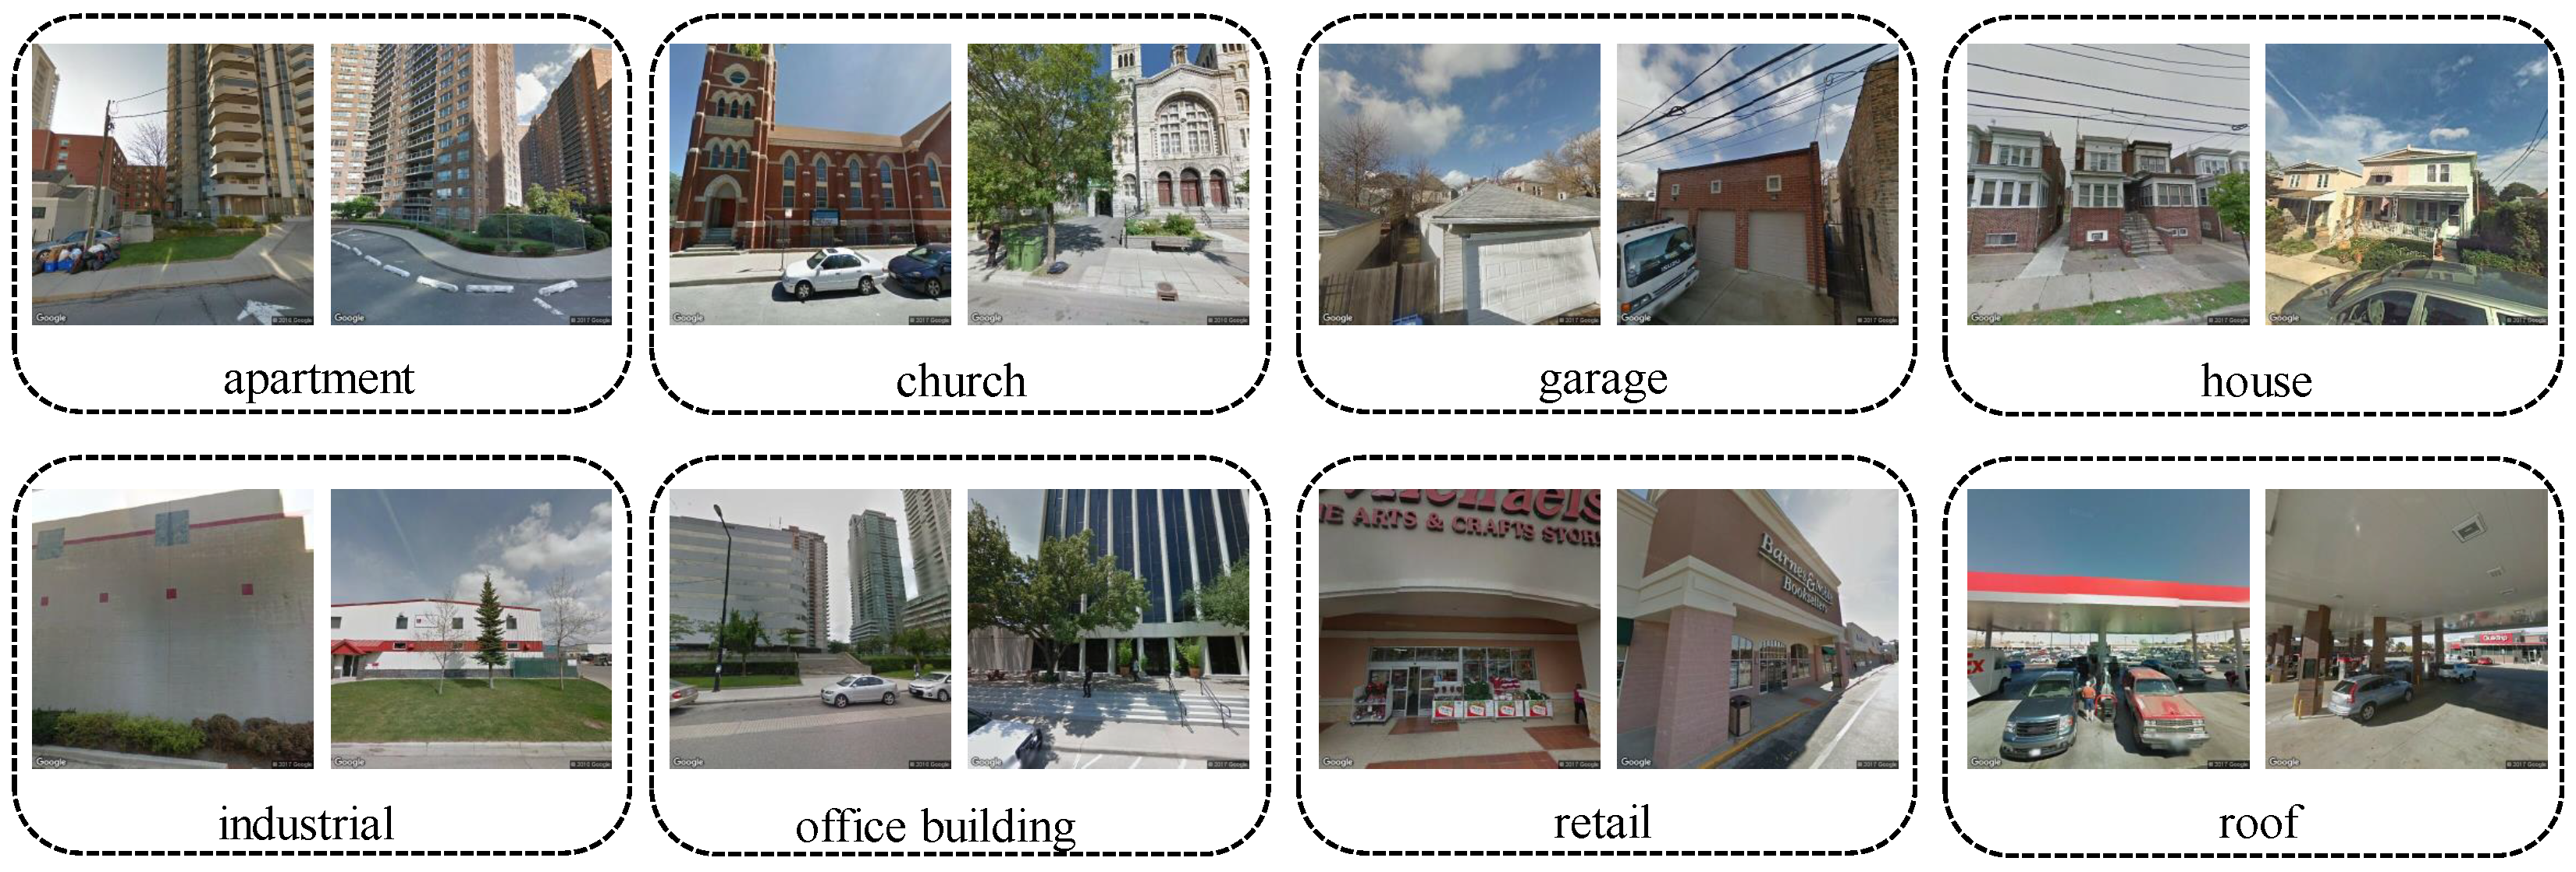
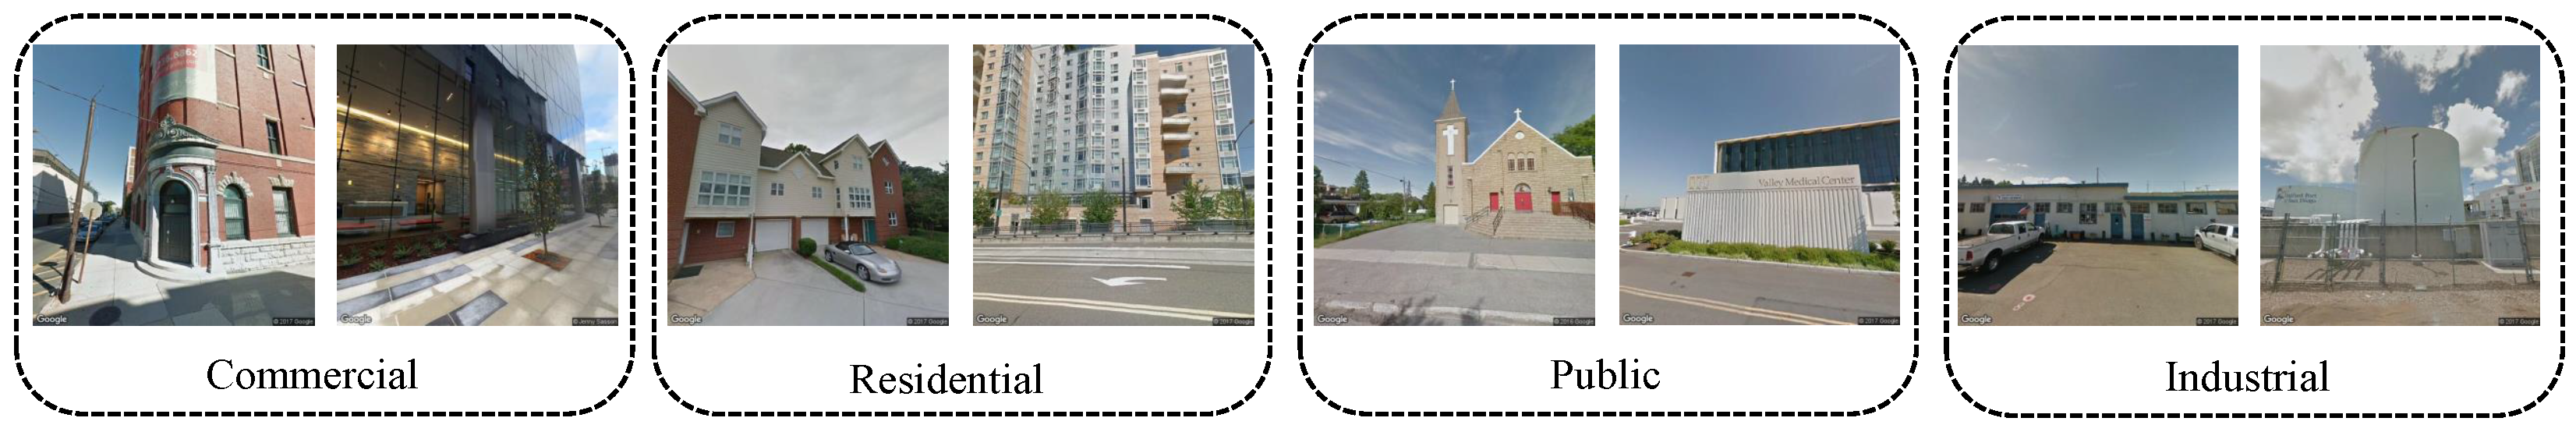
- BEAUTY (BEAUTY: https://pan.baidu.com/share/init?surl=nSPU68H36CMsn5pboD5e9A&pwd=T78D (accessed on 25 February 2025)): The BEAUTY dataset consists of 19,070 samples in total. It is divided into four abstract functional zones, namely commercial, residential, public, and industrial. Examples from the BEAUTY dataset are shown visually in Figure 6, with detailed information provided in Figure 7.
3.2. Method Description
3.2.1. Overview
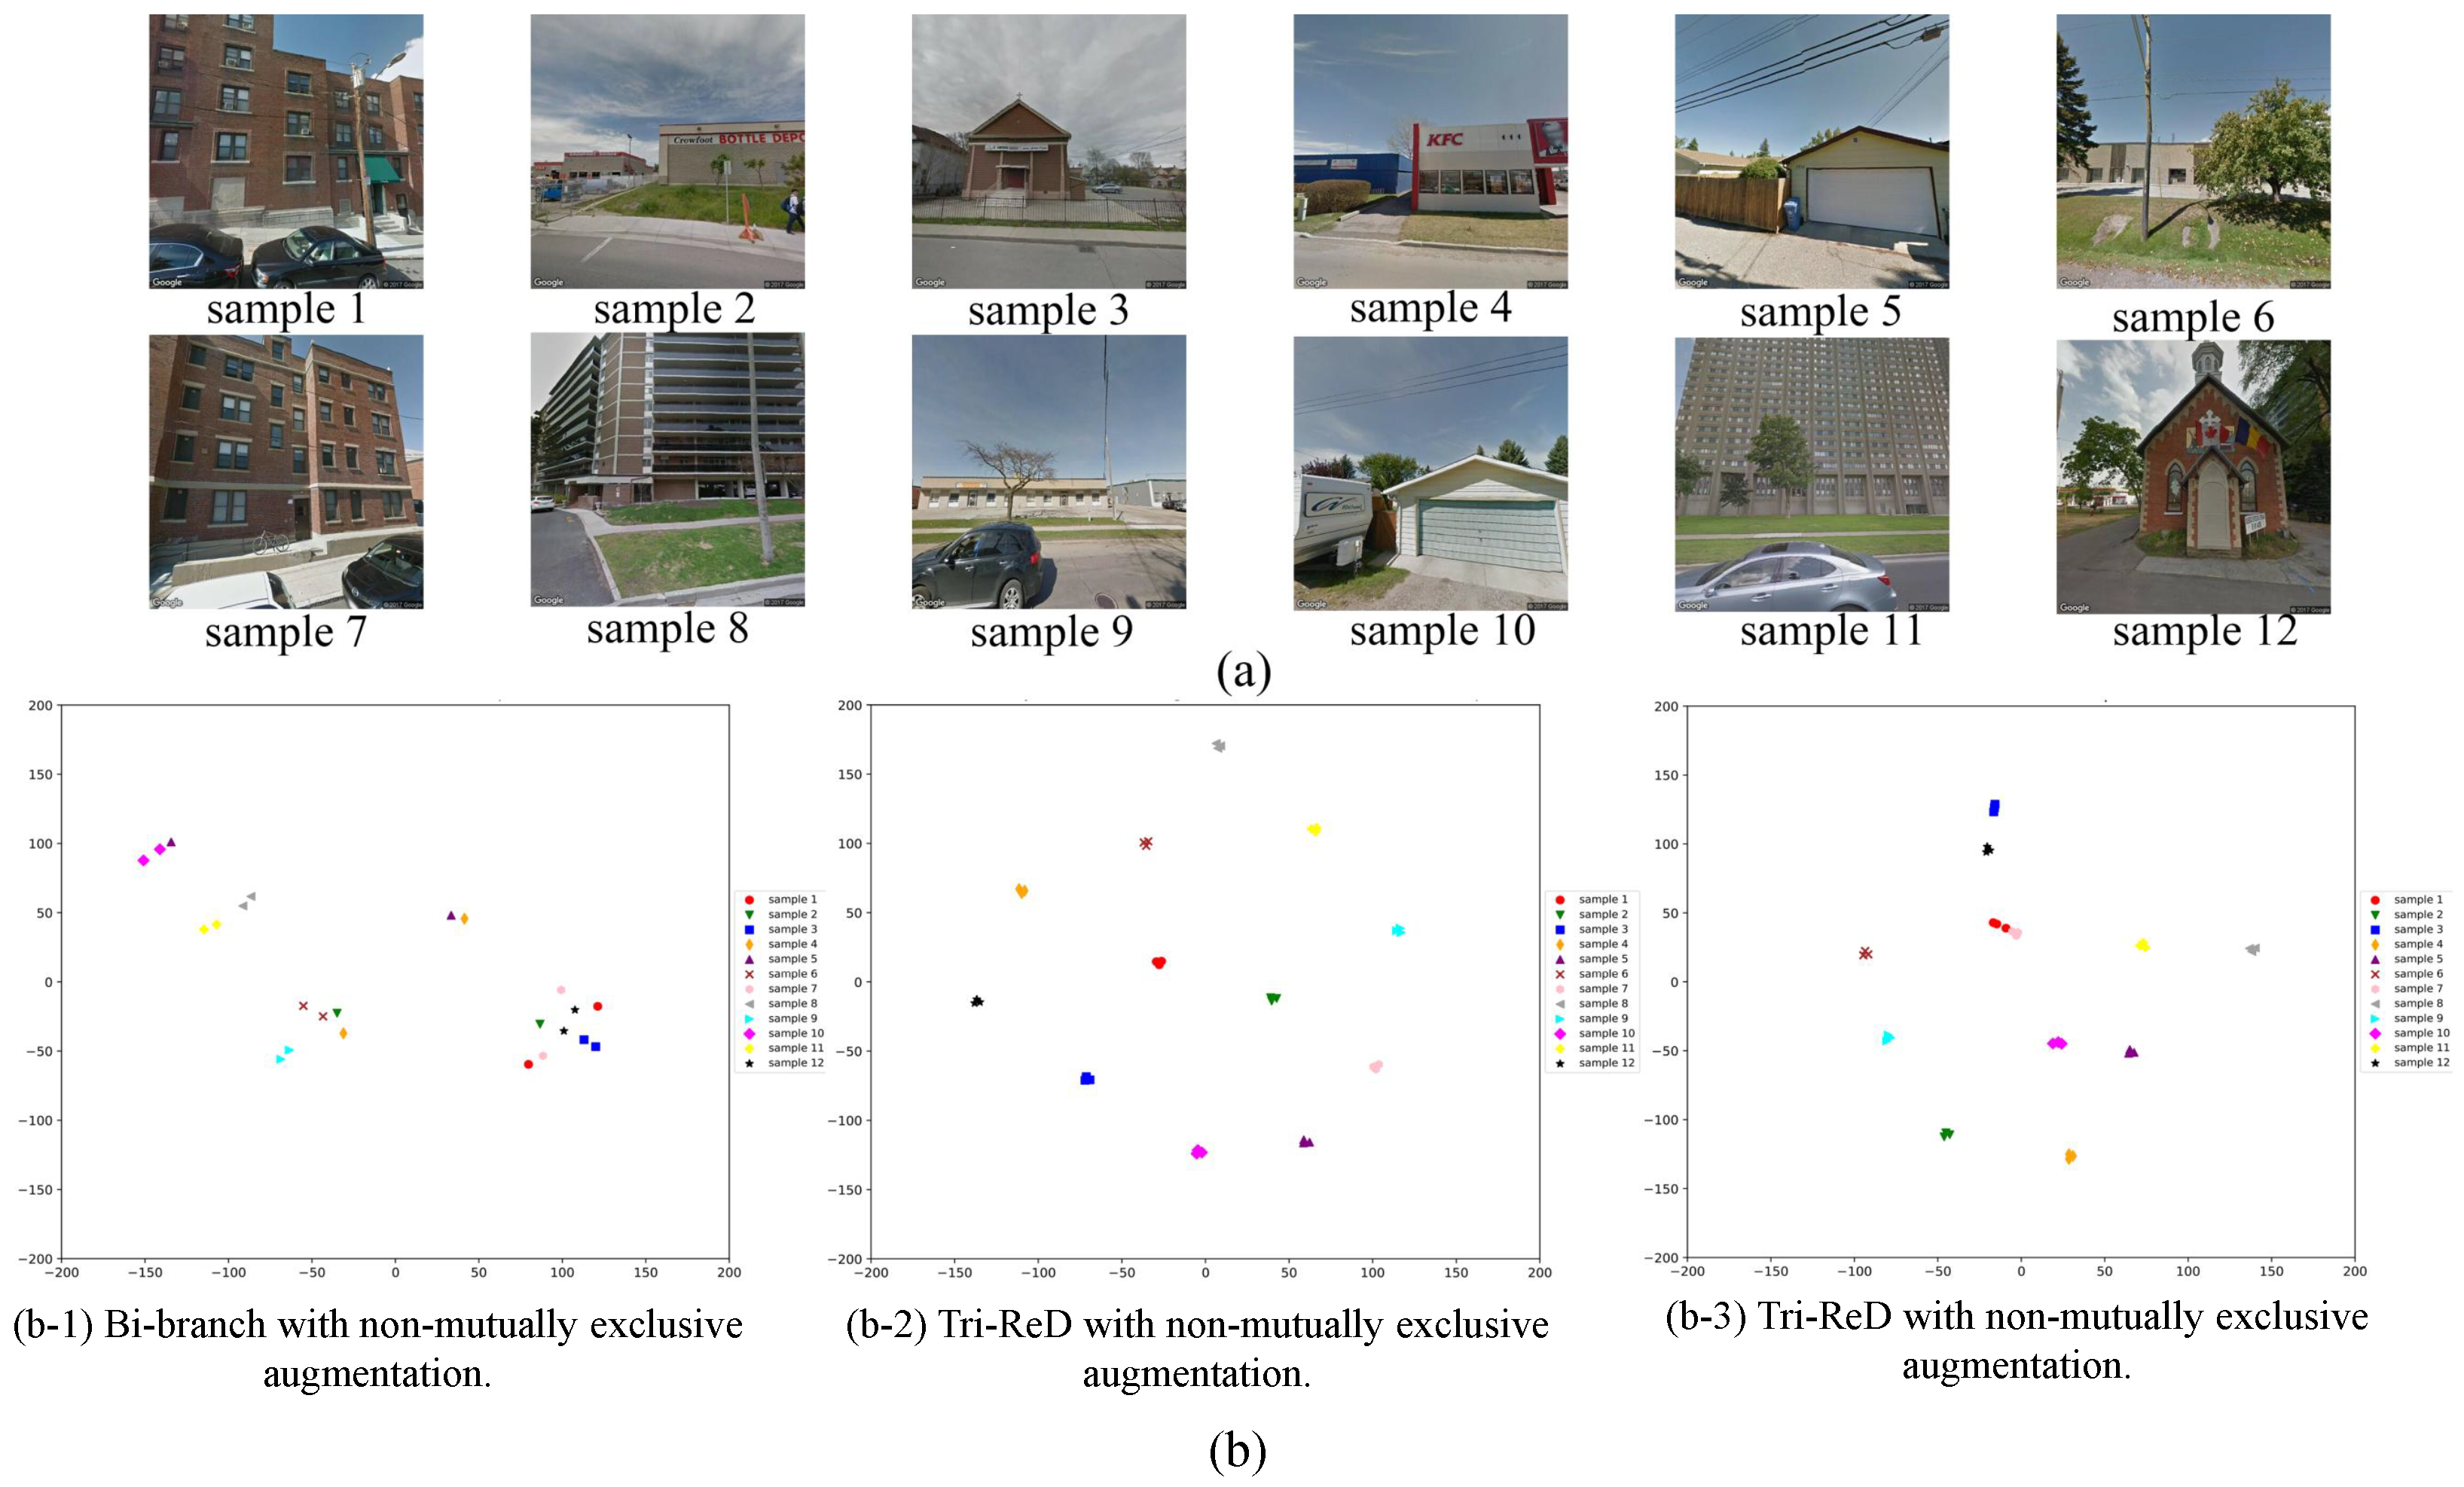
3.2.2. Tri-Branch Mutually Exclusive Augmentation
3.2.3. Trilateral Redundancy Reduction
3.3. Experimental Setup
4. Results
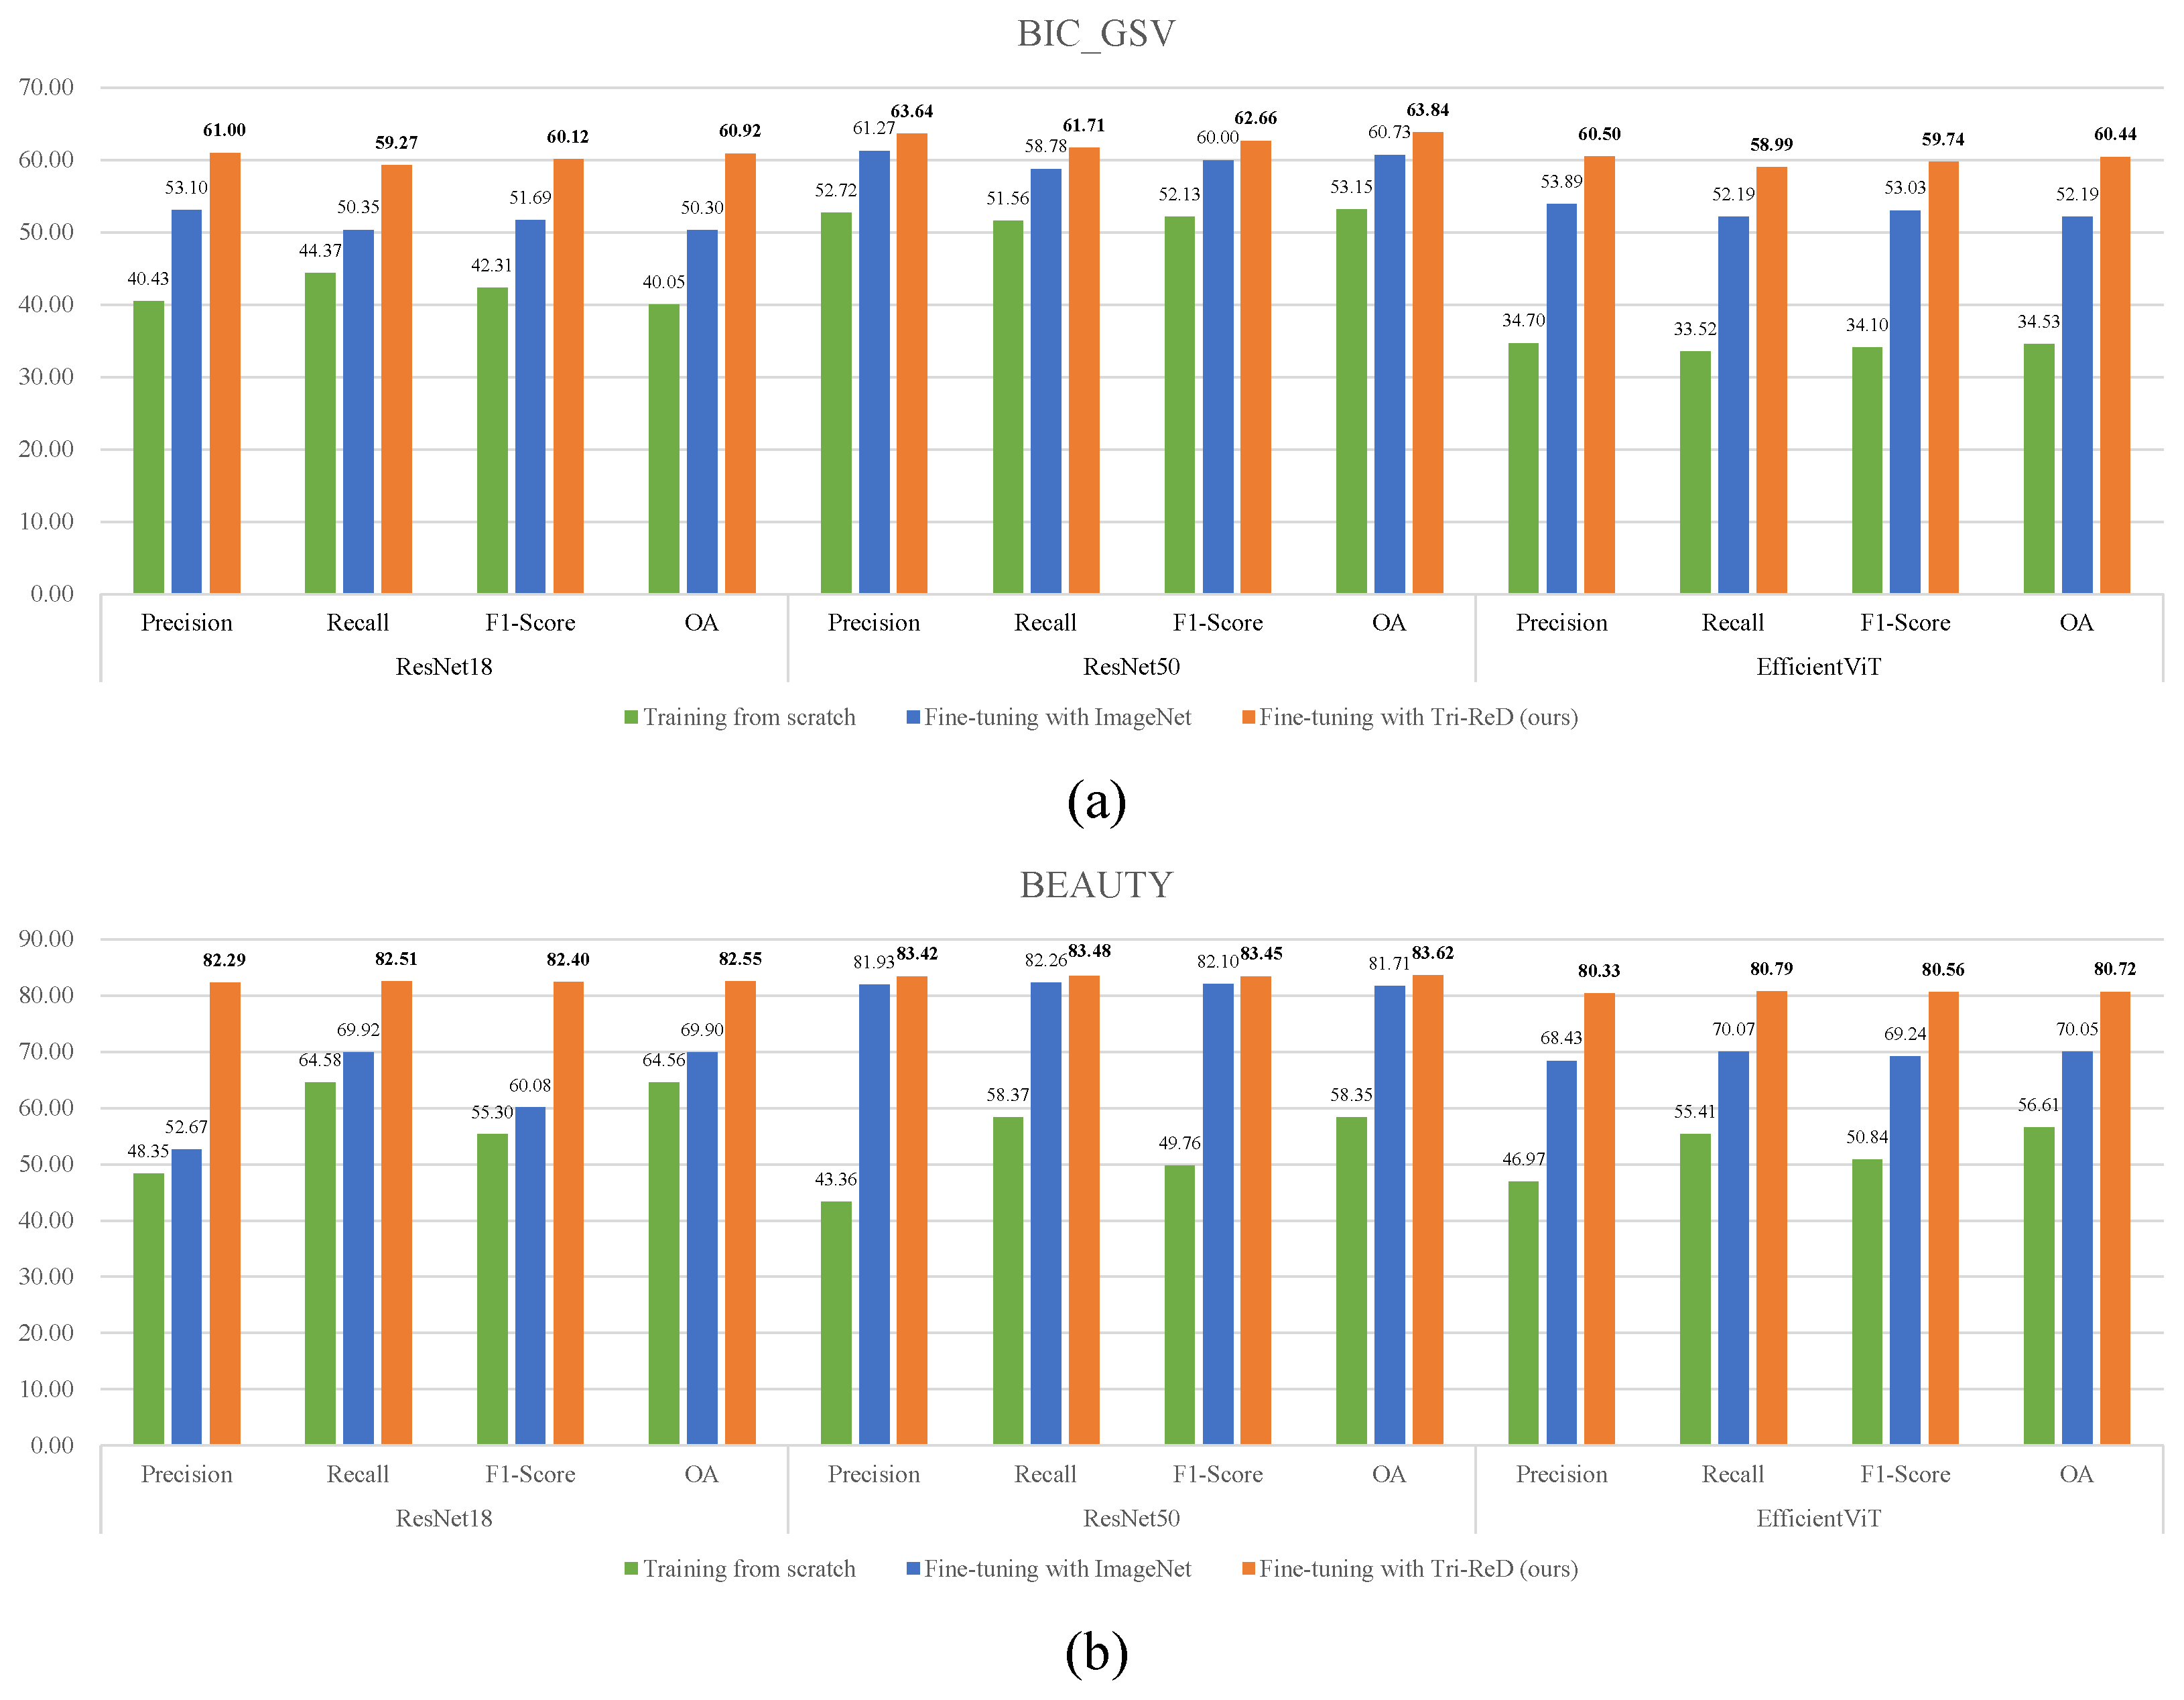
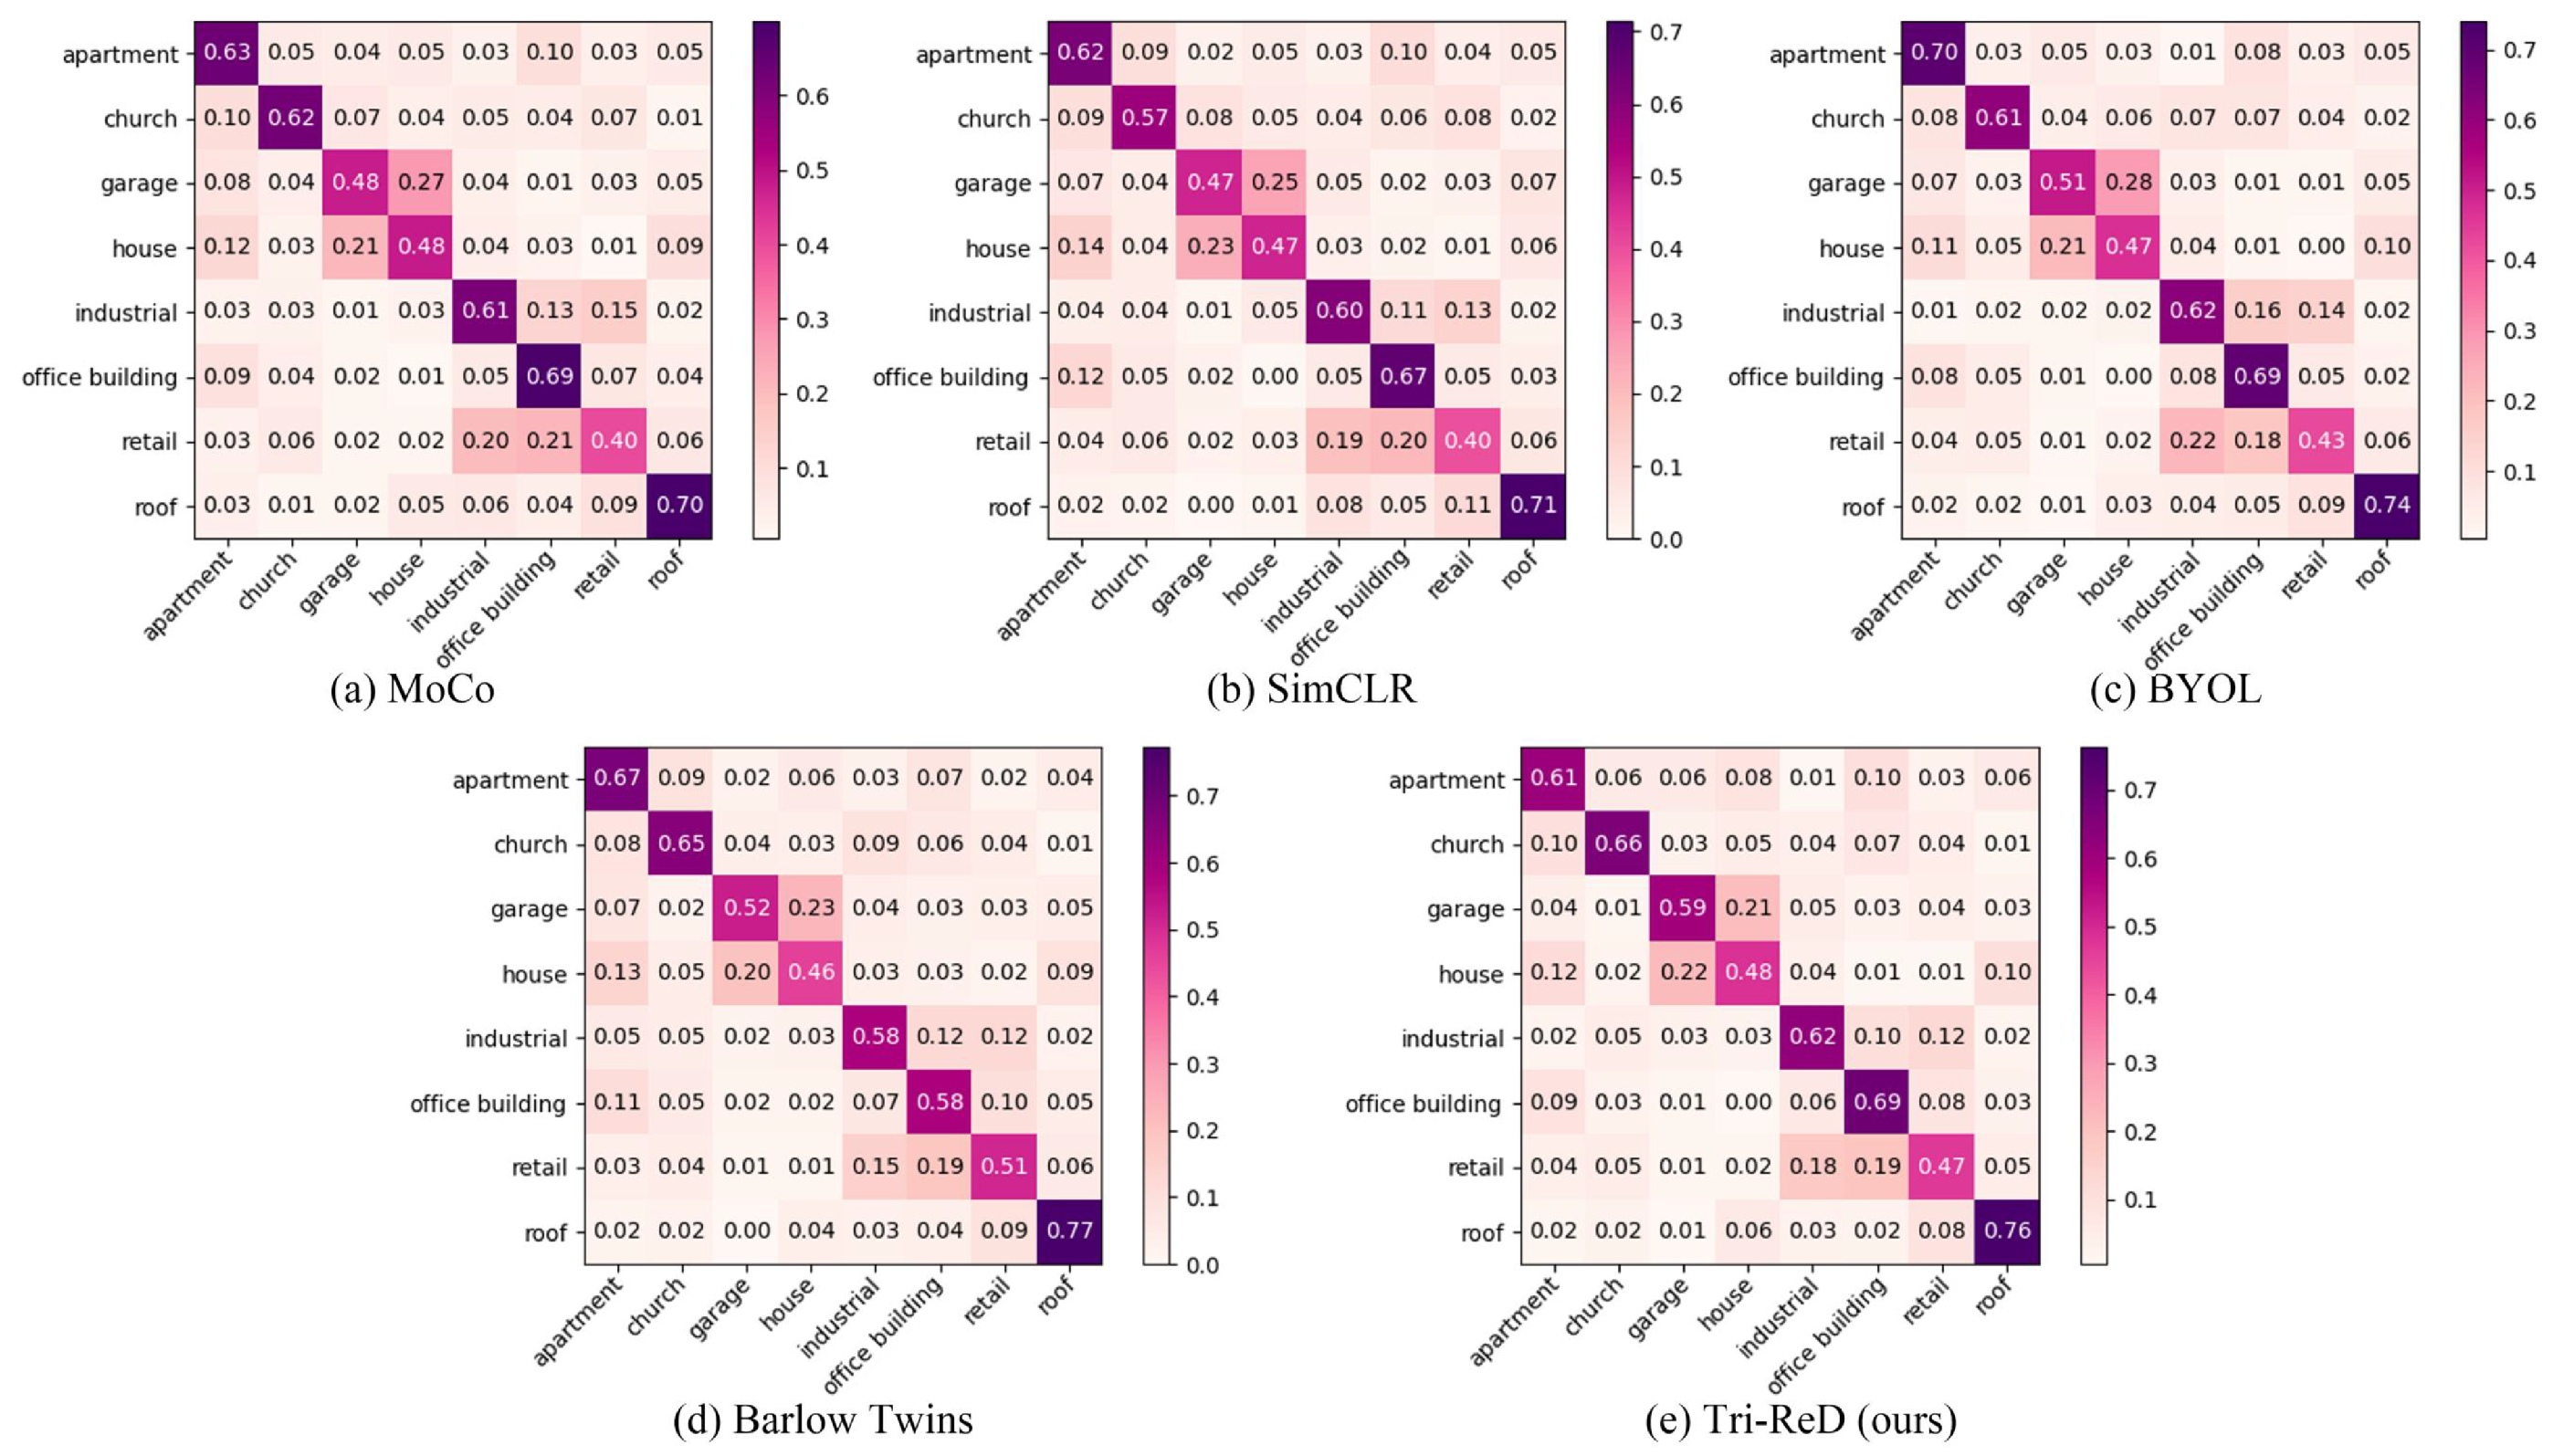
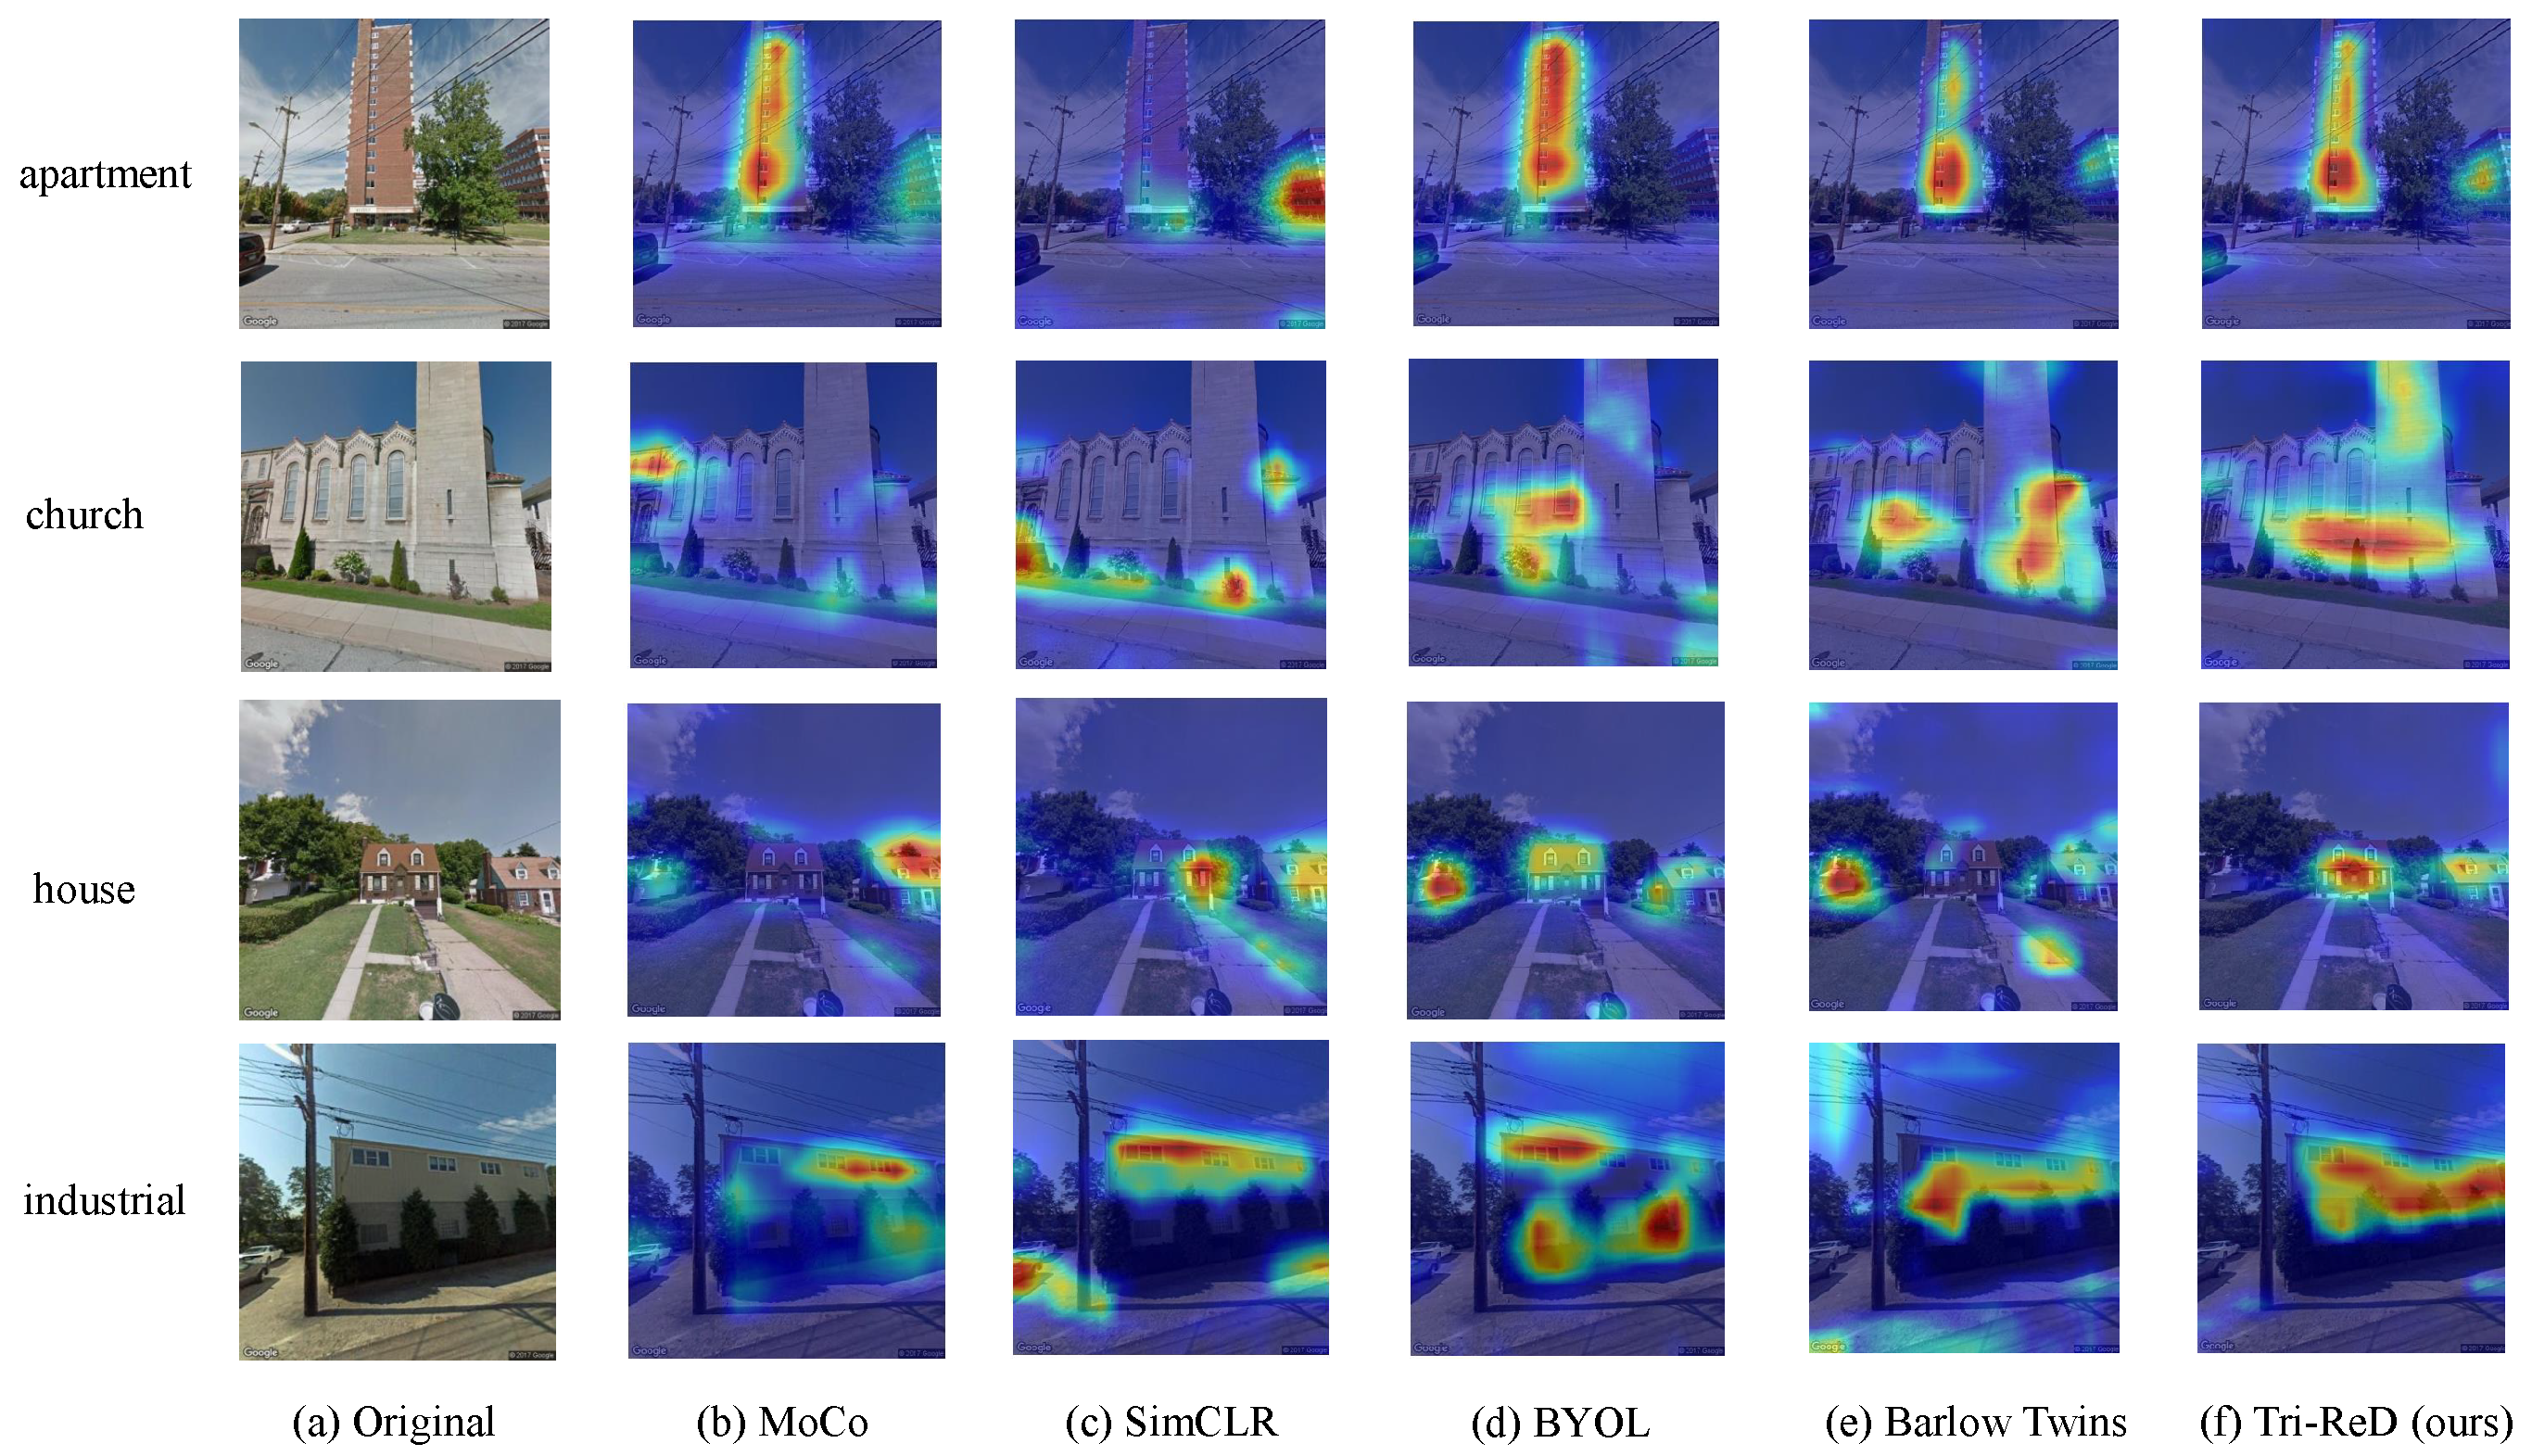
4.1. Comparison Experiment
4.2. Ablation Experiment
5. Discussion
6. Conclusions
Author Contributions
Funding
Institutional Review Board Statement
Informed Consent Statement
Data Availability Statement
Conflicts of Interest
References
- Zhang, F.; Miranda, A.S.; Duarte, F.; Vale, L.; Hack, G.; Chen, M.; Liu, Y.; Batty, M.; Ratti, C. Urban Visual Intelligence: Studying Cities with AI and Street-level Imagery. arXiv 2023, arXiv:2301.00580. [Google Scholar]
- Zhang, F.; Wu, L.; Zhu, D.; Liu, Y. Social sensing from street-level imagery: A case study in learning spatio-temporal urban mobility patterns. ISPRS J. Photogramm. Remote Sens. 2019, 153, 48–58. [Google Scholar] [CrossRef]
- Biljecki, F.; Ito, K. Street view imagery in urban analytics and GIS: A review. Landsc. Urban Plan. 2021, 215, 104217. [Google Scholar] [CrossRef]
- Sun, M.; Zhang, F.; Duarte, F.; Ratti, C. Understanding architecture age and style through deep learning. Cities 2022, 128, 103787. [Google Scholar] [CrossRef]
- He, J.; Zhang, J.; Yao, Y.; Li, X. Extracting human perceptions from street view images for better assessing urban renewal potential. Cities 2023, 134, 104189. [Google Scholar] [CrossRef]
- Li, Z.; Li, L.; Zhu, J. Read: Large-scale neural scene rendering for autonomous driving. In Proceedings of the AAAI Conference on Artificial Intelligence, Washington, DC, USA, 7–14 February 2023; Volume 37, pp. 1522–1529. [Google Scholar]
- Chen, D.; Wawrzynski, P.; Lv, Z. Cyber security in smart cities: A review of deep learning-based applications and case studies. Sustain. Cities Soc. 2021, 66, 102655. [Google Scholar] [CrossRef]
- Liu, X.; Zhang, F.; Hou, Z.; Mian, L.; Wang, Z.; Zhang, J.; Tang, J. Self-supervised learning: Generative or contrastive. IEEE Trans. Knowl. Data Eng. 2021, 35, 857–876. [Google Scholar] [CrossRef]
- Kang, J.; Körner, M.; Wang, Y.; Taubenböck, H.; Zhu, X.X. Building instance classification using street view images. ISPRS J. Photogramm. Remote Sens. 2018, 145, 44–59. [Google Scholar] [CrossRef]
- Wu, Z.; Xiong, Y.; Yu, S.X.; Lin, D. Unsupervised feature learning via non-parametric instance discrimination. In Proceedings of the IEEE Conference on Computer Vision and Pattern Recognition, Salt Lake City, UT, USA, 18–23 June 2018; pp. 3733–3742. [Google Scholar]
- He, K.; Fan, H.; Wu, Y.; Xie, S.; Girshick, R. Momentum contrast for unsupervised visual representation learning. In Proceedings of the IEEE/CVF Conference on Computer Vision and Pattern Recognition, Seattle, WA, USA, 13–19 June 2020; pp. 9729–9738. [Google Scholar]
- Chen, T.; Kornblith, S.; Norouzi, M.; Hinton, G. A simple framework for contrastive learning of visual representations. In Proceedings of the International Conference on Machine Learning, PMLR, Virtual, 13–18 July 2020; pp. 1597–1607. [Google Scholar]
- Caron, M.; Misra, I.; Mairal, J.; Goyal, P.; Bojanowski, P.; Joulin, A. Unsupervised learning of visual features by contrasting cluster assignments. Adv. Neural Inf. Process. Syst. 2020, 33, 9912–9924. [Google Scholar]
- Grill, J.B.; Strub, F.; Altché, F.; Tallec, C.; Richemond, P.; Buchatskaya, E.; Doersch, C.; Avila Pires, B.; Guo, Z.; Gheshlaghi Azar, M.; et al. Bootstrap your own latent—A new approach to self-supervised learning. Adv. Neural Inf. Process. Syst. 2020, 33, 21271–21284. [Google Scholar]
- Chen, X.; He, K. Exploring simple siamese representation learning. In Proceedings of the IEEE/CVF Conference on Computer Vision and Pattern Recognition, Nashville, TN, USA, 20–25 June 2021; pp. 15750–15758. [Google Scholar]
- Caron, M.; Touvron, H.; Misra, I.; Jégou, H.; Mairal, J.; Bojanowski, P.; Joulin, A. Emerging properties in self-supervised vision transformers. In Proceedings of the IEEE/CVF International Conference on Computer Vision, Montreal, BC, Canada, 11–17 October 2021; pp. 9650–9660. [Google Scholar]
- Zbontar, J.; Jing, L.; Misra, I.; LeCun, Y.; Deny, S. Barlow twins: Self-supervised learning via redundancy reduction. In Proceedings of the International Conference on Machine Learning, PMLR, Virtual, 18–24 July 2021; pp. 12310–12320. [Google Scholar]
- Wang, Y.; Albrecht, C.M.; Braham, N.A.A.; Mou, L.; Zhu, X.X. Self-supervised learning in remote sensing: A review. IEEE Geosci. Remote Sens. Mag. 2022, 10, 213–247. [Google Scholar] [CrossRef]
- Tao, C.; Qi, J.; Guo, M.; Zhu, Q.; Li, H. Self-supervised remote sensing feature learning: Learning paradigms, challenges, and future works. IEEE Trans. Geosci. Remote Sens. 2023, 61, 1–26. [Google Scholar] [CrossRef]
- Bourcier, J.; Dashyan, G.; Chanussot, J.; Alahari, K. Evaluating the label efficiency of contrastive self-supervised learning for multi-resolution satellite imagery. In Proceedings of the Image and Signal Processing for Remote Sensing XXVIII, SPIE, Berlin, Germany, 5–6 September 2022; Volume 12267, pp. 152–161. [Google Scholar]
- Scheibenreif, L.; Hanna, J.; Mommert, M.; Borth, D. Self-supervised vision transformers for land-cover segmentation and classification. In Proceedings of the IEEE/CVF Conference on Computer Vision and Pattern Recognition, New Orleans, LA, USA, 18–24 June 2022; pp. 1422–1431. [Google Scholar]
- Xue, Z.; Liu, B.; Yu, A.; Yu, X.; Zhang, P.; Tan, X. Self-supervised feature representation and few-shot land cover classification of multimodal remote sensing images. IEEE Trans. Geosci. Remote Sens. 2022, 60, 1–18. [Google Scholar] [CrossRef]
- Tao, C.; Qi, J.; Zhang, G.; Zhu, Q.; Lu, W.; Li, H. TOV: The original vision model for optical remote sensing image understanding via self-supervised learning. IEEE J. Sel. Top. Appl. Earth Obs. Remote Sens. 2023, 16, 4916–4930. [Google Scholar] [CrossRef]
- Chen, P.; Qiu, Y.; Guo, L.; Zhang, X.; Liu, F.; Jiao, L.; Li, L. Cross-Scene Classification of Remote Sensing Images Based on General-Specific Prototype Contrastive Learning. IEEE J. Sel. Top. Appl. Earth Obs. Remote Sens. 2024, 17, 7986–8002. [Google Scholar] [CrossRef]
- Zhao, K.; Liu, Y.; Hao, S.; Lu, S.; Liu, H.; Zhou, L. Bounding boxes are all we need: Street view image classification via context encoding of detected buildings. IEEE Trans. Geosci. Remote Sens. 2021, 60, 1–17. [Google Scholar] [CrossRef]
- Tian, Y.; Sun, C.; Poole, B.; Krishnan, D.; Schmid, C.; Isola, P. What makes for good views for contrastive learning? Adv. Neural Inf. Process. Syst. 2020, 33, 6827–6839. [Google Scholar]
- Heidler, K.; Mou, L.; Hu, D.; Jin, P.; Li, G.; Gan, C.; Wen, J.R.; Zhu, X.X. Self-supervised audiovisual representation learning for remote sensing data. Int. J. Appl. Earth Obs. Geoinf. 2023, 116, 103130. [Google Scholar] [CrossRef]
- Li, X.; Zhang, C.; Li, W. Building block level urban land-use information retrieval based on Google Street View images. GISci. Remote Sens. 2017, 54, 819–835. [Google Scholar] [CrossRef]
- Krizhevsky, A.; Sutskever, I.; Hinton, G.E. Imagenet classification with deep convolutional neural networks. Adv. Neural Inf. Process. Syst. 2012, 25, 84–90. [Google Scholar] [CrossRef]
- Simonyan, K.; Zisserman, A. Very deep convolutional networks for large-scale image recognition. arXiv 2014, arXiv:1409.1556. [Google Scholar]
- Szegedy, C.; Liu, W.; Jia, Y.; Sermanet, P.; Reed, S.; Anguelov, D.; Erhan, D.; Vanhoucke, V.; Rabinovich, A. Going deeper with convolutions. In Proceedings of the IEEE Conference on Computer Vision and Pattern Recognition, Boston, MA, USA, 7–12 June 2015; pp. 1–9. [Google Scholar]
- He, K.; Zhang, X.; Ren, S.; Sun, J. Deep residual learning for image recognition. In Proceedings of the IEEE Conference on Computer Vision and Pattern Recognition, Las Vegas, NV, USA, 27–30 June 2016; pp. 770–778. [Google Scholar]
- Dosovitskiy, A.; Beyer, L.; Kolesnikov, A.; Weissenborn, D.; Zhai, X.; Unterthiner, T.; Dehghani, M.; Minderer, M.; Heigold, G.; Gelly, S.; et al. An image is worth 16 × 16 words: Transformers for image recognition at scale. arXiv 2020, arXiv:2010.11929. [Google Scholar]
- Zhu, Y.; Newsam, S. Land use classification using convolutional neural networks applied to ground-level images. In Proceedings of the 23rd SIGSPATIAL International Conference on Advances in Geographic Information Systems, Bellevue, WA, USA, 3–6 November 2015; pp. 1–4. [Google Scholar]
- Zhang, W.; Li, W.; Zhang, C.; Hanink, D.M.; Li, X.; Wang, W. Parcel-based urban land use classification in megacity using airborne LiDAR, high resolution orthoimagery, and Google Street View. Comput. Environ. Urban Syst. 2017, 64, 215–228. [Google Scholar] [CrossRef]
- Gonzalez, D.; Rueda-Plata, D.; Acevedo, A.B.; Duque, J.C.; Ramos-Pollán, R.; Betancourt, A.; García, S. Automatic detection of building typology using deep learning methods on street level images. Build. Environ. 2020, 177, 106805. [Google Scholar] [CrossRef]
- Huang, Z.; Qi, H.; Kang, C.; Su, Y.; Liu, Y. An ensemble learning approach for urban land use mapping based on remote sensing imagery and social sensing data. Remote Sens. 2020, 12, 3254. [Google Scholar] [CrossRef]
- Wu, M.; Huang, Q.; Gao, S.; Zhang, Z. Mixed land use measurement and mapping with street view images and spatial context-aware prompts via zero-shot multimodal learning. Int. J. Appl. Earth Obs. Geoinf. 2023, 125, 103591. [Google Scholar] [CrossRef]
- Jing, L.; Tian, Y. Self-supervised visual feature learning with deep neural networks: A survey. IEEE Trans. Pattern Anal. Mach. Intell. 2020, 43, 4037–4058. [Google Scholar] [CrossRef]
- Hinton, G.E.; Salakhutdinov, R.R. Reducing the dimensionality of data with neural networks. Science 2006, 313, 504–507. [Google Scholar] [CrossRef]
- Mikolov, T.; Chen, K.; Corrado, G.; Dean, J. Efficient estimation of word representations in vector space. arXiv 2013, arXiv:1301.3781. [Google Scholar]
- Mikolov, T.; Sutskever, I.; Chen, K.; Corrado, G.S.; Dean, J. Distributed representations of words and phrases and their compositionality. Adv. Neural Inf. Process. Syst. 2013, 26, 1–9. [Google Scholar]
- Devlin, J.; Chang, M.W.; Lee, K.; Toutanova, K. Bert: Pre-training of deep bidirectional transformers for language understanding. arXiv 2018, arXiv:1810.04805. [Google Scholar]
- Li, G.; Qian, M.; Xia, G.S. Unleashing Unlabeled Data: A Paradigm for Cross-View Geo-Localization. In Proceedings of the IEEE/CVF Conference on Computer Vision and Pattern Recognition, Seattle, WA, USA, 16–22 June 2024; pp. 16719–16729. [Google Scholar]
- Xia, S.; Zhang, X.; Meng, H.; Fan, J.; Jiao, L. Two-Stream Networks for Contrastive Learning in Hyperspectral Image Classification. IEEE J. Sel. Top. Appl. Earth Obs. Remote Sens. 2023, 17, 1903–1920. [Google Scholar] [CrossRef]
- Jing, L.; Vincent, P.; LeCun, Y.; Tian, Y. Understanding dimensional collapse in contrastive self-supervised learning. arXiv 2021, arXiv:2110.09348. [Google Scholar]
- Liu, X.; Peng, H.; Zheng, N.; Yang, Y.; Hu, H.; Yuan, Y. Efficientvit: Memory efficient vision transformer with cascaded group attention. In Proceedings of the IEEE/CVF Conference on Computer Vision and Pattern Recognition, Vancouver, BC, Canada, 17–24 June 2023; pp. 14420–14430. [Google Scholar]
- Selvaraju, R.R.; Cogswell, M.; Das, A.; Vedantam, R.; Parikh, D.; Batra, D. Grad-cam: Visual explanations from deep networks via gradient-based localization. In Proceedings of the IEEE International Conference on Computer Vision, Venice, Italy, 22–29 October 2017; pp. 618–626. [Google Scholar]
- Yun, S.; Han, D.; Oh, S.J.; Chun, S.; Choe, J.; Yoo, Y. Cutmix: Regularization strategy to train strong classifiers with localizable features. In Proceedings of the IEEE/CVF International Conference on Computer Vision, Seoul, Republic of Korea, 27 October–2 November 2019; pp. 6023–6032. [Google Scholar]
- Zhang, H. mixup: Beyond empirical risk minimization. arXiv 2017, arXiv:1710.09412. [Google Scholar]

| Datasets | Total | Training | Testing | |
|---|---|---|---|---|
| Training | Validation | Testing | ||
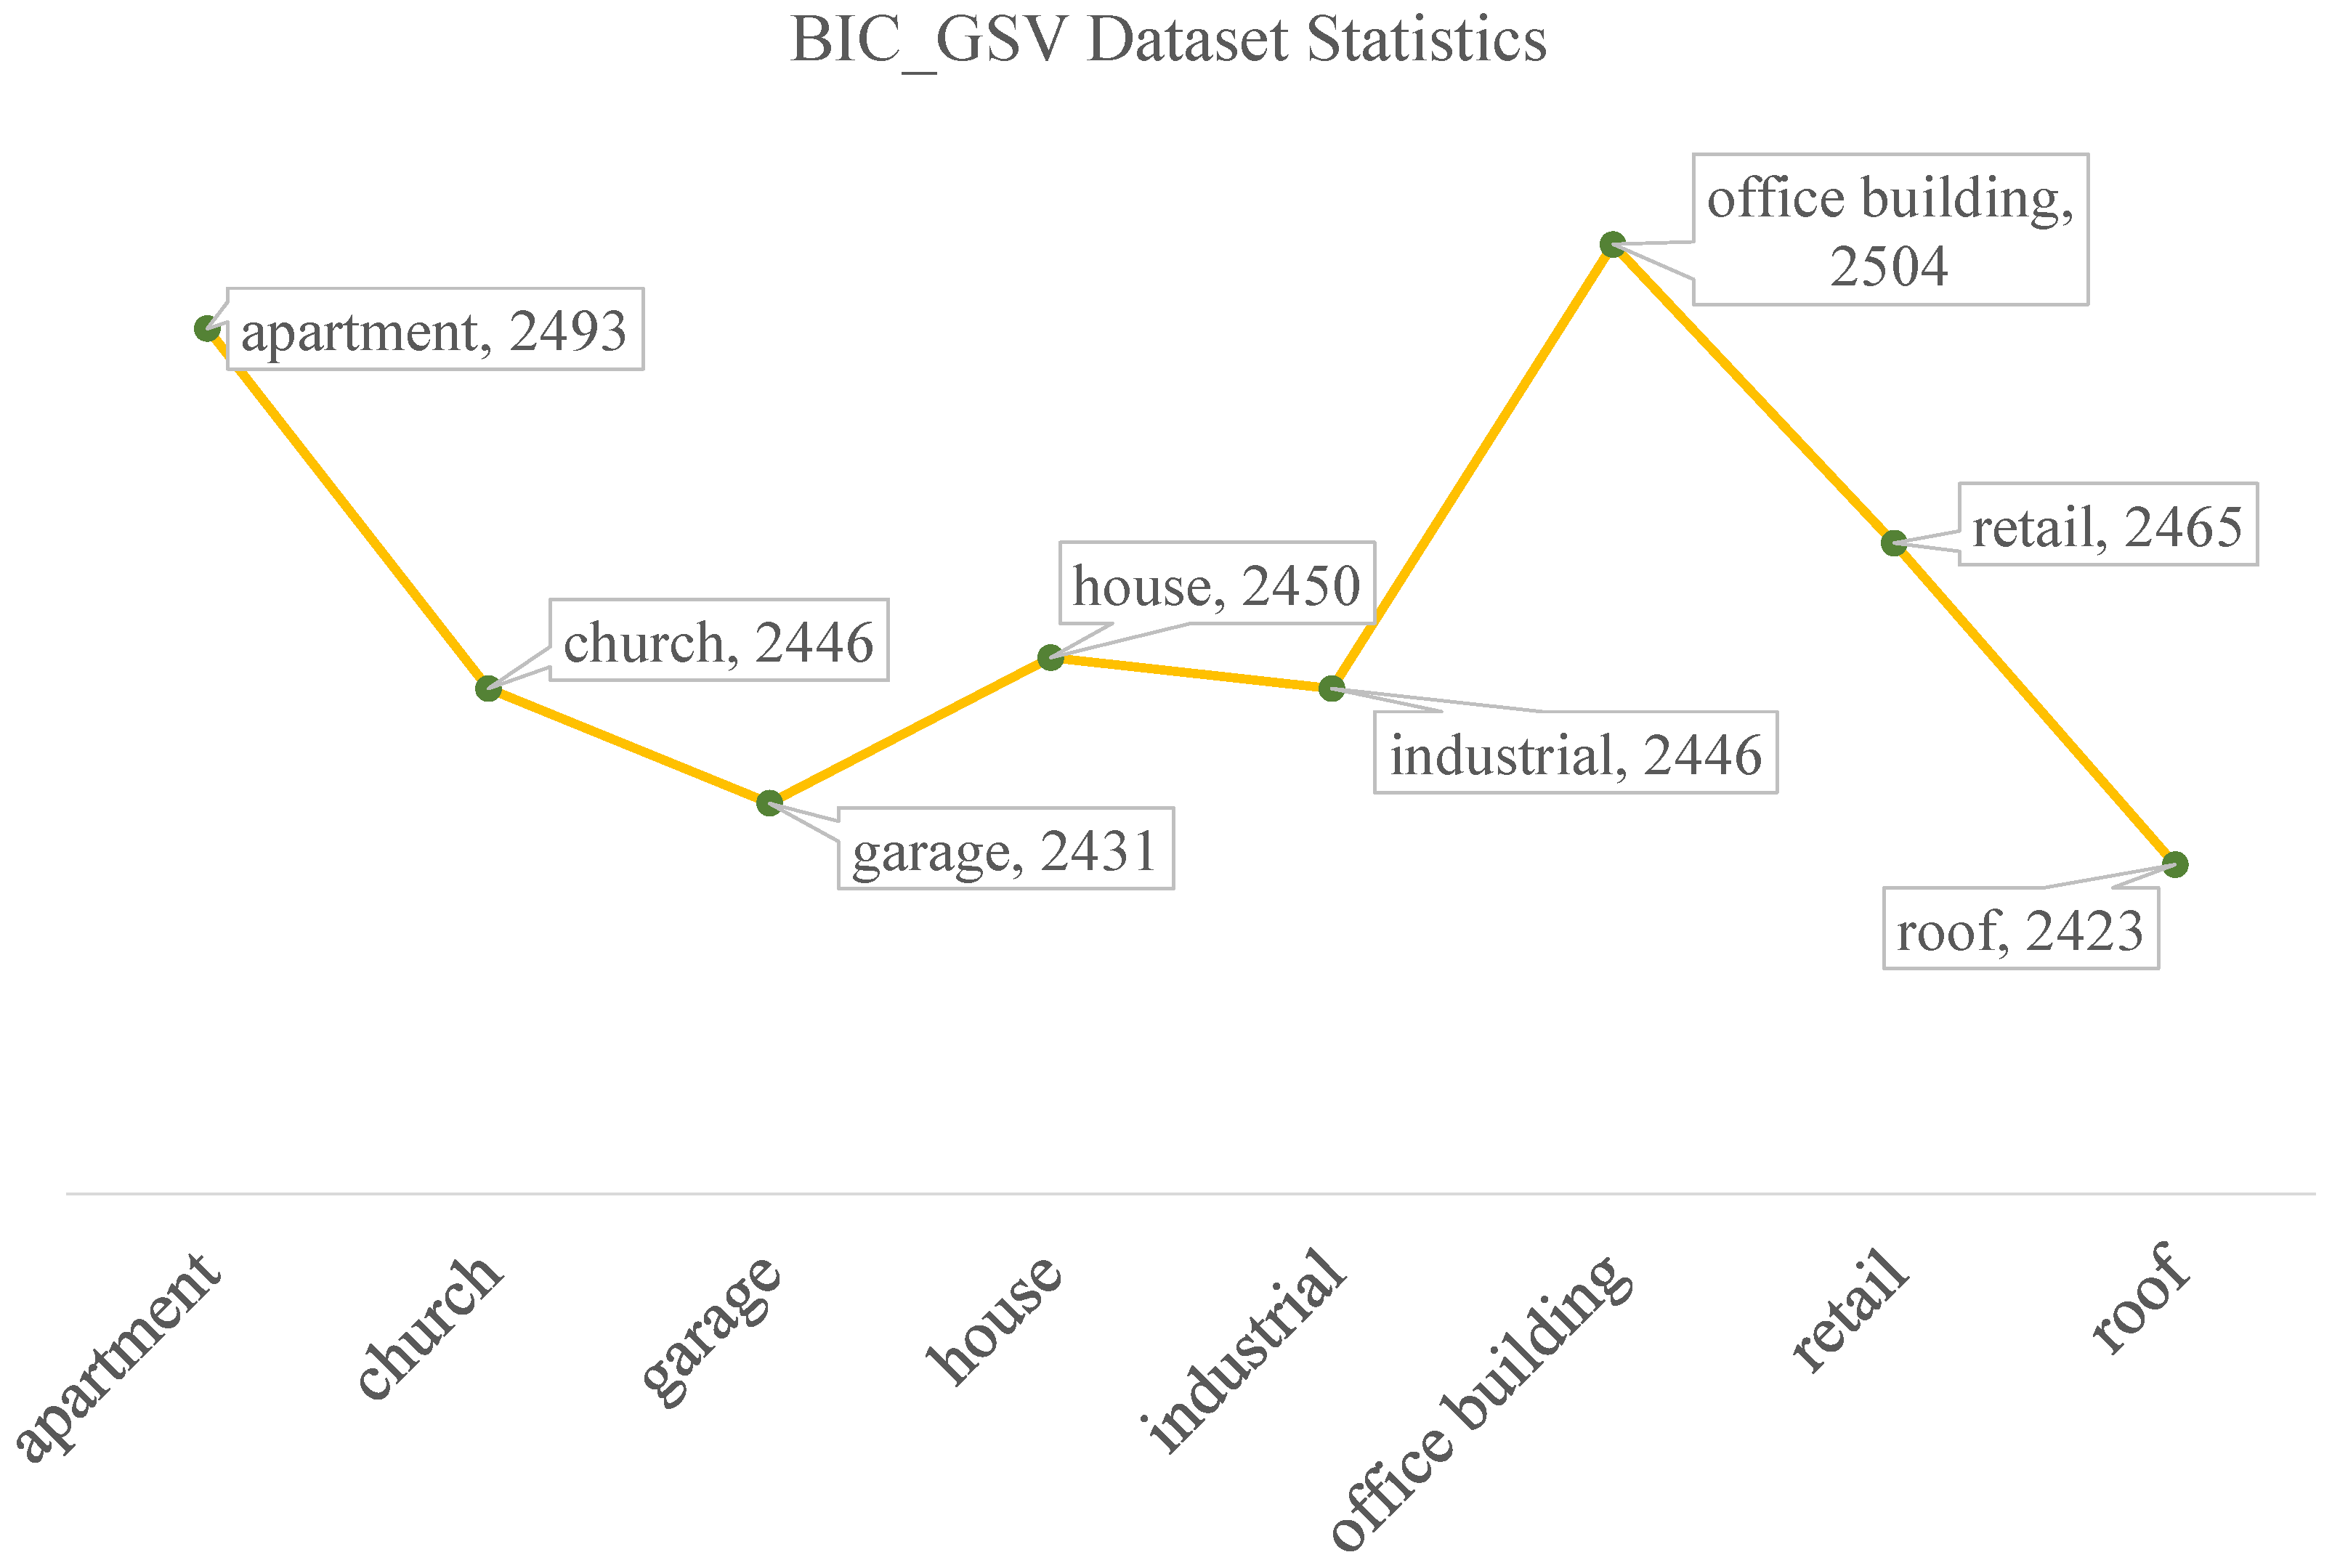
| BIC_GSV | 19,658 | 17,600 | - | 2058 |
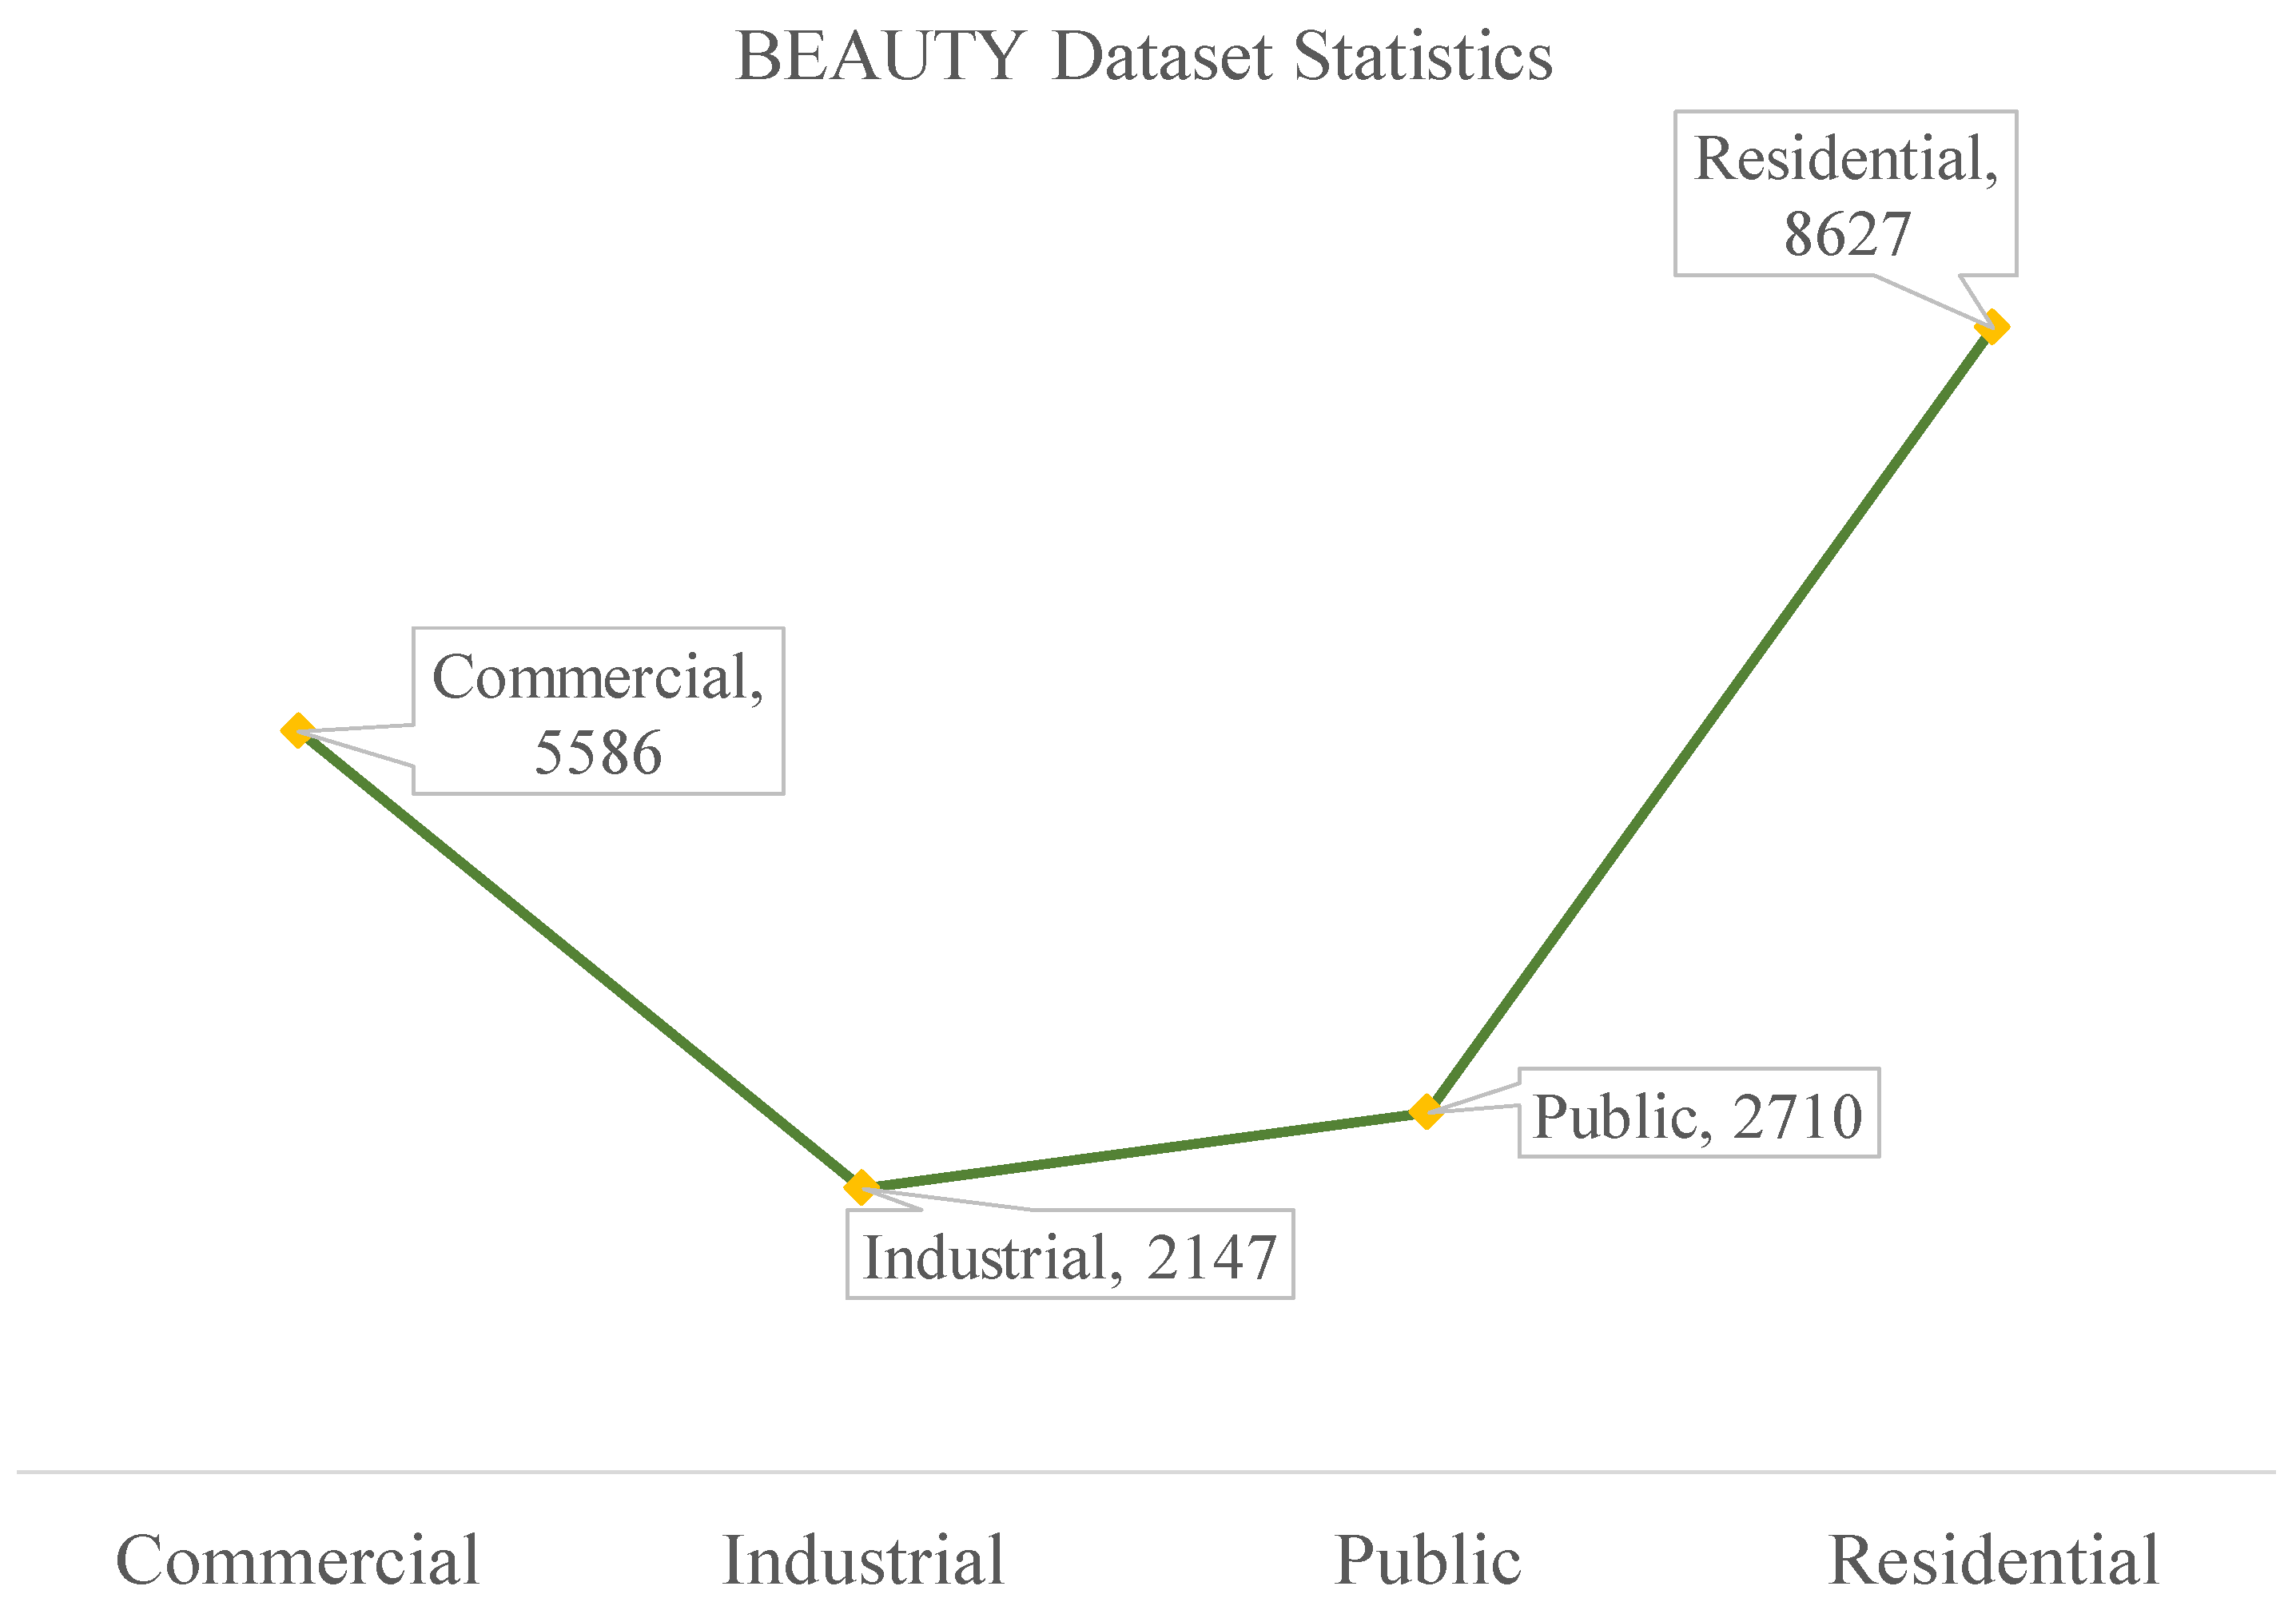
| BEAUTY | 19,070 | 12,871 | 1431 | 4768 |
| Pre-Training Method | Pre-Training Time (s) | BIC_GSV | BEAUTY | ||||||
|---|---|---|---|---|---|---|---|---|---|
| OA | Kappa | OA | Kappa | ||||||
| Linea | Fine-Tuning | Linear | Fine-Tuning | Linear | Fine-Tuning | Linear | Fine-Tuning | ||
| MoCo | 386,666 | 28.33% | 57.82% | 17.76% | 48.77% | 65.33% | 75.90% | 41.79% | 63.17% |
| SimCLR | 243,866 | 28.28% | 56.54% | 18.03% | 47.27% | 52.29% | 70.03% | 14.63% | 52.28% |
| BYOL | 236,460 | 26.82% | 59.85% | 15.28% | 52.19% | 57.99% | 77.89% | 26.59% | 66.57% |
| Barlow Twins | 557,177 | 48.20% | 59.14% | 40.88% | 51.70% | 68.04% | 81.78% | 48.81% | 72.88% |
| Tri-ReD (ours) | 247,731 | 49.63% | 60.92% | 42.05% | 53.41% | 68.90% | 82.55% | 49.26% | 73.86% |
| Pre-Training Method | Pre-Training Time (s) | BIC_GSV | BEAUTY | ||||||
|---|---|---|---|---|---|---|---|---|---|
| OA | Kappa | OA | Kappa | ||||||
| Linea | Fine-Tuning | Linear | Fine-Tuning | Linear | Fine-Tuning | Linear | Fine-Tuning | ||
| MoCo | 433,170 | 25.02% | 54.89% | 13.38% | 45.28% | 59.92% | 66.95% | 30.36% | 45.64% |
| SimCLR | 612,658 | 26.77% | 51.03% | 15.78% | 41.58% | 45.60% | 66.49% | 0.17% | 45.04% |
| BYOL | 811,727 | 23.81% | 53.12% | 13.74% | 43.07% | 49.92% | 66.21% | 9.41% | 44.40% |
| Barlow Twins | 688,922 | 52.43% | 62.19% | 45.62% | 54.43% | 78.19% | 82.71% | 66.66% | 74.81% |
| Tri-ReD (ours) | 779,775 | 54.03% | 63.84% | 47.46% | 56.22% | 79.03% | 83.62% | 68.00% | 75.96% |
| Pre-Training Method | Pre-Training Time (s) | BIC_GSV | BEAUTY | ||||||
|---|---|---|---|---|---|---|---|---|---|
| OA | Kappa | OA | Kappa | ||||||
| Linea | Fine-Tuning | Linear | Fine-Tuning | Linear | Fine-Tuning | Linear | Fine-Tuning | ||
| MoCo | 233,670 | 40.82% | 51.45% | 32.50% | 42.01% | 66.97% | 70.53% | 45.65% | 54.37% |
| SimCLR | 232,210 | 32.22% | 48.82% | 22.67% | 38.47% | 65.14% | 68.14% | 42.41% | 49.62% |
| BYOL | 500,143 | 29.79% | 56.77% | 19.88% | 48.15% | 63.68% | 77.92% | 39.92% | 66.48% |
| Barlow Twins | 284,428 | 44.66% | 59.25% | 36.81% | 50.94% | 72.47% | 80.00% | 58.74% | 70.01% |
| Tri-ReD (ours) | 242,268 | 46.02% | 60.44% | 38.38% | 51.99% | 73.30% | 80.72% | 59.83% | 70.87% |
| Num_Branches | BIC_GSV | BEAUTY | ||||||
|---|---|---|---|---|---|---|---|---|
| OA | Kappa | OA | Kappa | |||||
| Linear | Fine-Tuning | Linear | Fine-Tuning | Linear | Fine-Tuning | Linear | Fine-Tuning | |
| Bi-MExA | 45.68% | 59.25% | 38.65% | 51.47% | 67.85% | 81.69% | 48.01% | 72.82% |
| Tri-MExA | 49.63% | 60.92% | 42.05% | 53.41% | 68.90% | 82.55% | 49.26% | 73.86% |
| Augmentation | BIC_GSV | BEAUTY | |||||||||
|---|---|---|---|---|---|---|---|---|---|---|---|
| Basic Augmentation Resize and Crop |
Branch 1 Horizontal Flip |
Branch 2 Color Jitter |
Branch 3 Aug. | OA | Kappa | OA | Kappa | ||||
| Linear | Fine-Tuning | Linear | Fine-Tuning | Linear | Fine-Tuning | Linear | Fine-Tuning | ||||
| ✓ | ✓ | ✓ | - | 48.74% | 60.08% | 41.09% | 52.39% | 68.54% | 81.98% | 48.61% | 73.12% |
| ✓ | ✓ | ✓ | CutMix | 49.01% | 60.42% | 41.49% | 52.68% | 68.69% | 82.01% | 48.89% | 73.46% |
| ✓ | ✓ | ✓ | MixUp | 48.82% | 60.11% | 41.13% | 52.35% | 68.52% | 81.45% | 48.56% | 72.99% |
| ✓ | ✓ | ✓ | SVCO | 49.63% | 60.92% | 42.05% | 53.41% | 68.90% | 82.55% | 49.26% | 73.86% |
Disclaimer/Publisher’s Note: The statements, opinions and data contained in all publications are solely those of the individual author(s) and contributor(s) and not of MDPI and/or the editor(s). MDPI and/or the editor(s) disclaim responsibility for any injury to people or property resulting from any ideas, methods, instructions or products referred to in the content. |
© 2025 by the authors. Licensee MDPI, Basel, Switzerland. This article is an open access article distributed under the terms and conditions of the Creative Commons Attribution (CC BY) license (https://creativecommons.org/licenses/by/4.0/).
Share and Cite
Zhao, K.; Li, J.; Xie, S.; Zhou, L.; He, W.; Chen, X. Self-Supervised Learning with Trilateral Redundancy Reduction for Urban Functional Zone Identification Using Street-View Imagery. Sensors 2025, 25, 1504. https://doi.org/10.3390/s25051504
Zhao K, Li J, Xie S, Zhou L, He W, Chen X. Self-Supervised Learning with Trilateral Redundancy Reduction for Urban Functional Zone Identification Using Street-View Imagery. Sensors. 2025; 25(5):1504. https://doi.org/10.3390/s25051504
Chicago/Turabian StyleZhao, Kun, Juan Li, Shuai Xie, Lijian Zhou, Wenbin He, and Xiaolin Chen. 2025. "Self-Supervised Learning with Trilateral Redundancy Reduction for Urban Functional Zone Identification Using Street-View Imagery" Sensors 25, no. 5: 1504. https://doi.org/10.3390/s25051504
APA StyleZhao, K., Li, J., Xie, S., Zhou, L., He, W., & Chen, X. (2025). Self-Supervised Learning with Trilateral Redundancy Reduction for Urban Functional Zone Identification Using Street-View Imagery. Sensors, 25(5), 1504. https://doi.org/10.3390/s25051504