
U-Net-Based Fingerprint Enhancement for 3D Fingerprint Recognition


Abstract
1. Introduction
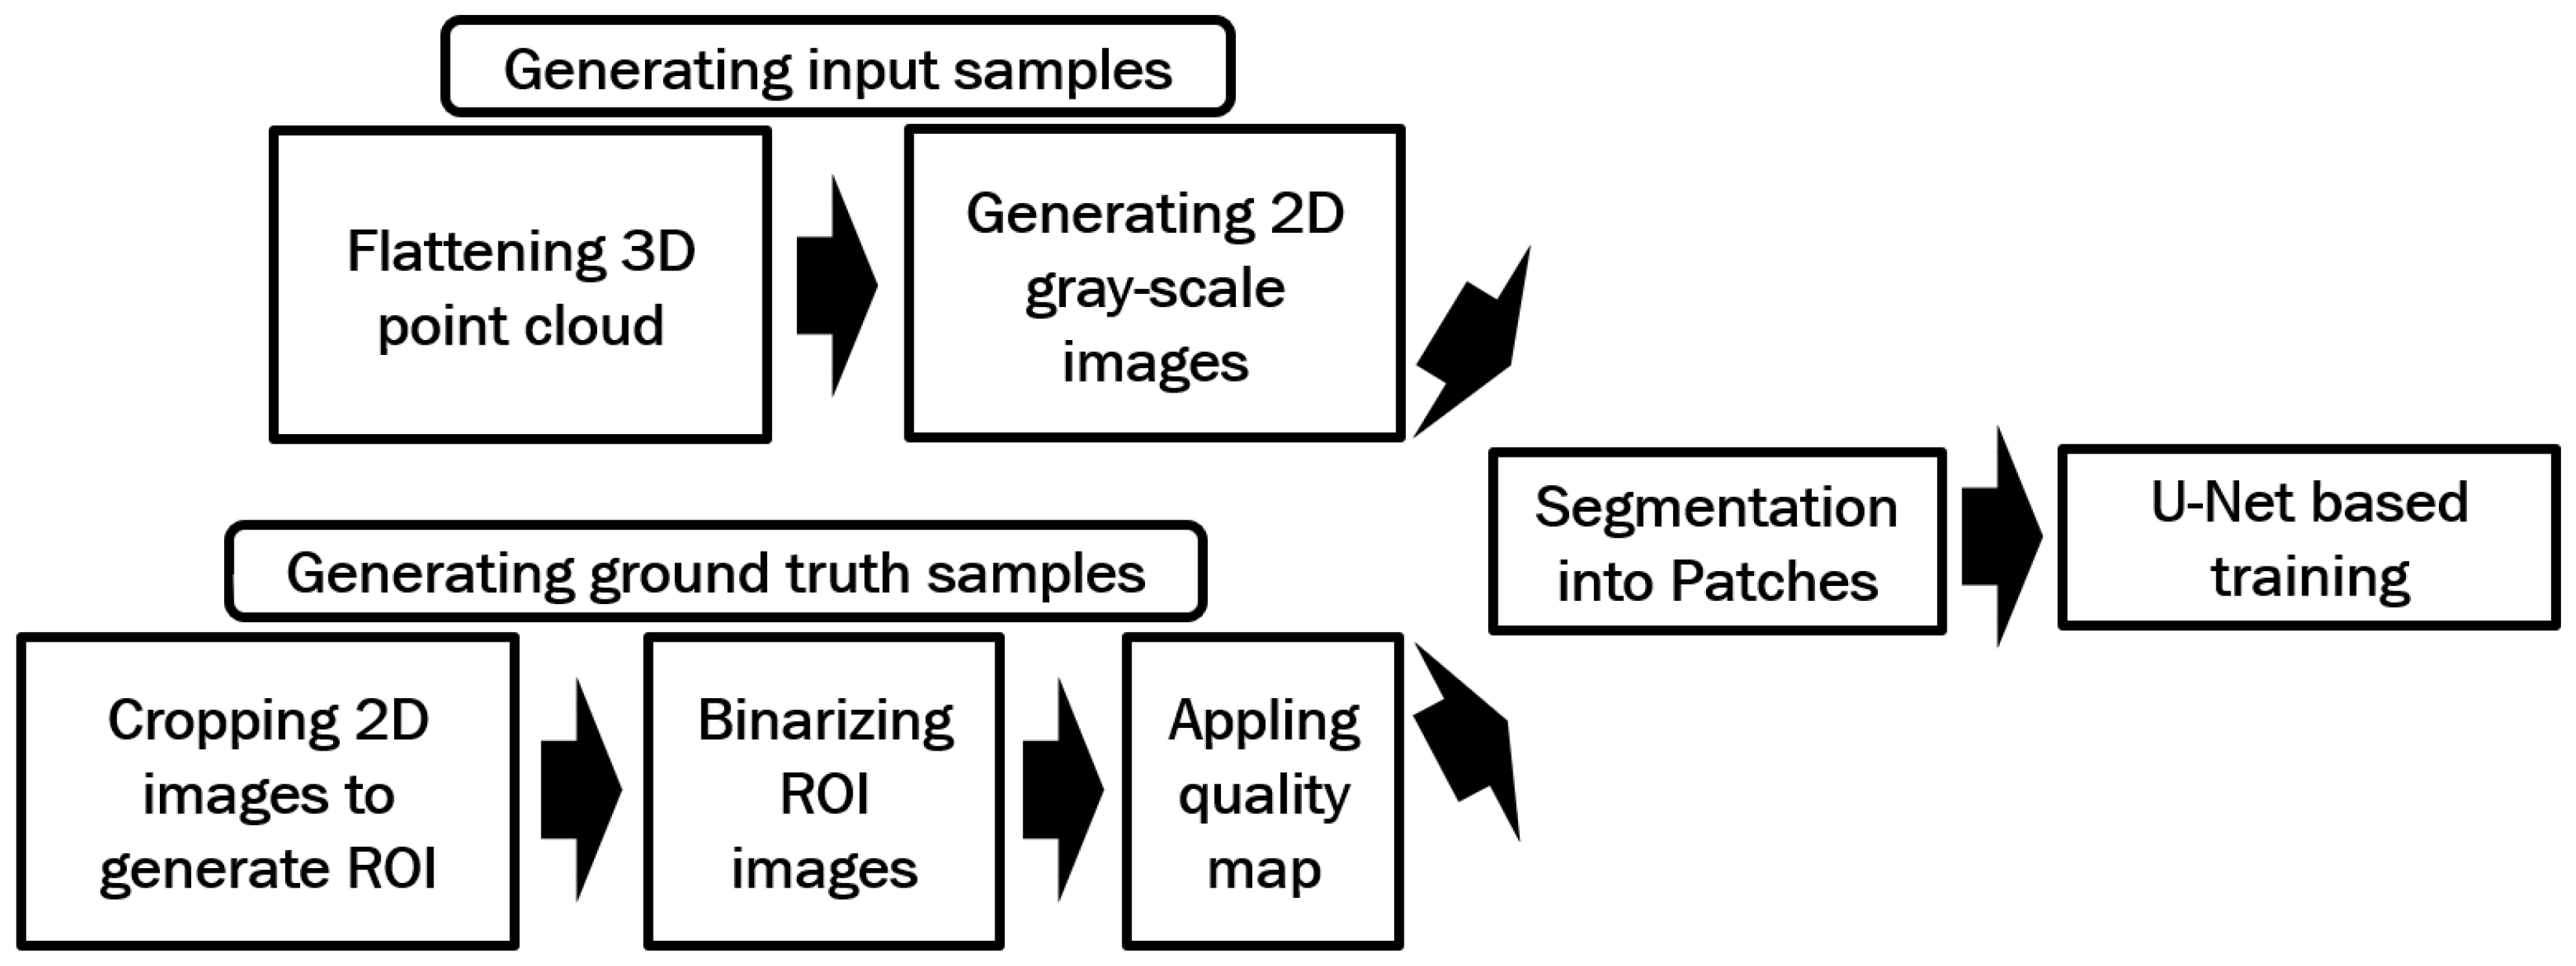
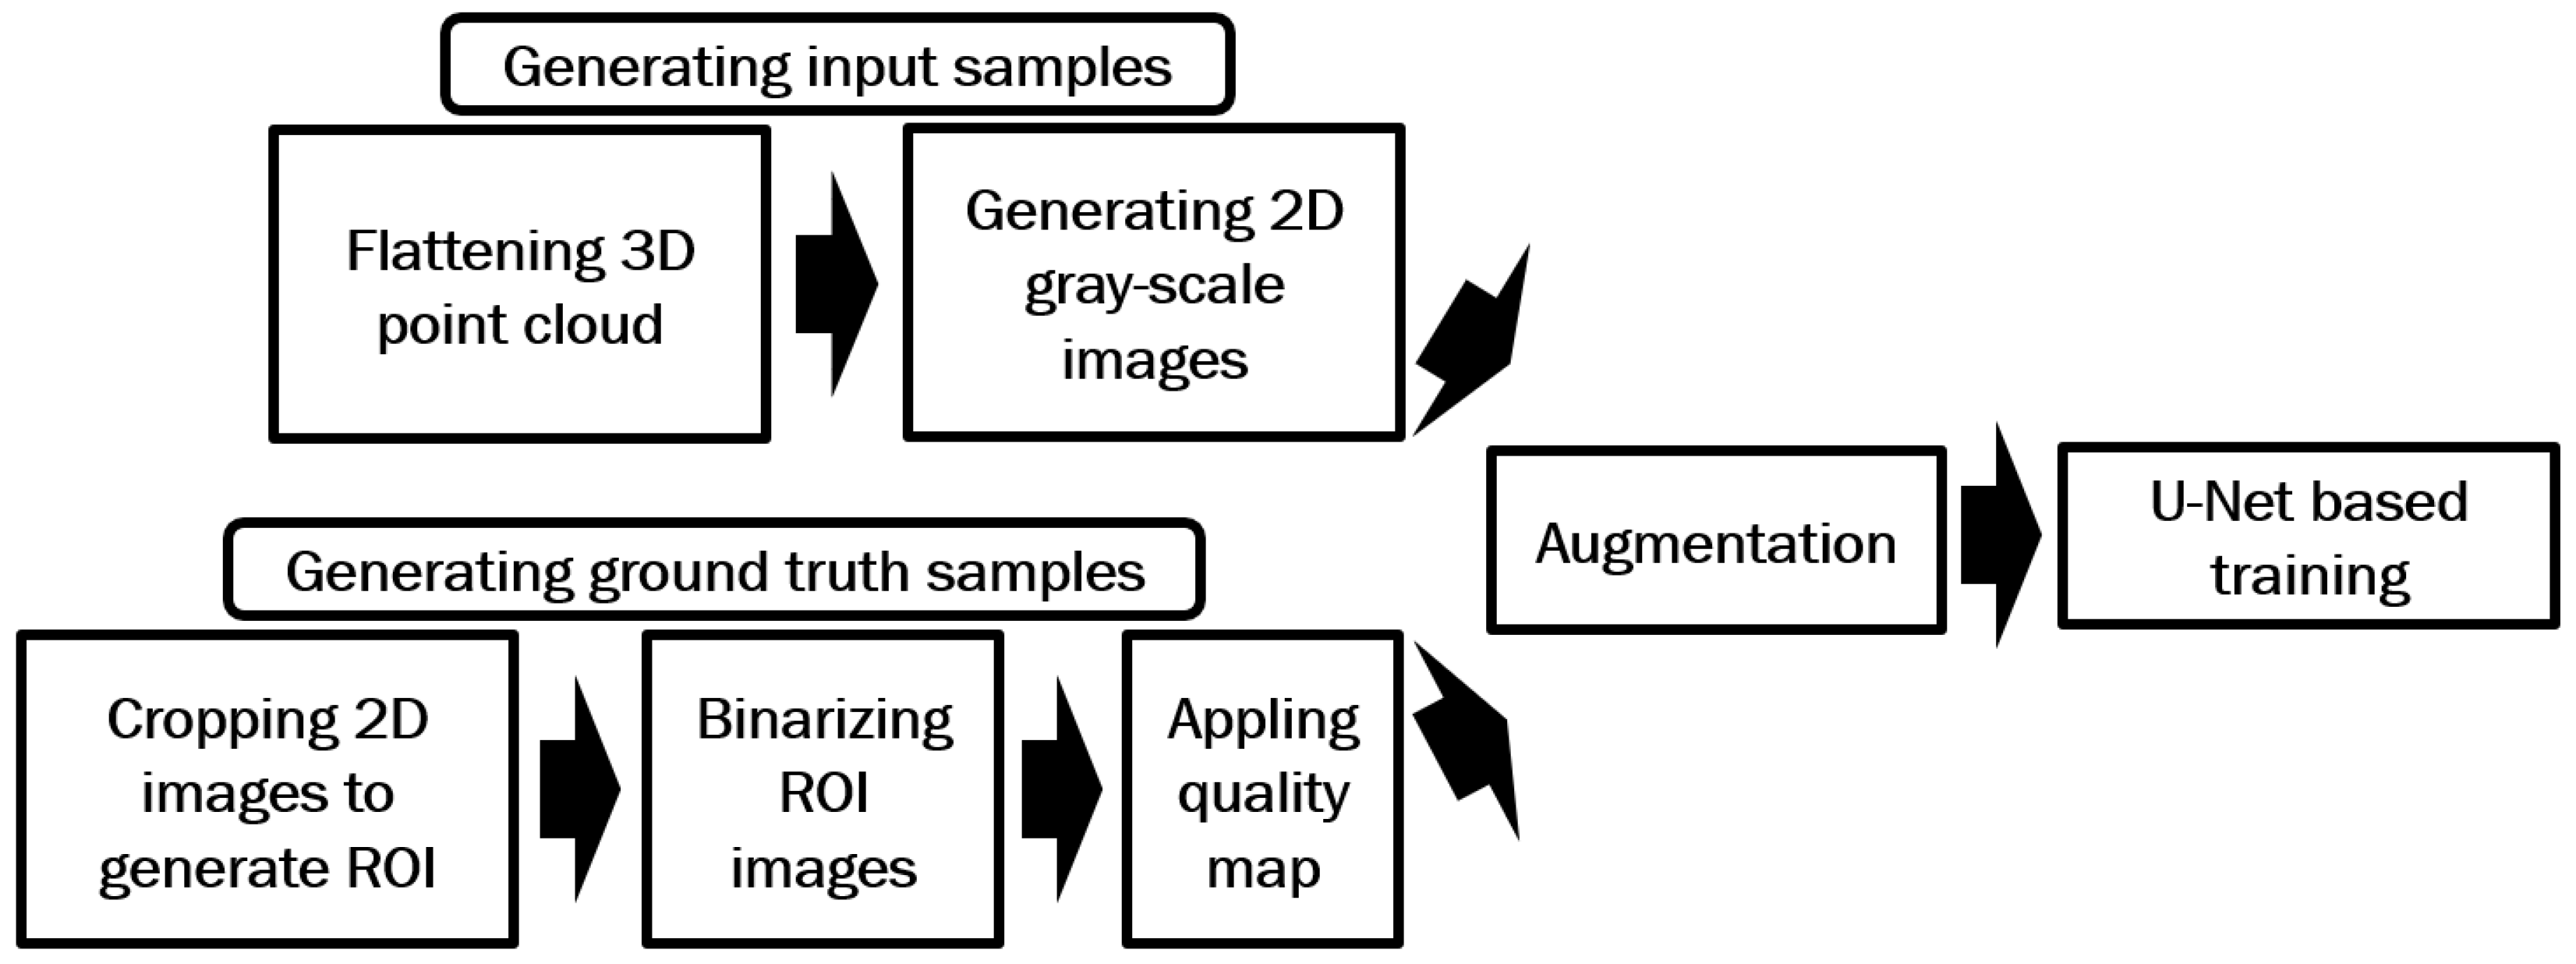
2. Methodology
| Algorithm 1: Processes used to enhance contrast of the generated gray-scale fingerprint image |
Data: 3D point cloud Result: Enhanced gray-scale fingerprint image
|
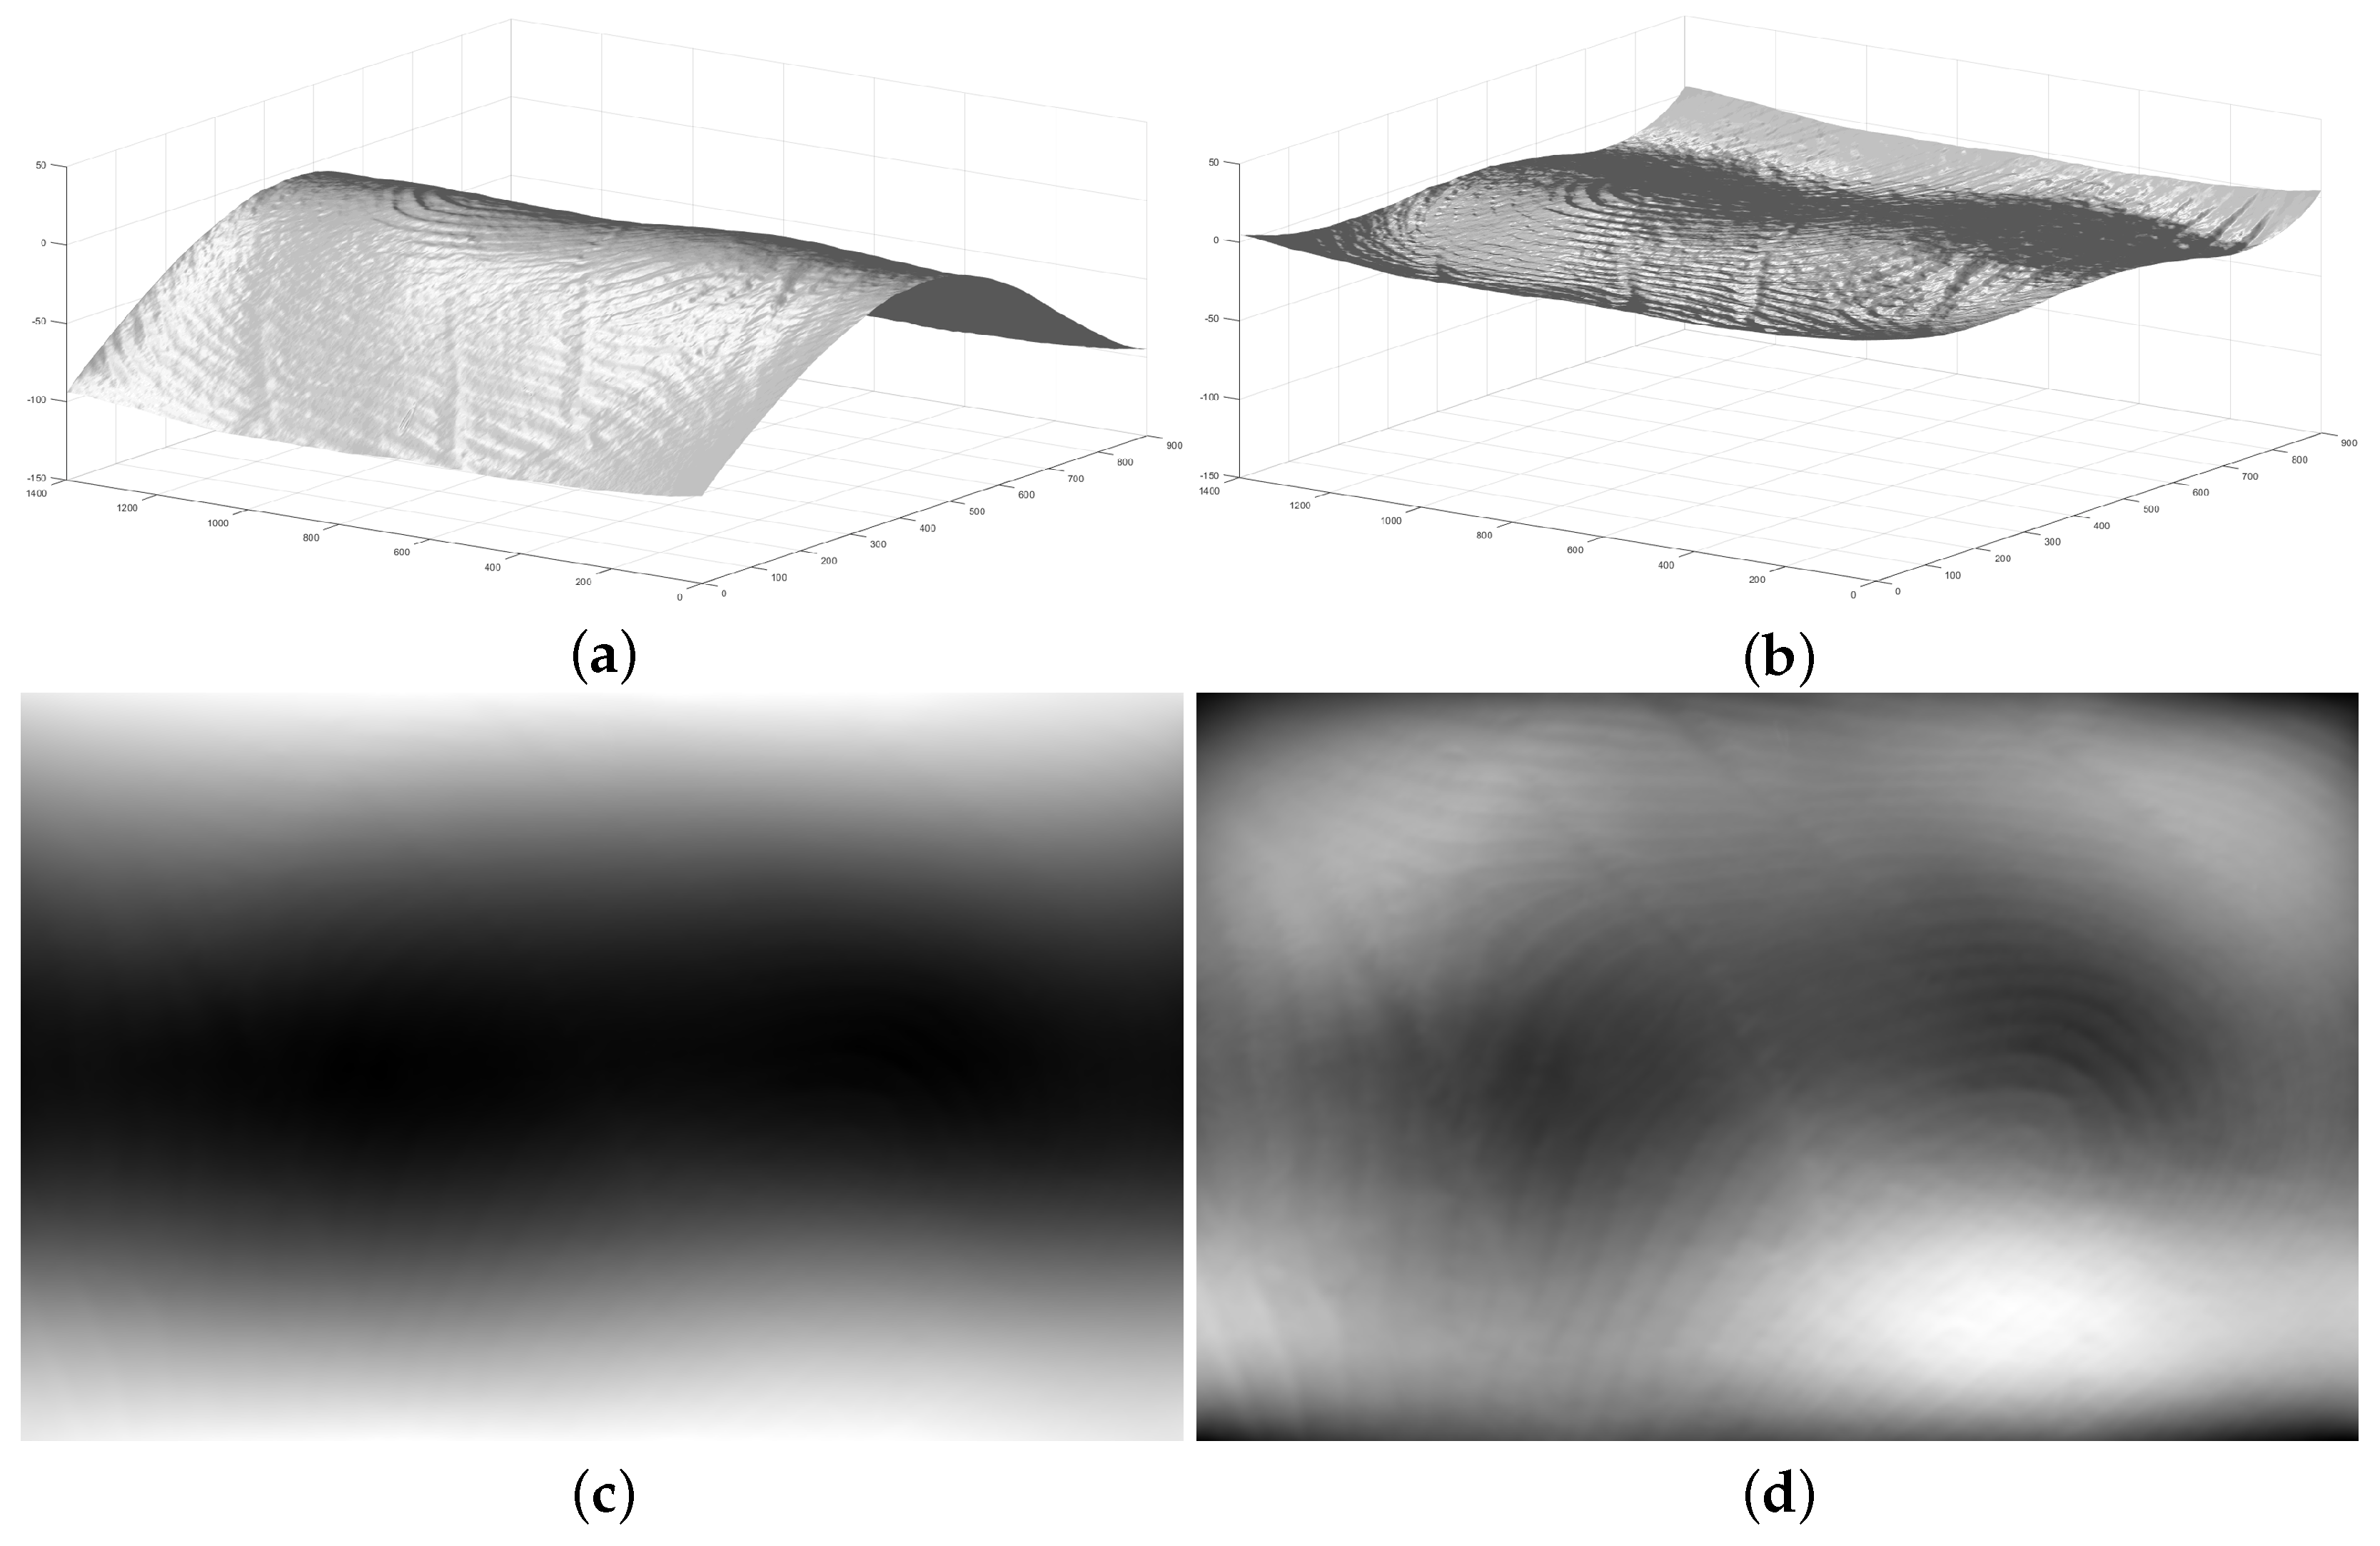
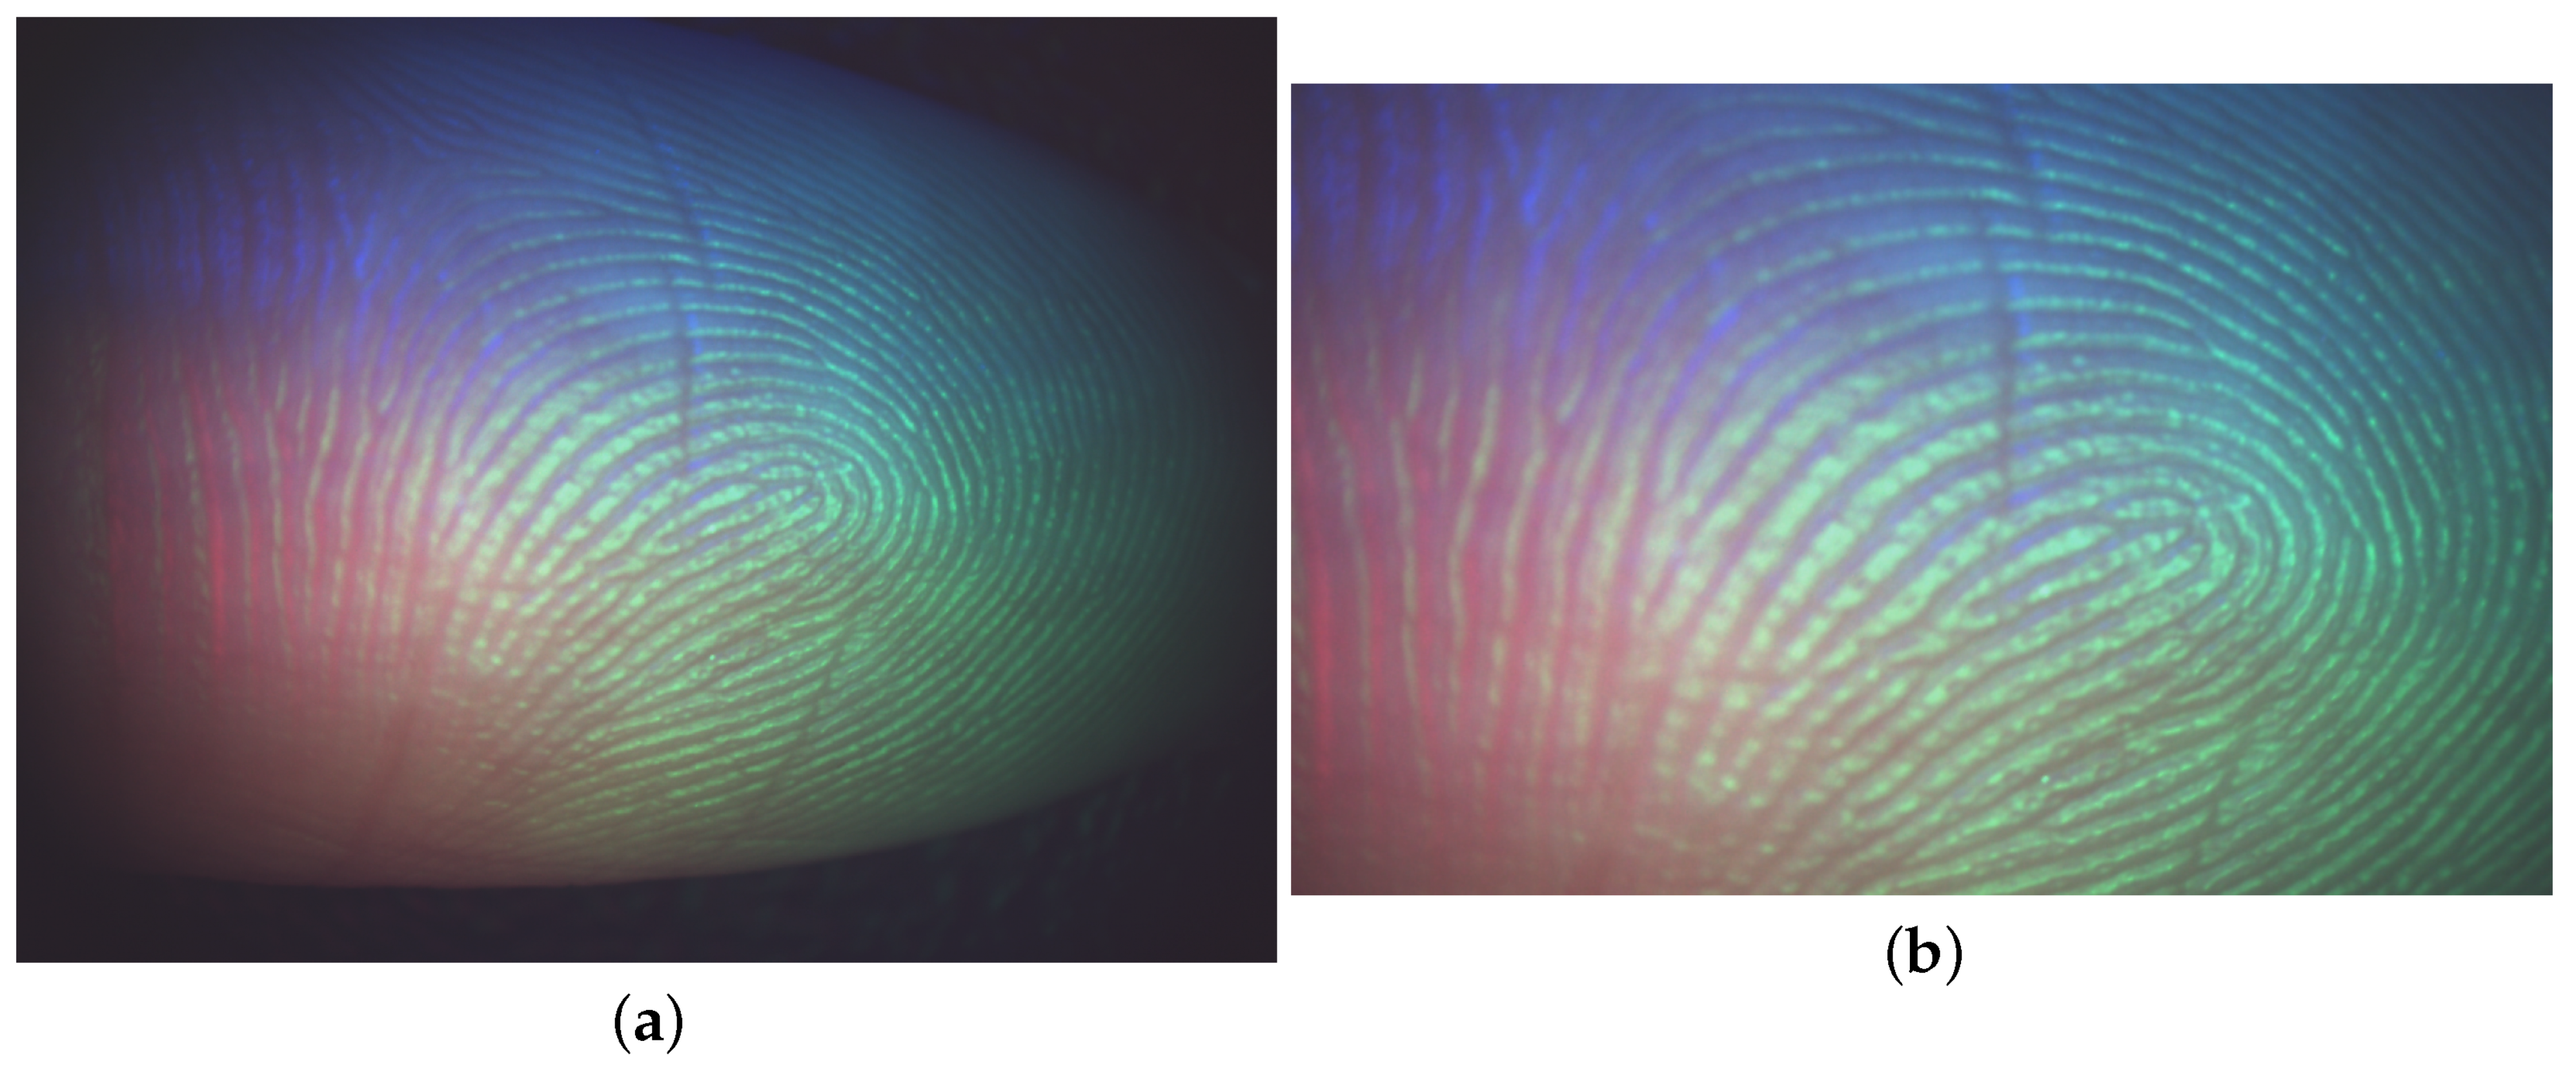
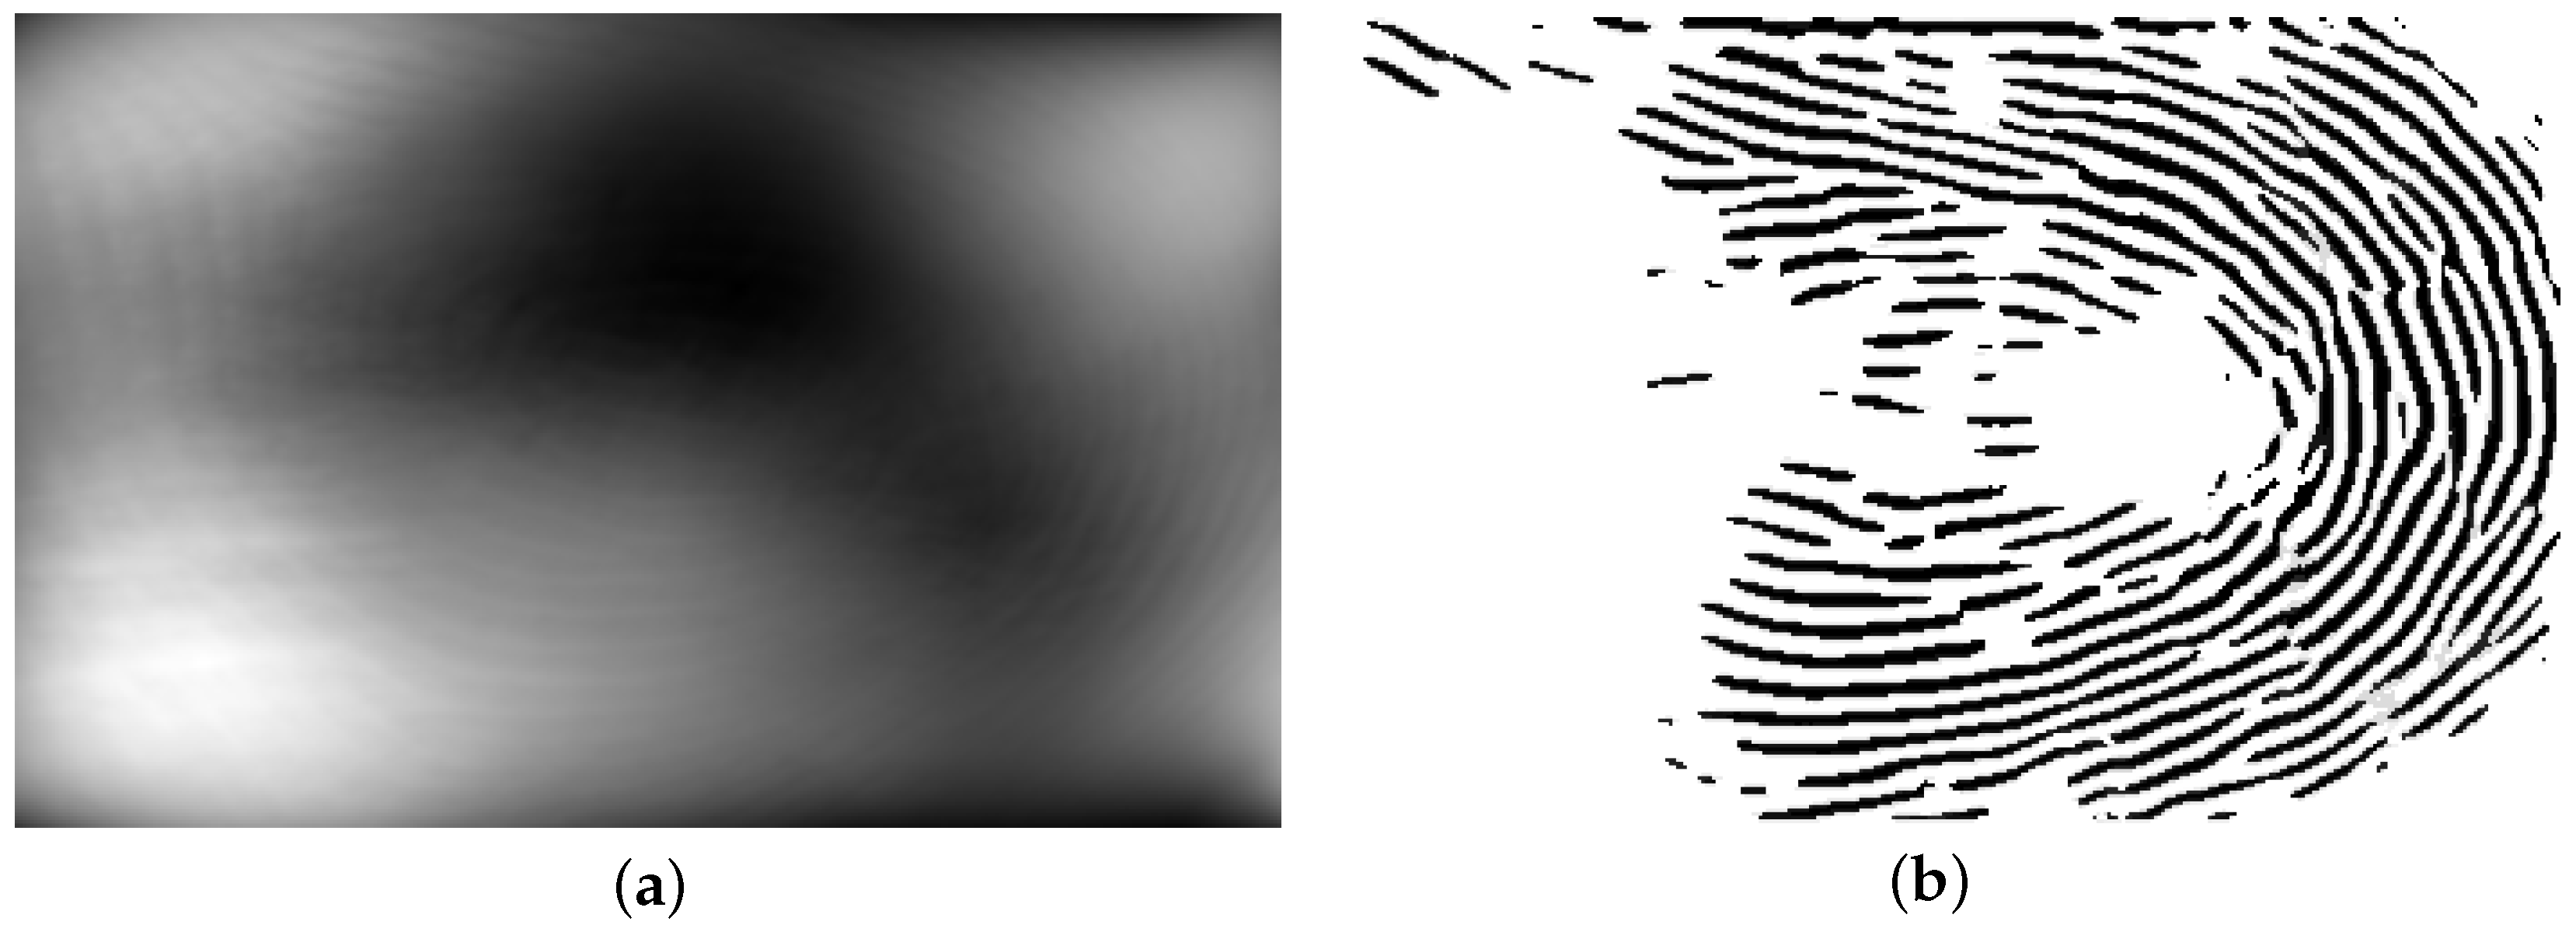
2.1. Flattening 3D Fingerprint and Generating Gray-Scale Image
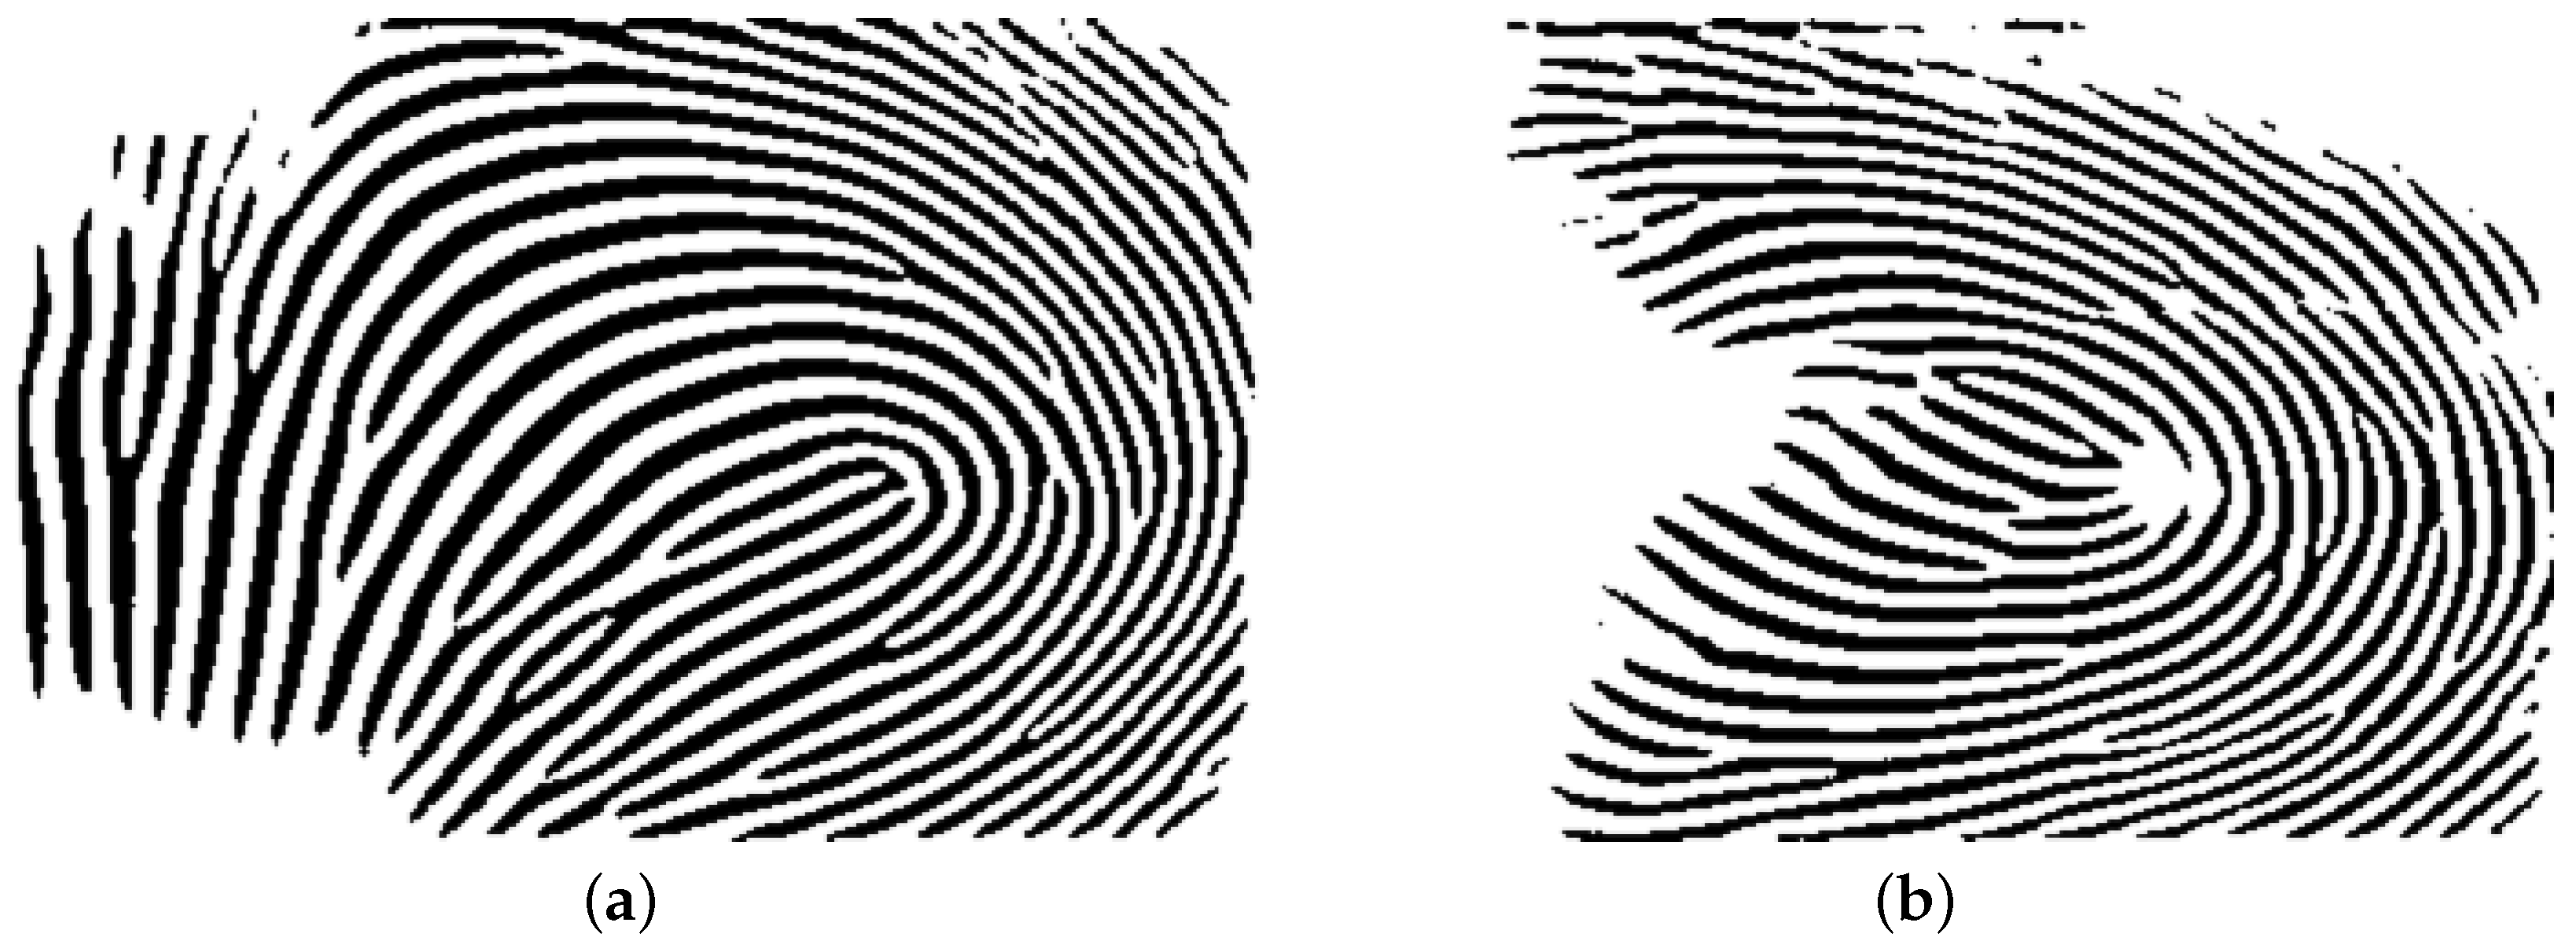
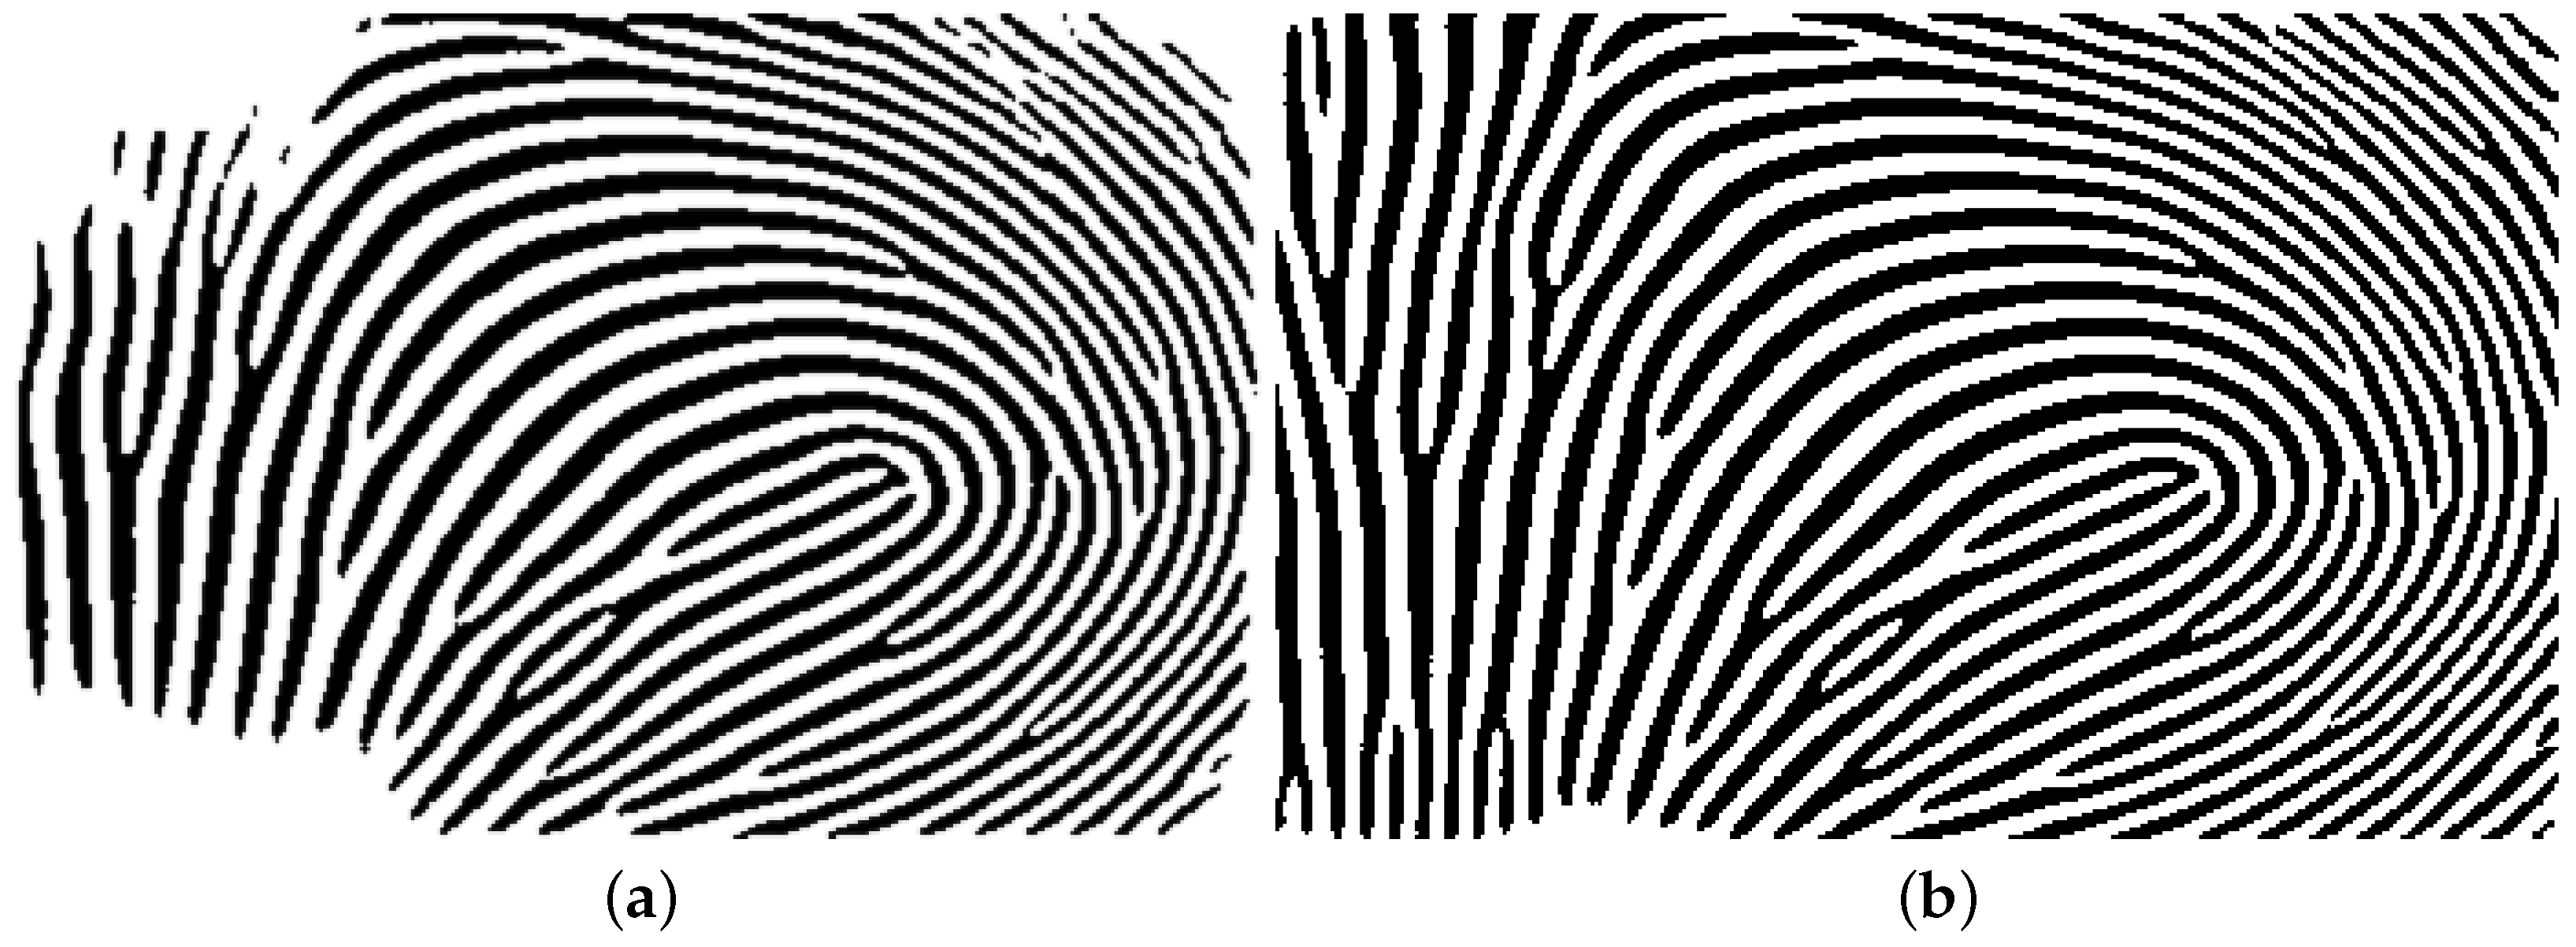
2.2. Fingerprint Enhancement by U-Net
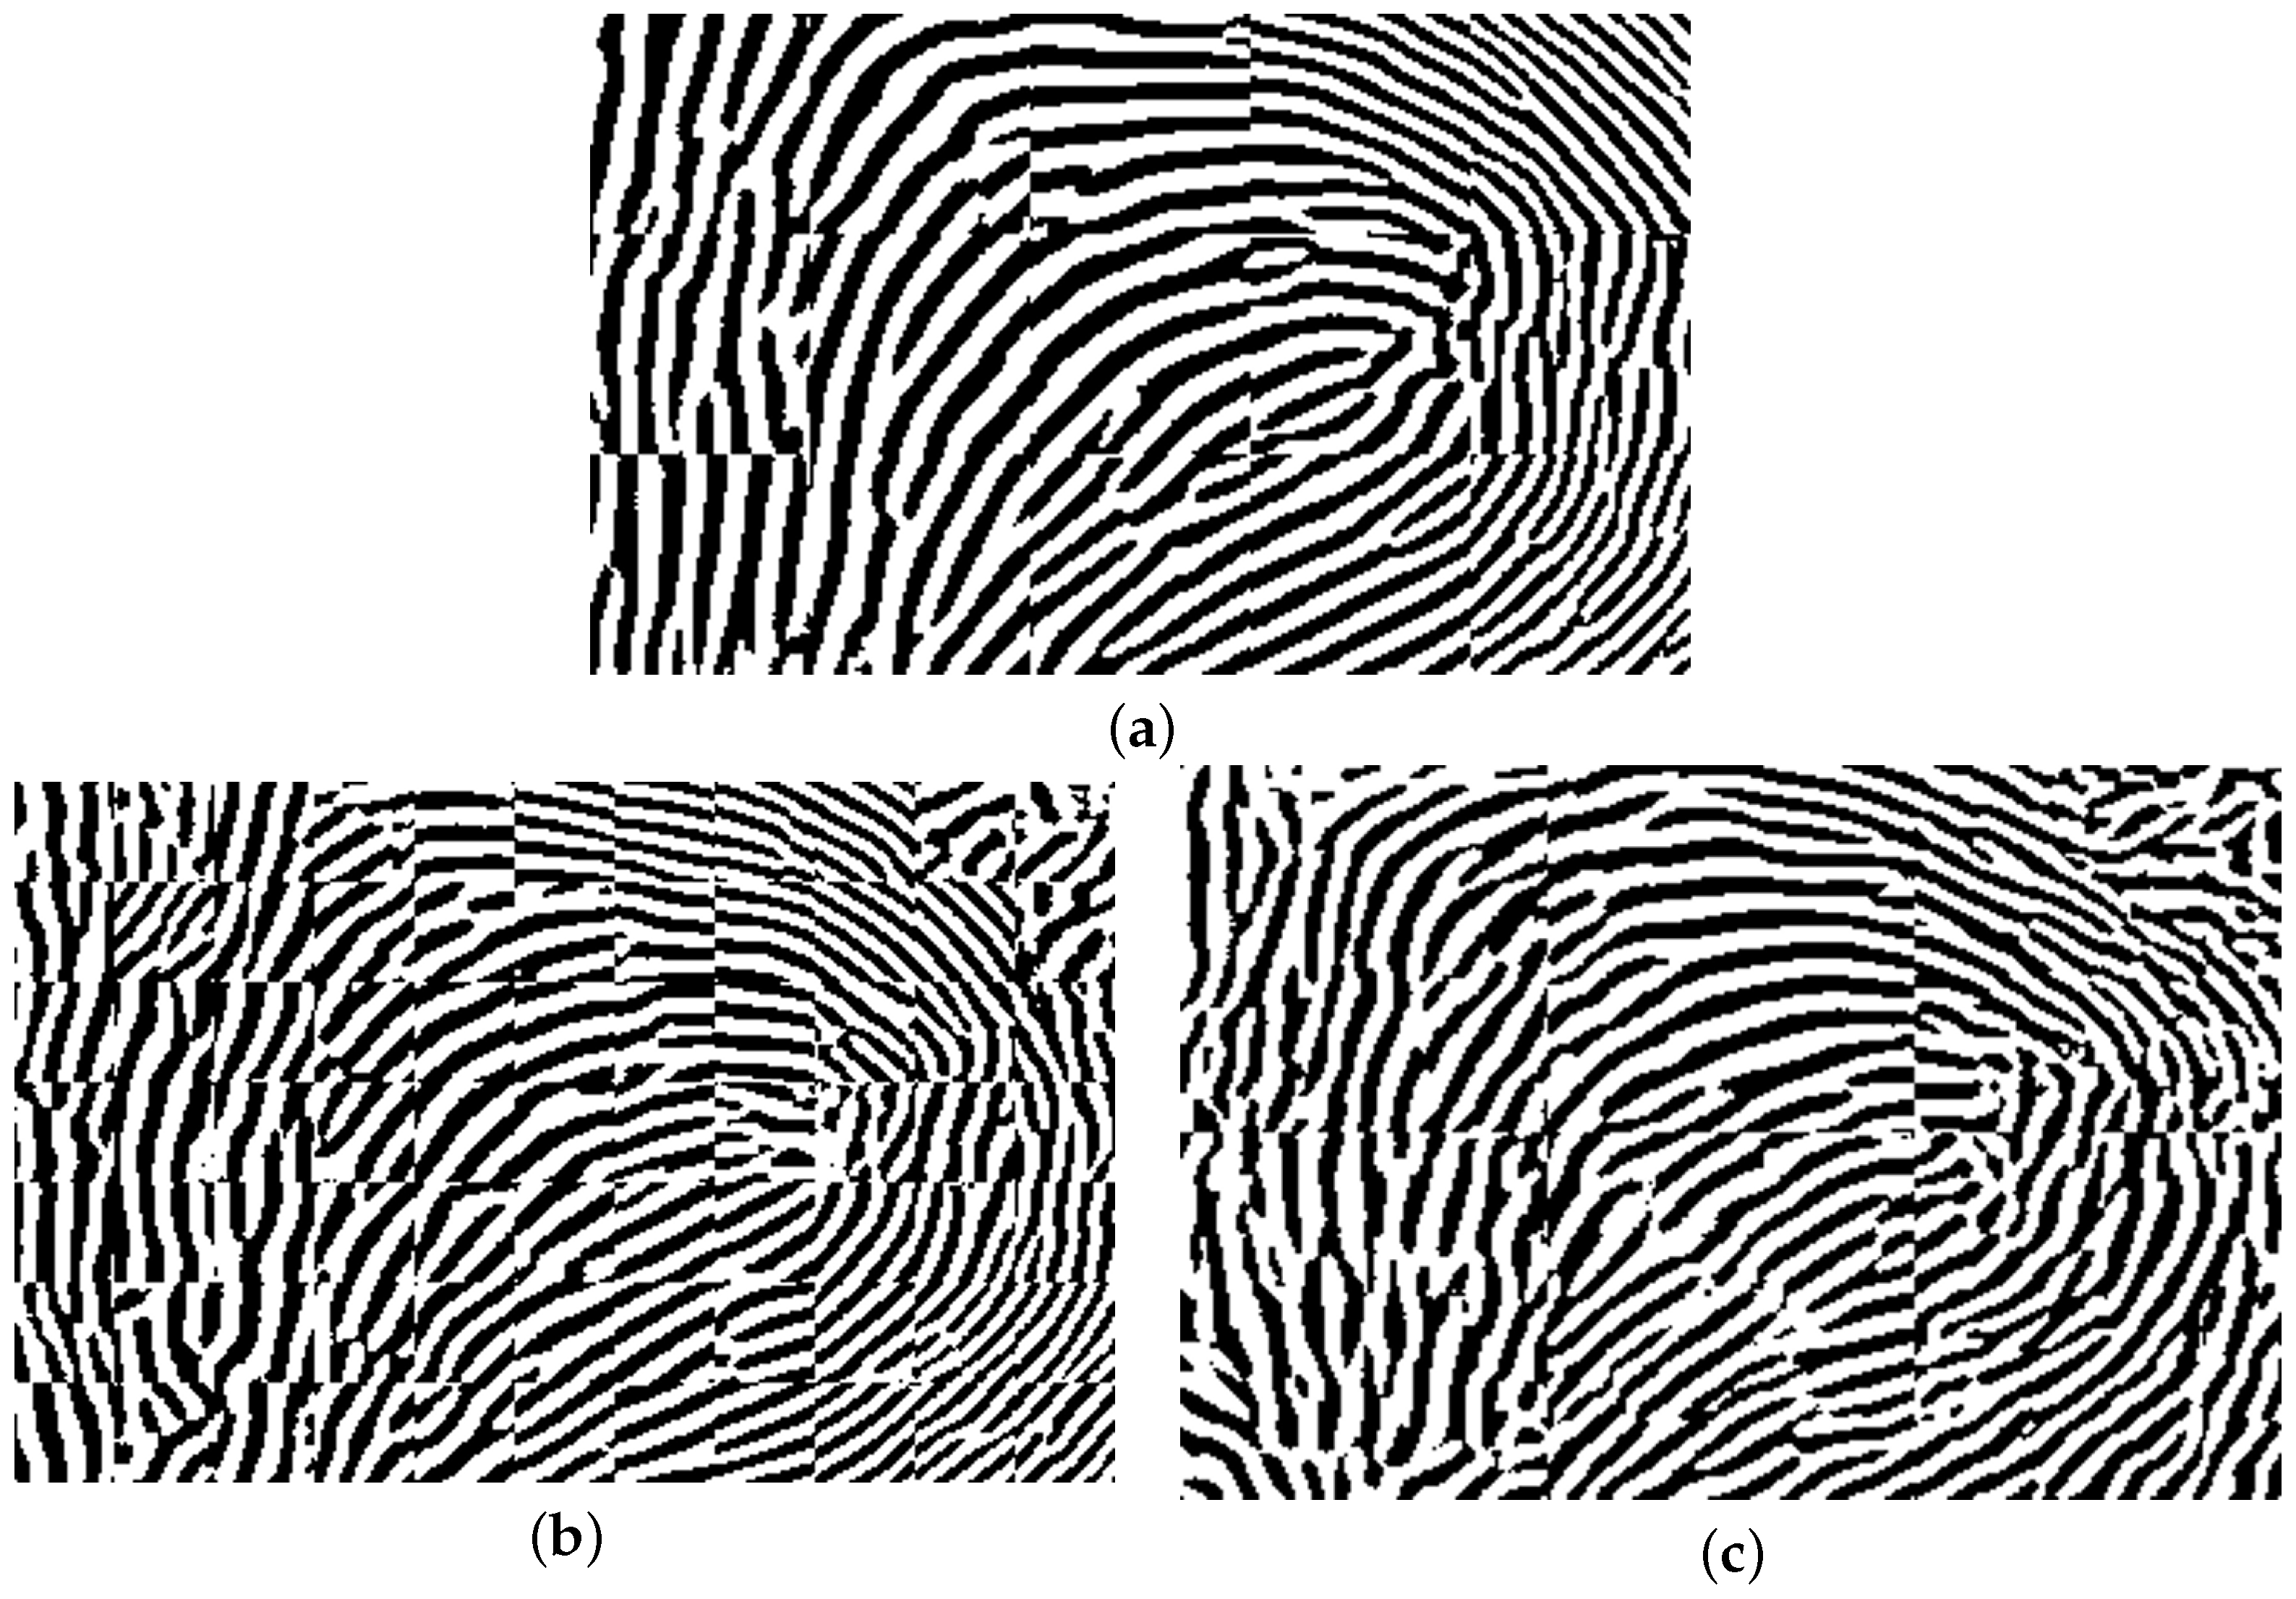
2.2.1. U-Net-Based Full Image Fingerprint Enhancement
2.2.2. Patch-Based Fingerprint Enhancement Using a U-Net Model
- The entire ROI image is initially binarized using VeriFinger.
- Each individual color channel (e.g., red, green, and blue) of the ROI image is separately binarized using VeriFinger.
- By using Matlab, the four binarized outputs (one for the full image and three for the color channels) are merged.
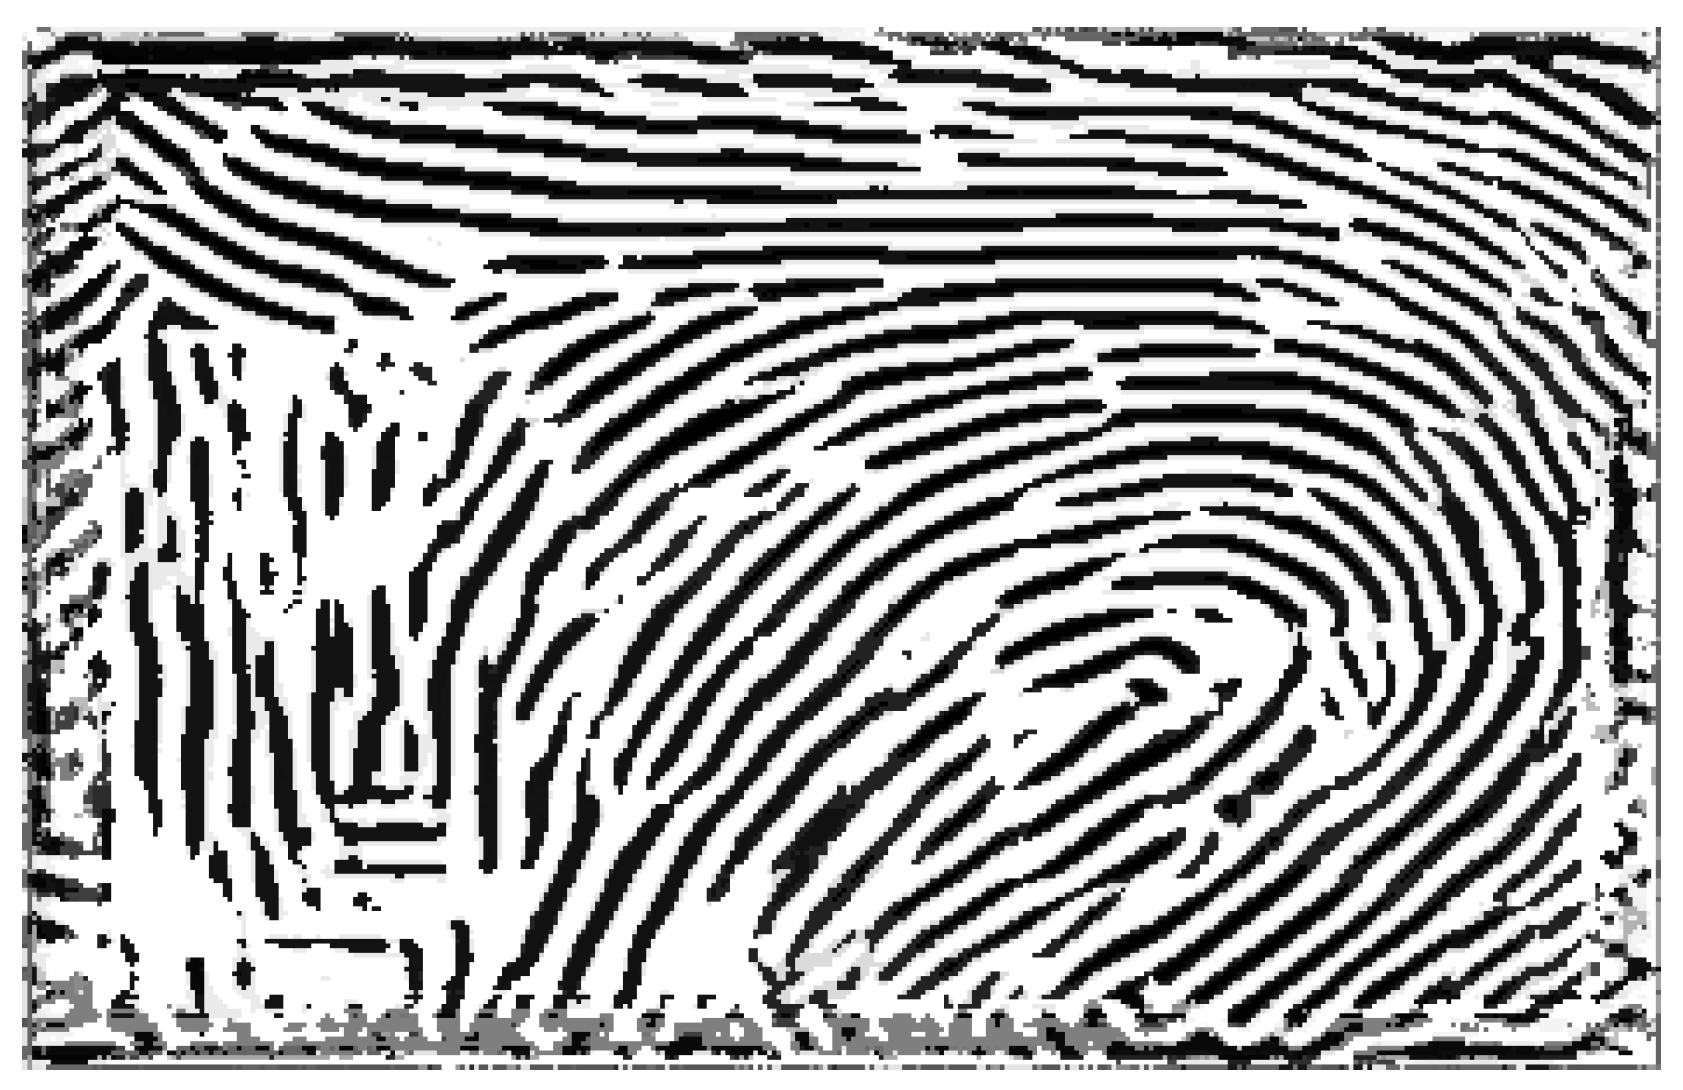
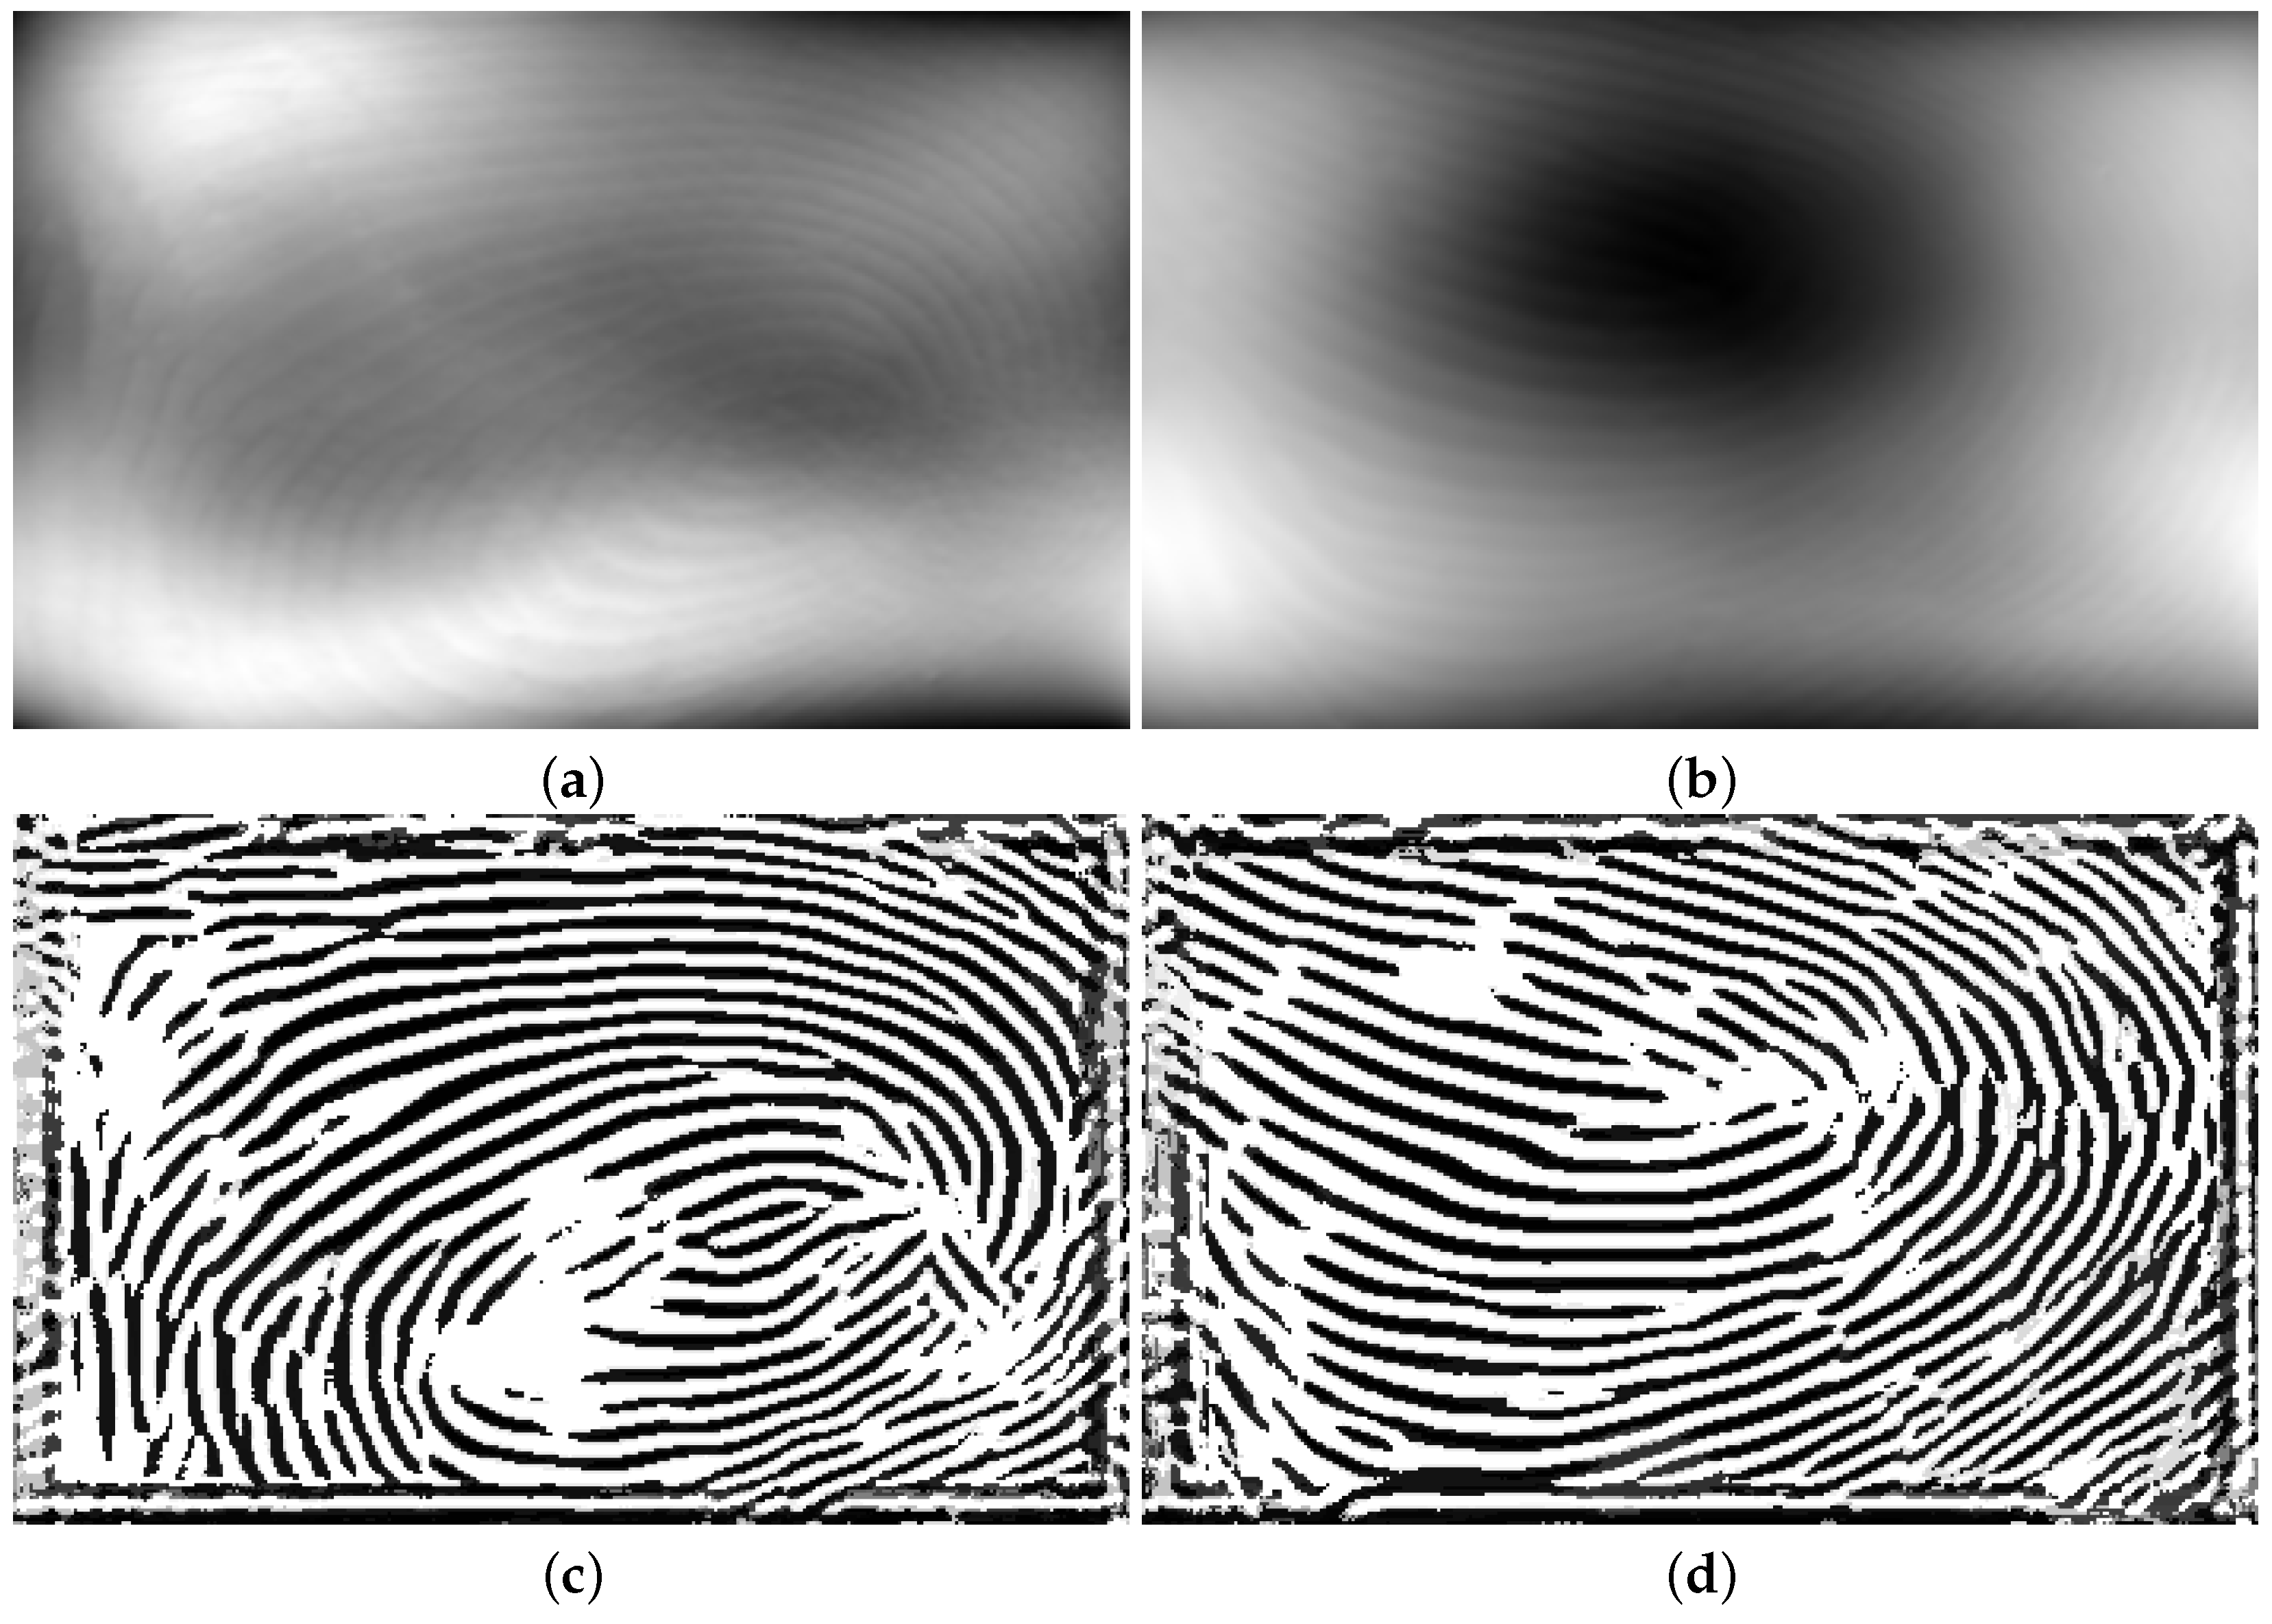
2.2.3. U-Net-Based Full Image Fingerprint Enhancement by Using Quality Map
3. Experimental Result
3.1. Dataset
3.2. Tools
3.3. Setup
3.4. Experiment A
3.5. Experiment B
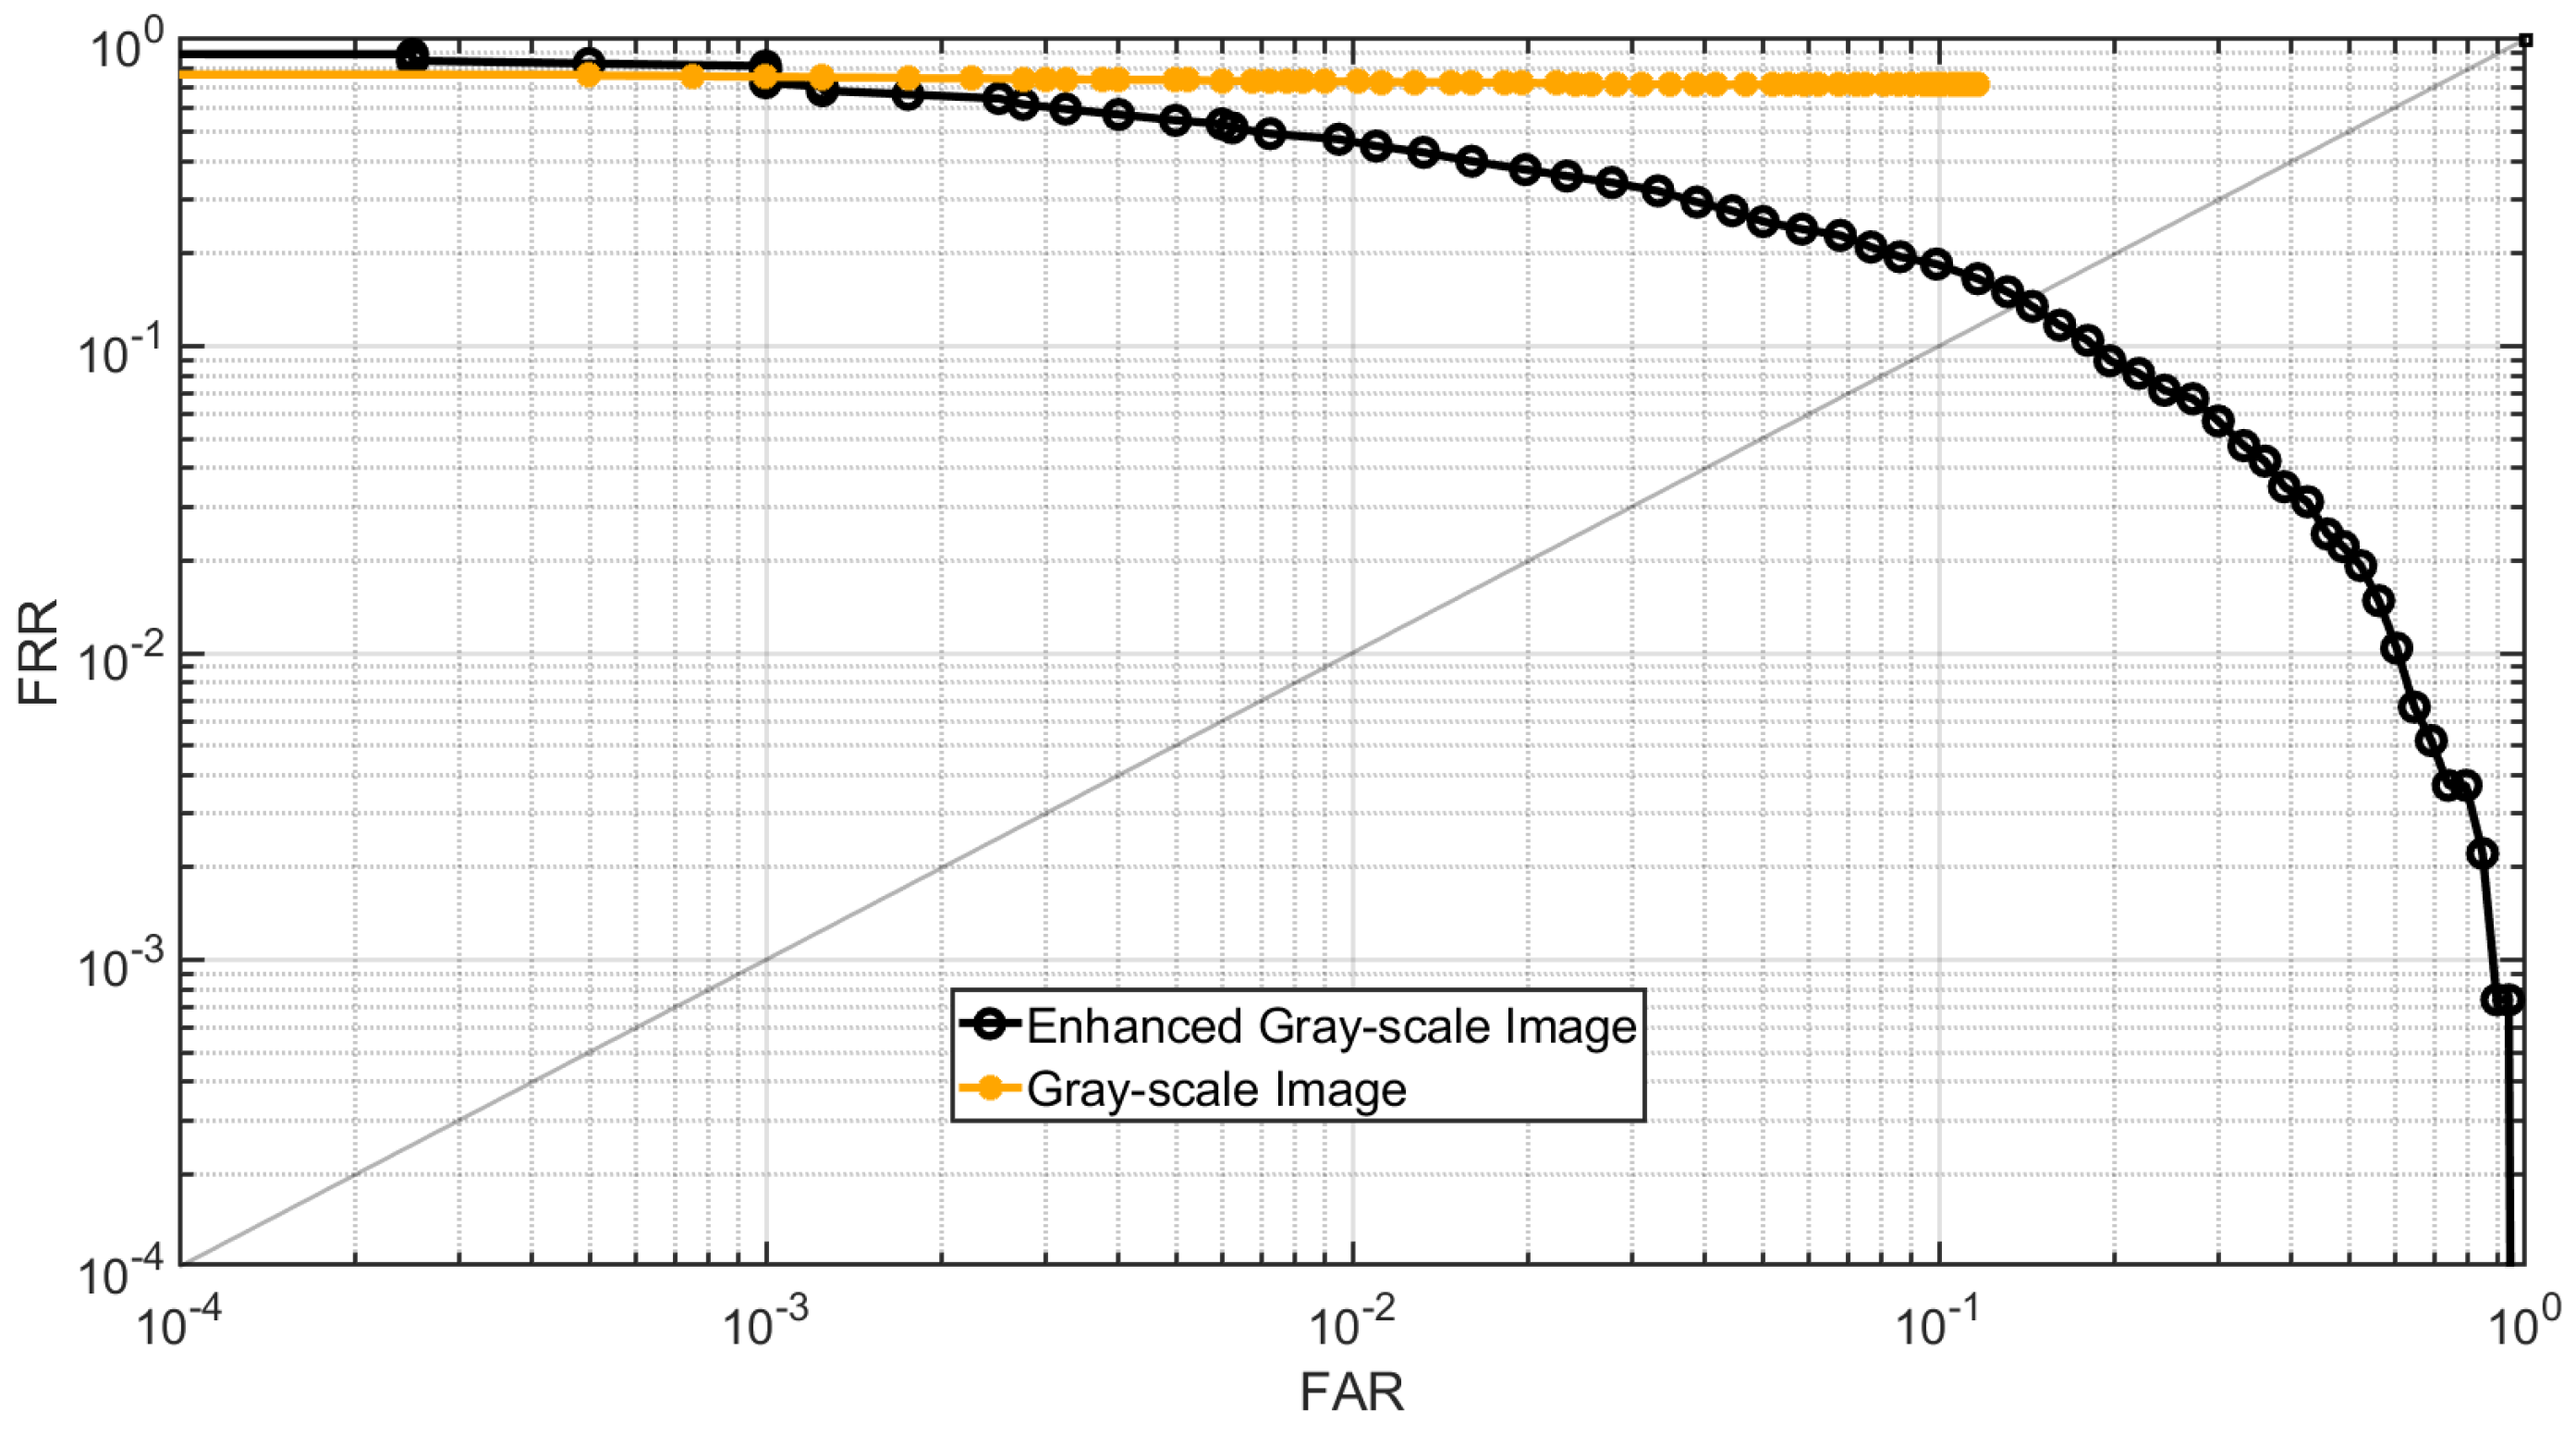
3.6. Evaluation
4. Conclusions
- Full image enhancement;
- Patch-based enhancement;
- Filtered full-size image enhancement.
Author Contributions
Funding
Institutional Review Board Statement
Informed Consent Statement
Data Availability Statement
Conflicts of Interest
References
- Jain, A.K.; Ross, A.; Prabhakar, S. An introduction to biometric recognition. IEEE Trans. Circuits Syst. Video Technol. 2004, 14, 4–20. [Google Scholar] [CrossRef]
- Galbally, J.; Marcel, S.; Fierrez, J. Image quality assessment for fake biometric detection: Application to iris, fingerprint, and face recognition. IEEE Trans. Image Process. 2013, 23, 710–724. [Google Scholar] [CrossRef] [PubMed]
- Cao, K.; Jain, A.K. Hacking Mobile Phones Using 2D Printed Fingerprints; Technical Report MSU-CSE-16-2; Michigan State University: East Lansing, MI, USA, 2016; Volume 6. [Google Scholar]
- Askarin, M.M.; Wong, K.; Phan, R.C.W. Planting attack on latent fingerprints. IET Biom. 2018, 7, 396–404. [Google Scholar] [CrossRef]
- Ding, B.; Wang, H.; Chen, P.; Zhang, Y.; Guo, Z.; Feng, J.; Liang, R. Surface and internal fingerprint reconstruction from optical coherence tomography through convolutional neural network. IEEE Trans. Inf. Forensics Secur. 2020, 16, 685–700. [Google Scholar] [CrossRef]
- He, K.; Duan, Y.; Feng, J.; Zhou, J. Estimating 3D finger angle via fingerprint image. Proc. Acm Interact. Mobile Wearable Ubiquitous Technol. 2022, 6, 14. [Google Scholar] [CrossRef]
- Dong, C.; Kumar, A. Synthesis of multi-view 3D fingerprints to advance contactless fingerprint identification. IEEE Trans. Pattern Anal. Mach. Intell. 2023, 45, 13134–13151. [Google Scholar] [CrossRef]
- Kumar, A. Contactless 3D Fingerprint Identification; Springer: Berlin/Heidelberg, Germany, 2018. [Google Scholar]
- Pang, X.; Song, Z.; Xie, W. Extracting valley-ridge lines from point-cloud-based 3D fingerprint models. IEEE Comput. Graph. Appl. 2012, 33, 73–81. [Google Scholar] [CrossRef]
- Ai, S.; Kwon, J. Extreme low-light image enhancement for surveillance cameras using attention U-Net. Sensors 2020, 20, 495. [Google Scholar] [CrossRef] [PubMed]
- Huang, X.; Qian, P.; Liu, M. Latent fingerprint image enhancement based on progressive generative adversarial network. In Proceedings of the IEEE/CVF Conference on Computer Vision and Pattern Recognition Workshops, Seattle, WA, USA, 14–19 June 2020; pp. 800–801. [Google Scholar]
- Liu, M.; Qian, P. Automatic segmentation and enhancement of latent fingerprints using deep nested unets. IEEE Trans. Inf. Forensics Secur. 2020, 16, 1709–1719. [Google Scholar] [CrossRef]
- Gavas, E.; Namboodiri, A. Finger-UNet: A U-Net based Multi-Task Architecture for Deep Fingerprint Enhancement. arXiv 2023, arXiv:2310.00629. [Google Scholar]
- Chen, Y.; Parziale, G.; Diaz-Santana, E.; Jain, A.K. 3D touchless fingerprints: Compatibility with legacy rolled images. In Proceedings of the 2006 Biometrics Symposium: Special Session on Research at the Biometric Consortium Conference, Baltimore, MD, USA, 19 September–21 August 2006; pp. 1–6. [Google Scholar]
- Askarin, M.M.; Hu, J.; Wang, M.; Yin, X.; Jia, X. A B-Spline Function based 3D Point Cloud Flattening Scheme for 3D Fingerprint Recognition and Identification. TechRxiv 2024. [Google Scholar] [CrossRef]
- Askarin, M.M.; Wong, K.; Phan, R.C.W. Reduced contact lifting of latent fingerprints from curved surfaces. J. Inf. Secur. Appl. 2020, 53, 102520. [Google Scholar] [CrossRef]
- Yin, X.; Zhu, Y.; Hu, J. 3D fingerprint recognition based on ridge-valley-guided 3D reconstruction and 3D topology polymer feature extraction. IEEE Trans. Pattern Anal. Mach. Intell. 2019, 43, 1085–1091. [Google Scholar] [CrossRef] [PubMed]
- Kumar, A. The Hong Kong Polytechnic University 3D Fingerprint Images Database Version 2.0. 2015. Available online: https://web.comp.polyu.edu.hk/csajaykr/3Dfingerv2.htm (accessed on 1 May 2024).
- Neurotechnology. VeriFinger 13.1 SDK. 2024. Available online: http://www.neurotechnology.com/verifinger.html (accessed on 1 July 2024).
- National Institute of Standards and Technology. MINDTCT. 2010. Available online: https://www.nist.gov/ (accessed on 1 July 2024).
- Lin, C.; Kumar, A. Tetrahedron based fast 3D fingerprint identification using colored LEDs illumination. IEEE Trans. Pattern Anal. Mach. Intell. 2017, 40, 3022–3033. [Google Scholar] [CrossRef]
- Microsoft. Microsoft Windows 11. 2024. Available online: https://www.microsoft.com (accessed on 1 July 2024).
- MathWorks. Matlab R2023b. 2024. Available online: https://au.mathworks.com (accessed on 1 July 2024).
- JetBrains. Pycharm. 2024. Available online: https://www.jetbrains.com/pycharm/ (accessed on 1 July 2024).
- Microsoft. Visual Studio. 2022. Available online: https://visualstudio.microsoft.com/ (accessed on 1 July 2024).


| Loss Function | Sparse Categorical Crossentropy |
| Optimizer | Adam (learning rate:0.001) |
| Batch Size | 16 |
| Epochs | 320 |
| Number of Classes | 256 |
| Loss Function | Sparse Categorical Crossentropy |
| Optimizer | Adam (learning rate:0.001) |
| Batch Size | 16 |
| Epochs | 100 |
| Number of Classes | 2 |
| Loss Function | Sparse Categorical Crossentropy |
| Optimizer | Adam (learning rate:0.001) |
| Batch Size | 16 |
| Epochs | 1500 |
| Number of Classes | 255 |
| Experiments | EER | Rank-1 Accuracy | Precision | Recall | F1-Score |
|---|---|---|---|---|---|
| Generated gray-scale images from the flattened point cloud | 41.32% | 24.44% | 45.68% | 28.96% | 35.45% |
| Enhanced gray-scale images | 13.96% | 40.00% | 66.90% | 86.52% | 75.45% |
| Experiments | EER | Rank-1 Accuracy | Precision | Recall | F1-Score |
|---|---|---|---|---|---|
| Generated gray-scale images from the flattened point cloud | 41.97% | 20.5% | 25.33% | 28.90% | 27.00% |
| Enhanced gray-scale images | 12.49% | 33.5% | 50.74% | 87.87% | 64.33% |
Disclaimer/Publisher’s Note: The statements, opinions and data contained in all publications are solely those of the individual author(s) and contributor(s) and not of MDPI and/or the editor(s). MDPI and/or the editor(s) disclaim responsibility for any injury to people or property resulting from any ideas, methods, instructions or products referred to in the content. |
© 2025 by the authors. Licensee MDPI, Basel, Switzerland. This article is an open access article distributed under the terms and conditions of the Creative Commons Attribution (CC BY) license (https://creativecommons.org/licenses/by/4.0/).
Share and Cite
Mogharen Askarin, M.; Wang, M.; Yin, X.; Jia, X.; Hu, J. U-Net-Based Fingerprint Enhancement for 3D Fingerprint Recognition. Sensors 2025, 25, 1384. https://doi.org/10.3390/s25051384
Mogharen Askarin M, Wang M, Yin X, Jia X, Hu J. U-Net-Based Fingerprint Enhancement for 3D Fingerprint Recognition. Sensors. 2025; 25(5):1384. https://doi.org/10.3390/s25051384
Chicago/Turabian StyleMogharen Askarin, Mohammad, Min Wang, Xuefei Yin, Xiuping Jia, and Jiankun Hu. 2025. "U-Net-Based Fingerprint Enhancement for 3D Fingerprint Recognition" Sensors 25, no. 5: 1384. https://doi.org/10.3390/s25051384
APA StyleMogharen Askarin, M., Wang, M., Yin, X., Jia, X., & Hu, J. (2025). U-Net-Based Fingerprint Enhancement for 3D Fingerprint Recognition. Sensors, 25(5), 1384. https://doi.org/10.3390/s25051384