
Design Key Points of High-Performance Diffuse Reflectance Optical Sensors for Non-Invasive Blood Glucose Measurement

 , , and
Abstract
1. Introduction
- (1)
- Depth resolution
- (2)
- Detection SNR
- (3)
- Human–sensor interface coupling
2. Design Key Points of Diffuse Reflectance Optical Sensors
- (1)
- Detection SNR
- (2)
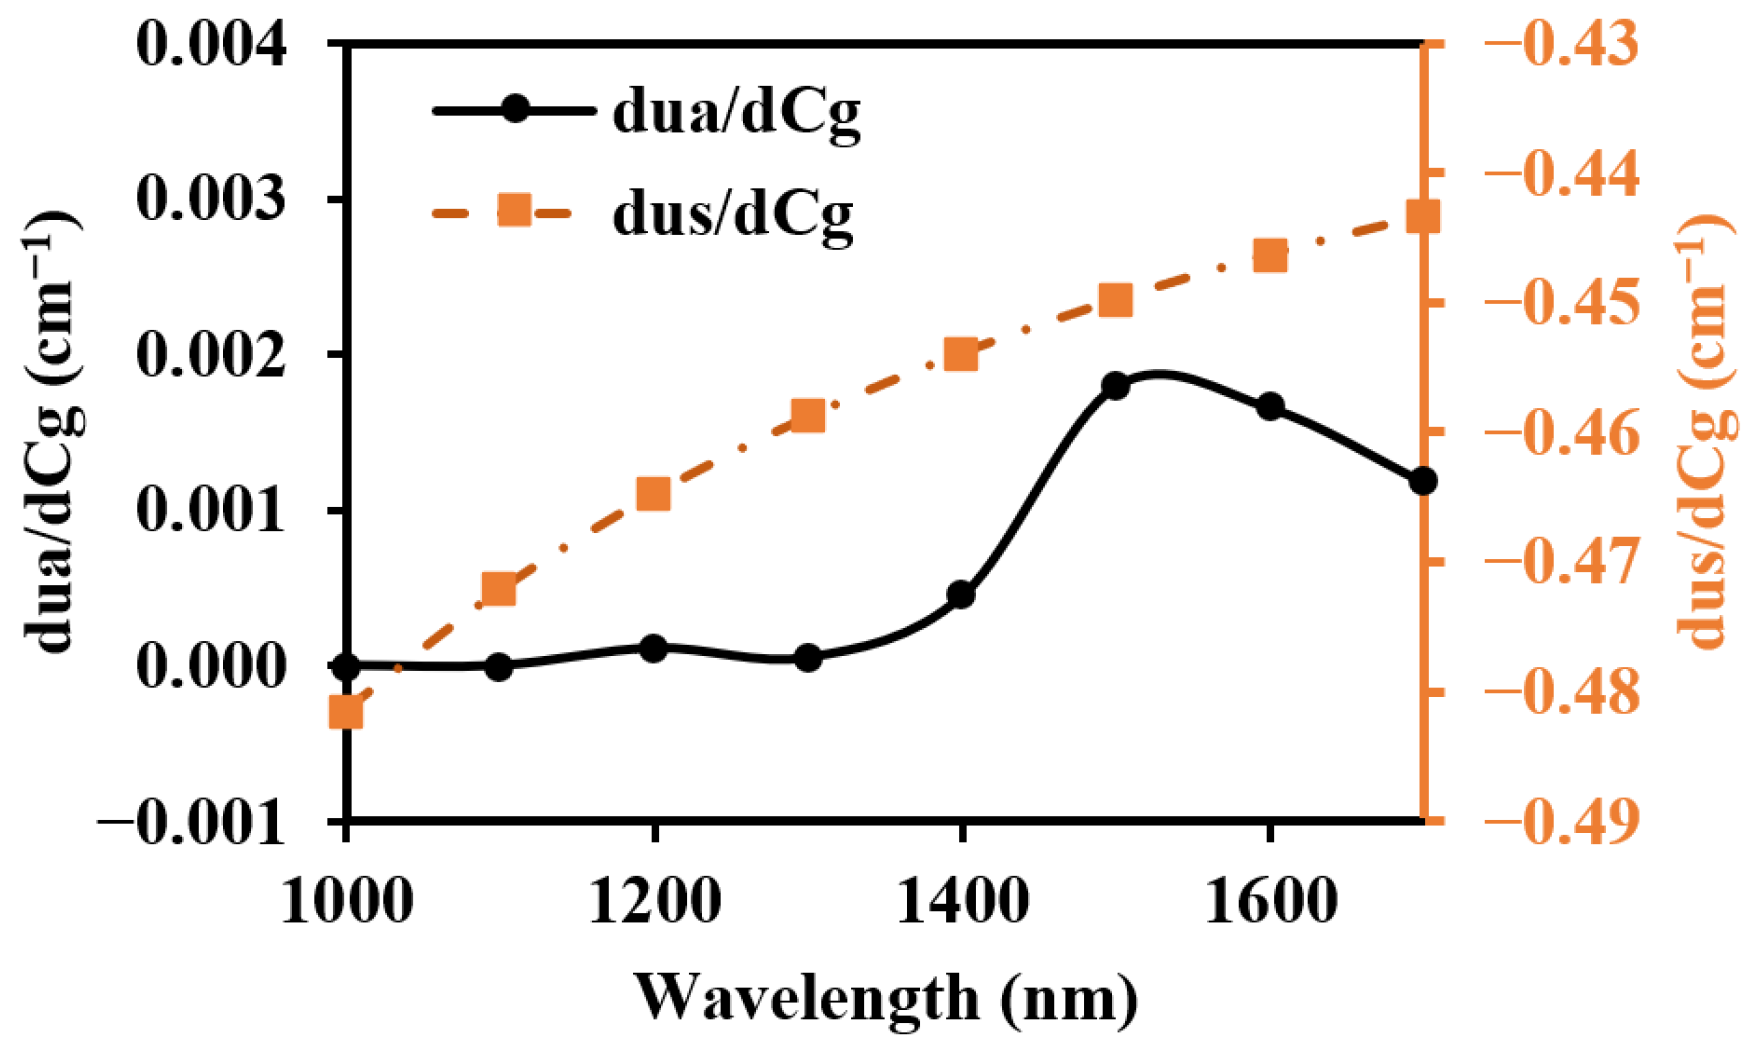
- BGC sensitivity
- (3)
- The limit of detection for the BGC
3. Design Proposals and Evaluations
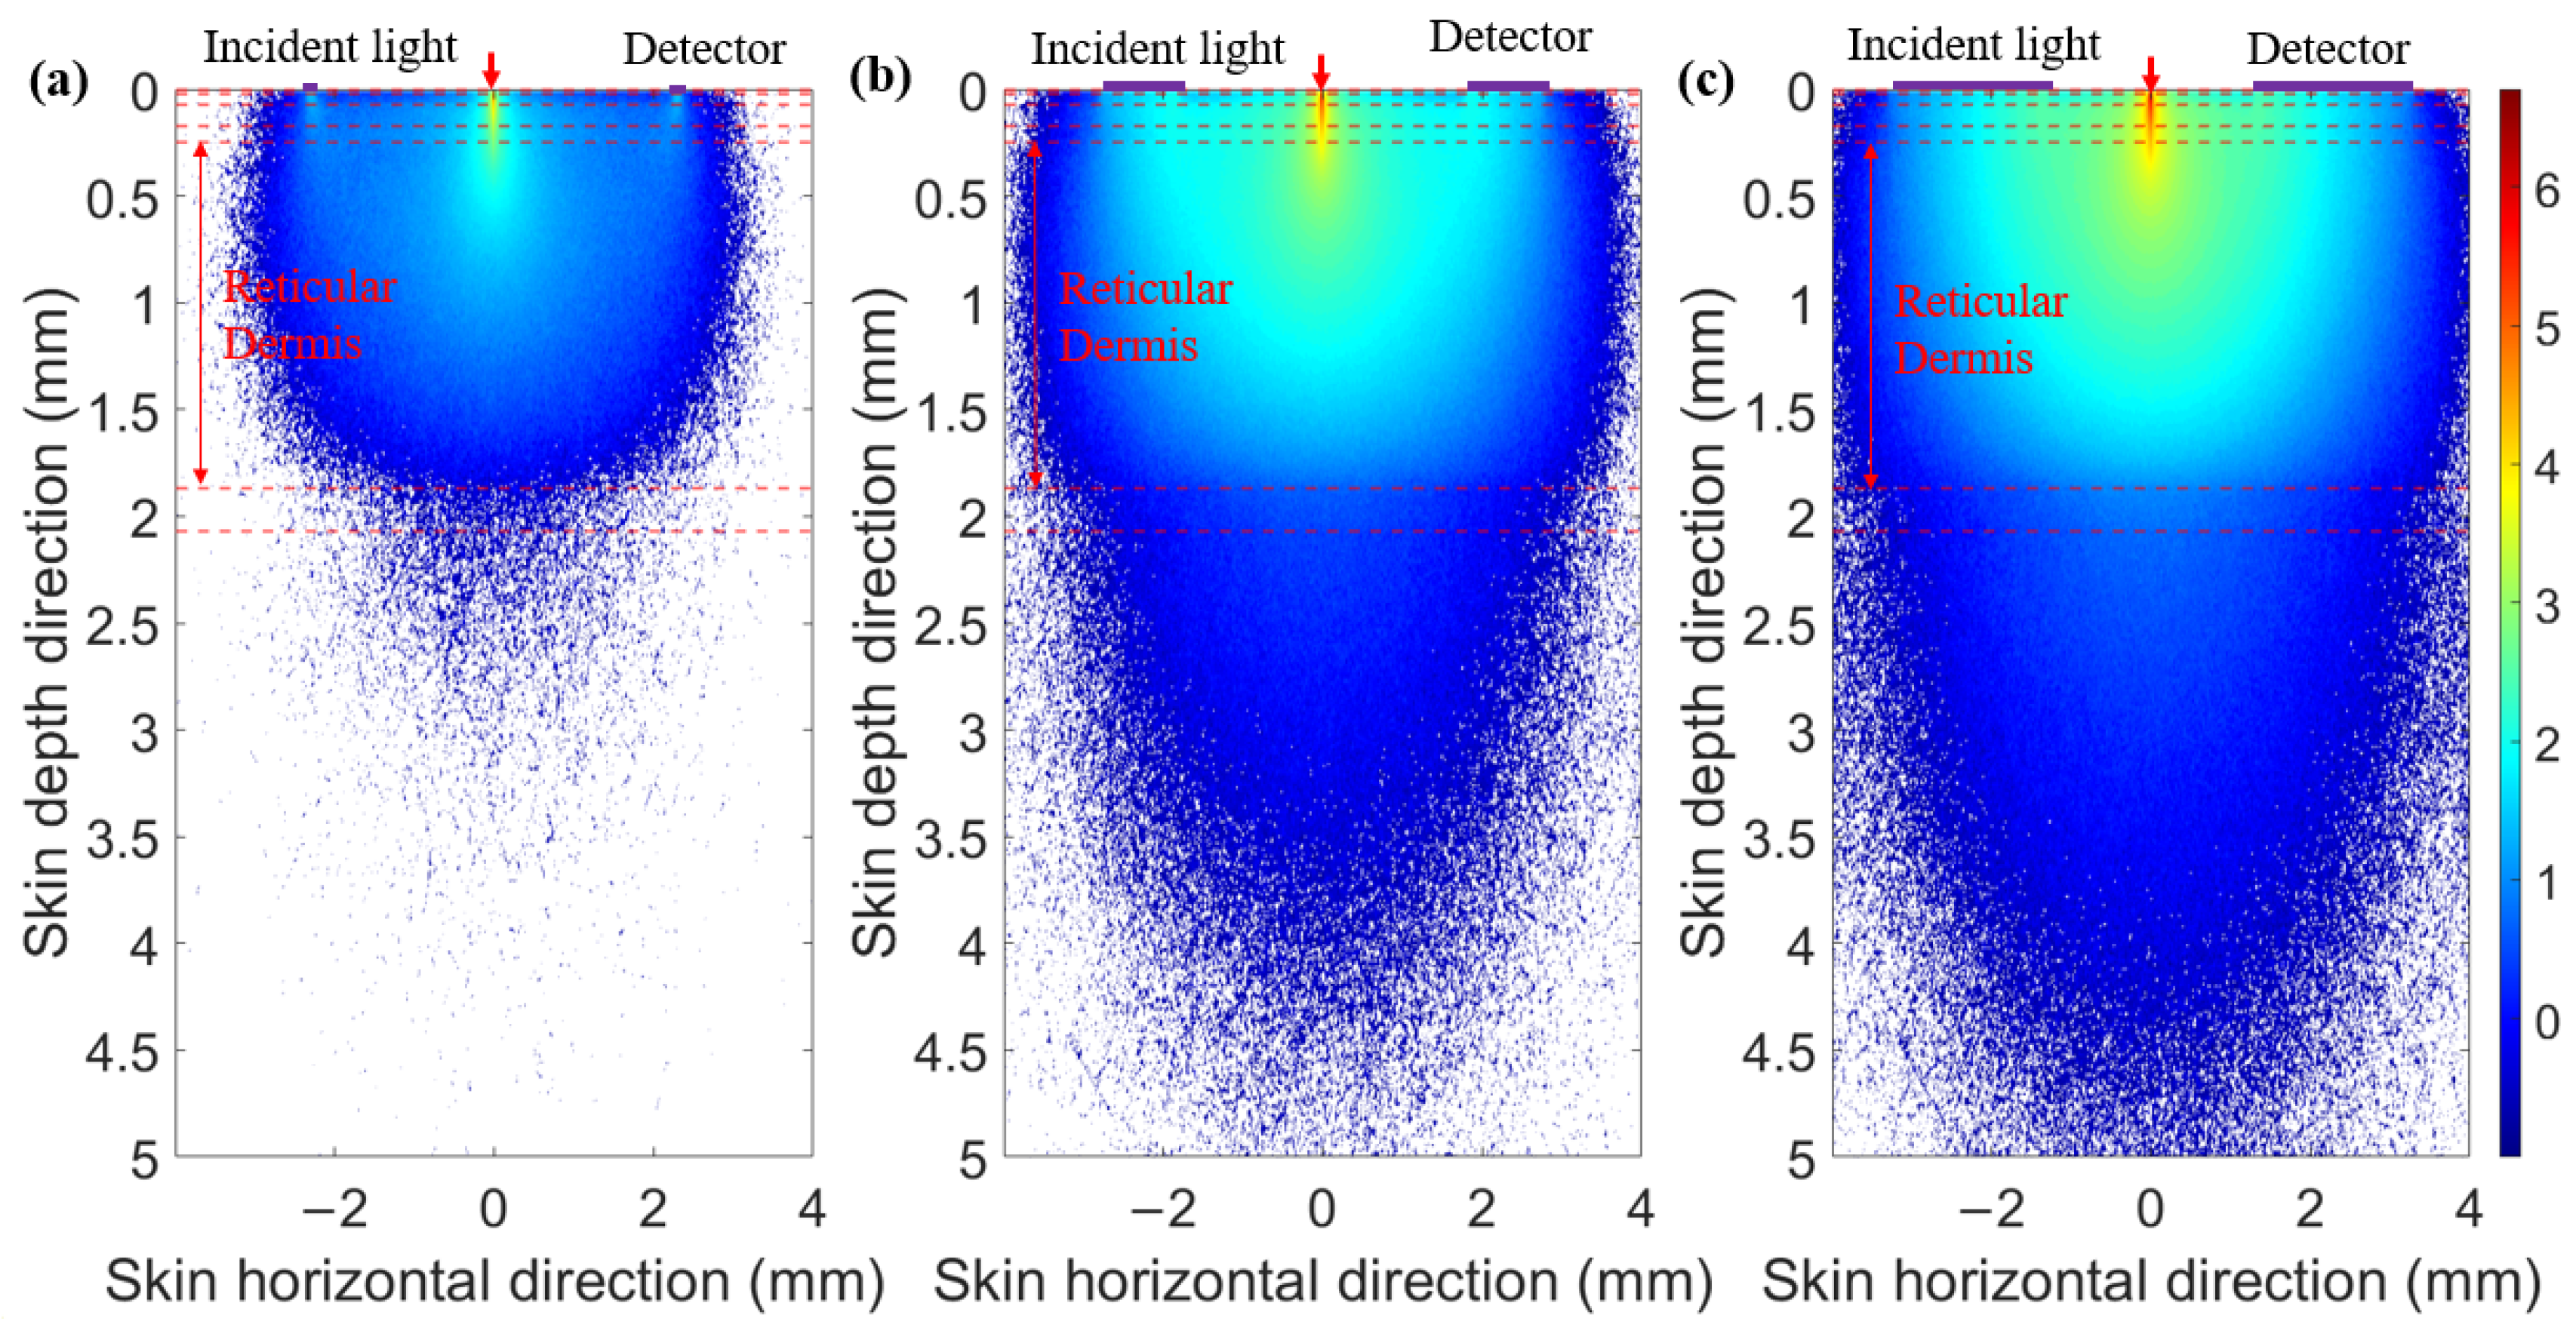
3.1. Design Proposal for Depth Resolution
3.1.1. Multi-SDSs for Various Detection Depths
3.1.2. Multi-SDSs for Detection at the Dermis
3.2. Design Proposal for Detection SNR
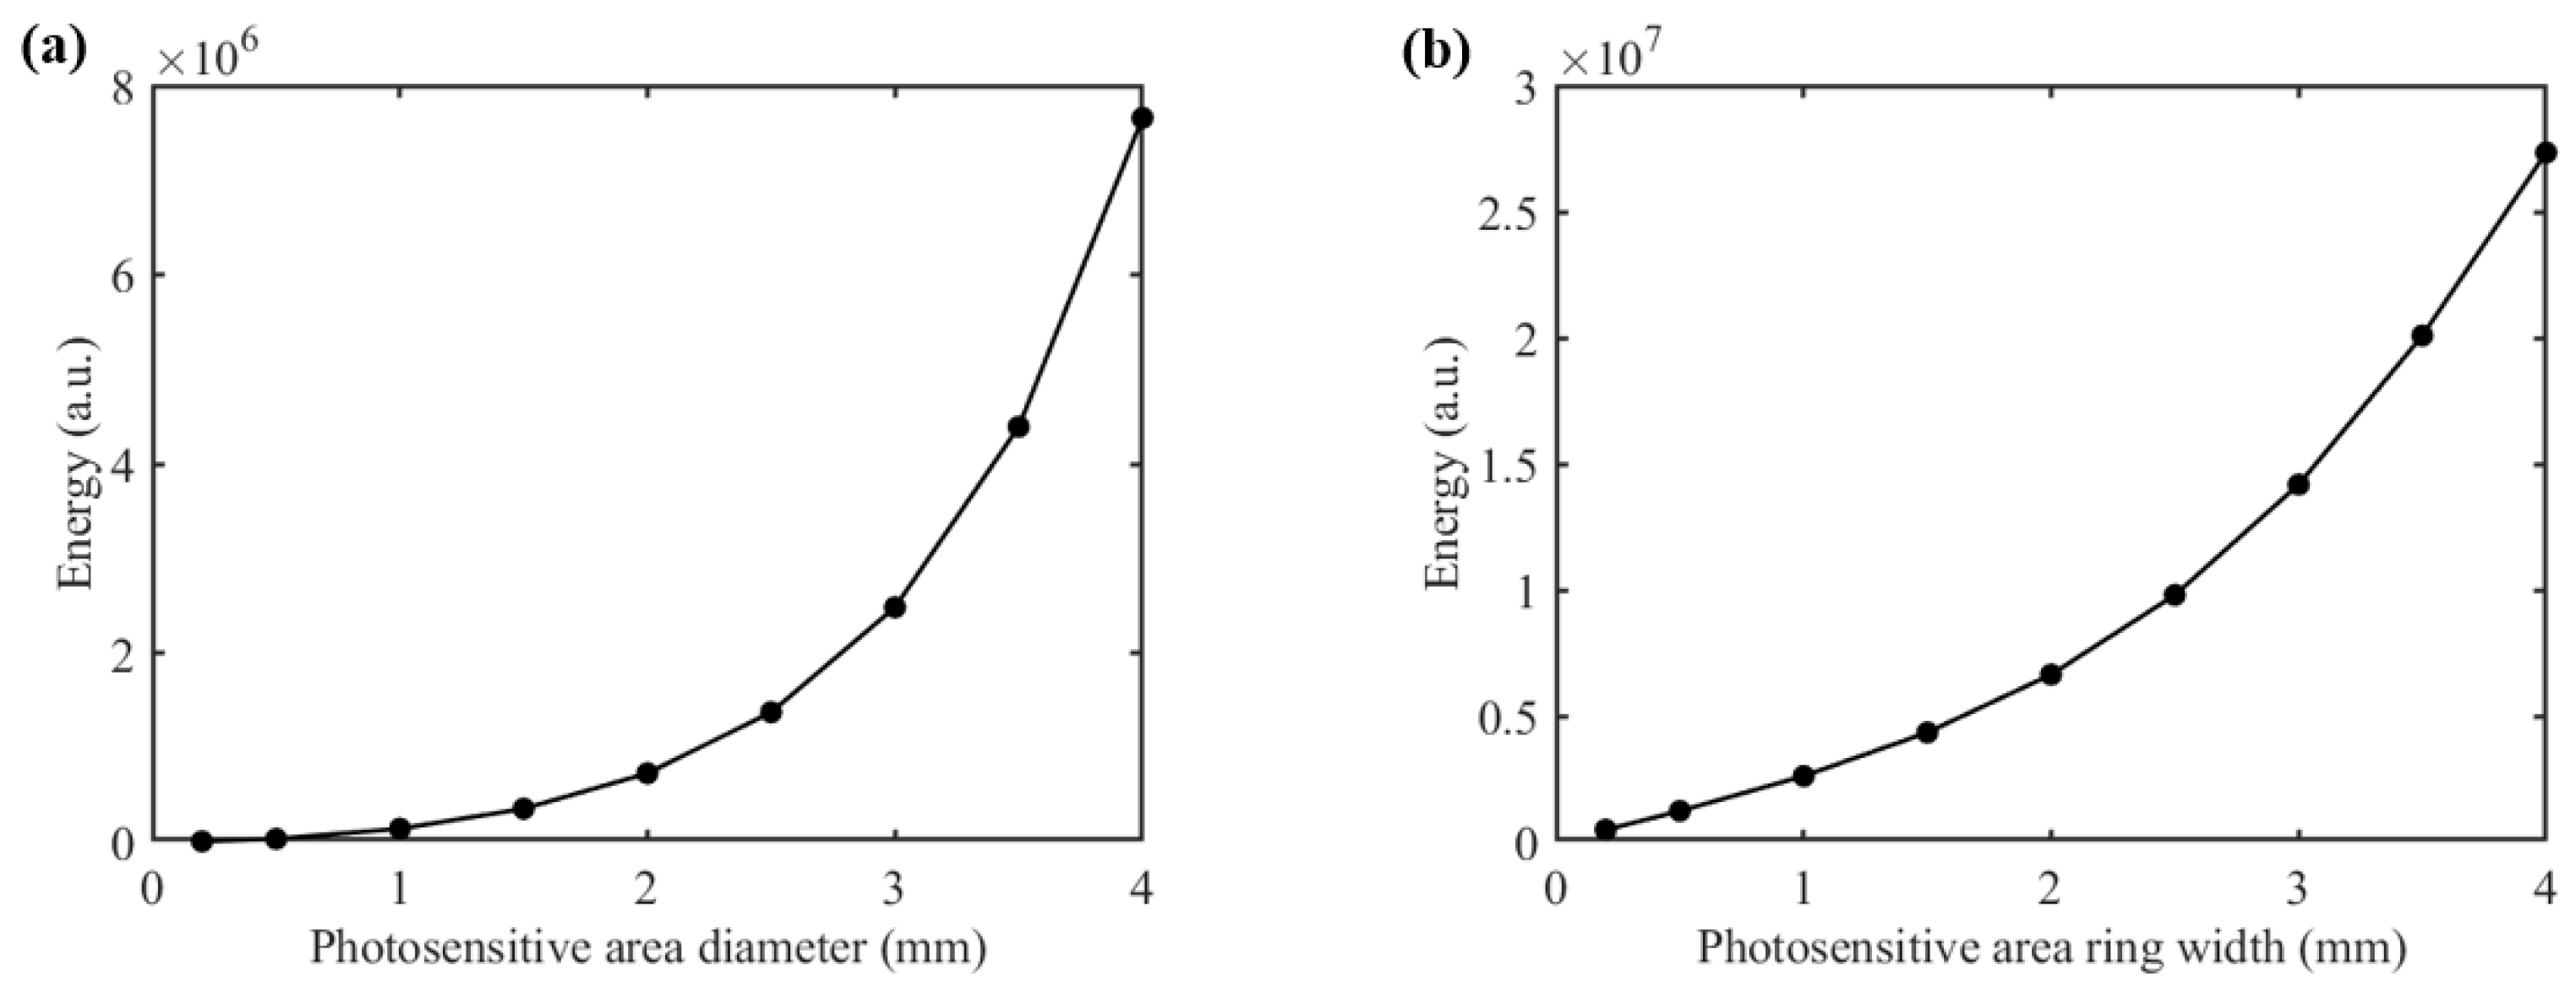
3.2.1. Detection SNR Enhancement by Increasing the Photosensitive Area
3.2.2. Shape Design of the Detector
3.2.3. Design of the Ring-Shaped Detector
- (1)
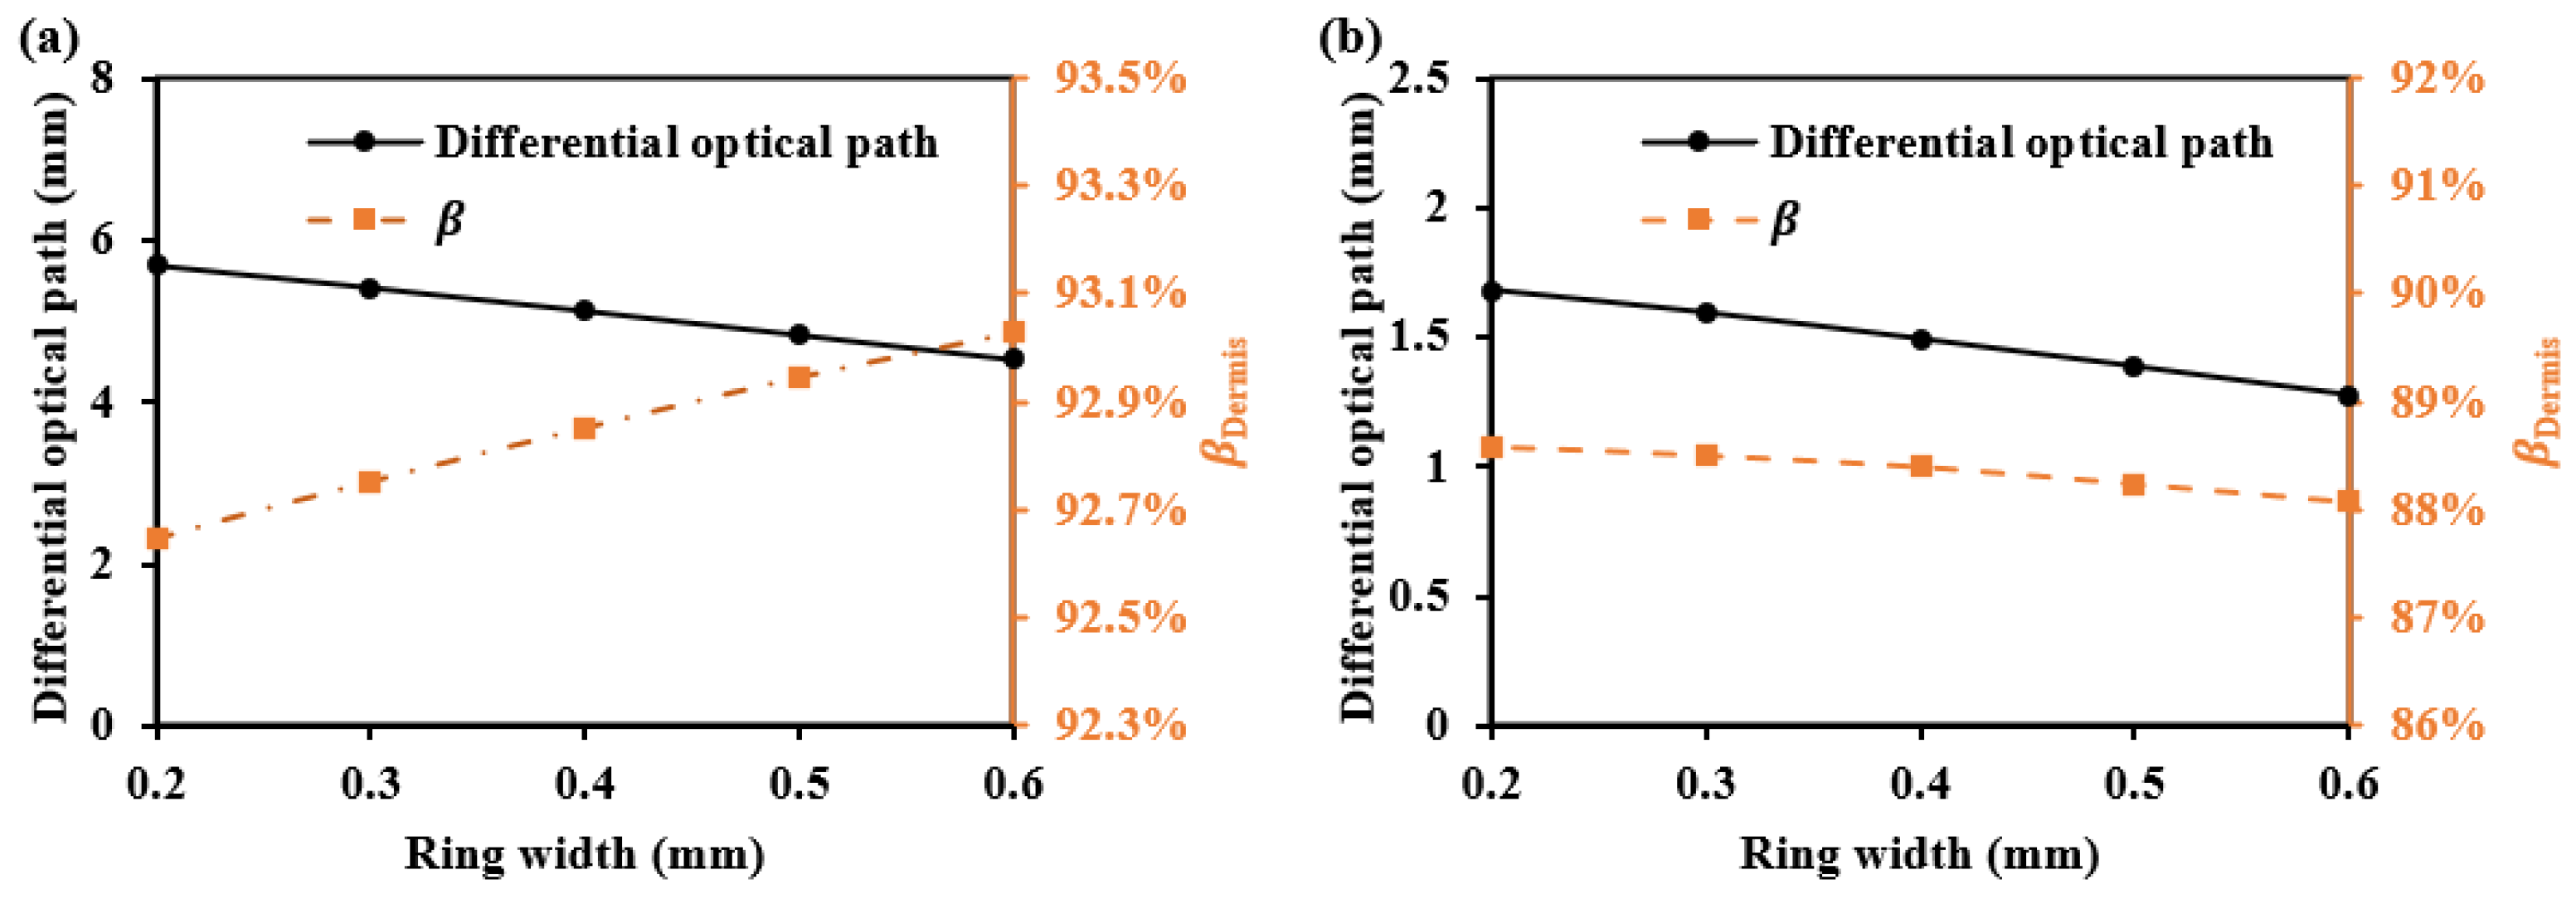
- Design of ring-shaped detectors for the dermis
- (2)
- Design of ring-shaped detectors for the multiple sub-layers within the dermis
3.3. Design Proposal for Human–Sensor Interface Coupling
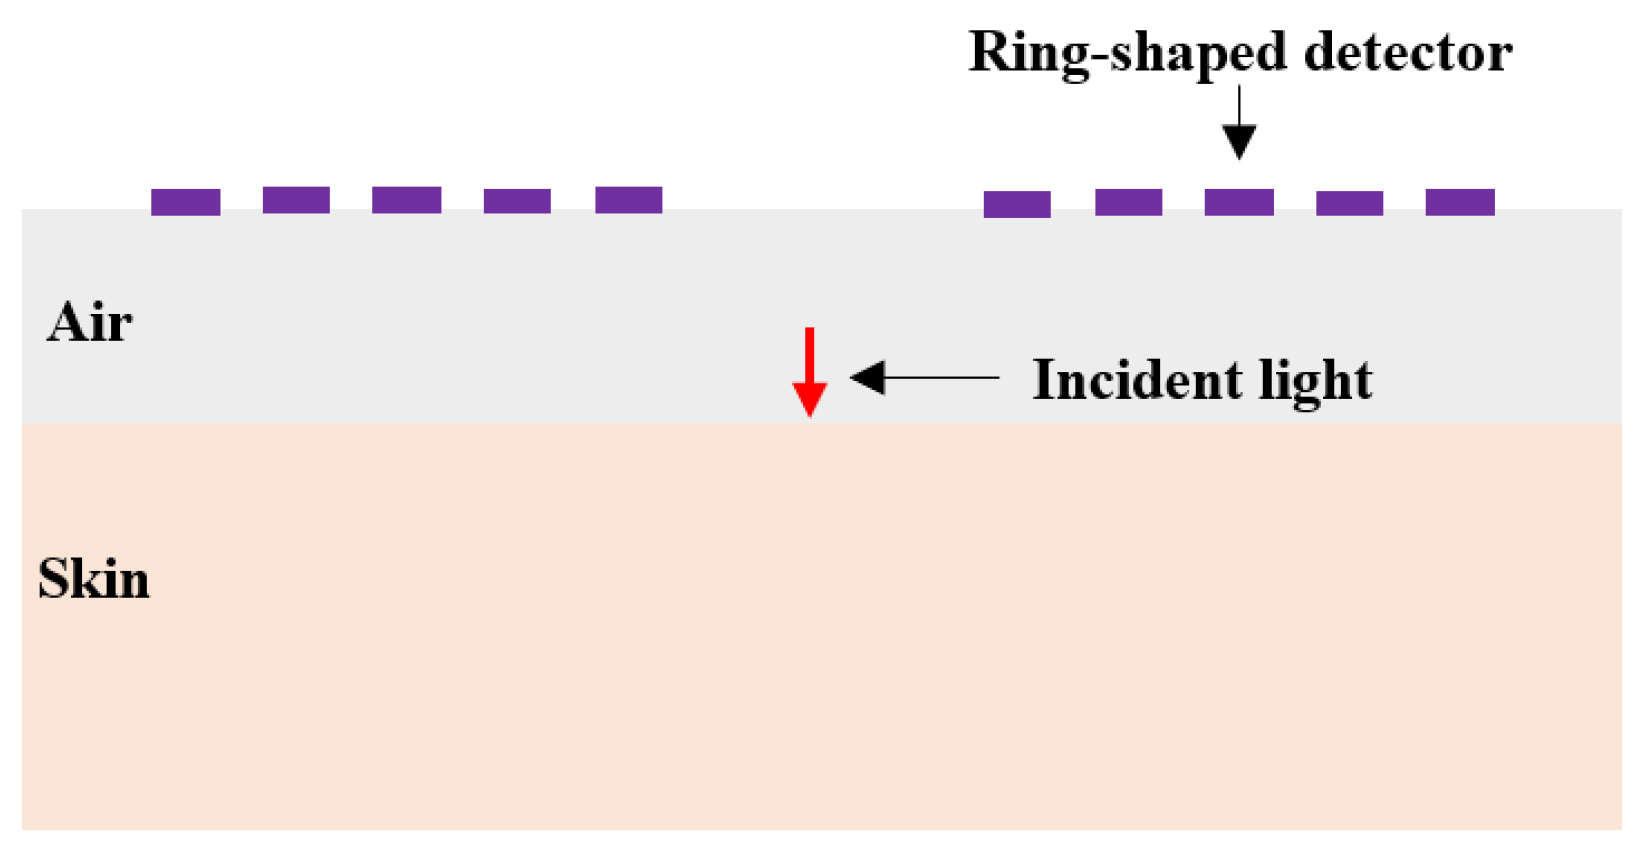
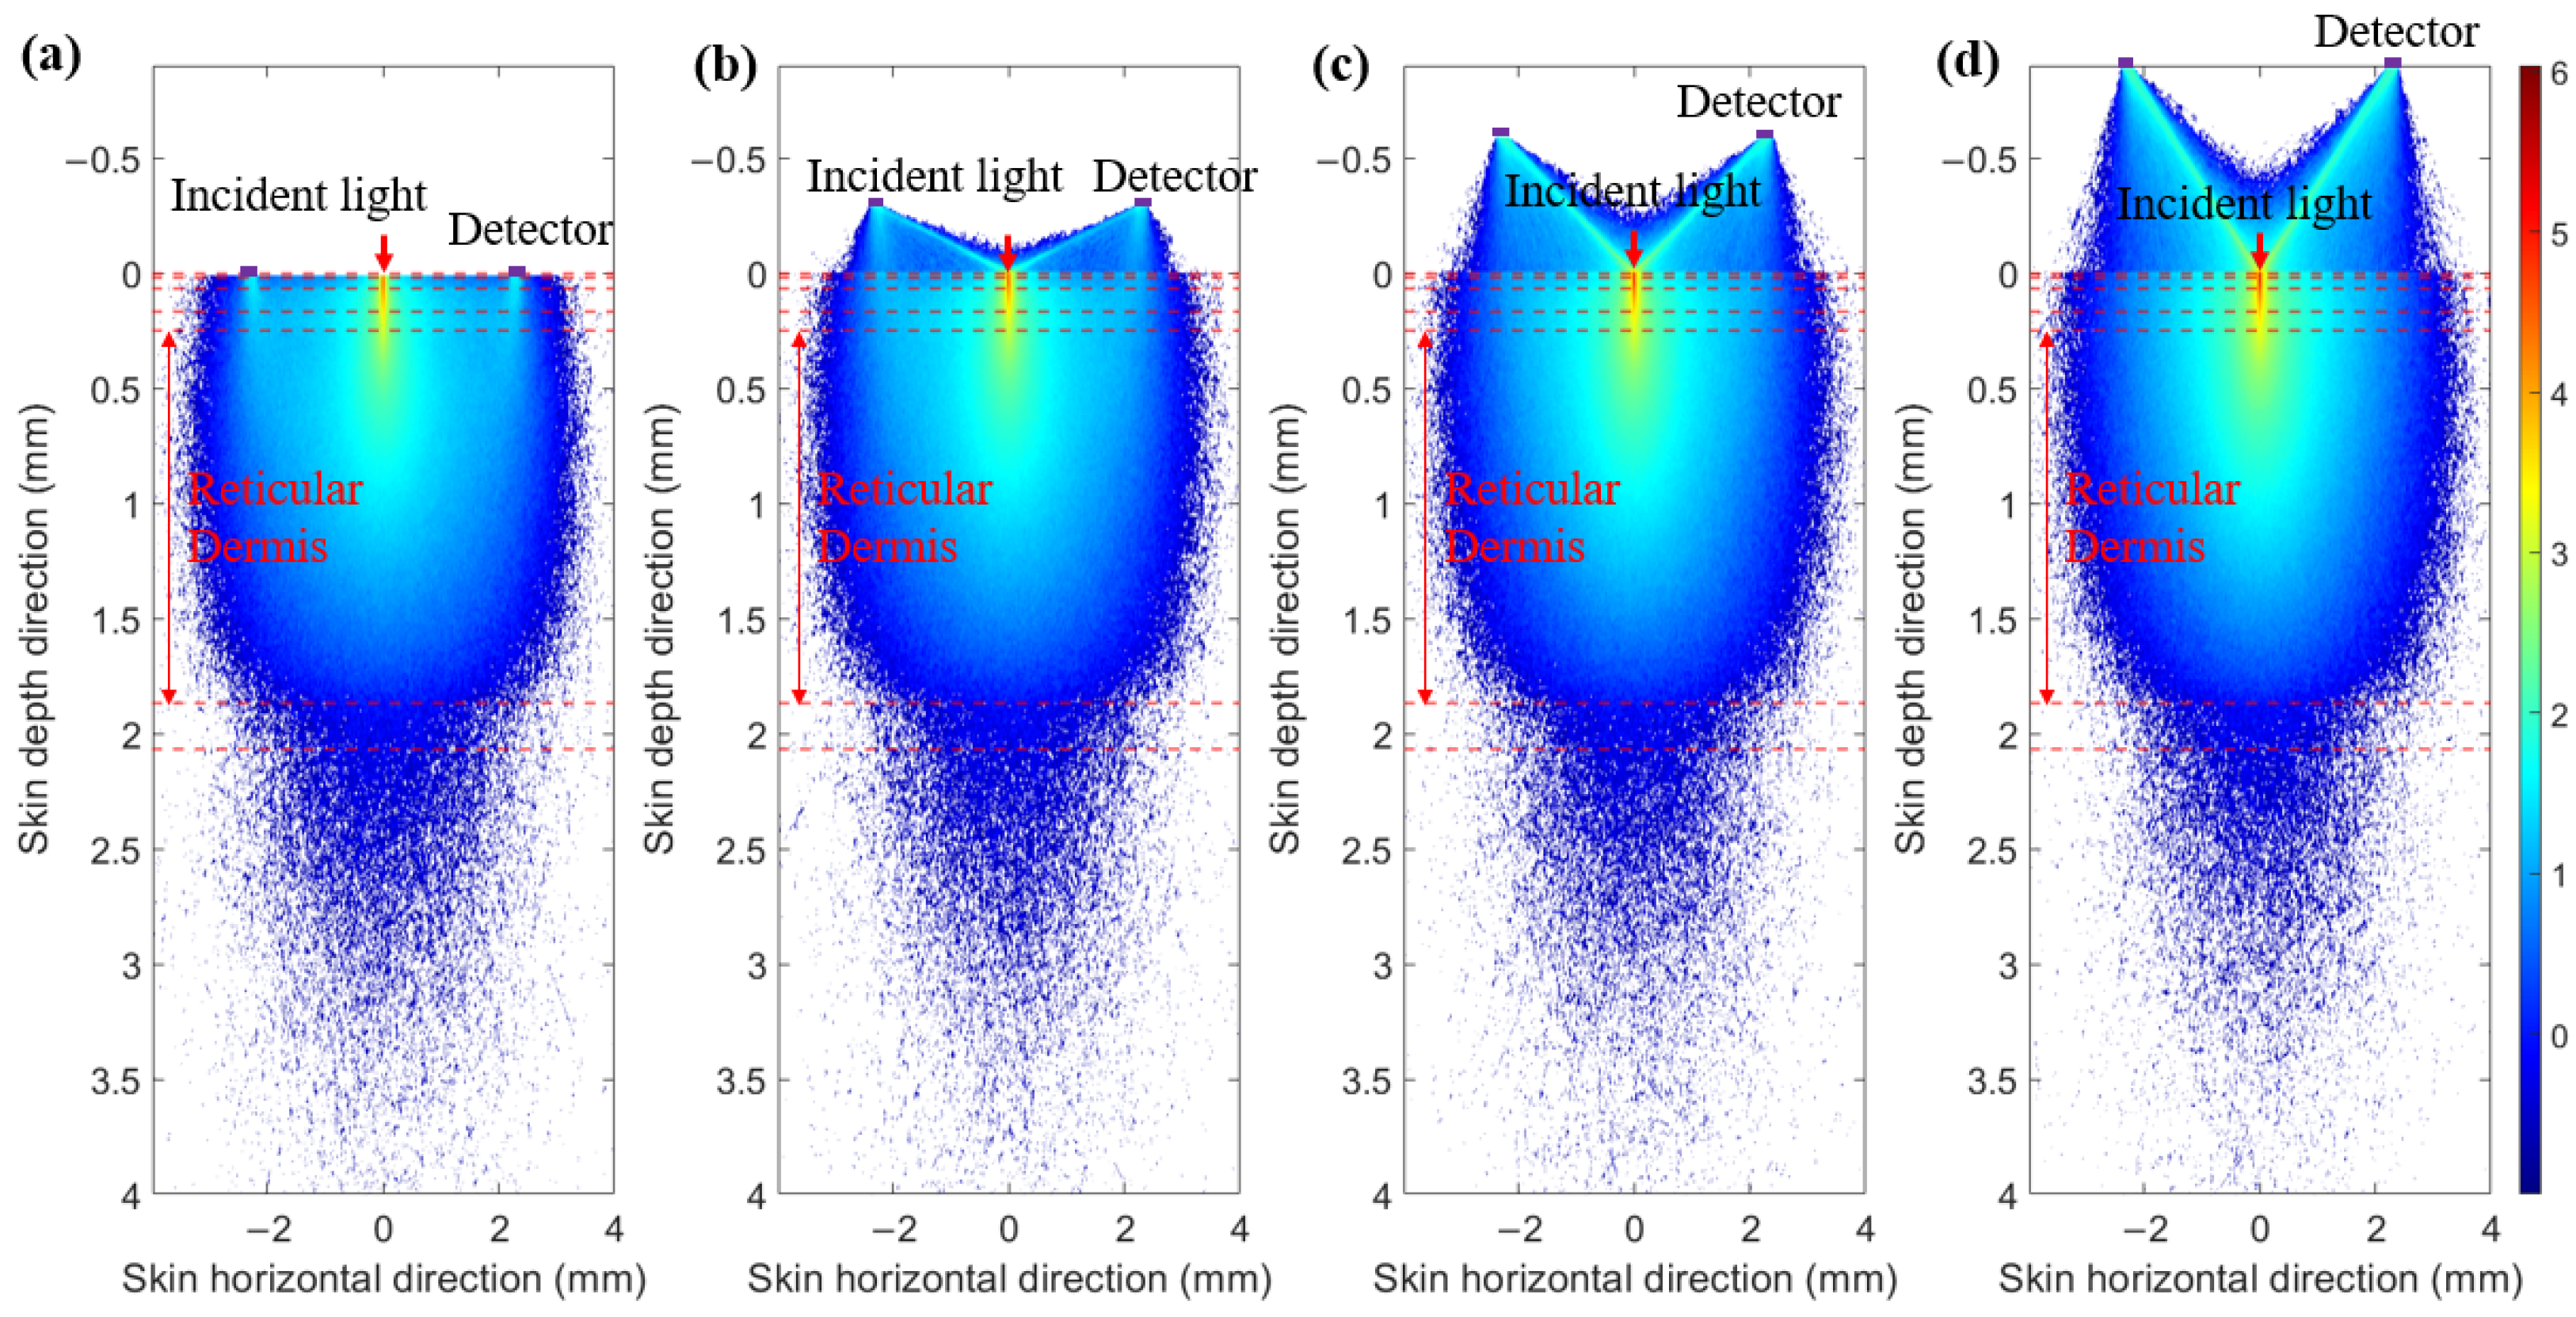
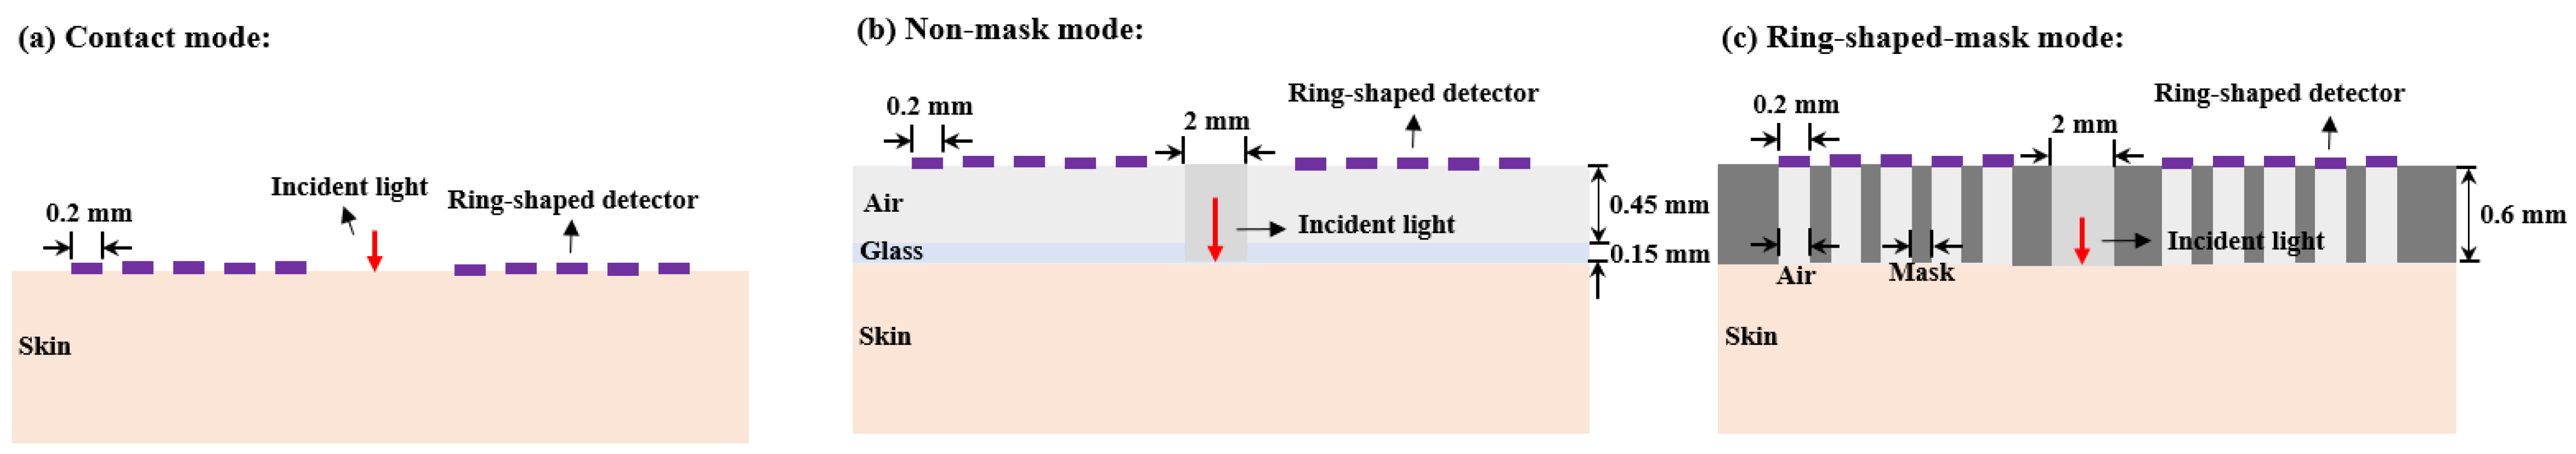
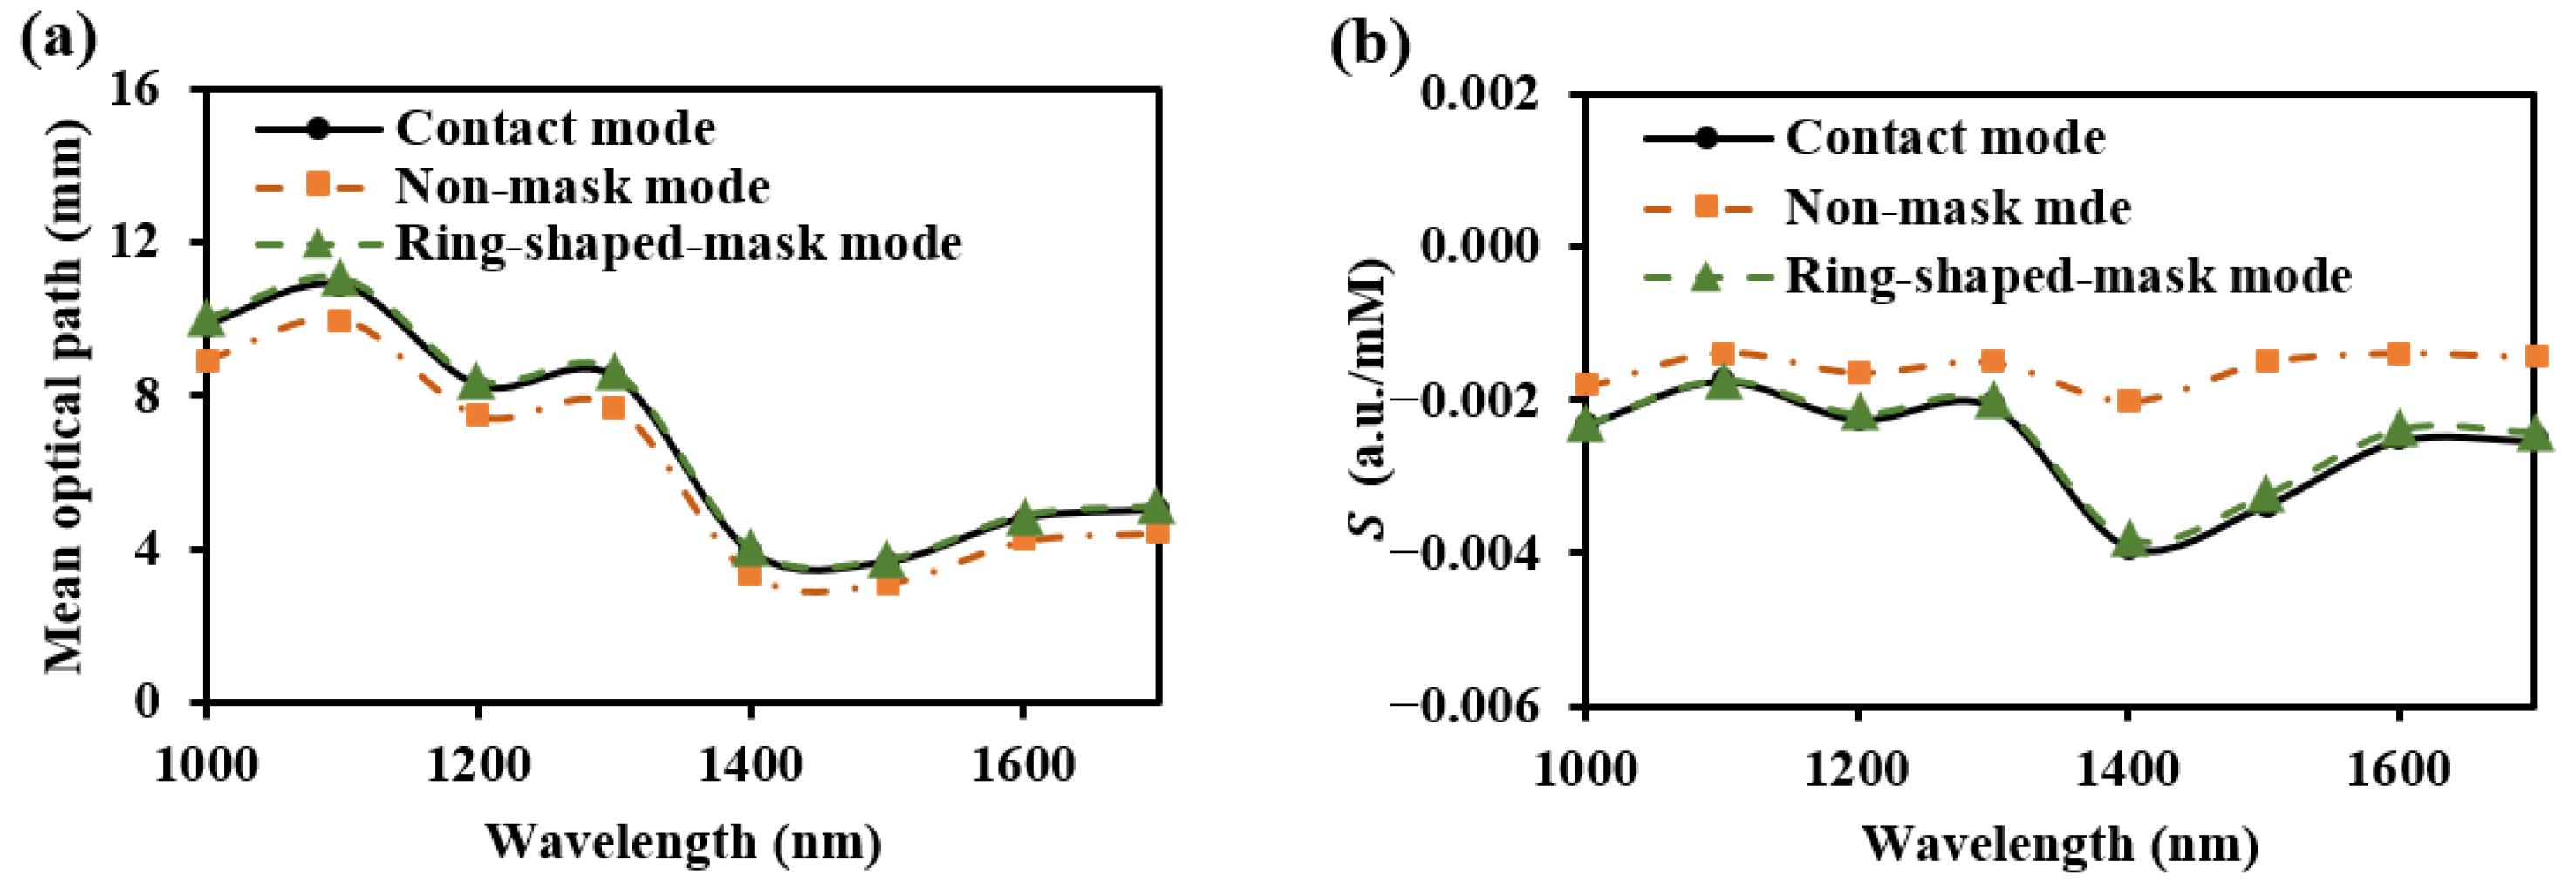
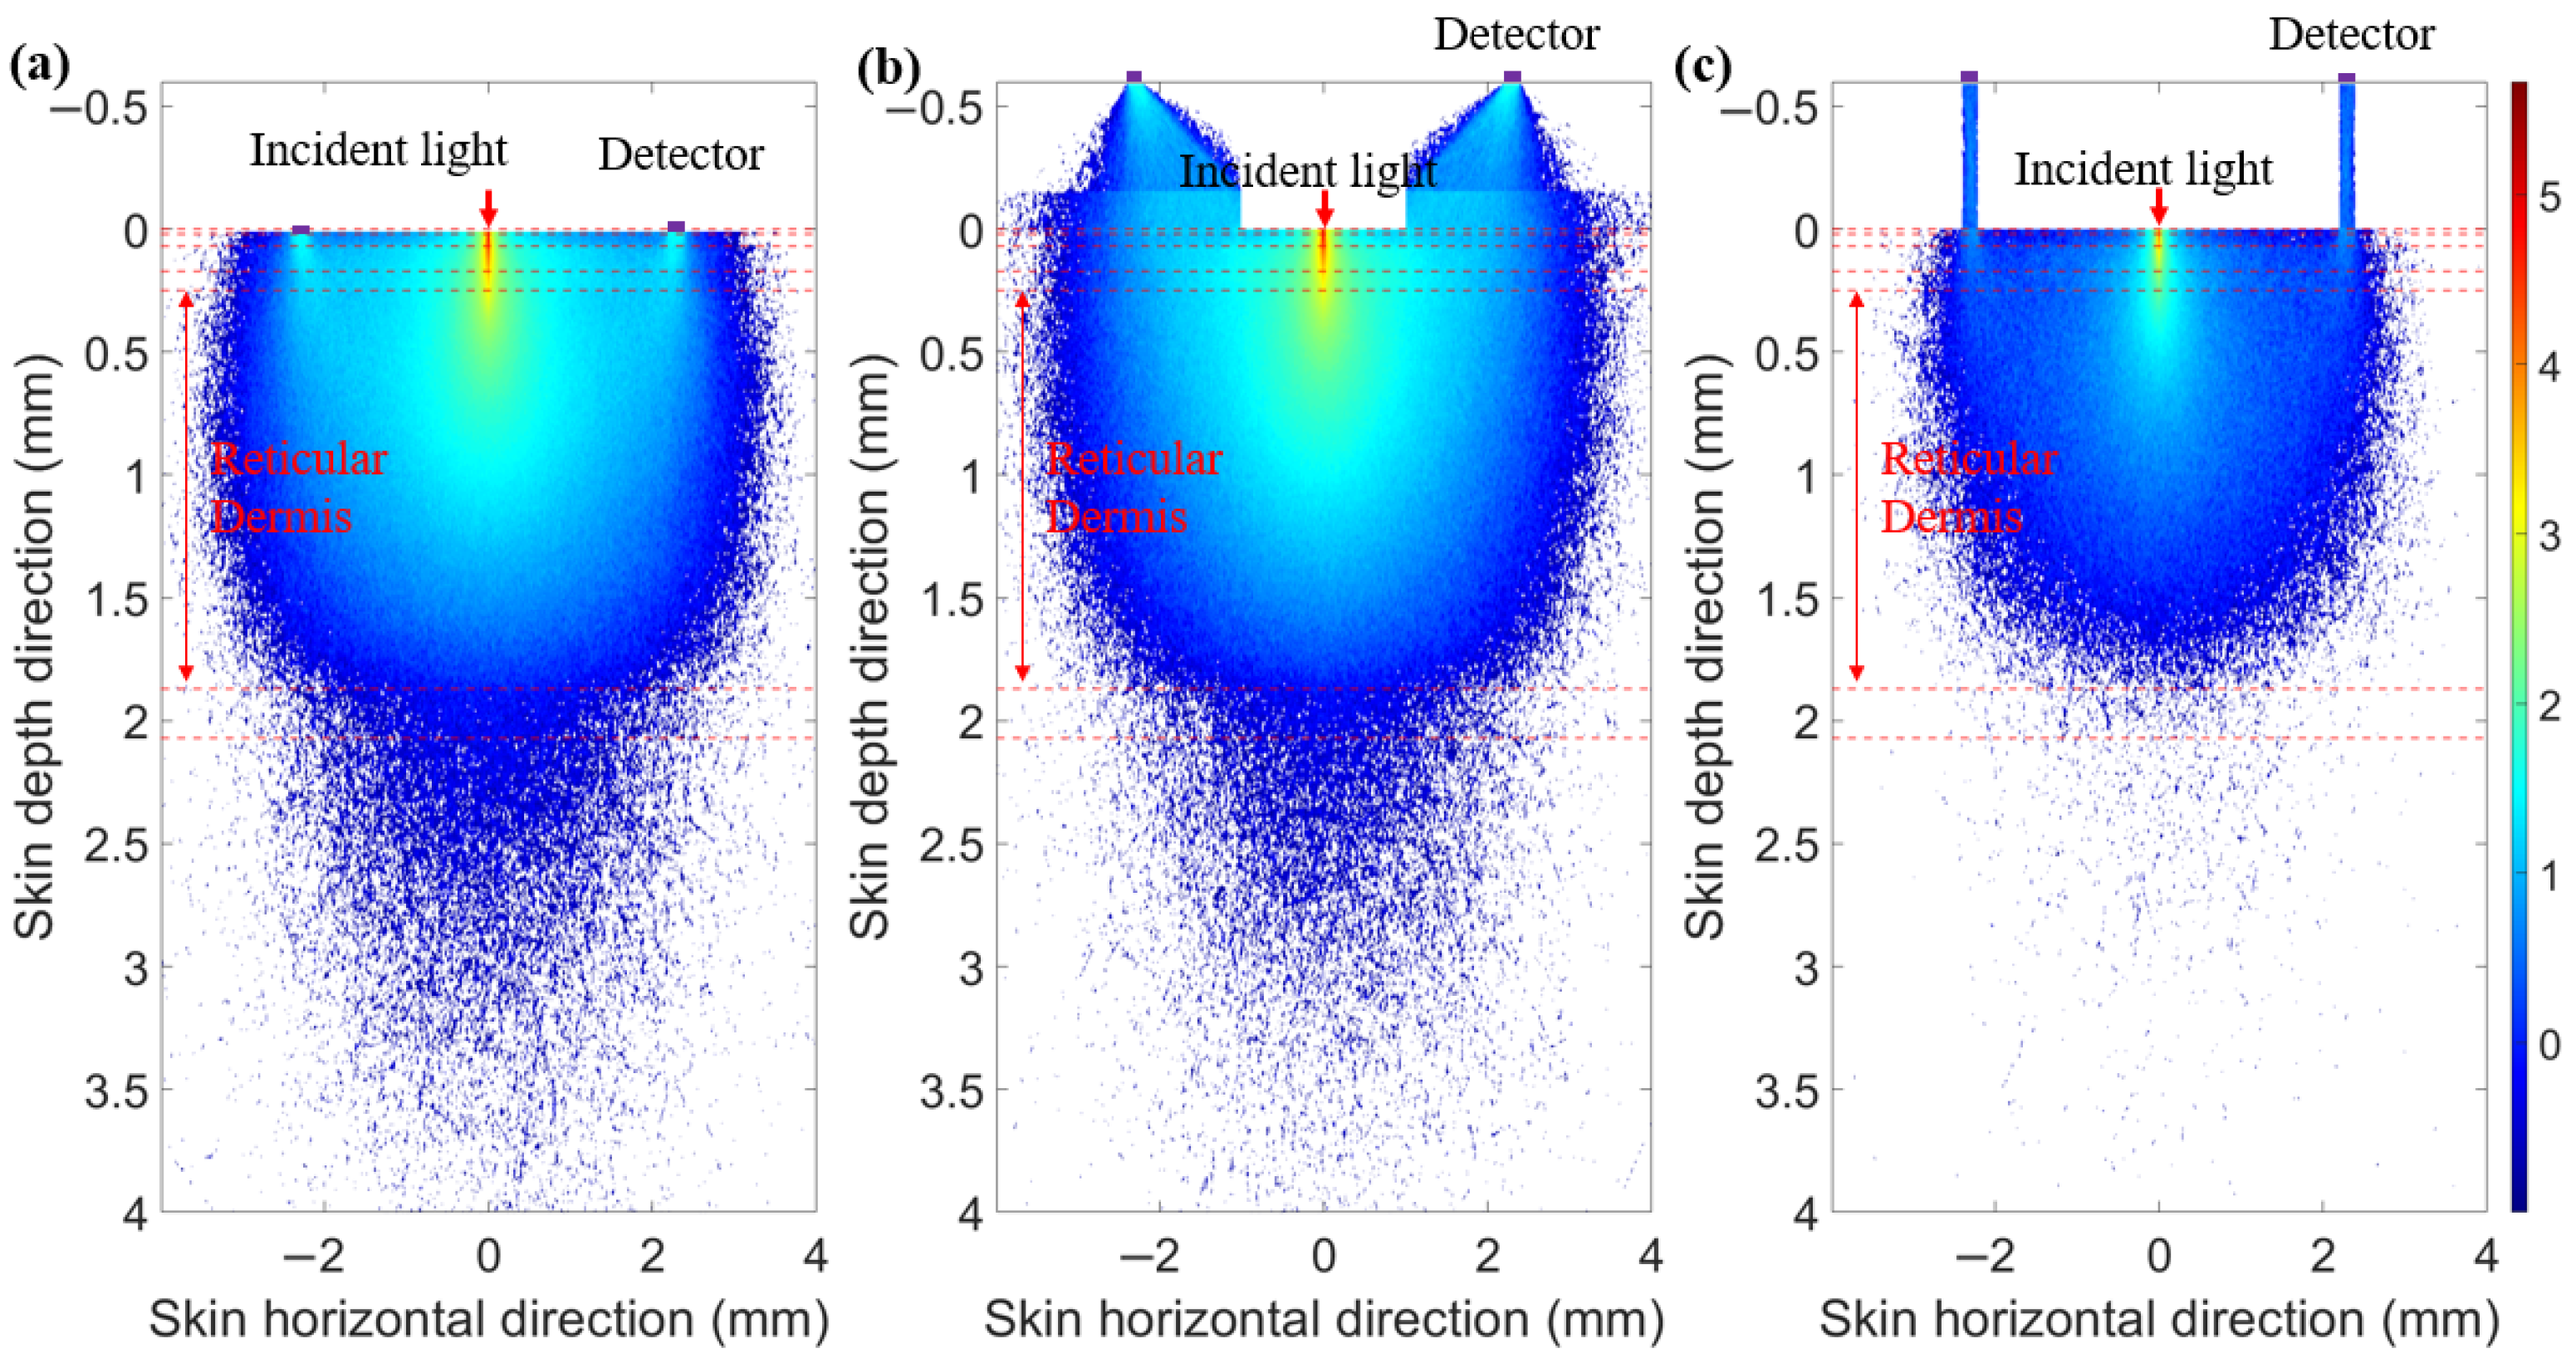
3.3.1. Non-Contact Skin and Detector
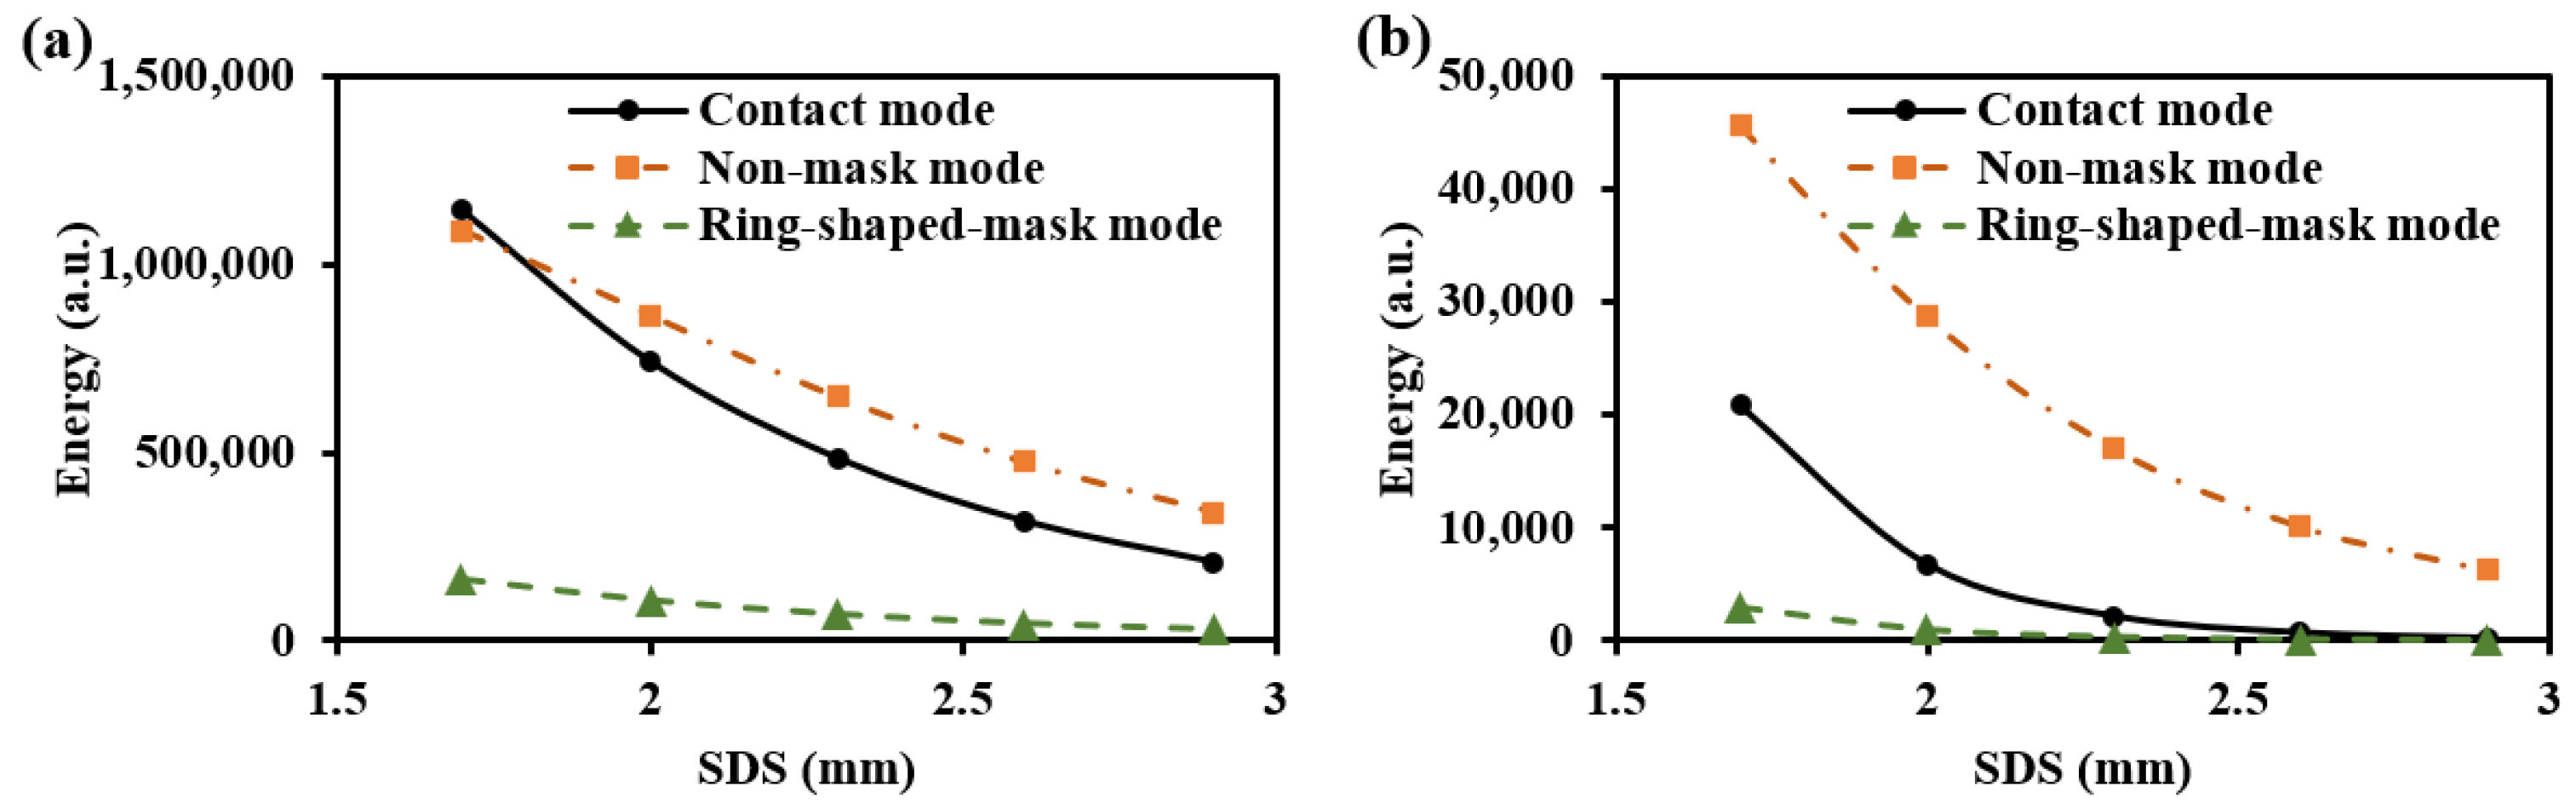
3.3.2. Design to Prevent Crosstalk of Spatial Light Between Detectors
3.4. Available Design Proposal for Human Detection
3.4.1. Differential Measurement Strategy on Humans
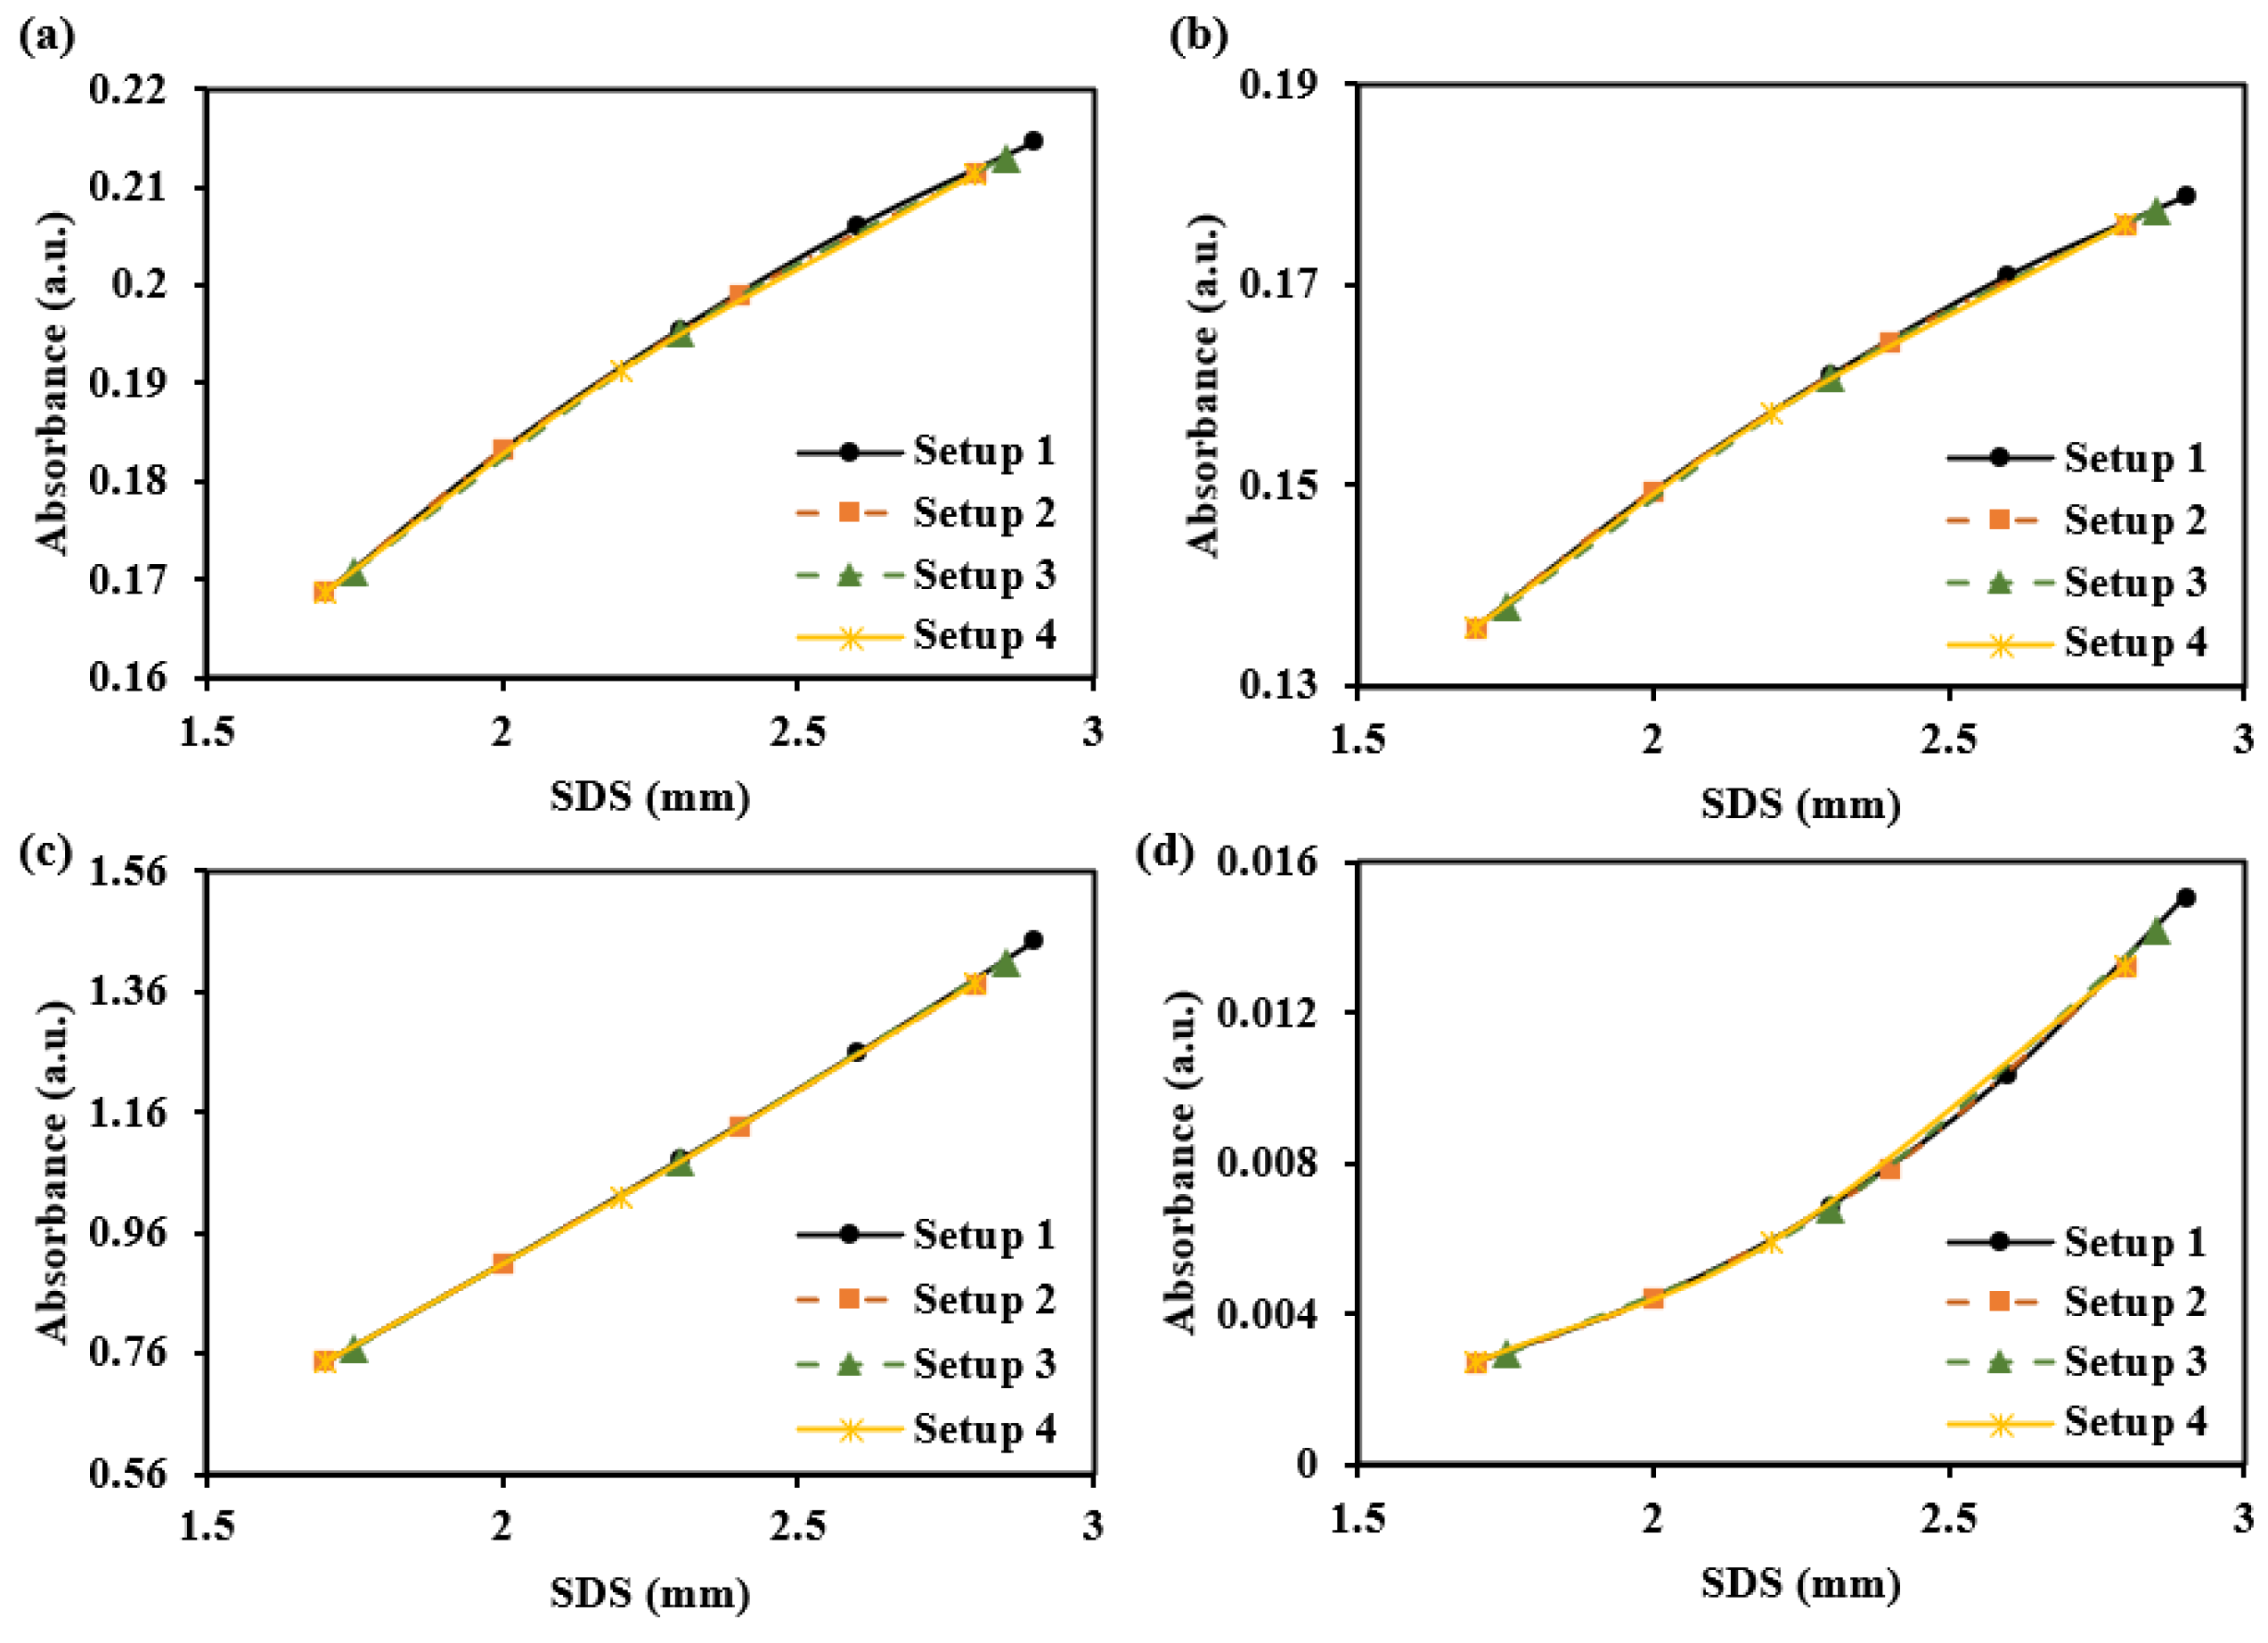
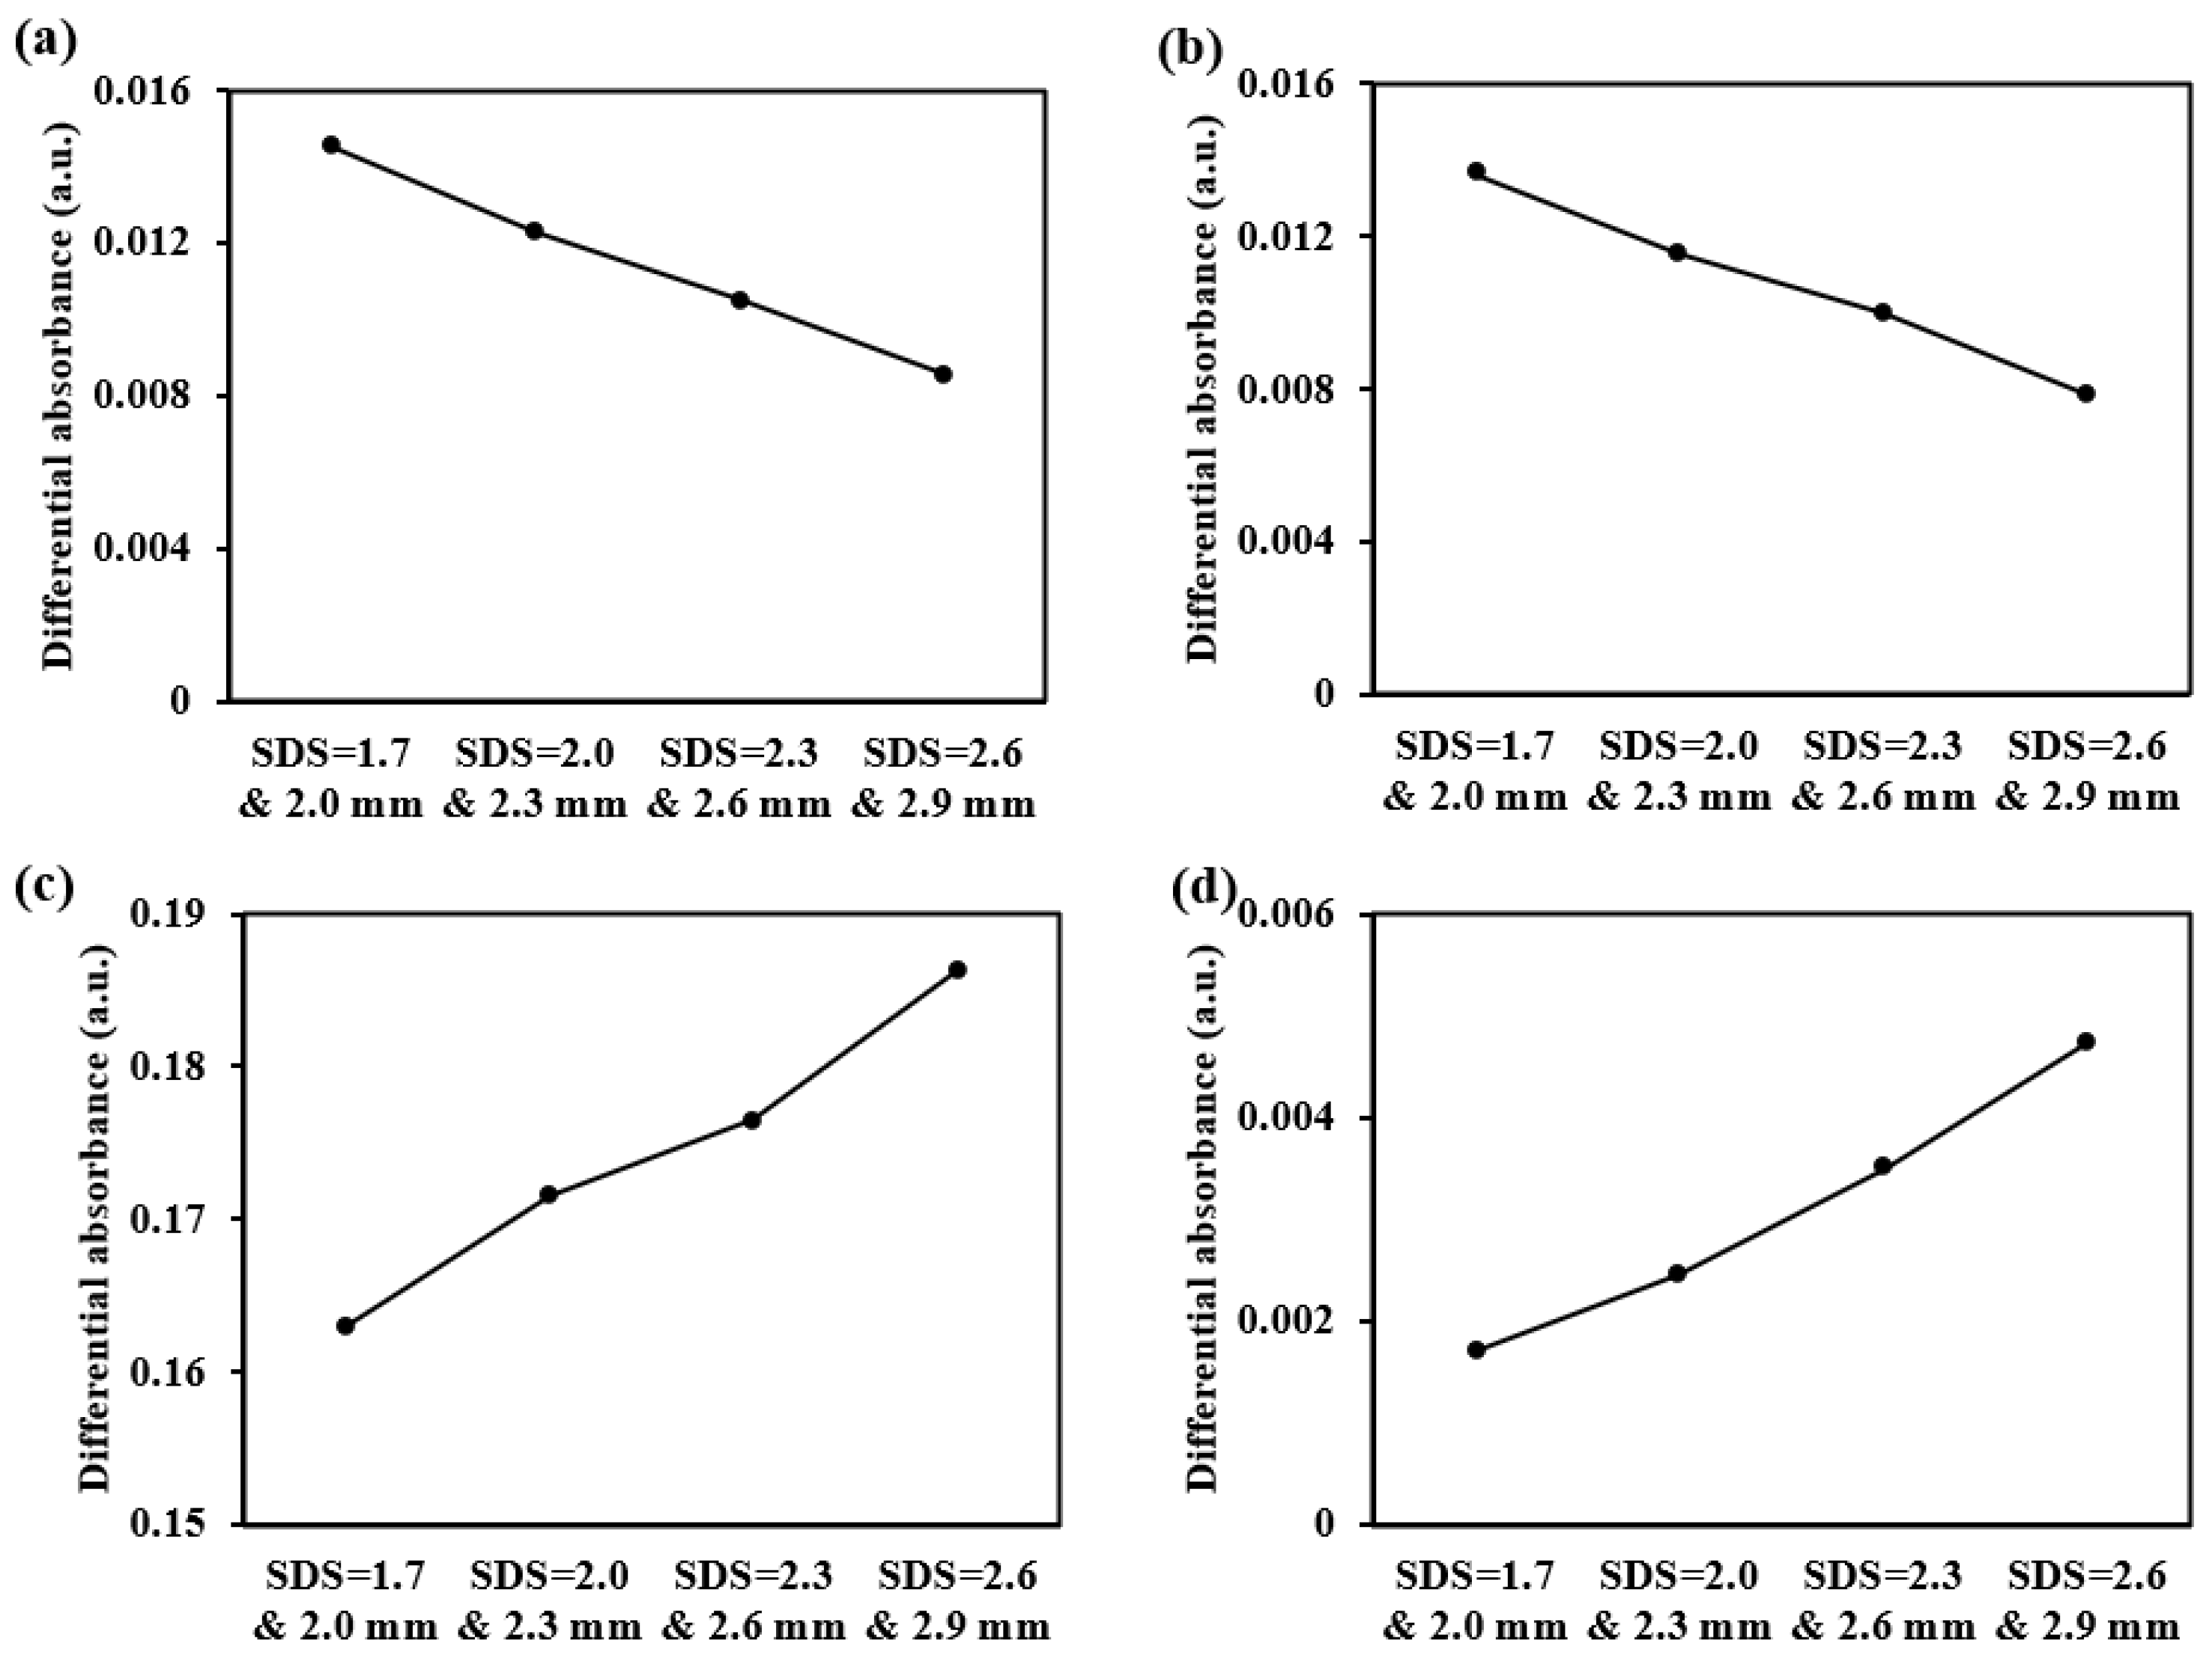
3.4.2. Available SDSs for Differential Measurements
- (1)
- The optical paths corresponding to the two SDSs should predominantly pass through the dermis.
- (2)
- The optical path difference between the two SDSs should be as large as possible.
- (3)
- The SNRD and of the two SDSs should meet the requirements of Equation (14) to acquire the desired .
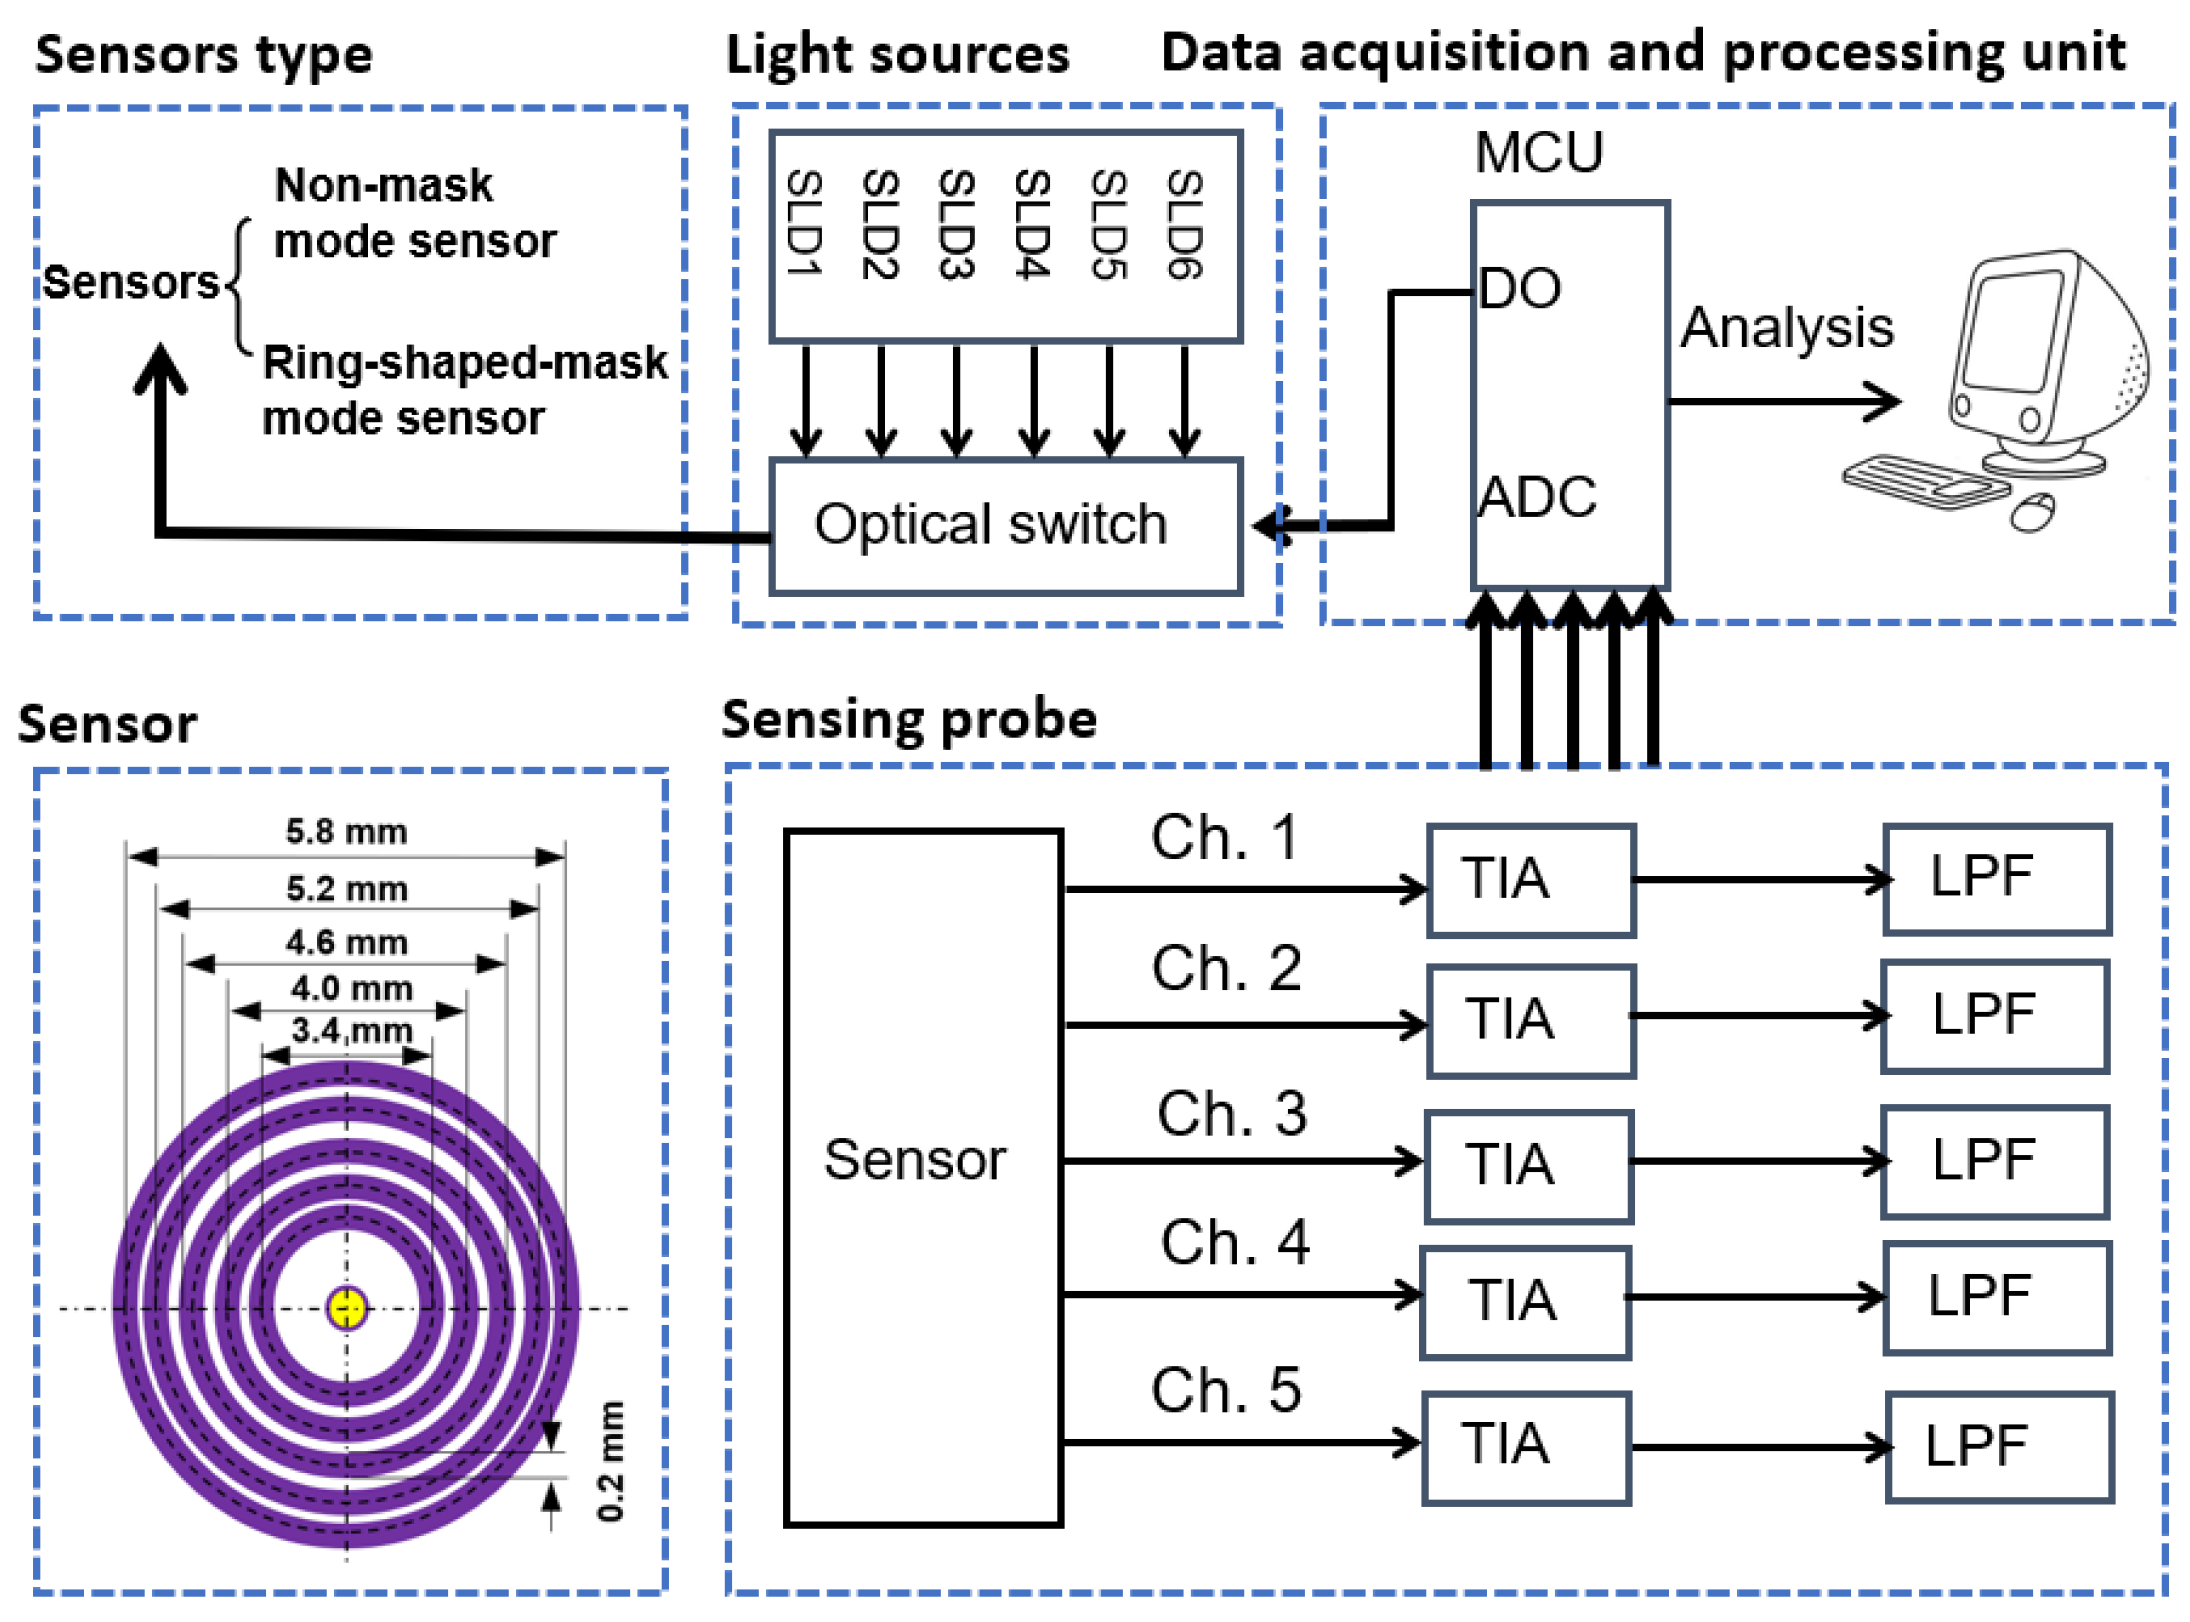
4. Performance Testing for Two Sensors with Five-Ring Detectors
4.1. Measurement System and Experiment Arrangements
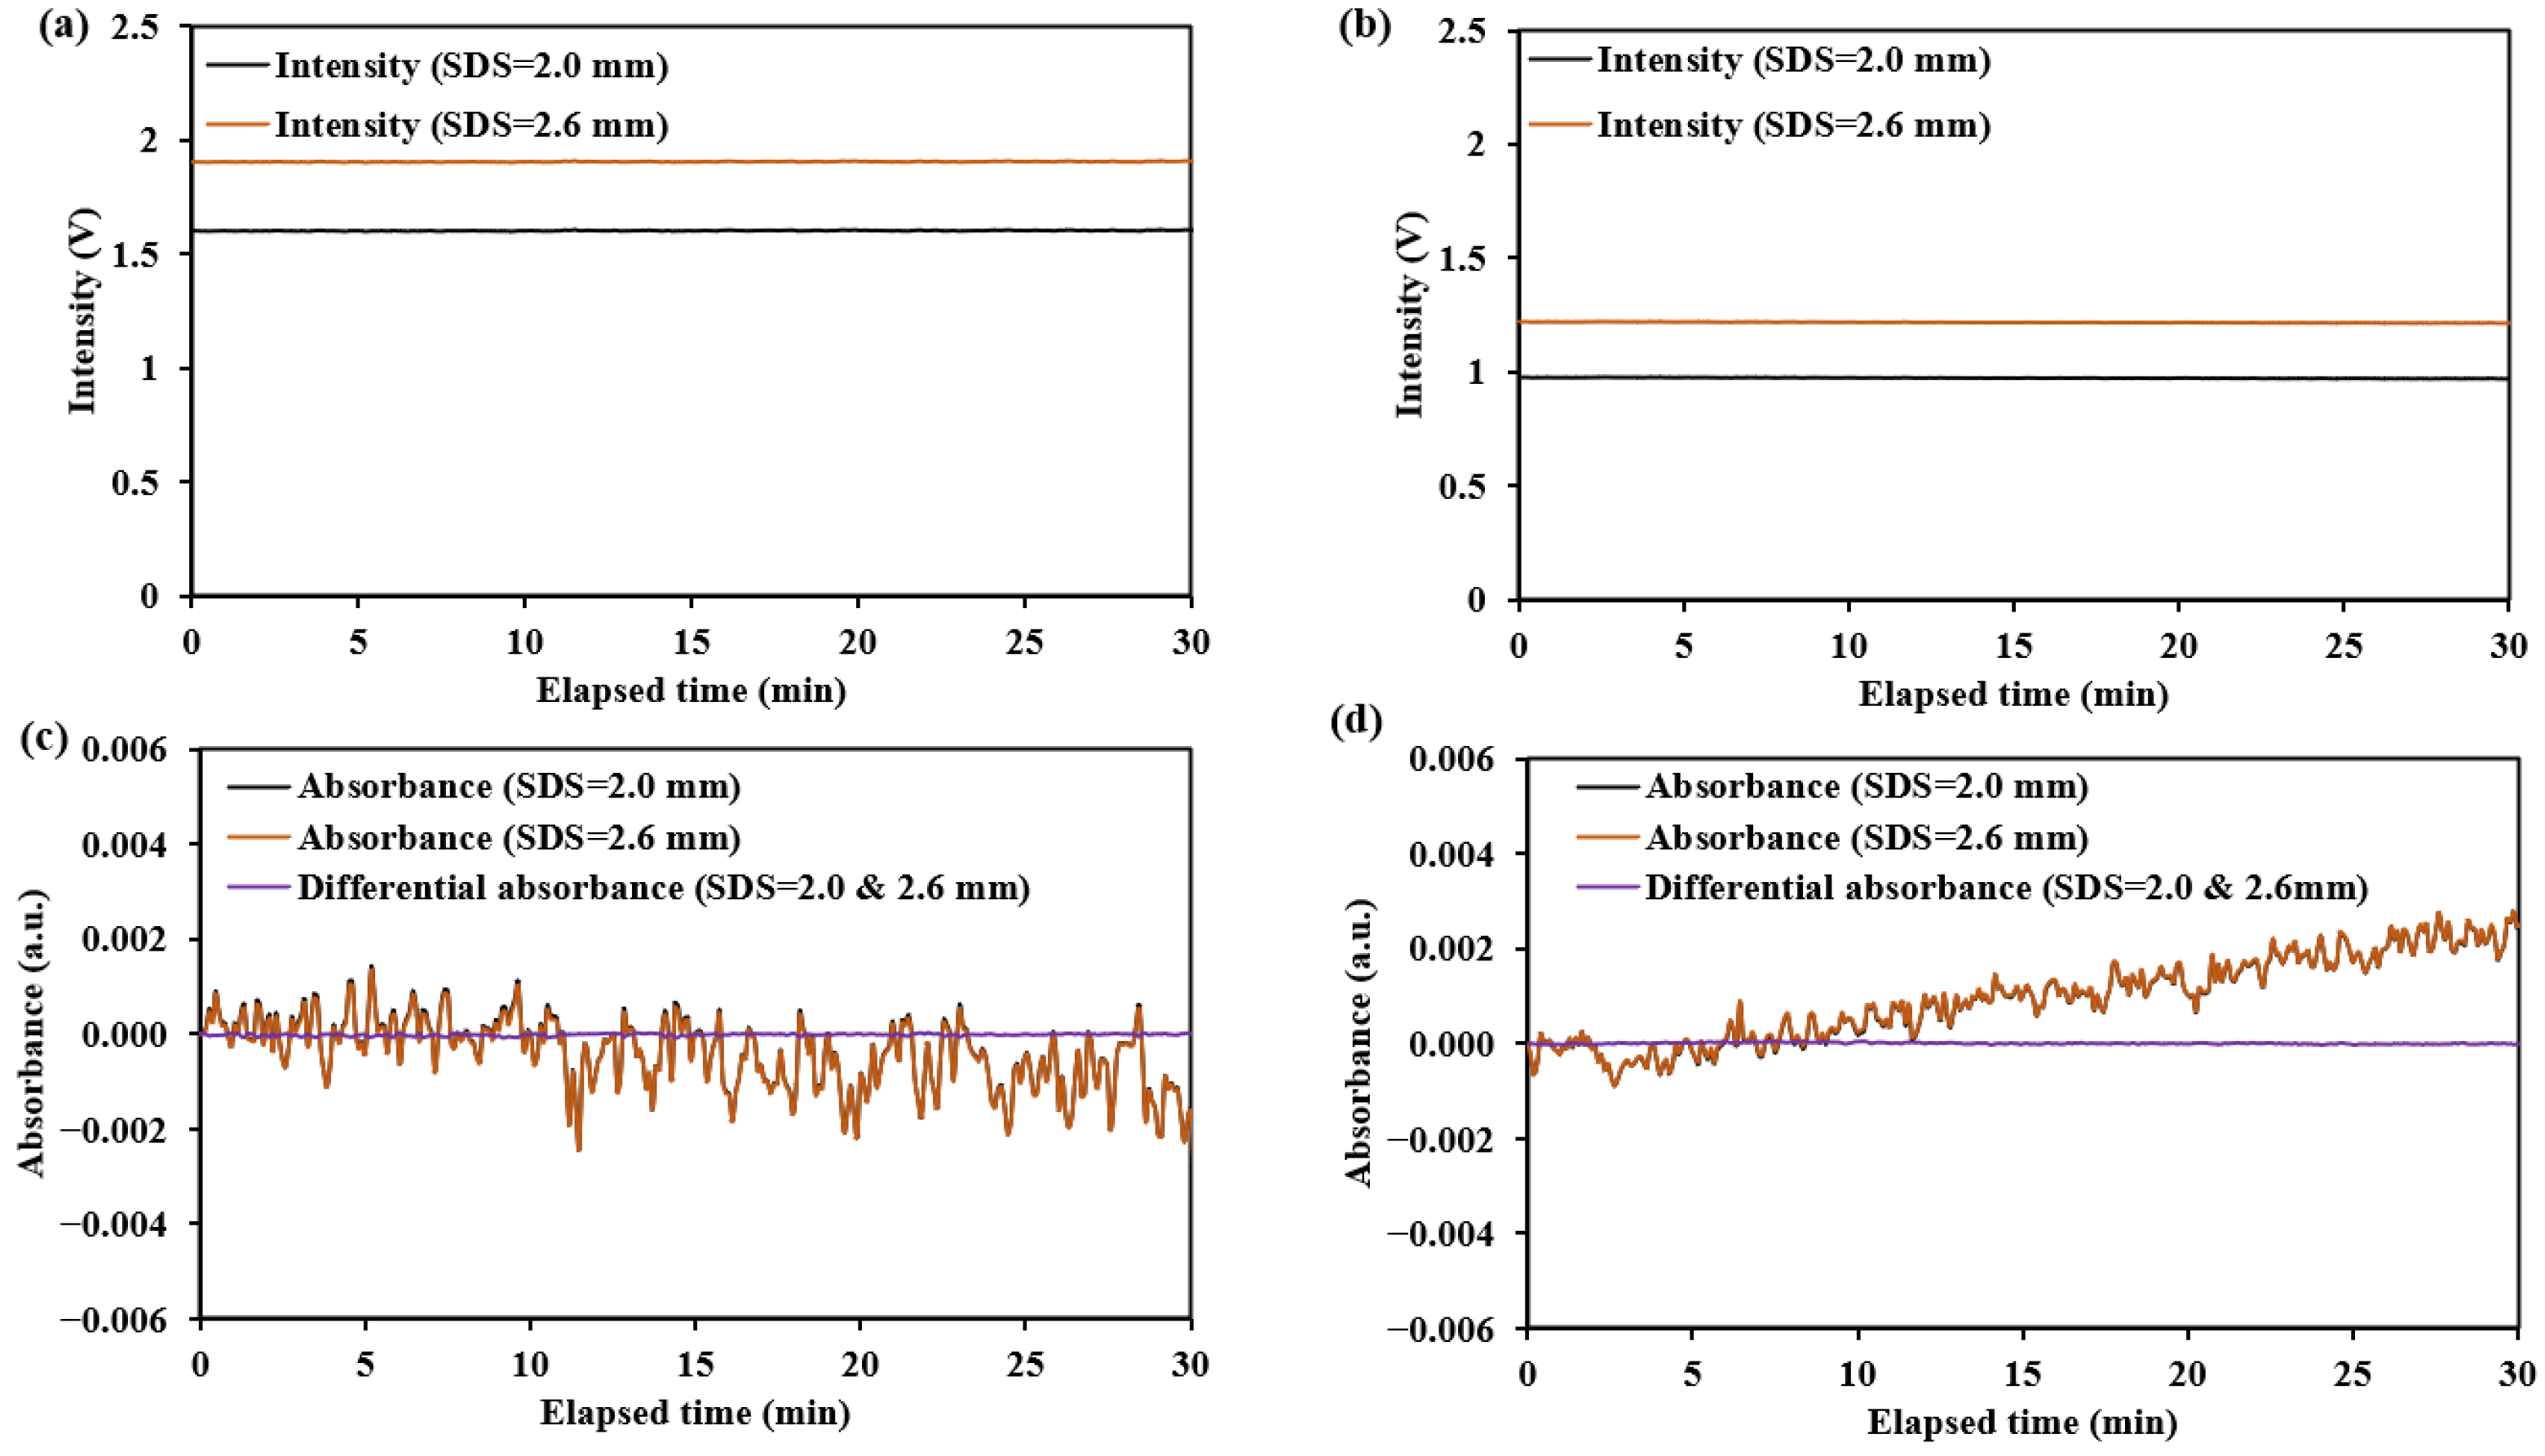
4.2. Test Results
5. Discussion and Conclusions
Author Contributions
Funding
Institutional Review Board Statement
Informed Consent Statement
Data Availability Statement
Conflicts of Interest
References
- Lipson, J.; Bernhardt, J.; Block, U.; Freeman, W.R.; Hofmeister, R.; Hristakeva, M.; Lenosky, T.; McNamara, R.; Petrasek, D.; Veltkamp, D.; et al. Requirements for calibration in noninvasive glucose monitoring by Raman spectroscopy. J. Diabetes Sci. Techn. 2009, 3, 233–241. [Google Scholar] [CrossRef] [PubMed]
- Uwadaira, Y.; Ikehata, A.; Momose, A.; Miura, M. Identification of informative bands in the short-wavelength NIR region for non-invasive blood glucose measurement. Biomed. Opt. Express 2016, 7, 2729–2737. [Google Scholar] [CrossRef] [PubMed]
- Lundsgaard-Nielsen, S.M.; Pors, A.; Banke, S.O.; Henriksen, J.E.; Hepp, D.K.; Weber, A. Critical-depth Raman spectroscopy enables home-use non-invasive glucose monitoring. PLoS ONE 2018, 13, e0197134. [Google Scholar] [CrossRef] [PubMed]
- Huang, J.; Zhang, Y.; Wu, J. Review of non-invasive continuous glucose monitoring based on impedance spectroscopy. Sens. Actuators A-Phys. 2020, 311, 112103. [Google Scholar] [CrossRef]
- Feng, R.; Geng, Z.; Li, A.; Chu, Y.; Wu, C.; Zhang, N.; Guo, X.; Zhang, J.; Wang, X.; Tang, F. Noninvasive blood glucose monitor via multi-sensor fusion and its clinical evaluation. Sens. Actuators B-Chem. 2021, 332, 129445. [Google Scholar] [CrossRef]
- Schwarz, Y.; Konvalina, N.; Tirosh, A. A pilot trial to evaluate the accuracy of a novel non-invasive glucose meter. Sensors 2021, 21, 6704. [Google Scholar] [CrossRef] [PubMed]
- Caduff, A.; Dewarrat, F.; Talary, M.; Stalder, G.; Heinemann, L.; Feldman, Y. Non-invasive glucose monitoring in patients with diabetes: A novel system based on impedance spectroscopy. Biosens. Bioelectron. 2006, 22, 598–604. [Google Scholar] [CrossRef] [PubMed]
- Han, T.; Liu, J.; Liu, R.; Chen, W.; Yao, M.; Liu, X.; Ge, Q.; Zhang, Z.; Li, C.; Wang, Y.; et al. In vivo near-infrared noninvasive glucose measurement and detection in humans. Appl. Spectrosc. 2022, 76, 1100–1111. [Google Scholar] [CrossRef]
- Petrov, G.I.; Doronin, A.; Whelan, H.T.; Meglinski, I.; Yakovlev, V.V. Human tissue color as viewed in high dynamic range optical spectral transmission measurements. Biomed. Opt. Express 2012, 3, 2154–2161. [Google Scholar] [CrossRef]
- Ge, Q.; Han, T.; Liu, R.; Zhang, Z.; Sun, D.; Liu, J.; Xu, K. Evaluation and validation on sensitivity of near-infrared diffuse reflectance in non-invasive human blood glucose measurement. Sensors 2024, 24, 5879. [Google Scholar] [CrossRef] [PubMed]
- Haus, J. Optical Sensors: Basics and Applications; Wiley-VCH: Weinheim, Germany, 2010; pp. 7–53. [Google Scholar]
- Bishnu, P.P. Handbook of Optical Sensors; CRC Press/Taylor & Francis Group: London, UK, 2014; pp. 38–74. [Google Scholar]
- Pizzoferrato, R. Optical Chemical Sensors: Design and Applications. Sensors 2023, 23, 5284. [Google Scholar] [CrossRef] [PubMed]
- Fu, M.; Weng, W.; Yuan, H. Numerical simulation of the effects of blood perfusion, water diffusion, and vaporization on the skin temperature and burn injuries. Numer. Heat Transf. A-Appl. 2014, 65, 1187–1203. [Google Scholar] [CrossRef]
- Liu, R.; Deng, B.; Chen, W.; Xu, K. Next step of non-invasive glucose monitor by NIR technique from the well controlled measuring condition and results. Opt. Quant. Electron. 2005, 37, 1305–1317. [Google Scholar] [CrossRef]
- Caduff, A.; Talary, M.S.; Zakharov, P. Cutaneous blood perfusion as a perturbing factor for noninvasive glucose monitoring. Diabetes Technol. Ther. 2010, 12, 1–9. [Google Scholar] [CrossRef] [PubMed]
- Hou, H.; Du, G.; Wang, Y.; Su, C.; Guo, L.; Chen, X. Noninvasive in vivo study of NADH fluorescence and its real-time intrinsic dynamical changes: Experiments and seven-layered skin model Monte Carlo simulations. J. Innov. Opt. Health Sci. 2022, 15, 2230006. [Google Scholar] [CrossRef]
- Iino, K.; Maruo, K.; Arimoto, H.; Hyodo, K.; Nakatani, T.; Yamada, Y. Monte Carlo simulation of near infrared reflectance spectroscopy in the wavelength range from 1000 nm to 1900 nm. Opt. Rev. 2003, 10, 600–606. [Google Scholar] [CrossRef]
- Althobaiti, M.; Al-Naib, I. Optimization of dual-channel near-infrared non-invasive glucose level measurement sensors based on Monte-Carlo simulations. IEEE Photonics J. 2021, 13, 1–9. [Google Scholar] [CrossRef]
- Han, G.; Yu, X.; Xia, D.; Liu, R.; Liu, J.; Xu, K. Preliminary clinical validation of a differential correction method for improving measurement accuracy in noninvasive measurement of blood glucose using near-infrared spectroscopy. Appl. Spectrosc. 2017, 71, 2177–2186. [Google Scholar] [CrossRef] [PubMed]
- Rachim, V.P.; Chung, W.Y. Wearable-band type visible-near infrared optical biosensor for non-invasive blood glucose monitoring. Sens. Actuators B-Chem. 2019, 286, 173–180. [Google Scholar] [CrossRef]
- Argüello-Prada, E.J.; Bolaños, S.M. On the role of perfusion index for estimating blood glucose levels with ultrasound-assisted and conventional finger photoplethysmography in the near-infrared wavelength range. Biomed. Signal Proces. Control 2023, 86, 105338. [Google Scholar] [CrossRef]
- Tronstad, C.; Elvebakk, O.; Staal, O.M.; Kalvøy, H.; Høgetveit, J.O.; Jenssen, T.G.; Birkeland, K.I.; Martinsen, Ø.G. Non-invasive prediction of blood glucose trends during hypoglycemia. Anal. Chim. Acta 2019, 1052, 37–48. [Google Scholar] [CrossRef] [PubMed]
- Aloraynan, A.; Rassel, S.; Xu, C.; Ban, D. A single wavelength mid-infrared photoacoustic spectroscopy for noninvasive glucose detection using machine learning. Biosensors 2022, 12, 166. [Google Scholar] [CrossRef] [PubMed]
- Liu, J.; Liu, R.; Xu, K. Accuracy of noninvasive glucose sensing based on near-infrared spectroscopy. Appl. Spectrosc. 2015, 69, 1313–1318. [Google Scholar] [CrossRef]
- Ge, Q.; Liu, W.; Lu, Y.; Chen, W.; Han, T.; Liu, J. Skin temperature measurement based on diffuse reflectance light at scattering variation independent source-detector separation. Infrared Phys. Technol. 2024, 139, 105295. [Google Scholar] [CrossRef]
- Powell, J. Skin physiology. Women’s Health Med. 2007, 5, 193–196. [Google Scholar] [CrossRef]
- Zherebtsov, E.; Dremin, V.; Popov, A.; Doronin, A.; Kurakina, D.; Kirillin, M.; Meglinski, I.; Bykov, A. Hyperspectral imaging of human skin aided by artificial neural networks. Biomed. Opt. Express 2019, 10, 3545–3559. [Google Scholar] [CrossRef] [PubMed]
- Wang, L.; Jacques, S.L.; Zheng, L. MCML—Monte Carlo modeling of light transport in multi-layered tissues. Comput. Methods Programs Biomed. 1995, 47, 131–146. [Google Scholar] [CrossRef]
- Fang, Q.; Boas, D.A. Monte Carlo simulation of photon migration in 3D turbid media accelerated by graphics processing units. Opt. Express 2009, 17, 20178–20190. [Google Scholar] [CrossRef] [PubMed]
- Yao, R.; Intes, X.; Fang, Q. Direct approach to compute Jacobians for diffuse optical tomography using perturbation Monte Carlo-based photon “replay”. Biomed. Opt. Express 2018, 9, 4588–4603. [Google Scholar] [CrossRef]
- Natural Phenomena Simulation Group. Available online: https://www.npsg.uwaterloo.ca/index.php (accessed on 18 December 2024).
- Bosschaart, N.; Edelman, G.J.; Aalders, M.C.G.; van Leeuwen, T.G.; Faber, D.J. A literature review and novel theoretical approach on the optical properties of whole blood. Lasers Med. Sci. 2014, 29, 453–479. [Google Scholar] [CrossRef]
- Nunez, A.S. A Physical Model of Human Skin and Its Application for Search and Rescue. Ph.D. Thesis, Air Force Institute of Technology, Wright-Patterson, OH, USA, 2009. [Google Scholar]
- Meglinski, I.V.; Matcher, S.J. Computer simulation of the skin reflectance spectra. Comput. Methods Programs Biomed. 2003, 70, 179–186. [Google Scholar] [CrossRef] [PubMed]
- Troy, T.L.; Thennadil, S.N. Optical properties of human skin in the near infrared wavelength range of 1000 to 2200 nm. J. Biomed. Opt. 2001, 6, 167–176. [Google Scholar] [CrossRef] [PubMed]
- Wilson, R.H.; Nadeau, K.P.; Jaworski, F.B.; Tromberg, B.J.; Durkin, A.J. Review of short-wave infrared spectroscopy and imaging methods for biological tissue characterization. J. Biomed. Opt. 2015, 20, 030901. [Google Scholar] [CrossRef] [PubMed]
- Späth, M.; Rohde, M.; Ni, D.; Knieling, F.; Stelzle, F.; Schmidt, M.; Klämpfl, F.; Hohmann, M. The influence of the optical properties on the determination of capillary diameters. Sci. Rep. 2022, 12, 270. [Google Scholar] [CrossRef] [PubMed]
- Larin, K.V.; Motamedi, M.; Ashitkov, T.V.; Esenaliev, R.O. Specificity of noninvasive blood glucose sensing using optical coherence tomography technique: A pilot study. Phys. Med. Biol. 2003, 48, 1371. [Google Scholar] [CrossRef] [PubMed]
- Wang, Z.; Zhou, L.; Liu, T.; Huan, K.; Jia, X. Development of non-invasive blood glucose regression based on near-infrared spectroscopy combined with a deep-learning method. J. Phys. D Appl. Phys. 2022, 55, 215401. [Google Scholar] [CrossRef]
- Fu, Y.; Huang, M.; Chen, X. Fingertip capillary dynamic near infrared spectrum (DNIRS) measurement combined with multivariate linear modification algorithm for noninvasive blood glucose monitoring. Vib. Spectrosc. 2021, 113, 103223. [Google Scholar] [CrossRef]


| Design Key Points | Design Requirements | Design Proposals |
|---|---|---|
| Depth resolution | To achieve the target detection depth, such as the detection depth mainly concentrated in the dermis. | Different SDSs are proposed to detect different target tissue depths across multi-wavelengths. |
| Detection SNR | To achieve the BGC signal resolution requirements, such as distinguishing a 1 mM BGC change. | Design of the detector’s photosensitive area shape and size. |
| The measurement process allows the tissue to change within a certain range, such as being insensitive to a certain tissue deformation. | Differential measurement strategy. | |
| Human–sensor interface coupling | Good detection and not easy to sweat, such as the sensor not being in contact with the skin and presenting the contact detection effect. | The skin–detector interface is air. Mask structure design to prevent spatial crosstalk between detectors. |
| Type | SDS (mm) | Ring Width (mm) | |
|---|---|---|---|
| Setup 1 | Five-ring detectors | 1.7, 2.0, 2.3, 2.6, 2.9 | 0.2, 0.2, 0.2, 0.2, 0.2 |
| Setup 2 | Four-ring detectors | 1.7, 2.0, 2.4, 2.8 | 0.2, 0.2, 0.3, 0.4 |
| Setup 3 | Three-ring detectors | 1.75, 2.3, 2.85 | 0.3, 0.3, 0.3 |
| Setup 4 | 1.7, 2.2, 2.8 | 0.2, 0.3, 0.4 |
| Single SDS | A Set of SDSs | |
|---|---|---|
| SDS (mm) | 1.7–2.9 | 3–5 SDSs within the range of 1.7–2.9 (In Table 2) |
| Ring width (mm) | 0.2–1.4 | 0.2–0.4 |
| Application Scenario | Type | ID | SDS (mm) | Ring Width (mm) | Optional Two SDSs for Differential Measurement |
|---|---|---|---|---|---|
| Whole dermis detection | Two-ring detectors | SDS#1 | 1.7 | 0.2 | SDS#1&SDS#2 |
| SDS#2 | 2.7–2.9 | 0.6 (for SDS = 2.7) 0.2 (for SDS = 2.9) | |||
| Sub-layers for dermis detection | Three-ring detectors | SDS#1 | 1.7 | 0.2 | SDS#1&SDS#2 SDS#2&SDS#3 |
| SDS#2 | 2.2 | 0.3 | |||
| SDS#3 | 2.8 | 0.4 | |||
| Four-ring detectors | SDS#1 | 1.7 | 0.2 | SDS#1&SDS#2 SDS#2&SDS#3 SDS#3&SDS#4 | |
| SDS#2 | 2.0 | 0.2 | |||
| SDS#3 | 2.4 | 0.3 | |||
| SDS#4 | 2.8 | 0.4 | |||
| Five-ring detectors | SDS#1 | 1.7 | 0.2 | SDS#1&SDS#2 SDS#2&SDS#3 SDS#3&SDS#4 SDS#4&SDS#5 | |
| SDS#2 | 2.0 | 0.2 | |||
| SDS#3 | 2.3 | 0.2 | |||
| SDS#4 | 2.6 | 0.2 | |||
| SDS#5 | 2.9 | 0.2 |
| Non-Mask Mode Sensor | Ring-Shaped-Mask Mode Sensor | |||
|---|---|---|---|---|
| Single SDS (2.0 mm) | Differential SDSs (2.0&2.6 mm) | Single SDS (2.0 mm) | Differential SDSs (2.0&2.6 mm) | |
| The 30 min SNR for the diffuse reflectance standard | 1341:1 | 46,783:1 | 1101:1 | 55,751:1 |
| The 30 min SNR for human forearm skin | 377:1 | 1732:1 | 321:1 | 1366:1 |
| Simulated BGC sensitivity (a.u./mM) | −0.0012 | −0.001 | −0.0023 | −0.002 |
| Estimated limit detection accuracy (mM) | 2.21 | 0.58 | 1.35 | 0.37 |
Disclaimer/Publisher’s Note: The statements, opinions and data contained in all publications are solely those of the individual author(s) and contributor(s) and not of MDPI and/or the editor(s). MDPI and/or the editor(s) disclaim responsibility for any injury to people or property resulting from any ideas, methods, instructions or products referred to in the content. |
© 2025 by the authors. Licensee MDPI, Basel, Switzerland. This article is an open access article distributed under the terms and conditions of the Creative Commons Attribution (CC BY) license (https://creativecommons.org/licenses/by/4.0/).
Share and Cite
Liu, W.; Han, T.; Chen, W.; Chen, J.; Ge, Q.; Sun, D.; Liu, J.; Xu, K. Design Key Points of High-Performance Diffuse Reflectance Optical Sensors for Non-Invasive Blood Glucose Measurement. Sensors 2025, 25, 998. https://doi.org/10.3390/s25040998
Liu W, Han T, Chen W, Chen J, Ge Q, Sun D, Liu J, Xu K. Design Key Points of High-Performance Diffuse Reflectance Optical Sensors for Non-Invasive Blood Glucose Measurement. Sensors. 2025; 25(4):998. https://doi.org/10.3390/s25040998
Chicago/Turabian StyleLiu, Wenbo, Tongshuai Han, Wenliang Chen, Jiayu Chen, Qing Ge, Di Sun, Jin Liu, and Kexin Xu. 2025. "Design Key Points of High-Performance Diffuse Reflectance Optical Sensors for Non-Invasive Blood Glucose Measurement" Sensors 25, no. 4: 998. https://doi.org/10.3390/s25040998
APA StyleLiu, W., Han, T., Chen, W., Chen, J., Ge, Q., Sun, D., Liu, J., & Xu, K. (2025). Design Key Points of High-Performance Diffuse Reflectance Optical Sensors for Non-Invasive Blood Glucose Measurement. Sensors, 25(4), 998. https://doi.org/10.3390/s25040998