Article

Humidity-Sensing Performance of TiO2/RGO and α-Fe2O3/RGO Composites

School of Physical and Electronic Sciences, Changsha University of Science and Technology, Changsha 410114, China
*
Author to whom correspondence should be addressed.
Sensors 2025, 25(3), 691; https://doi.org/10.3390/s25030691
Submission received: 28 December 2024 / Revised: 18 January 2025 / Accepted: 22 January 2025 / Published: 24 January 2025
(This article belongs to the Special Issue Materials Engineering and Electronic Sensing)

Abstract

This study investigates the humidity-sensing properties of two semiconductor metal oxide (SMO)-reduced graphene oxide (RGO) nanocomposites: TiO2/RGO and α-Fe2O3/RGO, at room temperature. Both nanocomposites are synthesized via hydrothermal methods and coated onto printed circuit board (PCB) interdigital electrodes to construct humidity sensors. The surface morphology and crystallographic structure of the materials are characterized using field emission scanning electron microscopy (FESEM) and X-ray diffraction (XRD). The sensors are tested across a humidity range of 11%RH to 97%RH, and the impedance is measured over a frequency range of 1 Hz to 1 MHz. The results show that both TiO2/RGO and α-Fe2O3/RGO exhibit favorable humidity-sensing performance at room temperature. The sensitivity and humidity hysteresis of TiO2/RGO are 12.2 MΩ/%RH and 3.811%RH, respectively, while those of α-Fe2O3/RGO are 0.826 MΩ/%RH and 8.229%RH. The response and recovery times of TiO2/RGO are 72 s and 99 s, respectively, while those of α-Fe2O3/RGO are 48 s and 54 s. Both sensors demonstrate good repeatability and stability. These findings suggest that SMO/RGO nanocomposites are promising materials for the development of low-cost, high-sensitivity, and stable humidity sensors.

1. Introduction

Humidity sensors are of great significance in the fields of medicine, biochemistry, industrial production, animal husbandry and agriculture, scientific research, and food processing [1,2,3]. As the basis and core of humidity sensors, the moisture-sensitive materials directly or indirectly absorb the water molecules in the detected environment, which changes the chemical or physical properties of the materials, thereby achieving the purpose of humidity detection. Although several novel humidity sensors have been developed in recent years, such as Quartz Crystal Microbalance (QCM) sensors, Optical Fiber Humidity Sensors, Capacitive Micro-machined Ultrasonic Transducer (CMUT) sensors, and Film Bulk Acoustic Resonator (FBAR) sensors [4], that demonstrate significant potential for achieving higher sensitivity, accuracy, and stability, the classic electrical humidity sensors based on the resistance, capacitance, or impedance characteristics of sensitive materials remain the most widely used. These sensors continue to attract considerable attention due to their simple structures, low cost, small size, and well-established application solutions. Furthermore, the development of new sensitive materials, such as nanocomposite materials, has led to continuous performance improvements, further enhancing their practical value.
The sensitive materials used for electrical humidity sensors mainly include electrolytes [5], organic polymers [6], metal oxides [7], ceramics [8], and mixed materials [9]. Among them, organic polymers are the most traditional materials, and semiconductor metal oxide (SMO) materials are widely studied due to their great variety, simple preparation process, and good performance. SMO materials respond to many factors in the environment. Humidity, temperature, pressure, illumination, the concentration of oxidizing or reducing gases, and so forth can change the condition of the surface of the materials [10] and result in changes in the electrical properties of the materials. The good electrical response of SMO materials to environmental humidity has promoted the development and application of SMO humidity sensors. However, the humidity-sensing performance of single-SMO material is usually limited, which limits the application of SMO humidity sensors. On the other side, composite materials based on multiple common materials or a mixture of common materials with novel low-dimensional materials show great potential for providing superior sensing performance [9].
As a new type of carbon nanomaterials, reduced graphene oxide (RGO) has high electron mobility, high electrical conductivity, and other superior characteristics. Meanwhile, according to previous research, it is found that RGO material also has some humidity sensitivity [11]. Due to the unique nano-structure and physical and chemical properties of RGO, there is a potential that the combination of RGO and SMO materials has a humidity-sensing performance improvement over pure SMO materials. In [12], Yan H et al. synthesized SnO2/RGO nanocomposite materials using a one-step hydrothermal method. Experiment results reveal that the addition of RGO effectively improves the performance of the sensor. The SnO2/RGO nanocomposite materials with different RGO doping ratios show different humidity-sensing properties. For instance, the response and the recovery time of the 1 wt% SnO2/RGO are 180 s and 8 s, respectively, which is approximately twice those of 2 wt% SnO2/RGO. This further illustrates the positive impact of adding RGO. In [13], Morsy M et al. synthesized RGO/Fe2O3 nanocomposite materials using a precipitation technique and lyophilization process. The response and the recovery time of the RGO/Fe2O3 sensor are 63 s and 48 s, respectively. Compared with Fe2O3, the introduction of RGO produces more active sites, such as vacancies and defects, which promote the adsorption of water molecules and, therefore, improve the sensitivity of the sensor. In addition to metal oxide materials, hydrophobic polymers can also form sensing composite materials with RGO. In [14], Fanyu Y et al. also studied the humidity-sensing properties of RGO/SnO2 composites prepared using a hydrothermal method. It was stated that, compared with SnO2, the incorporation of RGO makes the RGO/SnO2 composites have a larger specific surface area and more hydrophilic functional groups and oxygen vacancy defects, which makes the sensor have better linearity and smaller humidity hysteresis. In [15], a flexible humidity sensor was fabricated based on polyvinylidene fluoride PVDF/RGO composite materials using a solvent casting method. Compared with PVDF, the sensor demonstrates higher sensitivity, faster response/recovery times (21/26 s), better stability, and smaller hysteresis within a relative humidity (RH) range of 11–97%. As the concentration of RGO increases, the sensitivity of the sensor increases accordingly and reaches 98.99% at 0.3 vol%.
In this paper, we focus mainly on SMO/RGO composite materials, specifically, TiO2/RGO and α-Fe2O3/RGO. The humidity-sensing properties of the two composite materials at room temperature are examined, including sensitivity, hysteresis, response/recovery time, impedance characteristics, repeatability, and stability. Also, the differences between the two materials are analyzed and explained.

2. Experiment

2.1. Raw Materials and Instrument

Chemicals used in experiments were all of analytical grade (AR). Graphene oxide (GO) aqueous solution (5 mg/mL) was purchased from Tanfeng Graphene Technology Co., Ltd. in Suzhou, China. Tetrabutyl titanate aqueous solution (1 g/mL) and ferric chloride hexahydrate were both obtained from Wuxi Yatai United Chemical Co., Ltd. in Wuxi, China. Hydrochloric acid was purchased from Anzexin Technology Co., Ltd. in Shenzhen, China. Anhydrous ethanol was purchased from Xirong Chemical Co., Ltd. in Shantou, China.
The Box furnace (KSL-1200X-A2, Jingke, Hangzhou, China) was used for material calcination. The physical phase of the samples was characterized by X-ray diffraction (XRD, Rigaku Ultima IV, Rigaku Corporation, Tokyo, Japan). The morphology and microstructure of the samples were studied by scanning electron microscope (SEM, apro2, Thermo Fisher, Tokyo, Japan). Impedance spectroscopy tests were conducted using an electrochemical workstation (CS350H, Coster, Wuhan, China).

2.2. Synthesis of Materials

Synthesis of TiO2/RGO: Firstly, 4 mL of GO aqueous solution and 10 mL of anhydrous ethanol were added to 20 mL of deionized water, and the mixed solution was magnetically stirred for 20 min to ensure uniformity, resulting in solution A. Secondly, 10 mL of tertbutyl titanate aqueous solution was dispersed in 20 mL of anhydrous ethanol, and hydrochloric acid was added to adjust the pH value to approximately 3. After magnetic stirring for 30 min, solution B was obtained. Thirdly, solution A and solution B were mixed together and magnetically stirred again and then transferred to a Teflon-lined hydrothermal reactor. Then, the whole set was placed into a blast drying oven for a hydrothermal reaction at 160 °C for 12 h. Finally, After the precipitate cooled to room temperature, it was washed repeatedly with deionized water and anhydrous ethanol to remove impurities and then dried at 80 °C for 2 h. The washed and dried precipitate was then ground into powder, and the TiO2/RGO composite was obtained. The RGO accounts for 1% of the total mass in the TiO2/RGO composite.
Synthesis of α-Fe2O3/RGO: Firstly, 1.08 g of ferric chloride hexahydrate was dissolved into 30 mL of deionized water and magnetically stirred for 20 min, and therefore, solution A was obtained. Secondly, 10 mL of GO aqueous solution was added to 30 mL of deionized water. After 10 min magnetic stirring, solution B was obtained. Thirdly, solutions A and solution B were mixed together and transferred to a Teflon-lined hydrothermal reactor, which was then placed into a blast drying oven for a hydrothermal reaction at 180 °C for 10 h. Finally, after the precipitate cooled to room temperature, it was processed in the same way as mentioned above, and the α-Fe2O3/RGO composite was obtained. The RGO accounts for 4.5% of the total mass in the α-Fe2O3/RGO composite.

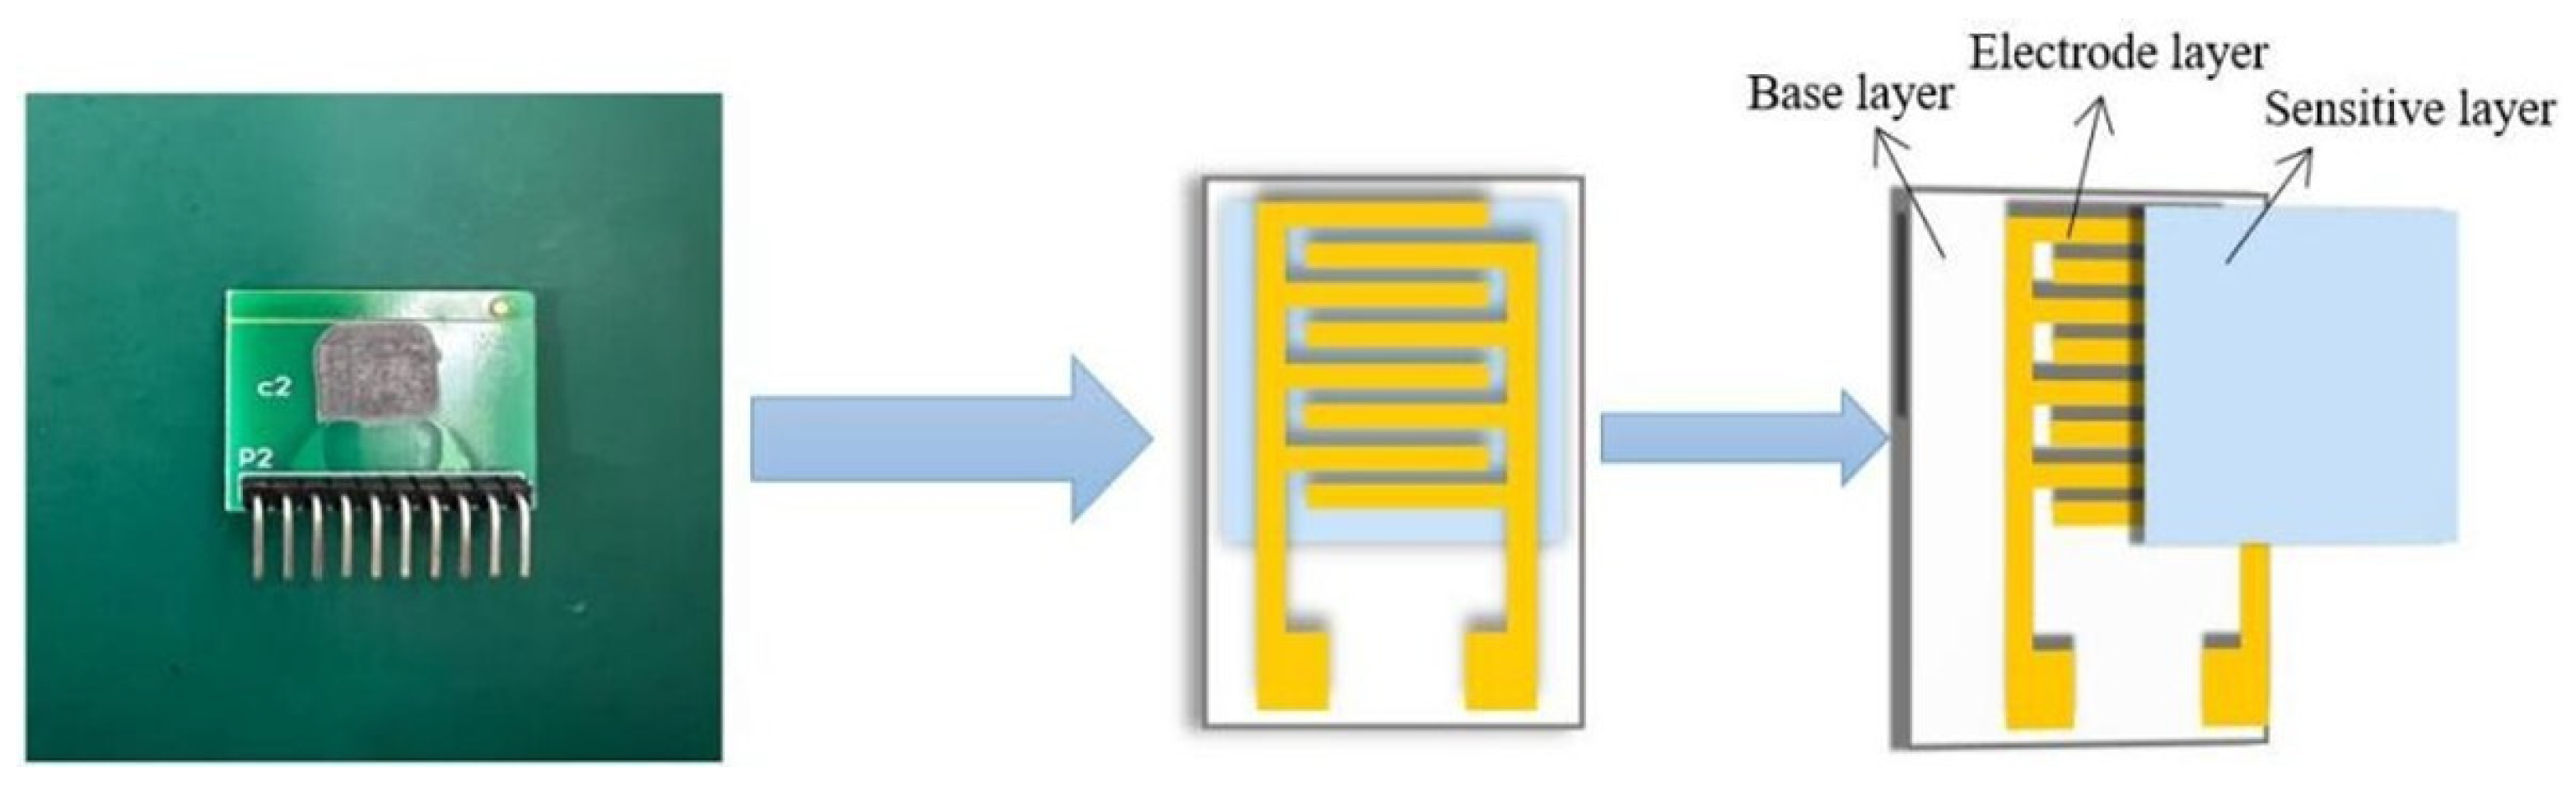
2.3. Fabrication of Sensors

The regular printed circuit board (PCB) was used to fabricate the sensor substrate with Cu-Sn interdigital electrodes, which is depicted in Figure 1. The electrode length was designed to be 7.62 mm, and both the width and gap of the interdigitated fingers were designed to be 0.254 mm. The sensor fabrication process is as follows: Firstly, an appropriate amount of the prepared composite materials was placed in an agate mortar, and a small amount of anhydrous ethanol was added to disperse the materials into a slurry. Secondly, the mixed slurry was brushed onto the PCB substrate to cover the electrodes. The PCB substrate was then placed into an electric blast drying oven at 60 °C for 2 h to remove ethanol molecules and possible water molecules. As a result, the humidity sensor was obtained. Finally, the newly made sensor was placed on a heating stage at 70 °C for 8 h for aging to enhance stability.

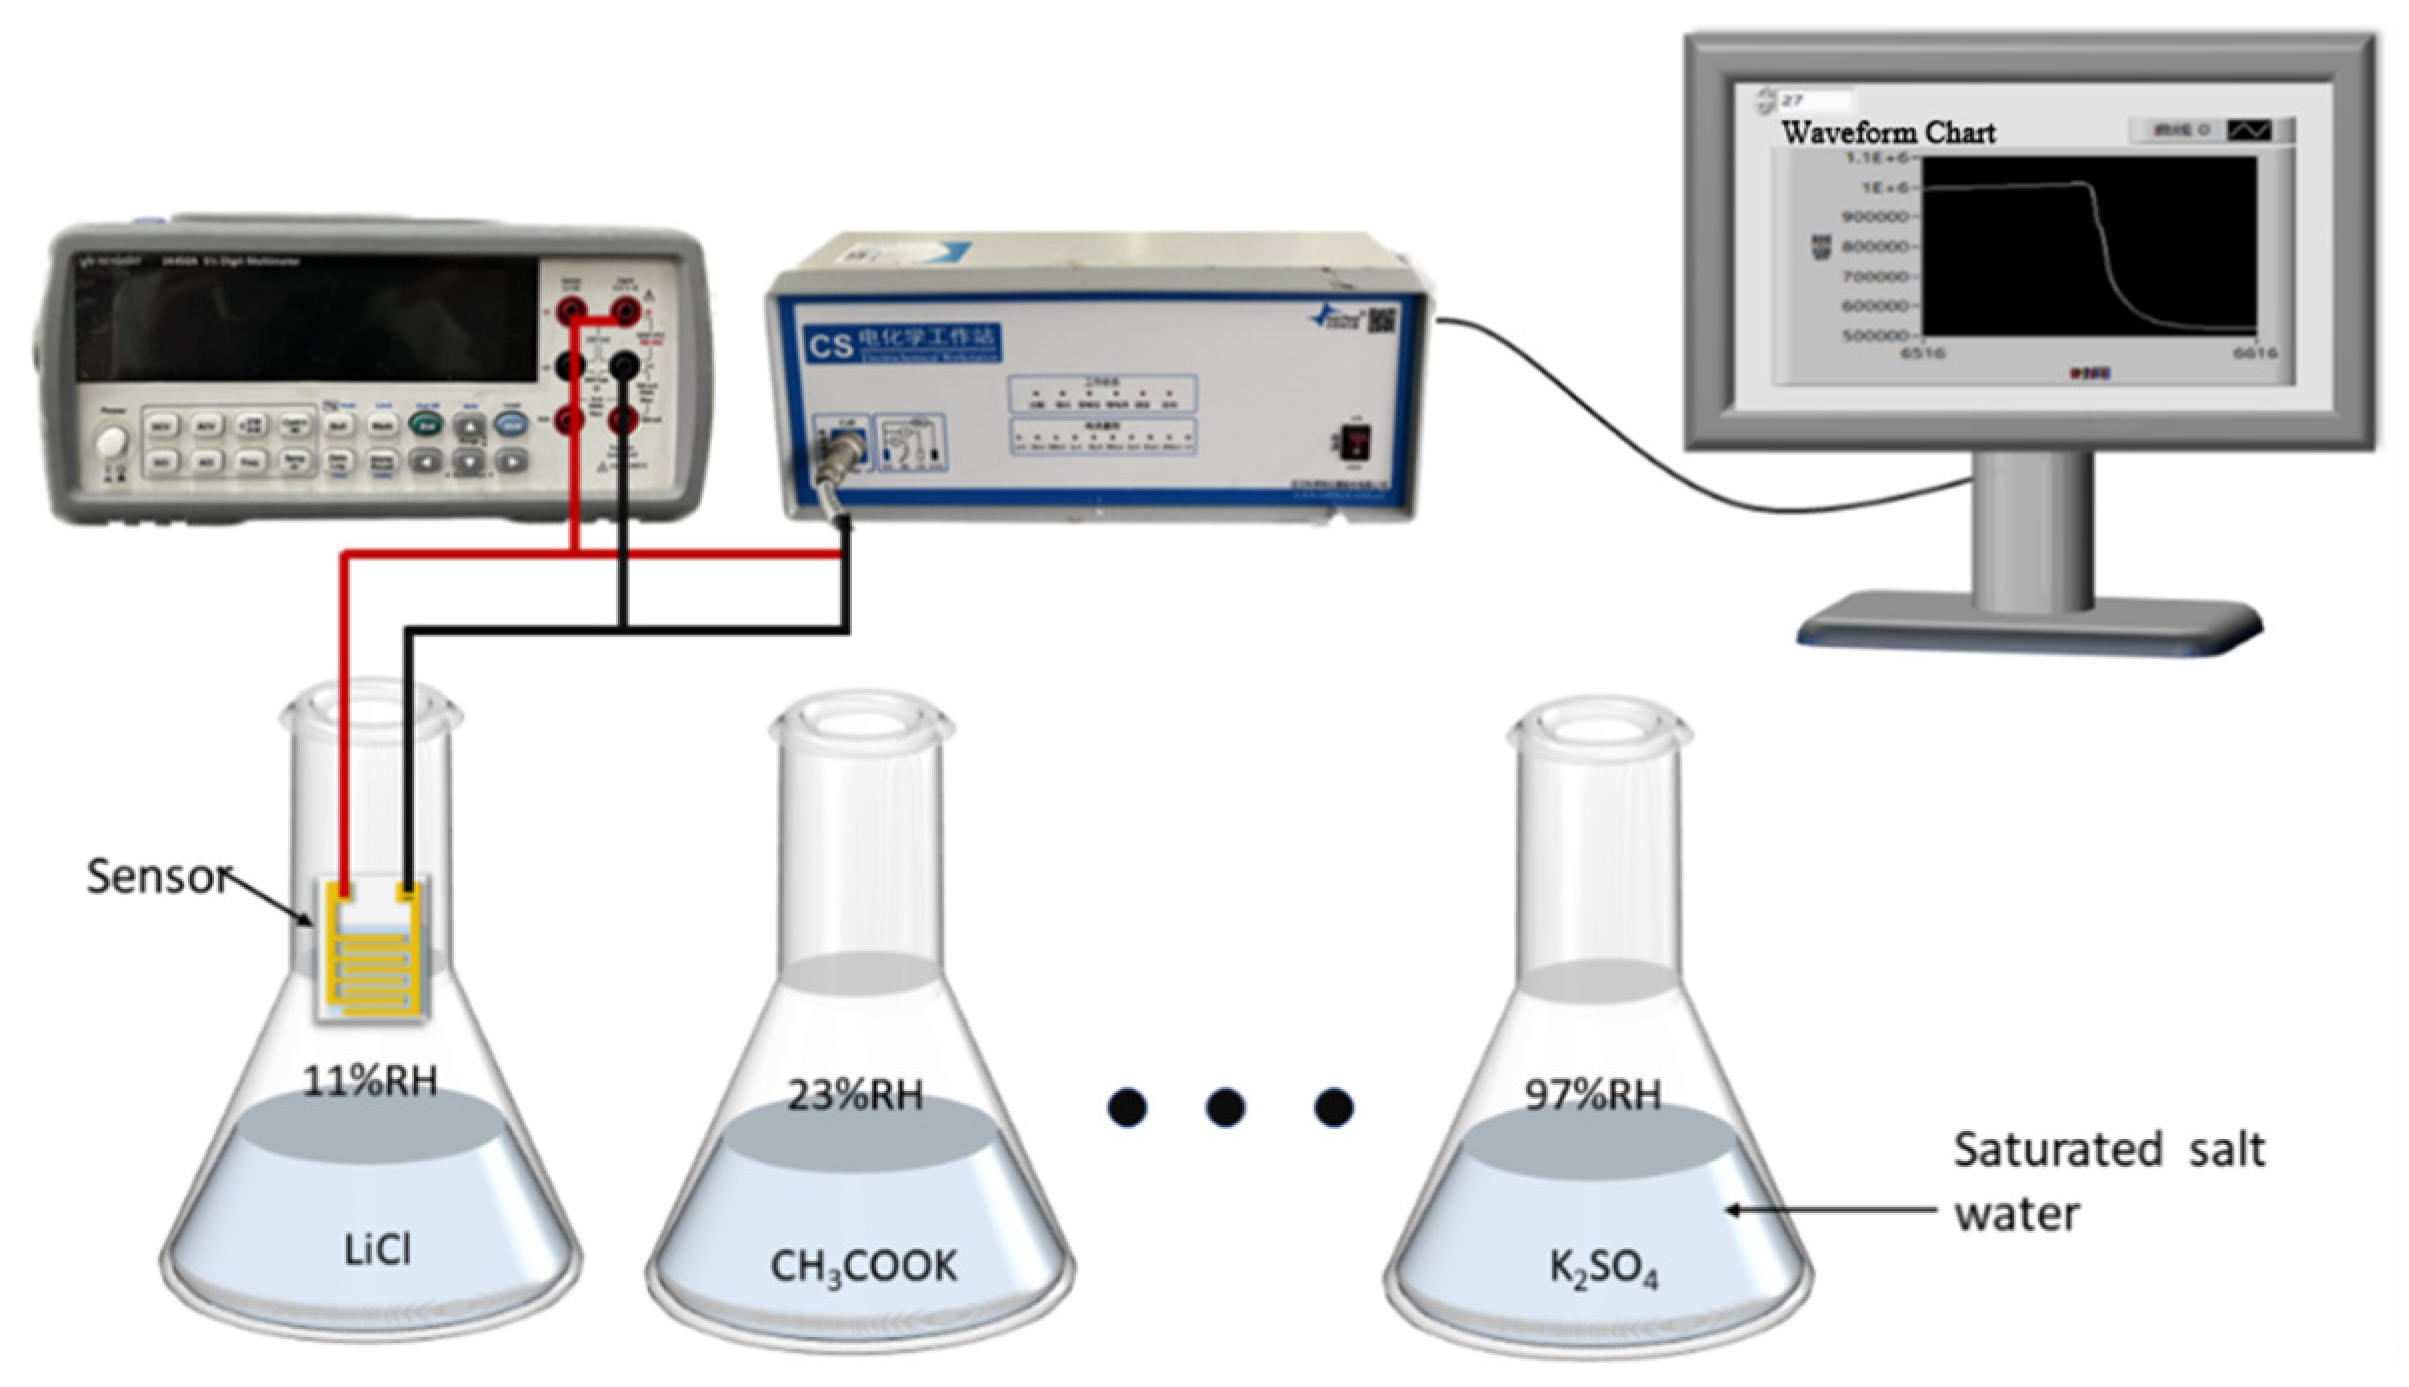
2.4. Experiment System

Figure 2 shows the humidity test system, which consists of a set of saturated salt solutions, a digital multimeter (Keysight 34450A, Keysight, Santa Rosa, CA, USA), an electrochemical workstation, and a computer. According to previous studies, the saturated salt solutions stored in sealed glass vessels can provide a constant and stable relative humidity environment [16,17,18]. We selected 8 saturated salt solutions to form eight different relative humidity points in the range of 11%RH to 95%RH, as listed in Table 1, to construct a complete test setup. The fabricated humidity sensor was connected to the digital multimeter. When the humidity sensor was placed into various glass vessels, the digital multimeter measured and displayed the resistance change of the sensors. The computer was also connected to the digital multimeter via the serial port and communicated with it. We also built a testing program on the computer that obtained, recorded, and stored the data from the multimeter in real-time.
Through further analysis of the stored data, the performance parameters of the humidity sensor including sensitivity, response/recovery time, stability characteristics, and so on can be derived. The electrochemical workstation was used to measure the complex impedance and frequency response of the sensors. A professional software tool was used to conduct parameter fitting for the equivalent circuits of the sensors, which further aids in analyzing and verifying the sensing mechanism of the humidity sensor.

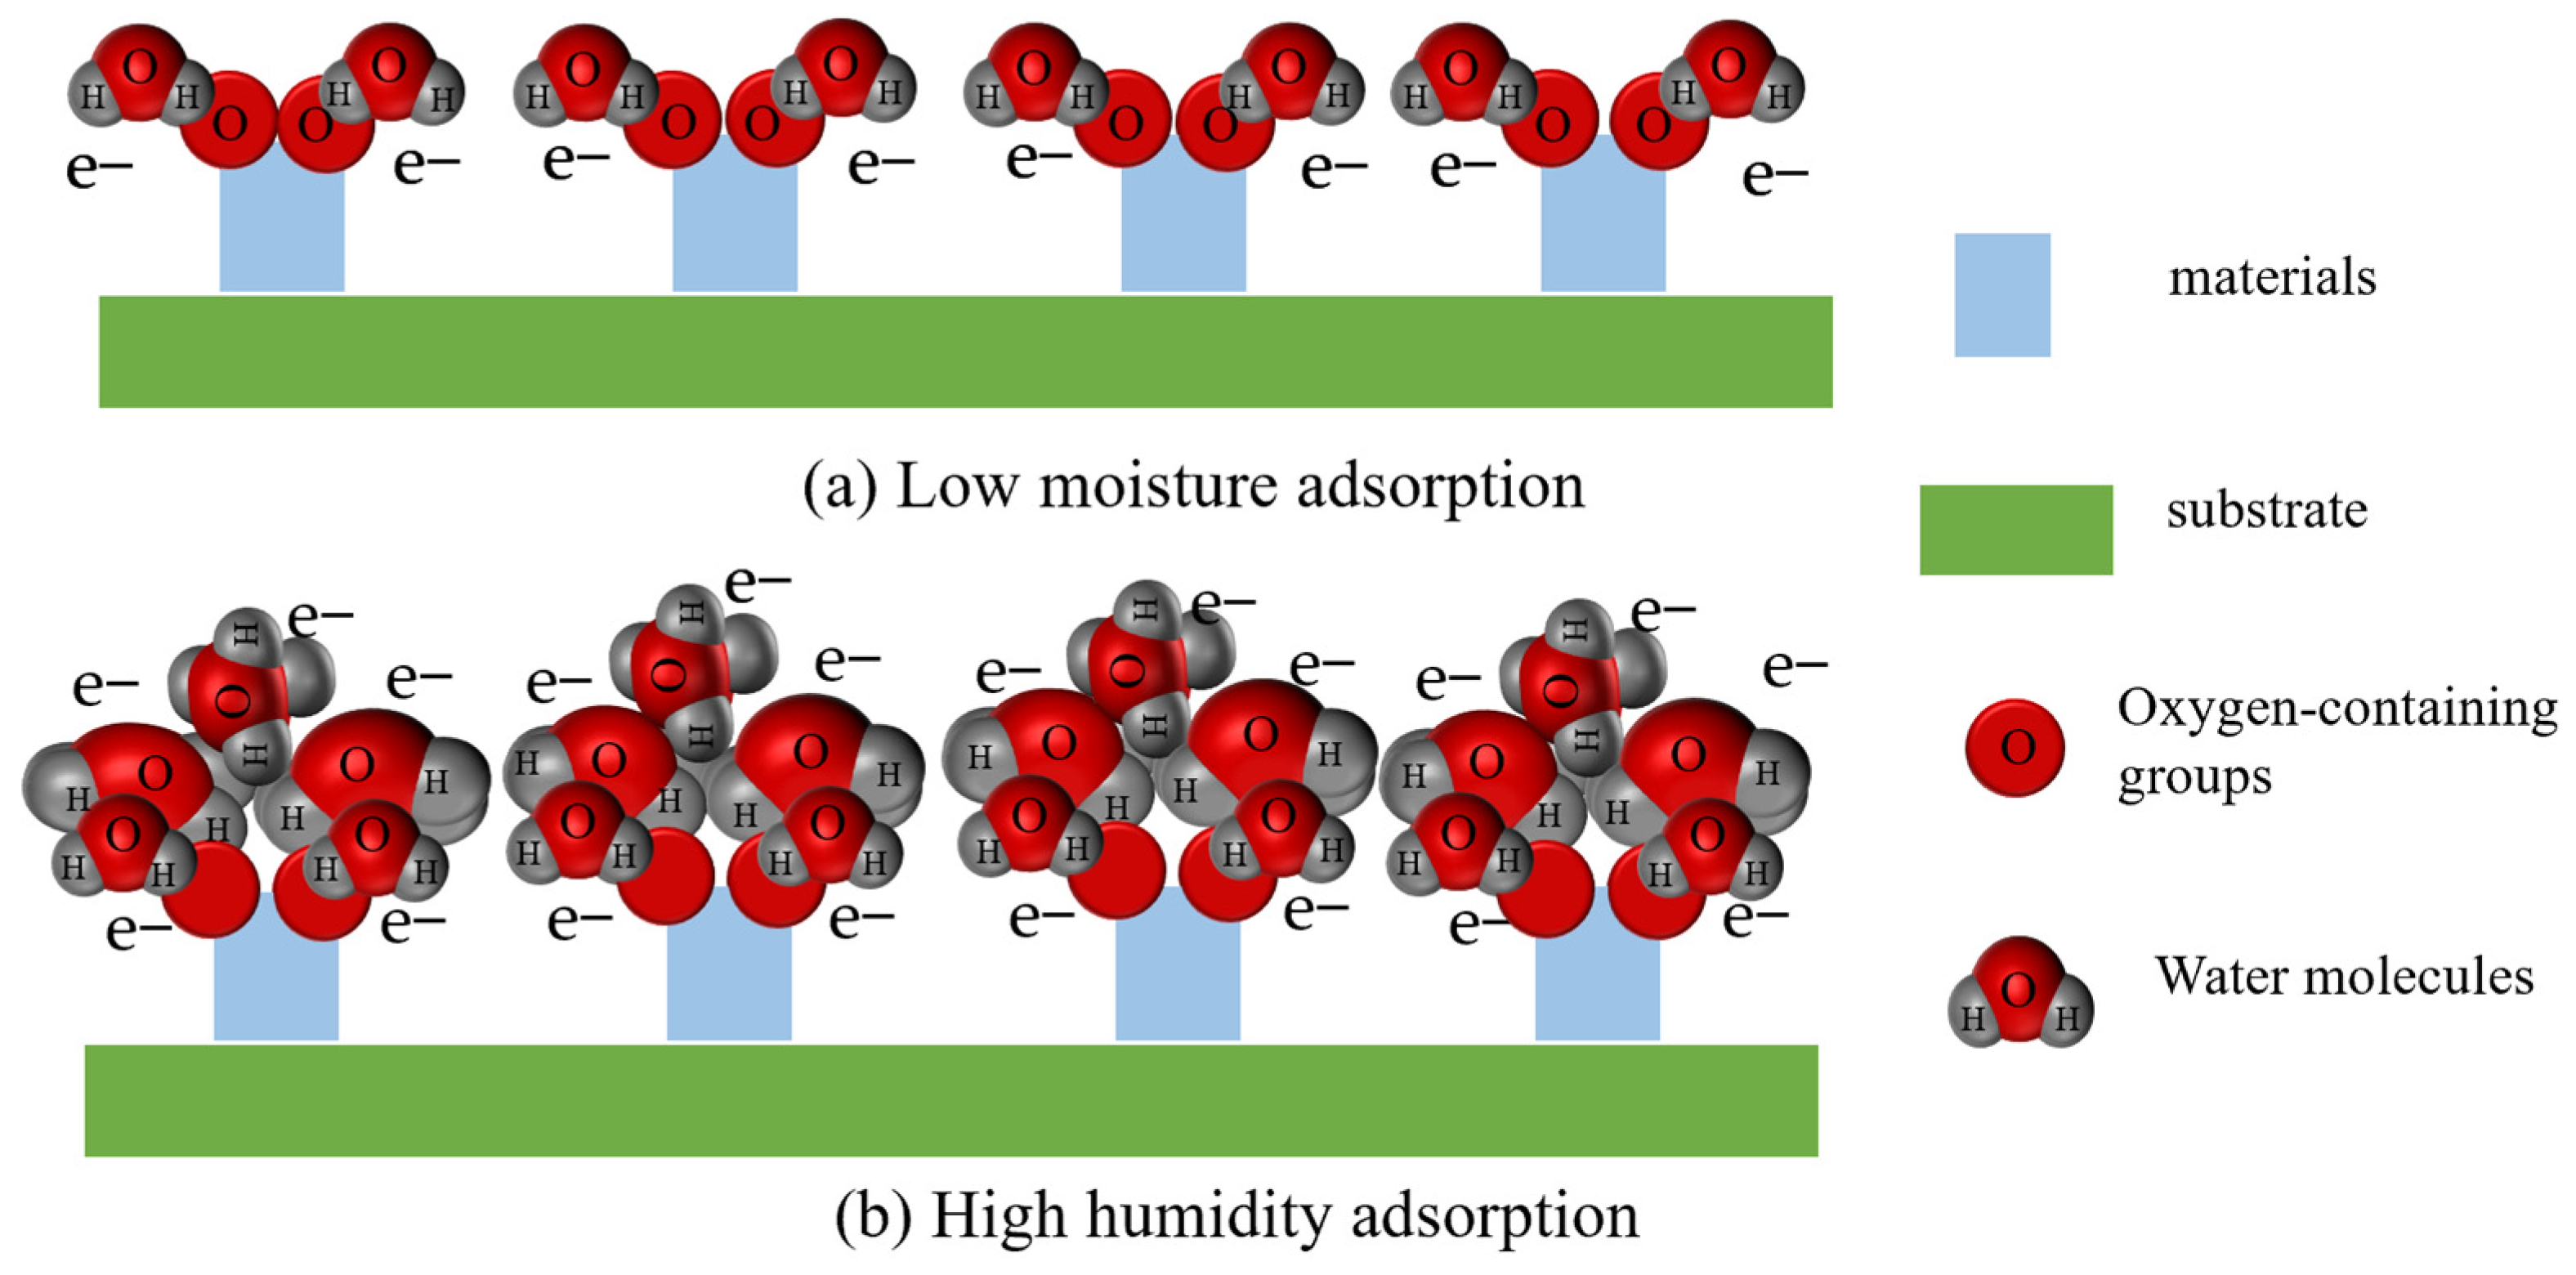
3. Humidity-Sensing Mechanism

The response of the humidity sensor is closely related to the adsorption and desorption state of water molecules on the surface of the sensing material. Generally, the adsorption of water molecules can be divided into two processes: physical adsorption and chemical adsorption. When the humidity sensor is exposed to a humid environment, the hydrogen atoms in the water molecules collide on the material surface, causing ionization of the water molecules to form a hydroxyl ion (OH) and a proton (H+), as described by Equation (1). The hydroxyl ion is adsorbed by the metal cation on the surface of the material, and the proton reacts with the adjacent oxygen ion (O2−) to form a new hydroxyl ion, as described by Equation (2). The new hydroxyl ion will also be adsorbed by the metal cations. Therefore, the ionization of water molecules produces two hydroxyl ions and adsorbs on the composite materials, helping to form a chemical adsorption layer. On top of the chemical adsorption layer, subsequent water molecules are physically adsorbed through double hydrogen bonding and form the first physical adsorption layer. As the humidity further increases, more physical adsorption occurs, and multiple water layers are formed through single hydrogen bonding. In fact, the subsequent physical adsorption layers formed through single hydrogen bonding are not strong, and the water molecules are relatively easy to dissociate, which promotes the formation of H3O+ ions as described by Equation (3). H3O+ acts as the proton source and facilitates conduction in the form of proton hopping under external electric excitation. This process is known as the Grotthuss mechanism [19].
H 2 O H + + O H
H + + O 2 O H
H 2 O + H + H 3 O +
As shown in Figure 3, at low relative humidity, a continuous water molecule layer cannot form, making it difficult for protons to transfer, and therefore, the sensor exhibits high impedance. In the case of high relative humidity, enough water molecules are adsorbed onto the surface of the material to form continuous water layers, and a large number of H3O+ ions are also generated. According to the Grotthuss mechanism, H3O+ ions are rapidly transferred and transported in the continuous water molecule layers ( H 2 O + H 3 O + H 3 O + + H 2 O ), leading to a significant drop in impedance and a large response from the sensor.
It is recognized that reduced graphene oxide exhibits a layered structure, with numerous hydrophilic functional groups on its surface. This unique structure, along with the hydrophilic functional groups, provides abundant adsorption sites for water molecules. The incorporation of RGO is believed to increase the specific surface area of the composite material, thereby enhancing the number of active sites available on its surface. When the composite material is exposed to a humid environment, a greater number of water molecules are adsorbed onto the surface of the metal oxide/RGO composite. These water molecules ionize to form hydroxide (OH) ions, which are subsequently adsorbed by the metal cations on the surface of the composite or by the polar groups in the RGO. Protons (H+) then react with the oxygen ions (O2−) on the composite material’s surface, generating additional hydroxide ions (OH). As a result, the incorporation of RGO into the composite material is likely to improve its humidity-sensitive properties.

4. Results and Discussions

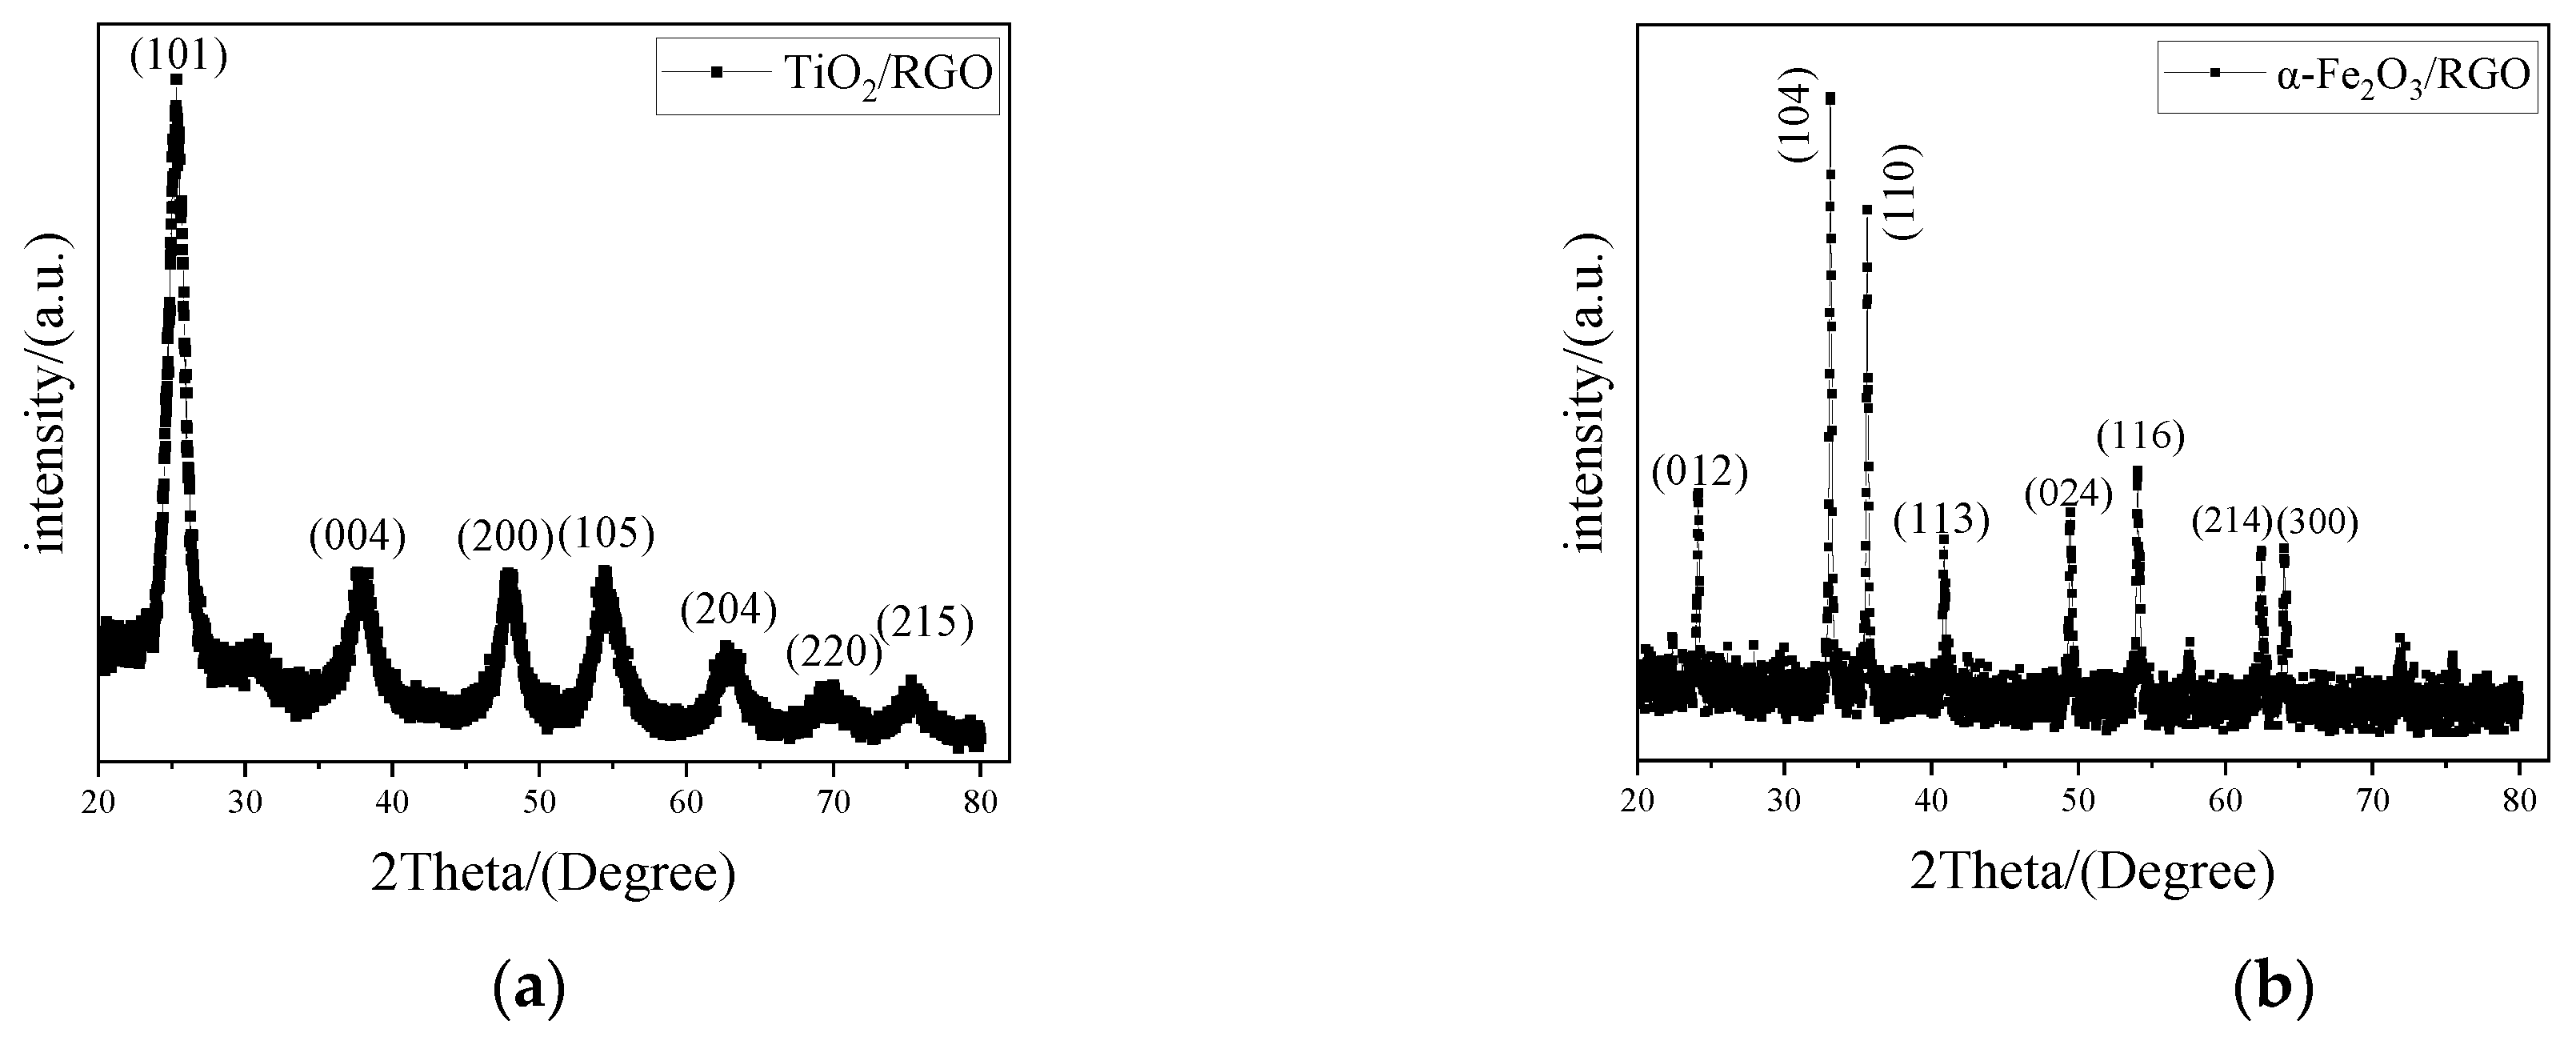
4.1. Material Characterization

The X-ray diffraction (XRD) patterns of TiO2/RGO and α-Fe2O3/RGO are depicted in Figure 4. In Figure 4a, there are diffraction peaks at 25.1°, 37.5°, 47.6°, 53.7°, 62.4°, 68.5°, and 74.7°, which clearly reflect the characteristic peaks of anatase TiO2 and can be indexed to (101), (004), (200), (105), (204), (220), and (215) crystal planes of anatase TiO2 [20]. In Figure 4b, the characteristic peaks appear at 24.1°, 33.2°, 35.6°, 40.9°, 49.5°, 54.1°, 62.4°, and 64.0°. The position and intensity of the diffraction peaks correspond to (012), (104), (110), (113), (024), (116), (214), and (330) crystal planes of α-Fe2O3 [21]. According to the literature, for RGO, there are diffraction peaks at 24.7° and 43.5°, which correspond to (002) and (101) crystal planes [22]. Because the content of RGO is relatively low, the characteristic peak of RGO at 24.7° is easily overshadowed by the characteristic peak of anatase TiO2 at 25.1°. Therefore, the XRD peaks of RGO disappear in TiO2/RGO composites. Similarly, the XRD peaks of RGO are also absent in α-Fe2O3/RGO composites due to the characteristic peak of α-Fe2O3 at 24.1°.
The scanning electron microscopy (SEM) of TiO2/RGO and α-Fe2O3/RGO is depicted in Figure 5. As seen in the image, the material exhibits a flaky, wrinkled structure with numerous gaps and an uneven surface. This suggests that the GO aqueous solution produced graphene oxide after a one-step hydrothermal reaction. According to the literature, RGO produced by a one-step hydrothermal reaction of GO aqueous solution typically exhibits an uneven surface and a flaky wrinkle structure with many voids [23]. Figure 5 shows the scanning electron microscopy (SEM) of the two composites with insets in a greater magnification. From Figure 5a, wrinkled flake structures can also be observed from the image, which indicates the presence of RGO in the material. As seen in the inset, the tiny spherical TiO2 nanoparticles are evenly dispersed on the RGO flakes, indicating that the TiO2/RGO composite material was generated after the hydrothermal reaction. From Figure 5b, the spherical α-Fe2O3 nanoparticles with a relatively large size are loosely piled. As can be found from the inset, RGO flakes are embedded between the α-Fe2O3 nanoparticles, indicating the formation of α-Fe2O3/RGO composites by a hydrothermal reaction.

4.2. Sensitivity and Hysteresis

During the experiments, the room temperature was maintained at approximately 25 °C to eliminate the impact of temperature on the test results. Figure 6 shows the dynamic response of TiO2/RGO and α-Fe2O3/RGO. The two curves represent a hysteresis cycle, which includes absorption (the relative humidity changes gradually from 11%RH to 97%RH with a time interval of 10 min) and desorption (the relative humidity changes gradually from 97%RH to 11%RH with a time interval of 10 min) processes. Resistive humidity sensors typically show approximately linear response characteristics, so the usual data processing method is used to make a linear fitting on the response curves, followed by the calculation of sensitivity, fitting degree R2, and other parameters based on the measured data and fitting parameters [12,24]. At a certain initial humidity (set at 11%RH in this work), the resistance of the sensor is measured; then, the humidity is changed (set at 97%RH in this work), and the resistance is measured again. The sensitivity is generally defined as the ratio of the change in resistance (ΔR) to the change in humidity (ΔRH) as follows:
S = R R H × 100 % ,
Based on the linear fitting of the response curves, the slope is always taken as the overall sensitivity. The fitting degree R2 represents the linearity of the response curves. The closer it is to 1, the more linear the sensor response is [25]. The humidity hysteresis H is calculated with the sensitivity S and is defined as follows:
H = R d i f f S × 100 % ,
where Rdiff is the maximum resistance difference between the absorption and the desorption curve.
From Figure 6, it can be seen that both composite materials exhibit a certain degree of linearity. For TiO2/RGO, the fitting degree R2 is 0.934, and the sensitivity at 97%RH is about 12.2 MΩ/%RH. The largest resistance difference Rdiff occurs at 75%RH, and the humidity hysteresis H is 3.811%RH. For α-Fe2O3/RGO, the fitting degree R2 is 0.972, and the sensitivity at 97%RH is about 0.826 MΩ/%RH. The maximum resistance difference appears at 43%RH, and the humidity hysteresis is 8.229%RH. Comparing these two materials, TiO2/RGO has better sensitivity and lower humidity hysteresis, while α-Fe2O3/RGO has better linearity.
Generally, humidity hysteresis always occurs, especially at room temperature, meaning there is always a certain degree of difference between the absorption and the desorption step. During the absorption step, water molecules are absorbed chemically or physically on the surface of the humidity-sensitive materials. However, during the desorption step, the previously absorbed water molecules cannot be quickly released from the surface of the material, which means that material resistance changes cannot follow the environmental humidity changes, and this leads to humidity hysteresis.

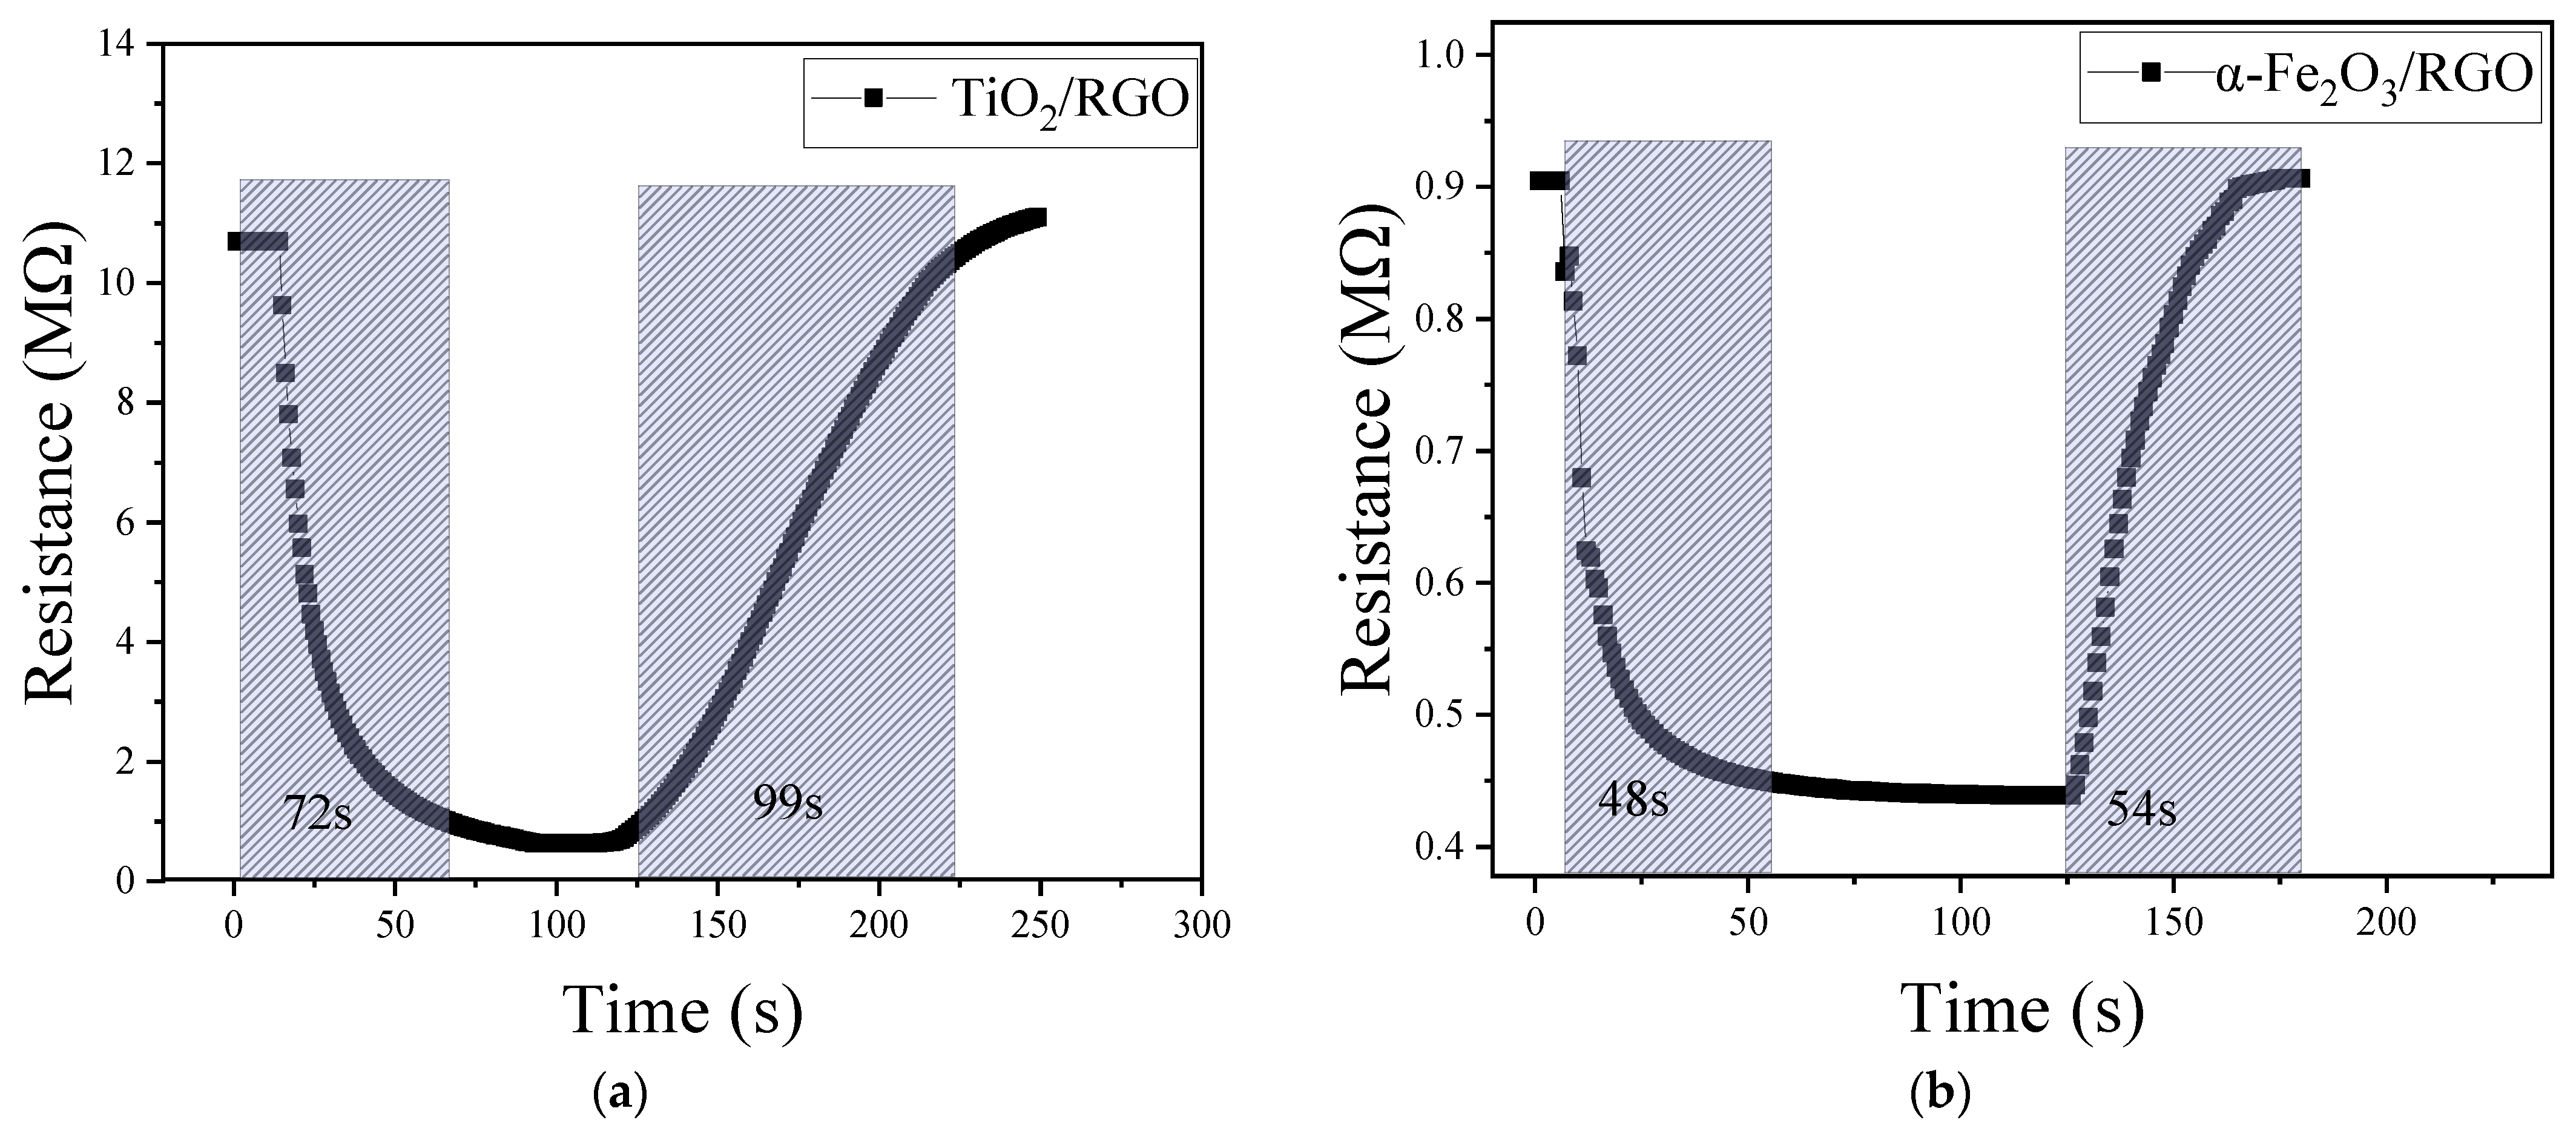
4.3. Response/Recovery Time

Response/recovery time is usually defined as the time required for the resistance change to reach 90% of the total change under a certain humidity step, which accurately reflects the speed of sensor output responding to humidity changes. In our experiments, the humidity sensor was first placed into the 11%RH vessel and allowed to stabilize. Then, the sensor was quickly transferred to the 97%RH vessel and allowed to stabilize again. The time from the start of the transfer to the time when the resistance change reaches 90% of the total change is obtained as the response time. Secondly, the sensor was quickly transferred back to the 11%RH vessel. Again, the time from the start of the transfer to the point where the resistance change reaches 90% of the total change is obtained as the recovery time. The response time relates to the absorption process, while the recovery time relates to the desorption process.
Figure 7 shows the response/recovery curves of the two composite materials. From the figures, the response and the recovery time of TiO2/RGO are approximately 72 s and 99 s, respectively, while those of α-Fe2O3/RGO are 48 s and 54 s, respectively. Comparing these two composite materials, α-Fe2O3/RGO shows a better response and recovery performance. Recalling the SEM images of α-Fe2O3/RGO and TiO2/RGO in Figure 5, loosely packed spherical α-Fe2O3 nanoparticles can be seen, and it seems that α-Fe2O3/RGO has a larger specific surface area compared with TiO2/RGO, which may help explain the advantages of α-Fe2O3/RGO in terms of the response/recovery time.
Table 2 lists and compares the response/recovery time, sensitivity, and sensing type of various humidity sensors in the literature and in this paper. All sensors operate at room temperature. It should be noted that there are multiple definitions of sensitivity in the literature. The sensitivities listed in Table 2 are estimated using the data from the literature and calculated according to Equation (2), primarily for the purpose of facilitating a comparison. It can be seen that the performance of the SMO/RGO composite materials is generally better than that of the mono-SMO materials or SMO composite materials. The main reason likely lies in the fact that the addition of RGO can promote the production of a larger specific surface area and more surface hydrophilic functional groups on the surface of the material, thereby improving the response/recovery performance of the humidity sensor. The SnO2/RGO composite materials described in [12,14] have a very short recovery time, whereas the two composite materials presented in this paper, especially α-Fe2O3/RGO, have relatively balanced and good response/recovery properties. According to [21], RGO can form a p-n heterojunction with TiO2 and α-Fe2O3, which may have a positive impact on the performance improvement of composite materials.

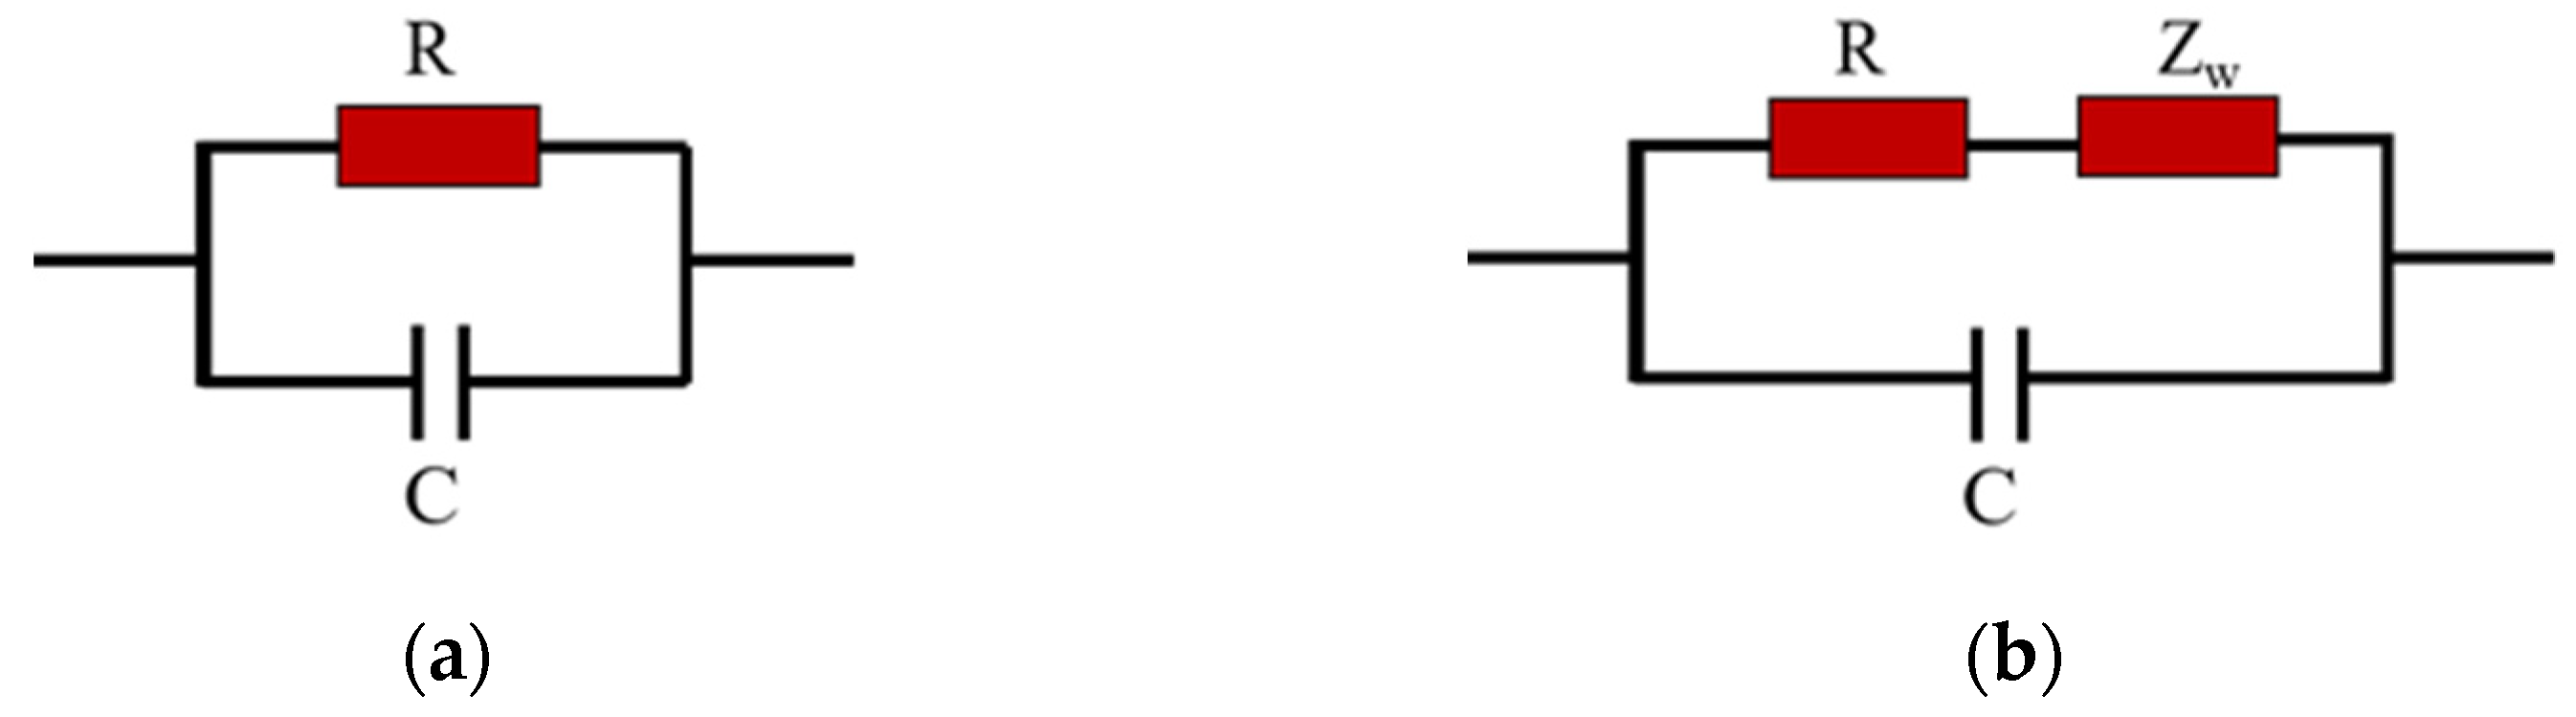
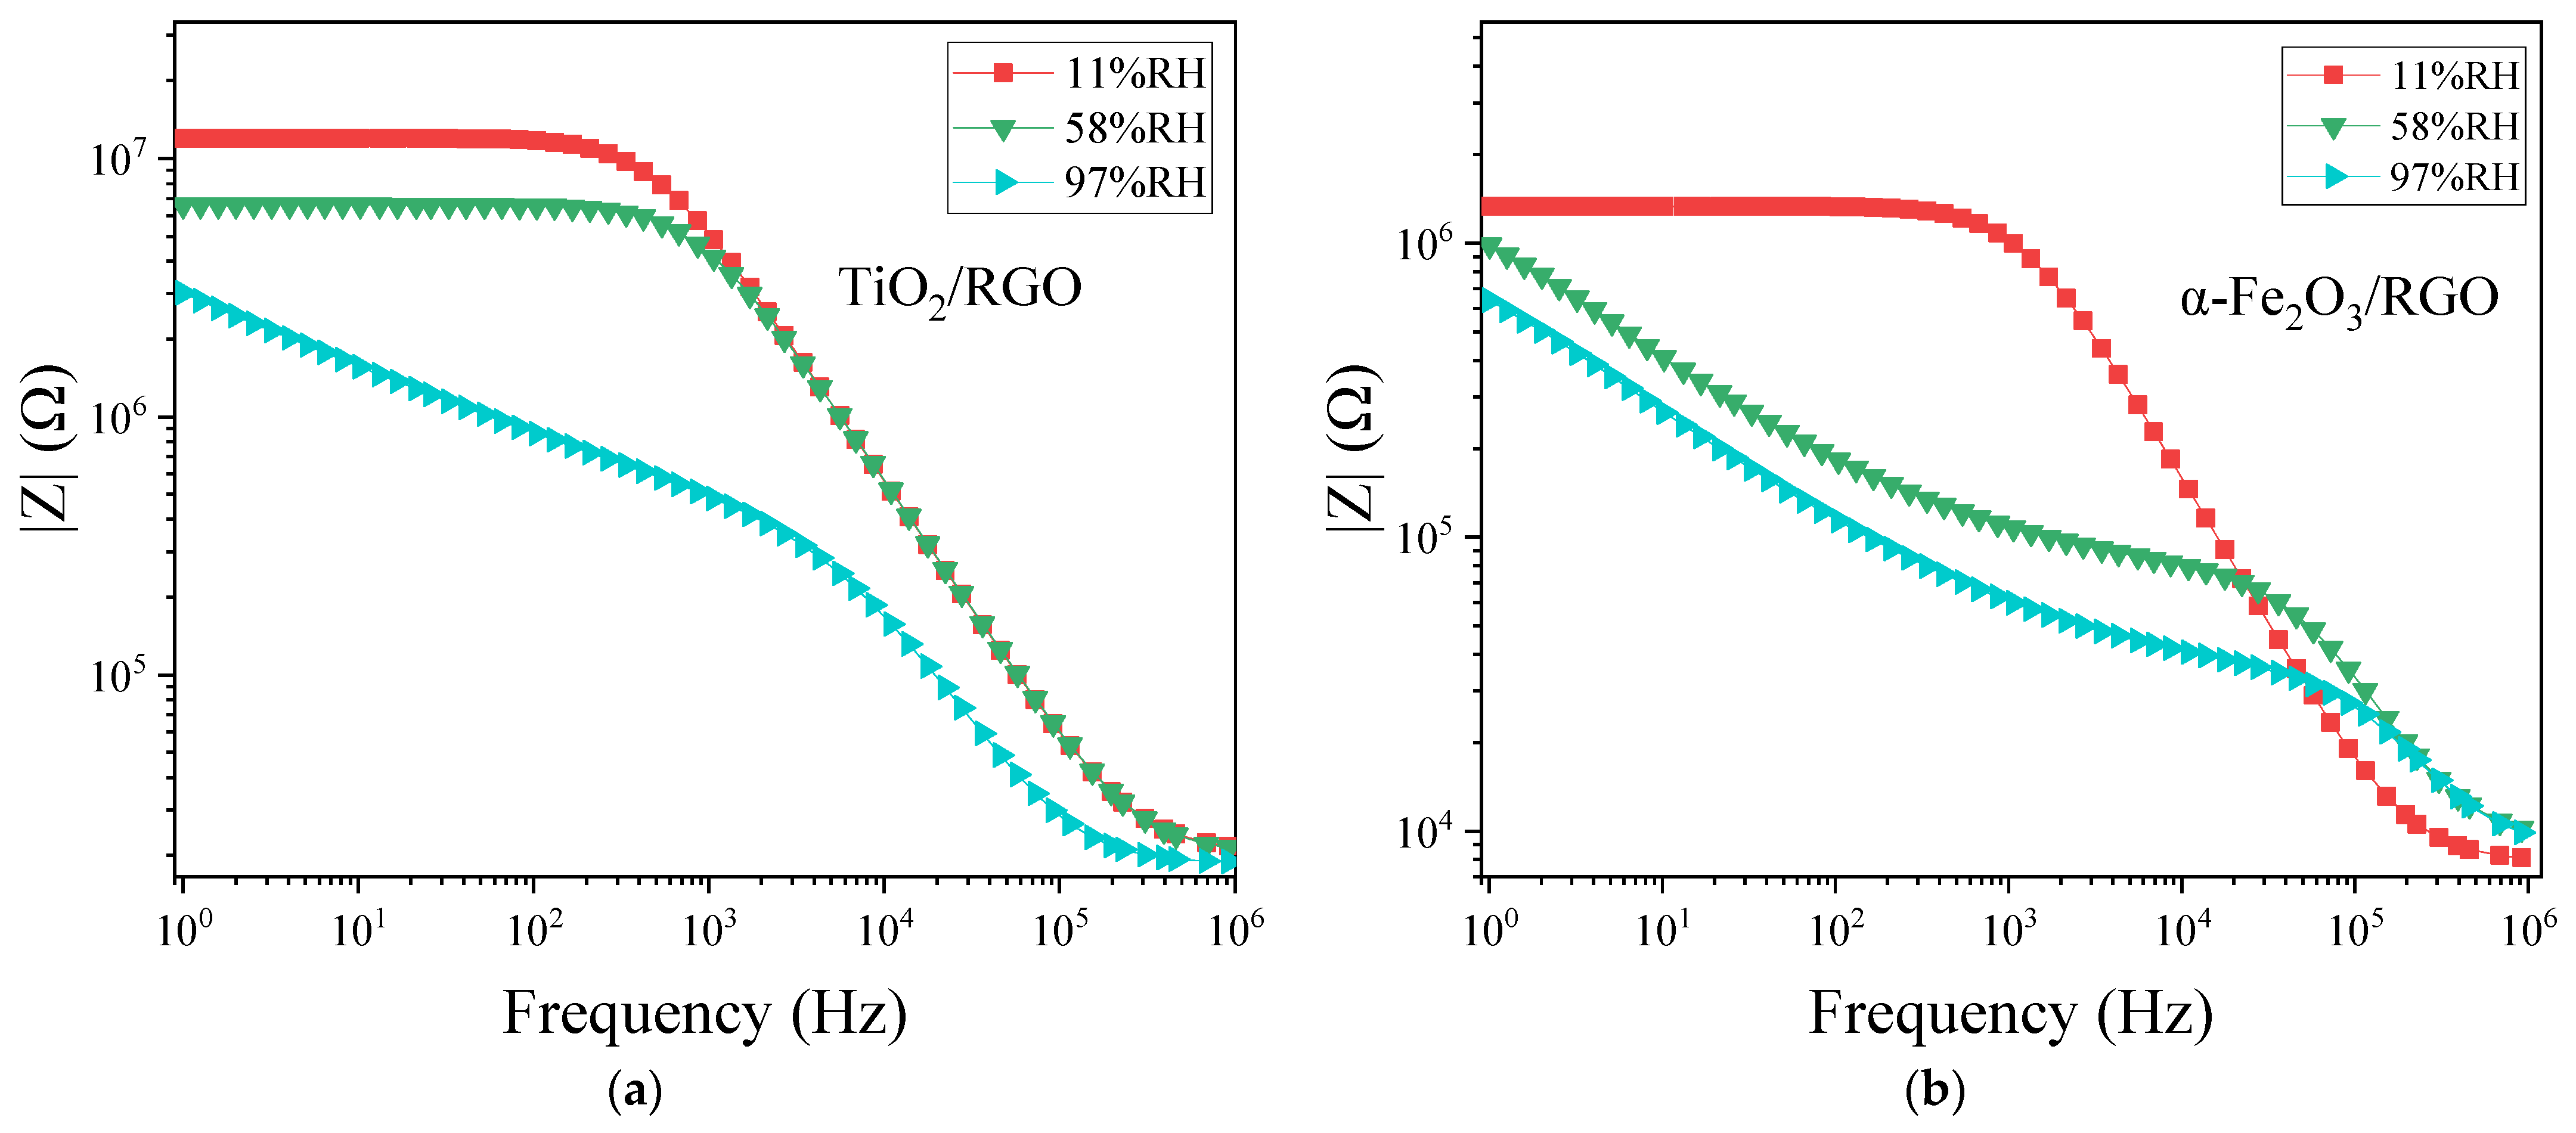
4.4. Complex Impedance and Frequency

To further explore the in-depth properties of materials, alternating current (AC) impedance measurements across a frequency range are highly useful. Electrochemical impedance spectroscopy (EIS) and corresponding equivalent circuits are essential tools for analyzing and studying the properties of sensitive materials and the sensing mechanisms of sensors. Figure 8 presents the Nyquist complex impedance diagrams of the TiO2/RGO sensor and the α-Fe2O3/RGO sensor under different relative humidity conditions (11%RH, 58%RH, and 97%RH). The scanning frequency ranges from 1 Hz to 1 MHz. At low humidity levels, the complex impedance primarily reflects the intrinsic impedance characteristics of the material films. The impedance of the TiO2/RGO film is much higher than that of the α-Fe2O3/RGO film. As the humidity increases, the complex impedance of the sensors further illustrates the interaction between the sensitive materials and water molecules.
For TiO2/RGO, at a low relative humidity of 11%RH, only a small number of water molecules are chemically adsorbed on the surface of the material. High energy is required for H+ ions to transfer between adjacent hydroxyl groups via the hopping mechanism. Under low humidity conditions, the increase in humidity has a limited effect on the sensor’s impedance, which changes only slightly and remains high. As shown in Figure 8a, the complex impedance curve exhibits a shape close to an ideal semicircle. Typically, the equivalent circuit corresponding to this semicircle consists of a parallel connection of a resistance R and a capacitance C, as shown in Figure 9a. The diameter of the semicircle reflects the magnitude of the resistance R. When the humidity increases to a moderate level of 58%RH, more water molecules are adsorbed chemically or physically onto the surface of the material, gradually forming a continuous water layer. Proton hopping becomes more likely, resulting in a gradual decrease in impedance as humidity increases, and the semicircle’s radius decreases accordingly.
At a high humidity level of 97%RH, water molecules form a continuous, multi-layered water film on the surface of the material through physical adsorption. A large number of H3O+ ions transfer via the Grotthuss chain reaction, causing a significant reduction in impedance. More importantly, a “tail” appears at the low-frequency part of the semicircle. This tail is attributed to the Warburg impedance ZW, which arises from the ion diffusion process at the interface between the sensing film and the electrode and exhibits frequency-dependent characteristics [30]. Because of the Warburg impedance, the equivalent circuit is shown in Figure 9b.
The characteristics of α-Fe2O3/RGO differ somewhat from those of TiO2/RGO. As shown in Figure 8b, at a low humidity level of 11%RH, the complex impedance plot of α-Fe2O3/RGO also displays a nearly ideal semicircle, which is similar to that of TiO2/RGO. Thus, its equivalent circuit should also consist of a parallel combination of resistance R and capacitance C. However, when the humidity increases to a moderate level of 58%RH, the plot deviates from an ideal semicircle, and a tail emerges, differing from the behavior observed for TiO2/RGO. This is likely due to the loose structure of the α-Fe2O3/RGO material and its large specific surface area, which facilitates the rapid adsorption of water molecules into gaps, leading to the generation of a Warburg impedance.
Examining the change in the semicircle radius with humidity reveals that TiO2/RGO exhibits better linearity, while α-Fe2O3/RGO shows “radius jumps”. This discrepancy may also be related to the surface morphology of the materials. The surface of TiO2/RGO is relatively flat, allowing water molecules to distribute evenly and interact with the material in a way that produces a relatively linear effect. In contrast, the surface of α-Fe2O3/RGO is loose and irregular, with more voids, making it prone to generating non-linear effects.
Table 3 presents the fitting parameters for the equivalent circuit of TiO2/RGO and α-Fe2O3/RGO at different relative humidity levels. R and C represent the resistance and capacitance, respectively, in the equivalent circuit. The Warburg impedance Zω can be calculated using the following equation [31]:
Z ω = W o R · c t n h ( ( j ω W o T ) W o P ) ( j ω W o T ) W o P
where ω denotes the angular frequency, and WoR, WoT, and WoP are parameters of the Warburg impedance model. WoR represents the diffusion impedance at very low frequencies, WoT represents the diffusion time constant, and WoP reflects the effect of frequency on diffusion impedance. It can be observed that the WoT of TiO2/RGO is smaller than that of α-Fe2O3/RGO, indicating a faster ion diffusion process within the surface water layer of TiO2/RGO. On the other hand, the WoP of α-Fe2O3/RGO is greater than that of TiO2/RGO, suggesting that the diffusion impedance of α-Fe2O3/RGO is more sensitive to frequency. TiO2/RGO is a material with a relatively flat surface, which enables the formation of shorter diffusion pathways, resulting in a faster diffusion process at the interface between the TiO2/RGO material and the electrode. In contrast, ions in the α-Fe2O3/RGO material experience longer diffusion paths, making the diffusion process more susceptible to the changes in frequency.
Figure 10 illustrates the relationship between the impedance (|Z|) and frequency (log(f)) of the two sensors in the humidities of 11%RH, 58%RH, and 97%RH. Under low humidity conditions (such as 11%RH), |Z| changes slowly at low frequencies (around 1–103 Hz), indicating an approximate DC resistive behavior in the material, while at high frequencies (around 103–105 Hz), the curves decrease linearly with frequency, exhibiting a certain degree of f-−1 behavior, indicating that the capacitance plays a dominant role. This is the typical impedance characteristic of the parallel combination of resistance and capacitance. Under high humidity conditions (such as 97%RH), the low-frequency portion of the curve is noticeably elevated, reflecting the influence of the Warburg impedance, as described earlier. Warburg impedance primarily affects the low-frequency characteristics and is approximately linearly related to frequency (log(f)).

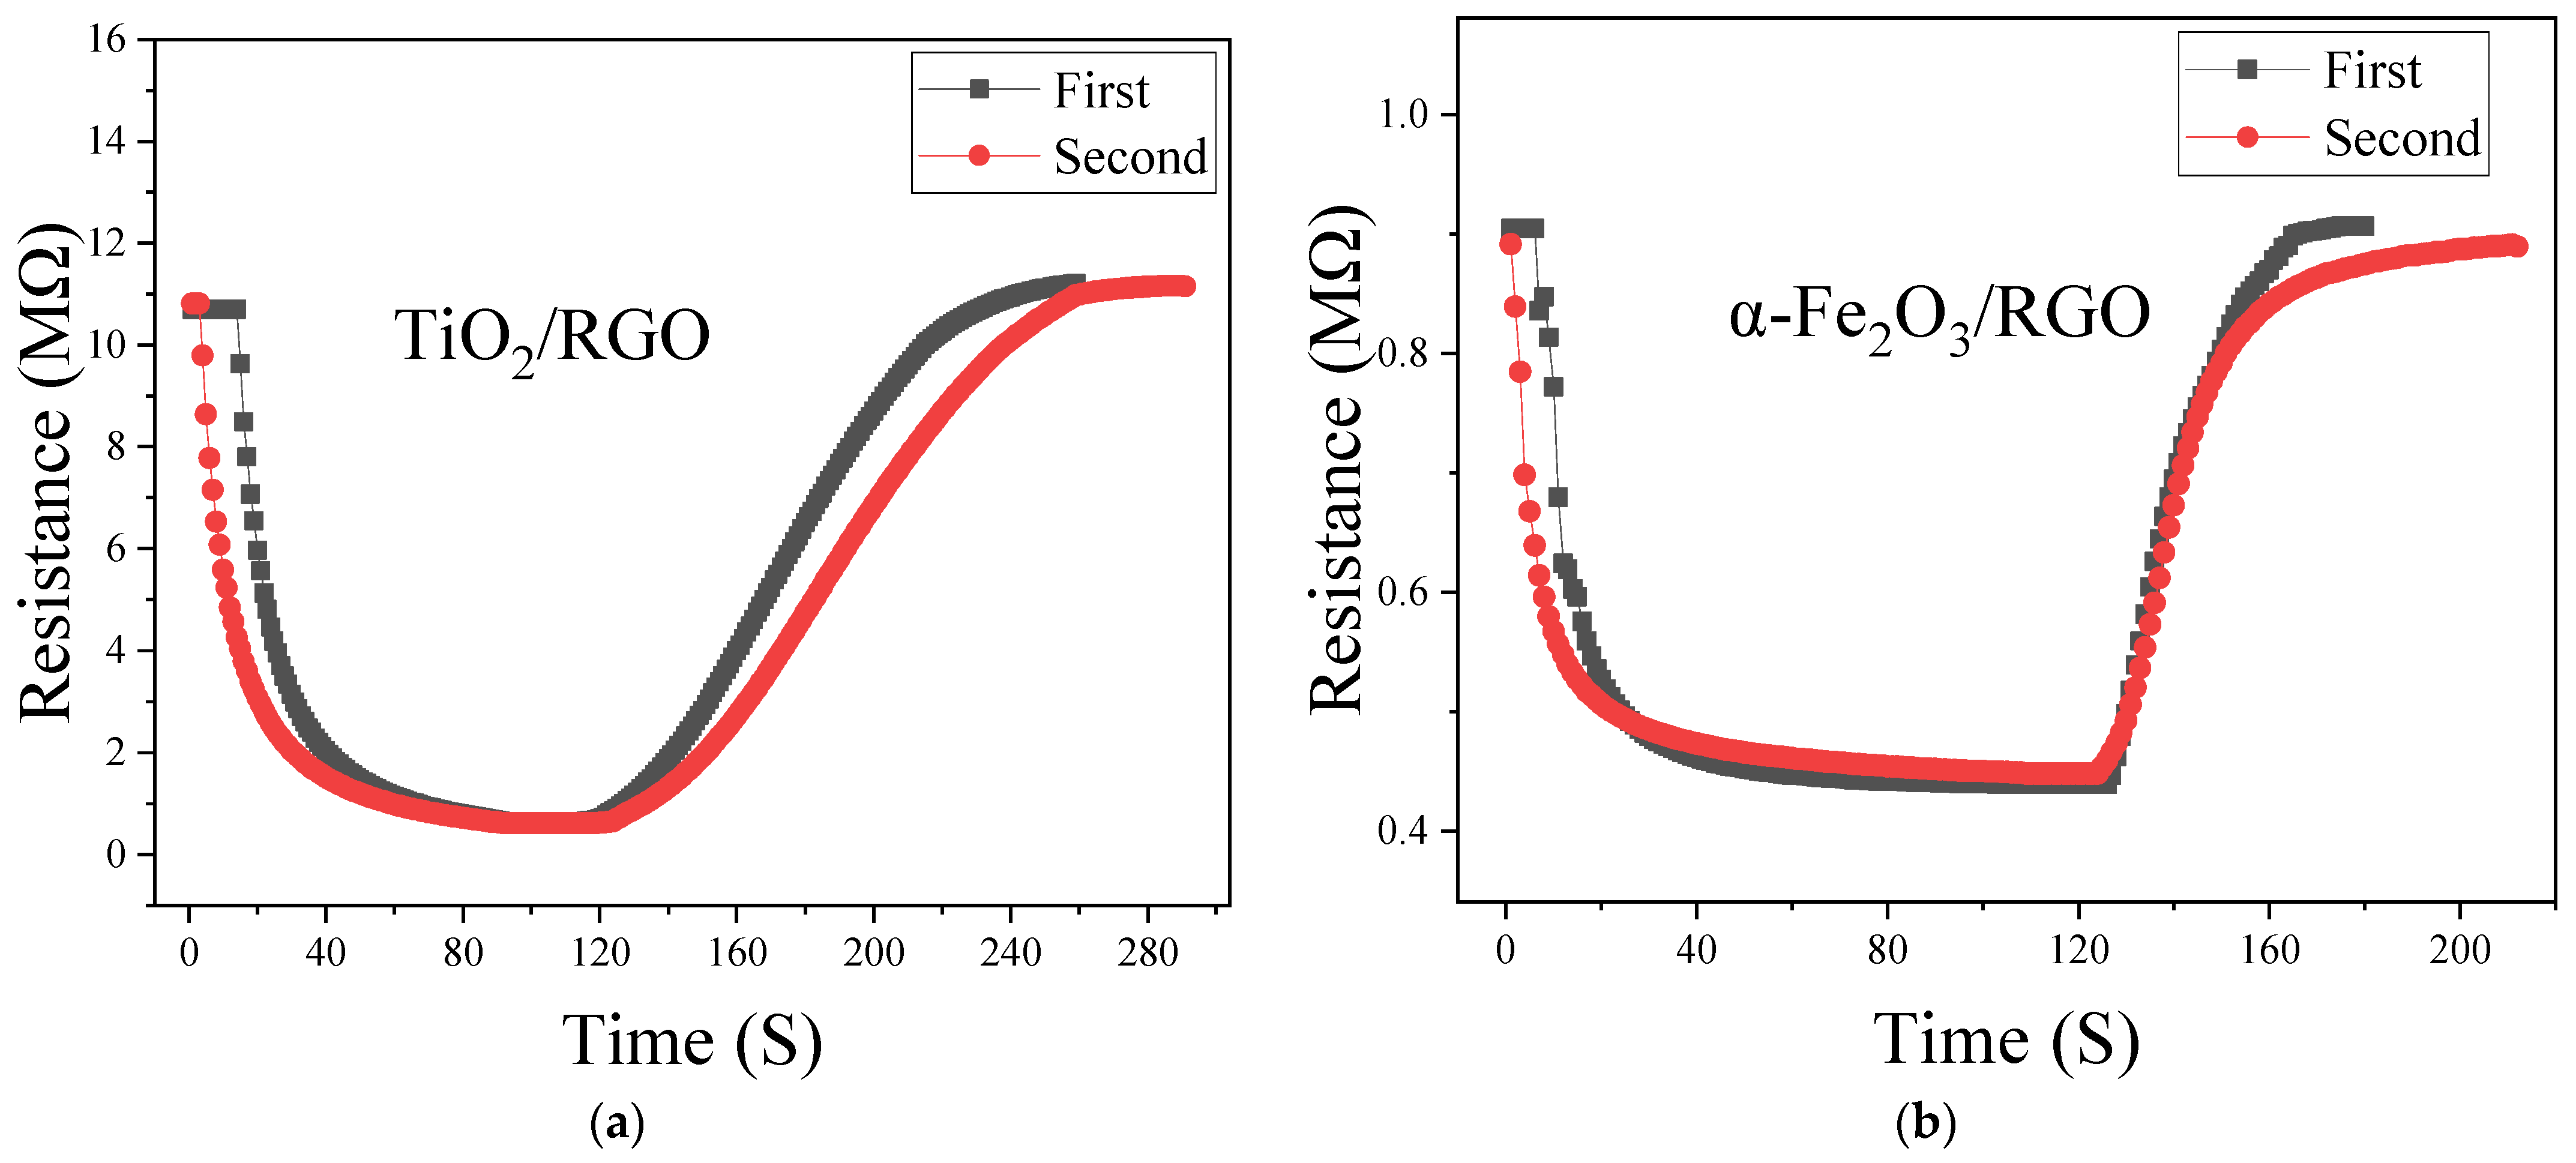
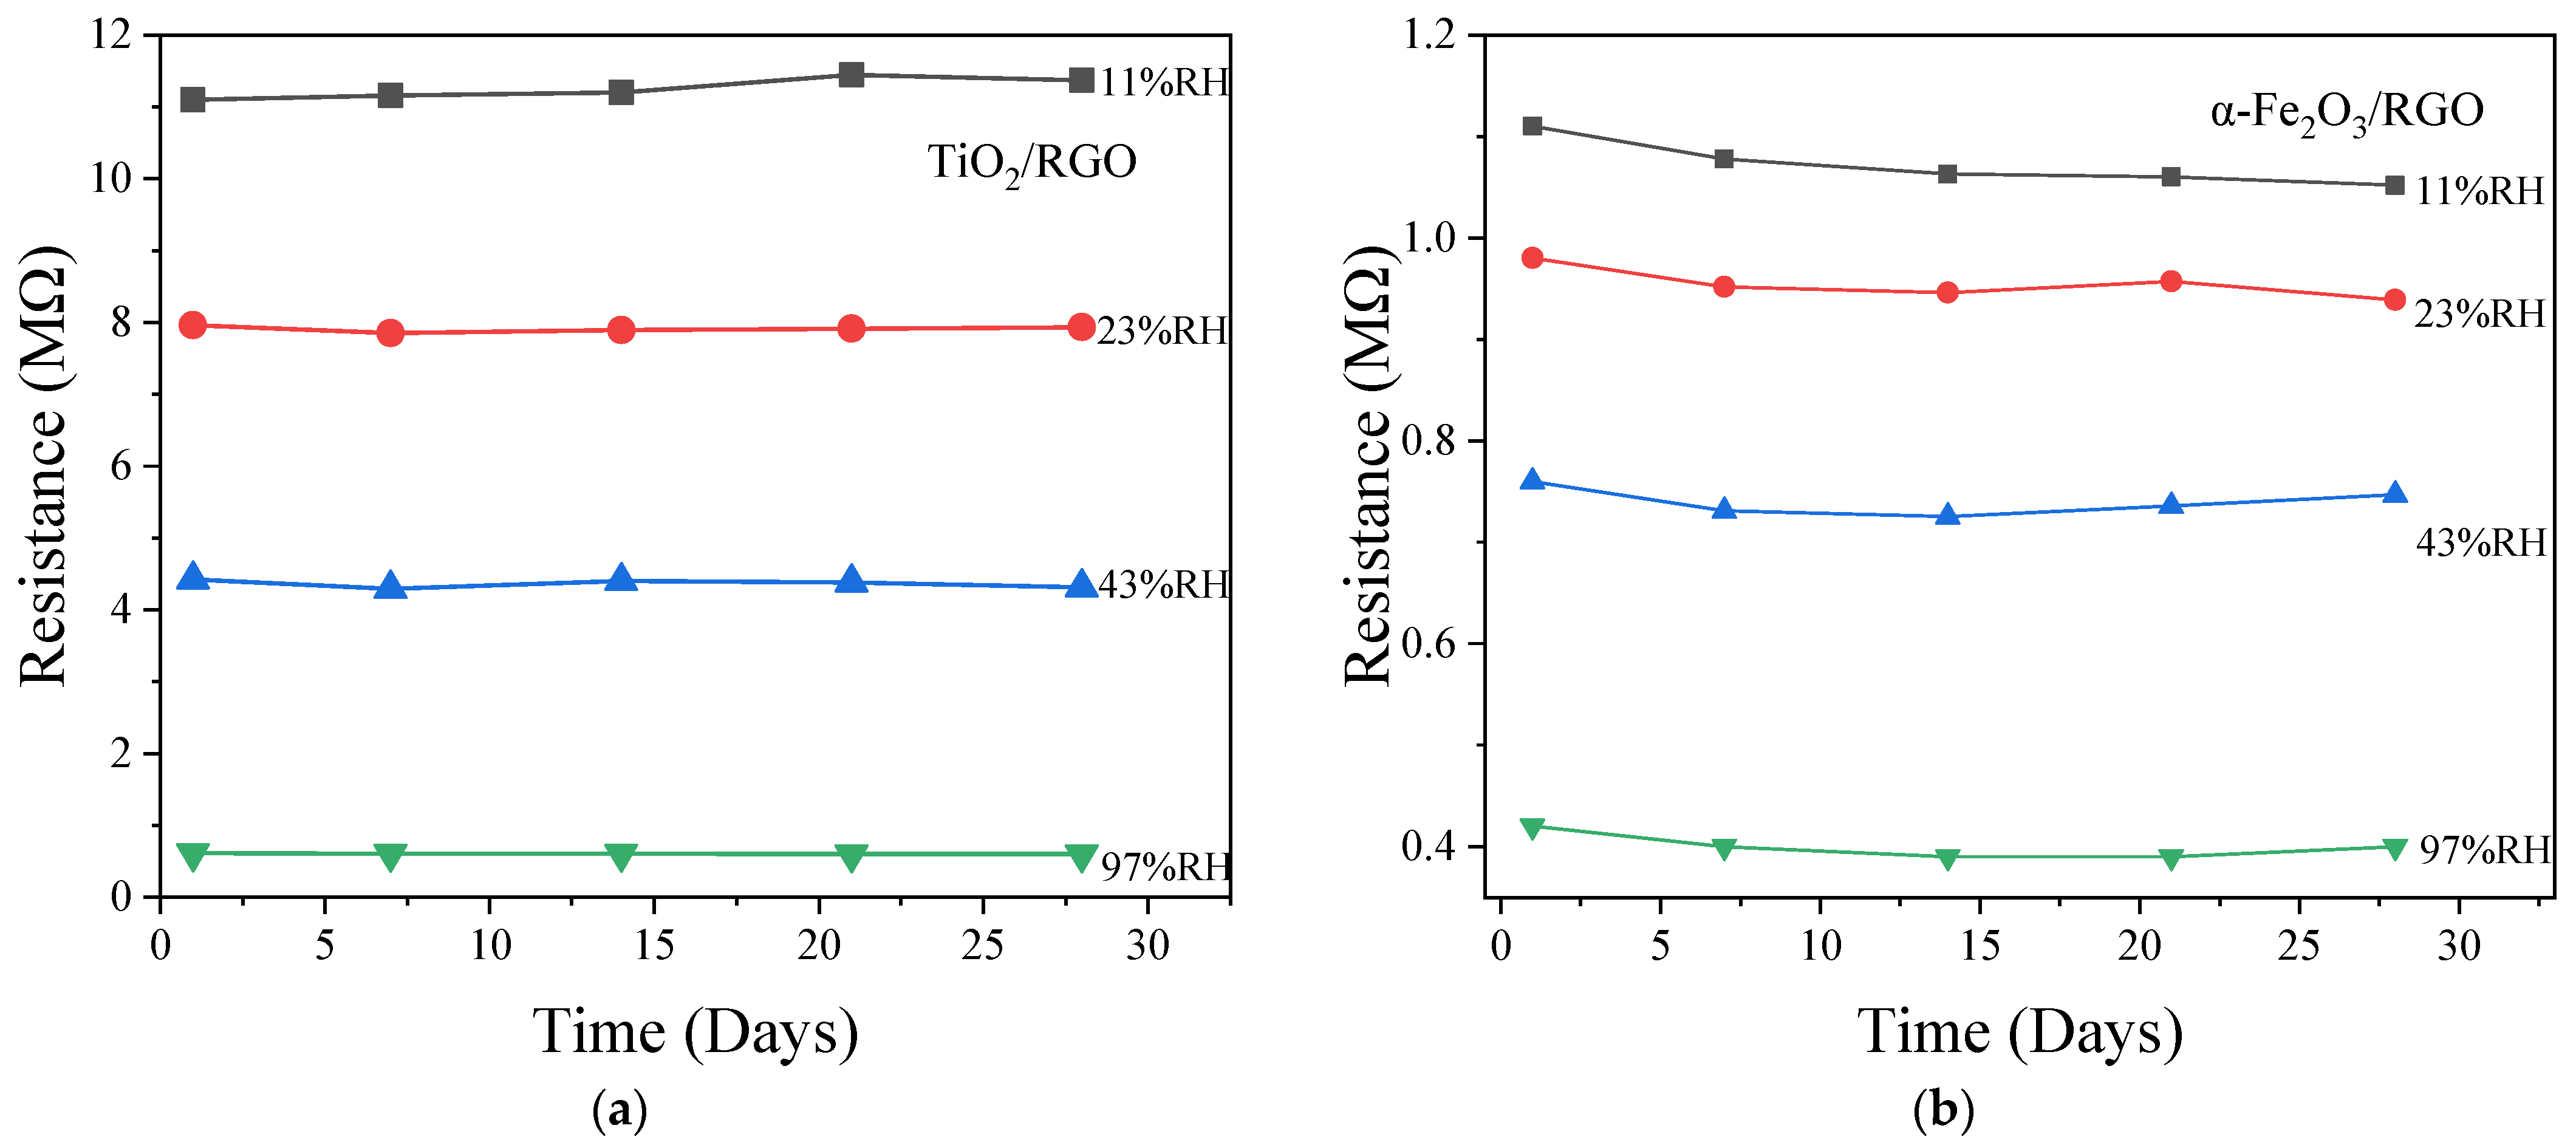
4.5. Repeatability and Stability

Repeatability and stability are essential properties of sensors. The test method for evaluating repeatability in this study is as follows: a response/recovery test is conducted, repeated after 15 days, and the differences between the two measured curves are compared. Figure 11 presents the repeatability test results for the two materials. Although there are some differences between the curves, it is evident that the sensor’s response and recovery processes are roughly consistent, indicating good repeatability. The discrepancies between the curves may arise from the following factors: first, the first test was performed immediately after the sensor was made, and the second test was conducted after the sensor had been placed in the environment for 15 days. In other words, the first test was based on a newly fabricated device, while the sensor may have undergone some changes after 15 days of exposure to the environment, making the results of the second test likely different; second, the experiments rely primarily on manual operations, and the procedure and environmental conditions may not be identical between the two tests.
In addition, the sensors were subjected to a stability test by placing them in four different humidity environments (11%RH, 23%RH, 43%RH, and 97%RH) for approximately one month. The test results are shown in Figure 12. For the TiO2/RGO sensor, under humidity levels of 11%RH, 23%RH, 43%RH, and 97%RH, the maximum resistance variations were 0.24 MΩ, 0.11 MΩ, 0.13 MΩ, and 0.005 MΩ, respectively. For the α-Fe2O3/RGO sensor, the corresponding maximum resistance variations were 0.032 MΩ, 0.028 MΩ, 0.029 MΩ, and 0.02 MΩ, respectively. In percentage terms, the maximum resistance variations for both the TiO2/RGO and α-Fe2O3/RGO sensors were approximately 1% at 11%RH. Based on the test data, the TiO2/RGO sensor demonstrates relatively better stability. However, both sensors exhibit good overall stability performance.

5. Conclusions

This paper investigates the humidity-sensing properties of TiO2/RGO and α-Fe2O3/RGO nanocomposite materials at room temperature. The results show that both materials exhibit good humidity-sensing performance. The sensitivity and humidity hysteresis of TiO2/RGO were 12.2 MΩ/%RH and 3.811%RH, respectively, while those of α-Fe2O3/RGO were 0.826 MΩ/%RH and 8.229%RH, respectively. The response/recovery time of TiO2/RGO was 72/99 s, while that of α-Fe2O3/RGO was 48/54 s. Combined with other related literature, this study further confirms that the nanocomposites incorporating RGO will probably provide better moisture-sensitive performance than single material. Since the TiO2/RGO nanocomposite material exhibits a relatively large resistance, the sensor resistance changes greatly in a humid environment, which corresponds to a large absolute sensitivity. However, the relative sensitivity (responsivity) of the two materials is similar, indicating that the two materials all have good sensitivity. The α-Fe2O3/RGO has relatively better linearity from moderate to high humidity. Since α-Fe2O3/RGO has a relatively loose surface morphology, α-Fe2O3/RGO has a smaller response and recovery time, but it may also contribute to hysteresis. In cyclic testing, both materials showed good repeatability. In a one-month stability test under four humidity conditions of 11%RH, 23%RH, 43%RH, and 97%RH, both materials showed small fluctuation, indicating good stability. This study suggests that SMO-RGO composite materials, such as TiO2/RGO and α-Fe2O3/RGO, hold significant promise as candidate materials for developing high-sensitivity and high-stability humidity sensors, particularly suited for environmental monitoring in residential and commercial applications where cost-effectiveness is a critical consideration.

Author Contributions

Conceptualization, W.Z. (Wanghui Zou) and W.Z. (Wei Zhao); methodology, software, validation, investigation, resources, data curation, writing—original draft preparation, W.Z. (Wei Zhao) and C.W.; writing—review and editing, supervision, project administration, funding acquisition, technical support, W.Z. (Wanghui Zou). All authors have read and agreed to the published version of the manuscript.

Funding

The Science Foundation of Hunan Provincial Education Department (23A0260), the National Natural Science Foundation of China (12105027).

Institutional Review Board Statement

No applicable.

Informed Consent Statement

No applicable.

Data Availability Statement

The data presented in this study are available on request from the corresponding author.

Conflicts of Interest

The authors declare no conflicts of interest.

Abbreviations

The following abbreviations are used in this manuscript:
SMOSemiconductor metal oxide
RGOReduced Graphene Oxide
FESEMField emission scanning electron microscopy
XRDX-ray diffractometer
QCMQuartz Crystal Microbalance
CMUTCapacitive Micro-machined Ultrasonic Transducer
FBARFilm Bulk Acoustic Resonator
ACAlternating current
EISElectrochemical impedance spectroscopy
RHRelative humidity
PCBPrinted circuit board

References

  1. Peng, Y.; Zhao, Y.; Chen, M.Q.; Xia, F. Research advances in microfiber humidity sensors. Small 2018, 14, 1800524. [Google Scholar] [CrossRef]
  2. Ding, X.; Yan, J.; Chen, N.; Jin, T.; Zhang, R. Highly sensitive balloon-like fiber interferometer based on GO nanomaterial coated for humidity measurement. Opt. Laser Technol. 2023, 158, 108798. [Google Scholar] [CrossRef]
  3. Shaukat, R.A.; Khan, M.U.; Saqib, Q.M.; Chougale, M.Y.; Kim, J.; Bae, J. All range highly linear and sensitive humidity sensor based on 2D material TiSi2 for real-time monitoring. Sens. Actuators B Chem. 2021, 345, 130371. [Google Scholar] [CrossRef]
  4. Qiao, C.; Yao, Y.; Ao, J.; Yu, X.; Wu, D.; Shou, M.; Li, R.; Yang, P. Advances in quartz crystal microbalance relative humidity sensors: A review. Measurement 2025, 243, 116415. [Google Scholar]
  5. Park, Y.D.; Kang, B.; Lim, H.S.; Cho, K.; Kang, M.S.; Cho, J.H. Polyelectrolyte Interlayer for ultra-sensitive organic transistor humidity sensors. Appl. Mater. Interfaces 2013, 5, 8591–8596. [Google Scholar] [CrossRef]
  6. Zhang, W.; Webb, D.J.; Peng, G. Investigation into time response of polymer fiber bragg grating based humidity sensors. J. Light. Technol. 2012, 30, 1090–1096. [Google Scholar] [CrossRef]
  7. Khan, M.U.; Hassan, G.; Awais, M.; Bae, J. All printed full range humidity sensor based on Fe2O3. Sens. Actuators A Phys. 2020, 311, 112072. [Google Scholar] [CrossRef]
  8. Oliveira, R.d.M.; Nono, M.d.C.d.A.; Oliveira, G.d.S. A capacitive-type humidity sensor using porous ceramics for environmental monitoring. Adv. Mater. Res. 2014, 3258, 194–198. [Google Scholar] [CrossRef]
  9. Yun, P.S.; Lee, J.E.; Kim, Y.H.; Kim, J.J.; Shim, Y.-S.; Kim, S.Y.; Lee, M.H.; Jang, H.W. Room temperature humidity sensors based on RGO/MoS2 hybrid composites synthesized by hydrothermal method-ScienceDirect. Sens. Actuators B Chem. 2018, 258, 775–782. [Google Scholar]
  10. Patial, P.; Deshwal, M. Selectivity and sensitivity property of metal oxide semiconductor based gas sensor with dopants variation: A review. Trans. Electr. Electron. Mater. 2021, 23, 6–18. [Google Scholar] [CrossRef]
  11. Compton, O.C.; Nguyen, S.B.T. Graphene oxide, highly reduced graphene oxide, and graphene: Versatile building blocks for carbon-based materials. Small 2010, 6, 711–723. [Google Scholar] [CrossRef]
  12. Yan, H.; Chen, Z.; Zeng, L.; Wang, Z.; Zheng, G.; Zhou, R. The effect of RGO-doping on the performance of SnO2/RGO flexible humidity sensor. Nanomaterials 2021, 11, 3368. [Google Scholar] [CrossRef]
  13. Morsy, M.; Mokhtar, M.M.; Ismail, H.S.; Mohamed, G.G.; Ibrahim, M. Humidity sensing behaviour of lyophilized RGO/Fe2O3 nanocomposite. J. Inorg. Organomet. Polym. Mater. 2020, 30, 4180–4190. [Google Scholar] [CrossRef]
  14. Yang, F.; Li, P. Preparation and humidity sensing performance study of SnO2 in situ loaded RGO. Mater. Sci. Eng. B 2023, 290, 116329. [Google Scholar] [CrossRef]
  15. Shilpa, M.; Chethan, B.; Shetty, J.S.; Murari, M.S.; Waikar, M.R.; Sonkawade, R.G.; Gurumurthy, S.C. Highly responsive reduced graphene oxide embedded PVDF flexible film-based room temperature operable humidity sensor. Sens. Actuators A Phys. 2024, 366, 115011. [Google Scholar] [CrossRef]
  16. Kumar, A.; Gupta, G.; Bapna, K.; Shivagan, D.D. Semiconductor-metal-oxide-based nano-composites for humidity sensing applications. Mater. Res. Bull. 2023, 158, 112023. [Google Scholar] [CrossRef]
  17. Yao, Y.; Chen, Q.; Chen, C.; Shi, Y.; Li, L. High Performance and Cost-Effective Flexible Humidity Sensor Based on Polydopamine Coated Cellulose Nanocrystals/Graphene Oxide Nanocomposite. IEEE Sens. J. 2024, 24, 20386–20393. [Google Scholar] [CrossRef]
  18. Yao, Y.; Huang, X.; Chen, Q.; Zhang, Z.; Ling, W. High sensitivity and high stability QCM humidity sensors based on polydopamine coated cellulose nanocrystals/graphene oxide nanocomposite. Nanomaterials 2020, 10, 2210. [Google Scholar] [CrossRef]
  19. Jyothilal, H.; Shukla, G.; Walia, S.; Kundu, S.; Angappane, S. Humidity sensing and breath analyzing applications of TiO2 slanted nanorod arrays. Sens. Actuators A Phys. 2020, 301, 111758. [Google Scholar] [CrossRef]
  20. Sharma, N.; Sharma, C.; Sharma, S.; Sharma, S.; Paul, S. The synergetic effect of PdCr based bimetallic catalysts supported on RGO-TiO2 for organic transformations. Results Chem. 2022, 4, 100524. [Google Scholar] [CrossRef]
  21. Li, M.; Li, X.; Ge, S.; Li, W.; Li, R.; Wei, G. High Sensing performance of n-butanol gas sensor based on mesoporous Cu-Doped α- Fe2O3 nanoparticle materials. IEEE Sens. J. 2024, 224, 35406–35412. [Google Scholar] [CrossRef]
  22. Ruidíaz-Martínez, M.; Álvarez, M.A.; López-Ramón, M.V.; Cruz-Quesada, G.; Rivera-Utrilla, J.; Sánchez-Polo, M. Hydrothermal synthesis of rGO-TiO2 composites as high-performance UV Photocatalysts for Ethylparaben degradation. Catalysts 2020, 10, 520. [Google Scholar] [CrossRef]
  23. Kumar, P.; Khan, M.Q.; Khan, R.A.; Ahmad, K.; Kim, H. Hydrothermal synthesis of MnO2/Reduced graphene oxide composite for 4-Nitrophenol sensing applications. Inorganics 2022, 10, 219. [Google Scholar] [CrossRef]
  24. Yu, S.; Zhang, H.; Zhang, J.; Hu, Z. High-sensitivity RGO-TiO2 humidity sensor driven by triboelectric nanogenerators for non-contact monitoring of human respiration. J. Alloys Compd. 2023, 935, 168006. [Google Scholar] [CrossRef]
  25. Wu, J.; Chen, Y.; Shen, W.; Wu, Y.; Corriou, J.P. Highly sensitive, flexible and transparent TiO2/Nanocellulose humidity sensor for respiration and skin monitoring. Ceram. Int. 2023, 49, 2204–2214. [Google Scholar] [CrossRef]
  26. Gu, L.; Zheng, K.; Zhou, Y.; Li, J.; Mo, X.; Patzke, G.R.; Chen, G. Humidity sensors based on ZnO/TiO2 core/shell nanorod arrays with enhanced sensitivity. Sens. Actuators B Chem. 2011, 159, 1–7. [Google Scholar] [CrossRef]
  27. Dutt, M.; Suhasini, K.; Ratan, A.; Shah, J.; Kotnala, R.K.; Singh, V. Mesoporous silica mediated synthesis of α-Fe2O3 porous structures and their application as humidity sensors. J. Mater. Sci. Mater. Electron. 2018, 29, 20506–20516. [Google Scholar] [CrossRef]
  28. Biju, K.P.; Jain, M.K. Sol–gel derived TiO2:ZrO2 multilayer thin films for humidity sensing application. Sens. Actuators B Chem. 2008, 128, 407–413. [Google Scholar] [CrossRef]
  29. Singh, P.; Kushwaha, C.S.; Shukla, S.K.; Dubey, G.C. Synthesis and humidity sensing property of α-Fe2O3 and polyaniline composite. Mater. Today Proc. 2018, 5, 9118–9125. [Google Scholar] [CrossRef]
  30. Huang, J. Diffusion impedance of electroactive materials, electrolytic solutions and porous electrodes: Warburg impedance and beyond. Electrochim. Acta 2018, 281, 170–188. [Google Scholar] [CrossRef]
  31. Scribner Associates. (n.d.). ZView Software: User Manual. Southern Pines, NC: Scribner Associates Inc. Available online: https://www.scribner.com (accessed on 12 May 2024).
Figure 1. Schematic and structure of the humidity sensor.
Sensors 25 00691 g001
Figure 2. Experimental setup for humidity sensor testing.
Sensors 25 00691 g002
Figure 3. Humidity-sensing mechanism at (a) low and (b) high humidity levels.
Sensors 25 00691 g003
Figure 4. X-ray diffraction patterns of (a) TiO2/RGO and (b) α-Fe2O3/RGO.
Sensors 25 00691 g004
Figure 5. SEM image of (a) TiO2/RGO and (b) α-Fe2O3/RGO. An inset with a larger magnification is shown in the upper right corner. The magnification of the main images is 20,000×, while the magnifications of the inset images in (a,b) are 200,000× and 50,000×, respectively.
Sensors 25 00691 g005
Figure 6. Hysteresis curves of (a) TiO2/RGO and (b) α-Fe2O3/RGO.
Sensors 25 00691 g006
Figure 7. Response and recovery transients of (a) TiO2/RGO and (b) α-Fe2O3/RGO.
Sensors 25 00691 g007
Figure 8. Complex impedance plot of (a) TiO2/RGO and (b) α-Fe2O3/RGO. The scanning frequency ranges from 1 Hz to 1 MHz.
Sensors 25 00691 g008
Figure 9. Typical equivalent circuit at (a) low and (b) high humidity conditions.
Sensors 25 00691 g009
Figure 10. |Z| versus frequency (log(f)) of (a) TiO2/RGO and (b) α-Fe2O3/RGO under various RH.
Sensors 25 00691 g010
Figure 11. Repeatability test of (a) TiO2/RGO and (b) α-Fe2O3/RGO.
Sensors 25 00691 g011
Figure 12. Stability curves of (a) TiO2/RGO and (b) α-Fe2O3/RGO in different humidities.
Sensors 25 00691 g012
Table 1. Relative humidity of saturated salt solution (25 °C).
Saturated Salt SolutionRelative Humidity (100%)
LiCl11
CH3COOK23
MgCl233
K2CO343
NaBr58
NaCl75
KCl85
K2SO497
Table 2. Comparison of humidity-sensing performance.
MaterialsResponse (s)Recovery (s)SensitivitySensing TypeRef.
ZnO/TiO2774.919.72.04 × 103 pF/%RHcapacitance[26]
RGO/SnO28042.36 × 103 pF/%RHcapacitance[12]
α-Fe2O3601400.16 MΩ/%RHimpedance[27]
ZrO2/TiO2541240.84 MΩ/%RHimpedance[28]
RGO/Fe2O3634820.35 MΩ/%RHimpedance[13]
SnO2/RGO45813.10 MΩ/%RHimpedance[14]
PANI/α-Fe2O370900.22 KΩ/%RHresistance[29]
α-Fe2O3/RGO48540.83 MΩ/%RHresistanceThis work
RGO/TiO2729912.20 MΩ/%RHresistanceThis work
Table 3. Fitting values of each element of the equivalent circuit at various humidity.
HumidityR(Ω)C(pF)WOR(Ω)WoTWOP
11%RH (TiO2/RGO)11.97 M28.26---
58%RH (TiO2/RGO)6.573 M28.04---
97%RH (TiO2/RGO)498.370 K91.332.6257 M0.173080.17417
11%RH (α-Fe2O3/RGO)1.3432 M98.67---
58%RH (α-Fe2O3/RGO)72.411 K52.292.0592 M0.836740.43813
97%RH (α-Fe2O3/RGO)28.875 K57.921.3143 M0.808890.42651
Disclaimer/Publisher’s Note: The statements, opinions and data contained in all publications are solely those of the individual author(s) and contributor(s) and not of MDPI and/or the editor(s). MDPI and/or the editor(s) disclaim responsibility for any injury to people or property resulting from any ideas, methods, instructions or products referred to in the content.

