
CR-Mask RCNN: An Improved Mask RCNN Method for Airport Runway Detection and Segmentation in Remote Sensing Images


Abstract
1. Introduction
- (1)
- A method for end-to-end airport runway detection and segmentation in remote sensing images based on an improved Mask RCNN is proposed to enhance the capability of feature extraction for airport runways.
- (2)
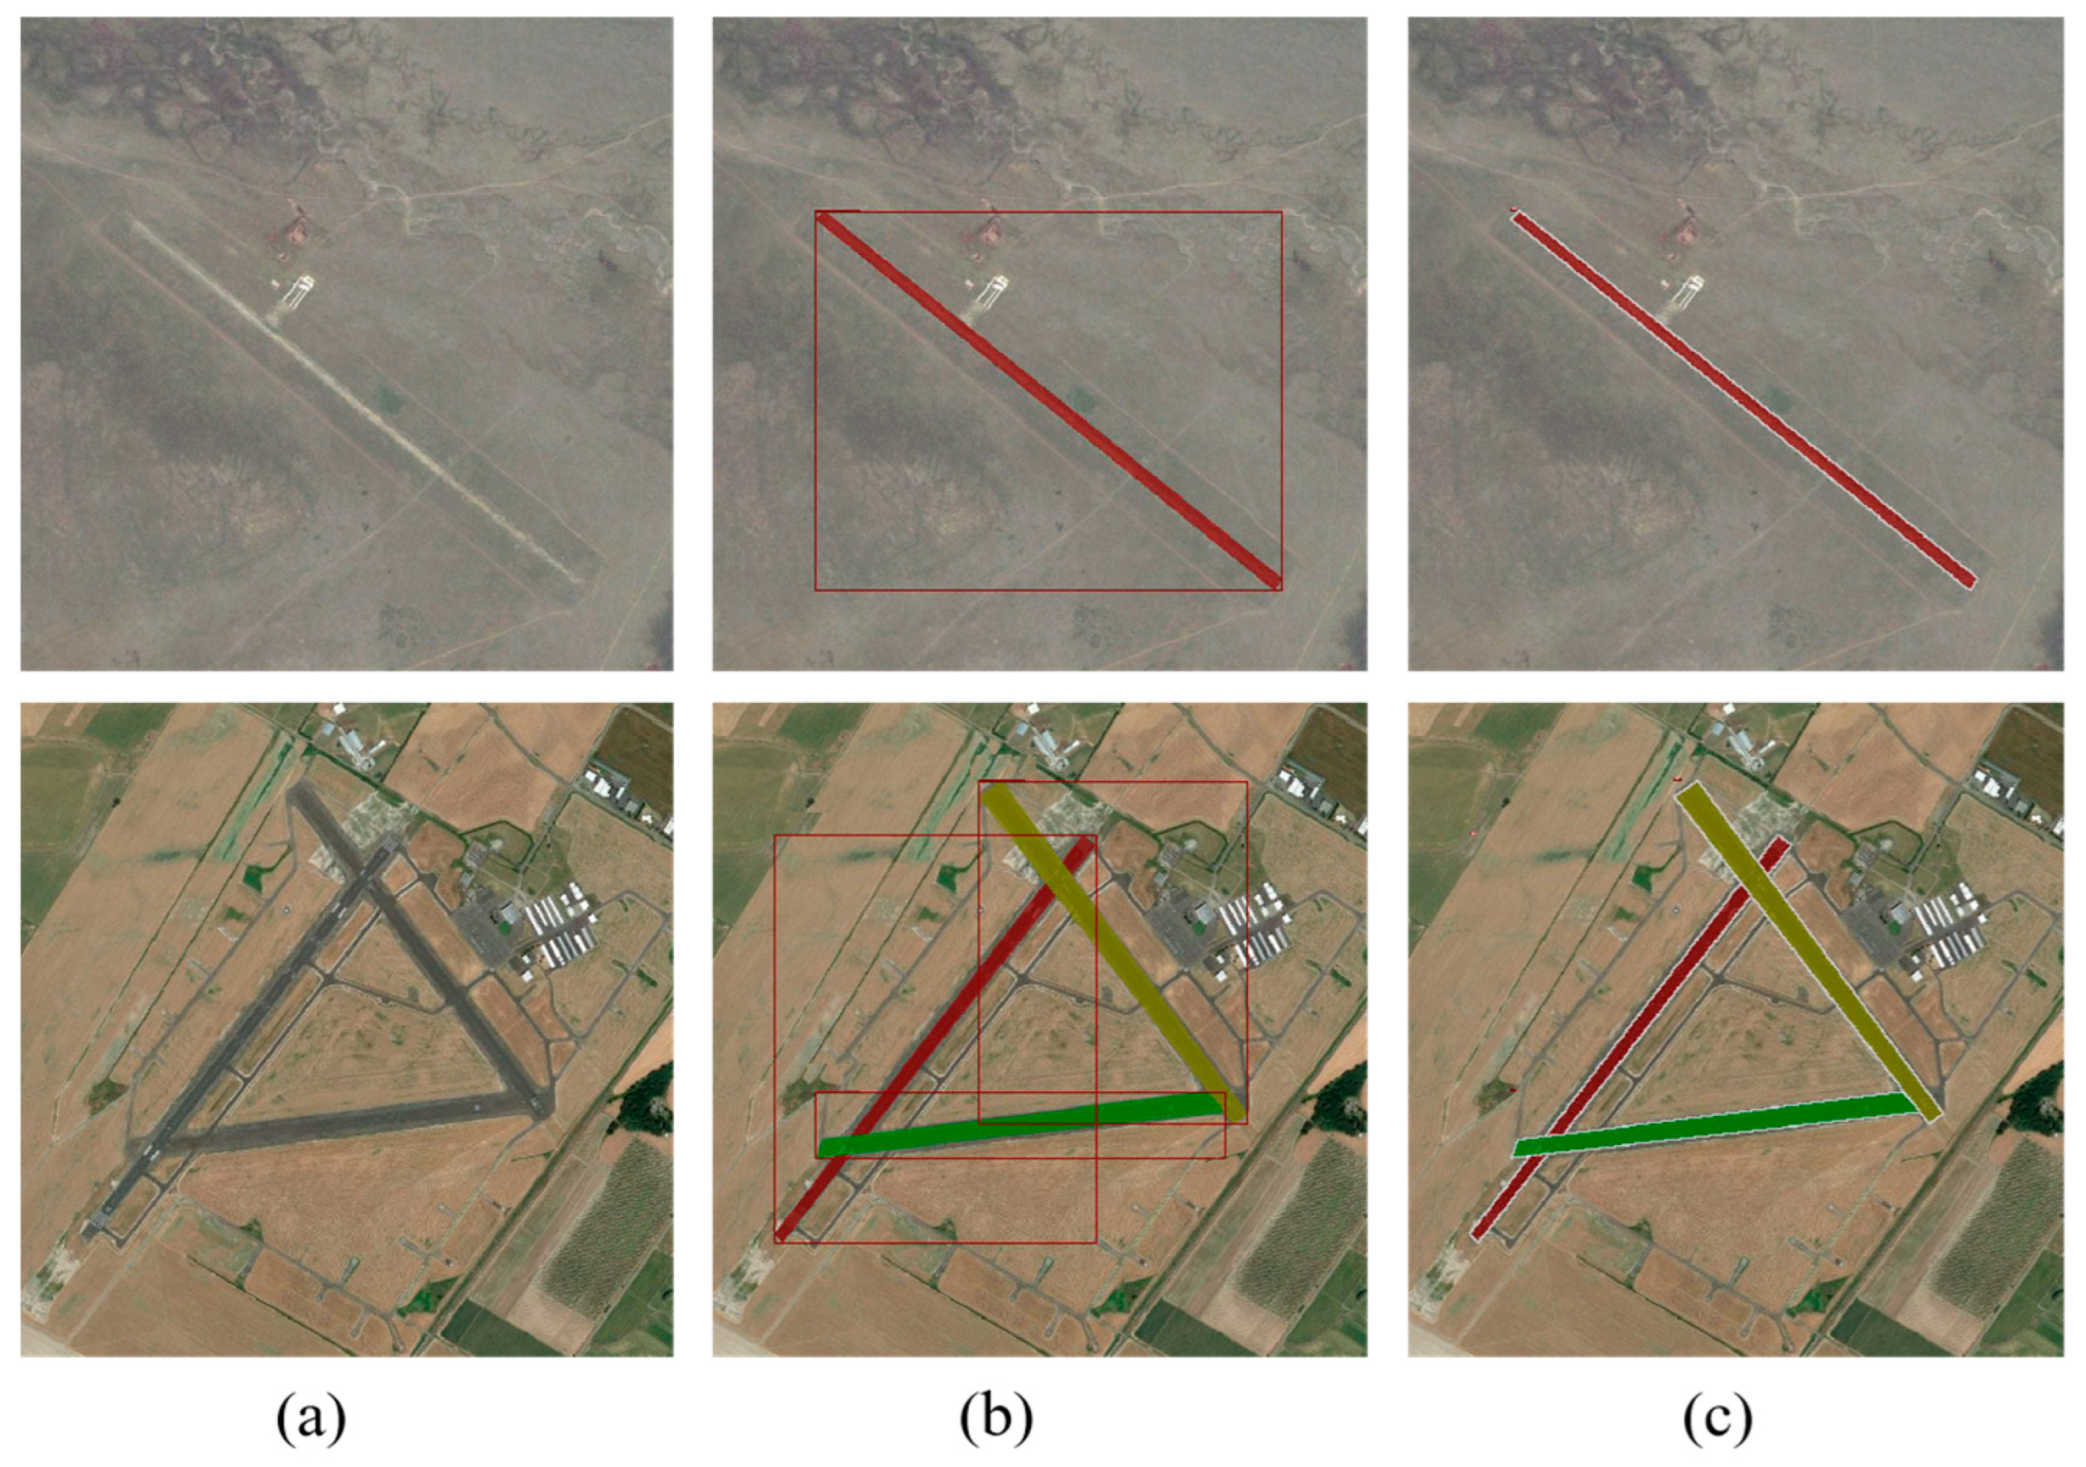
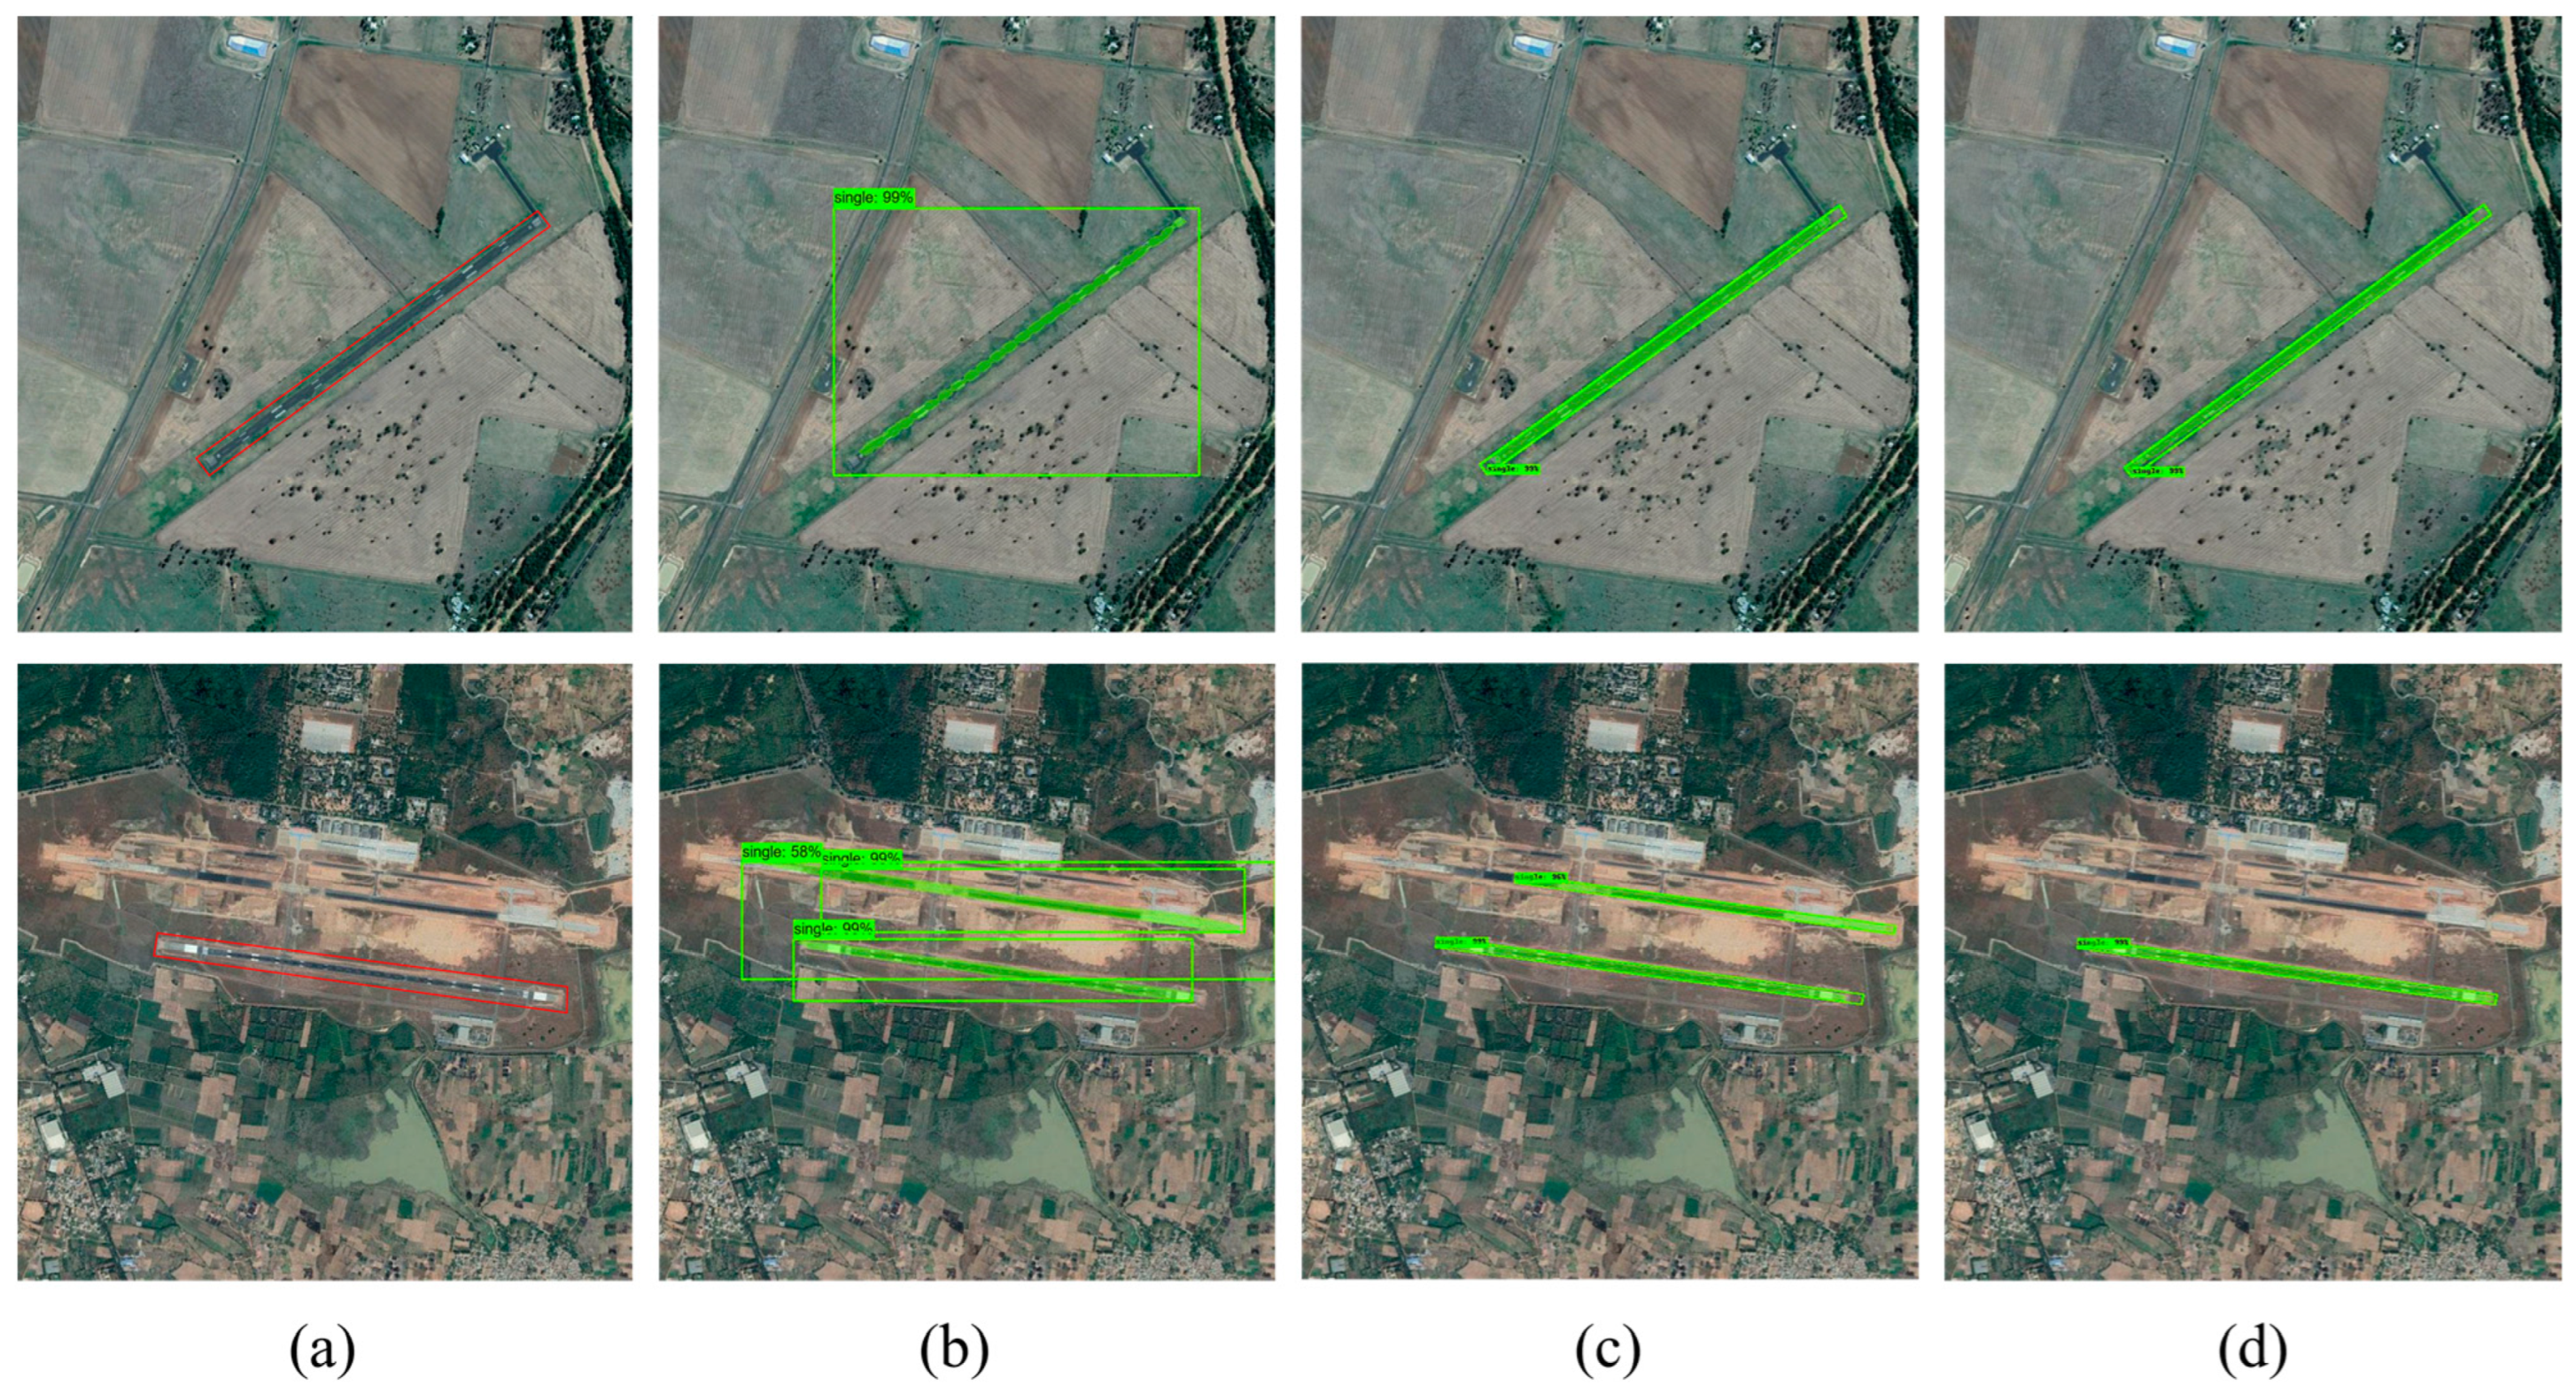
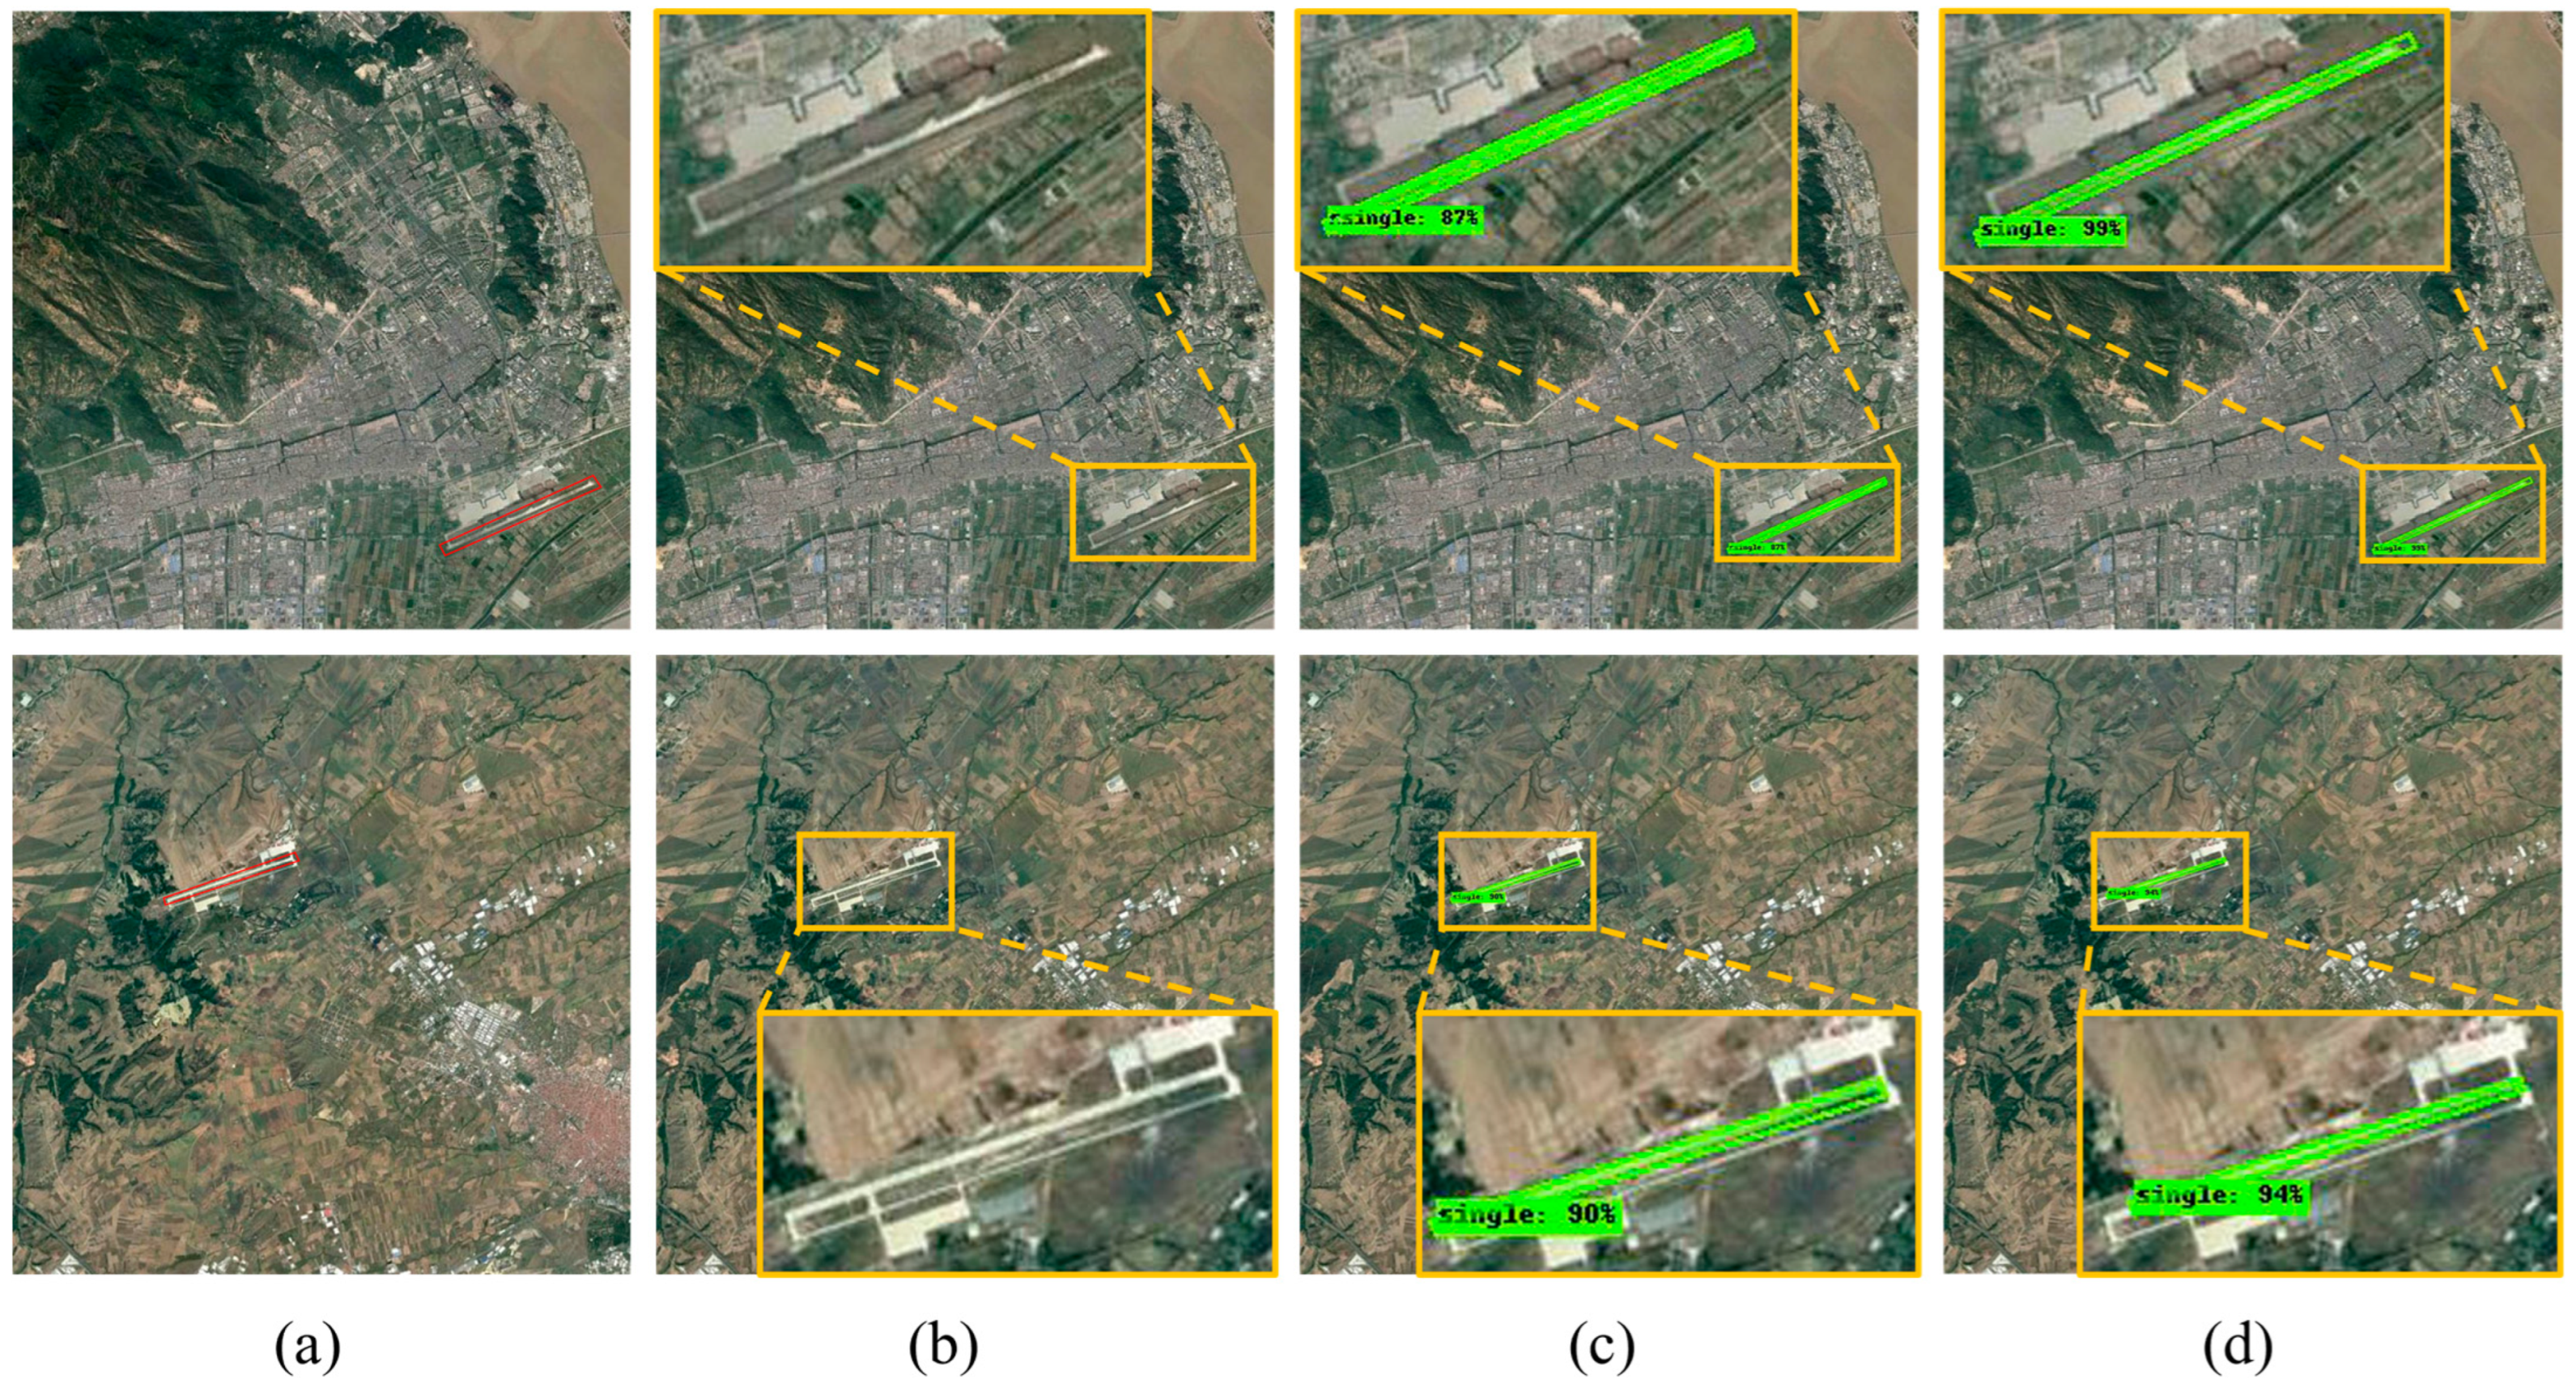
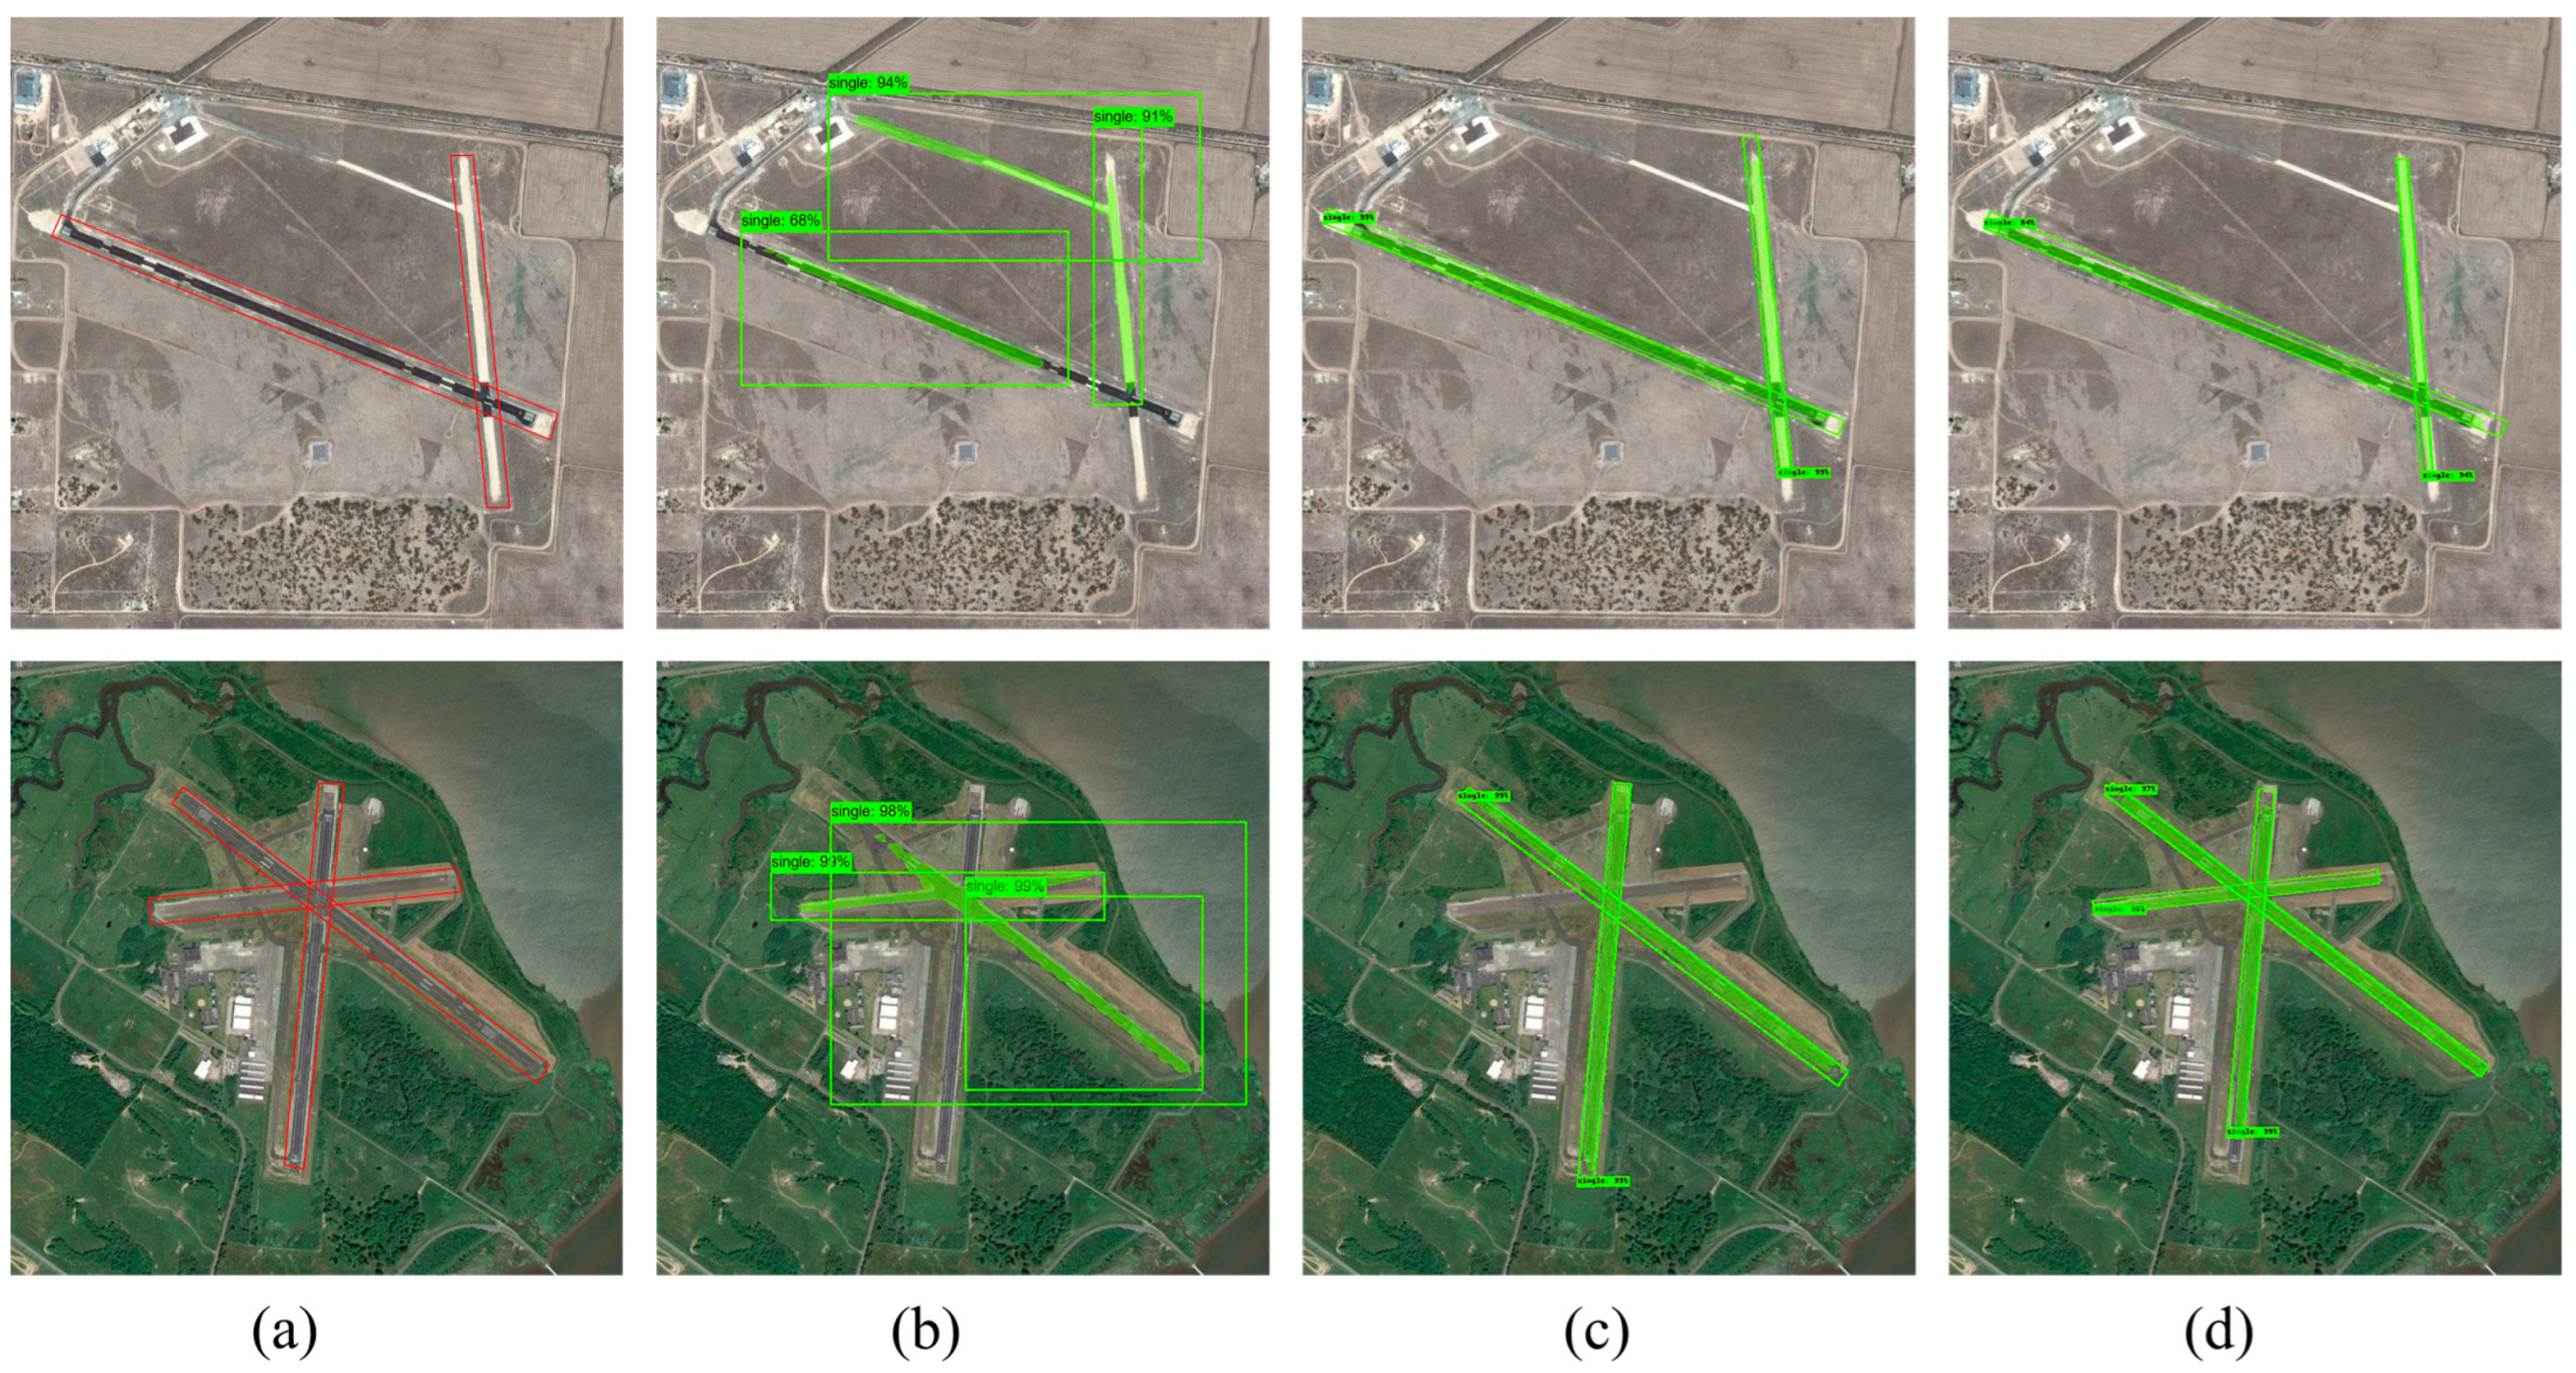
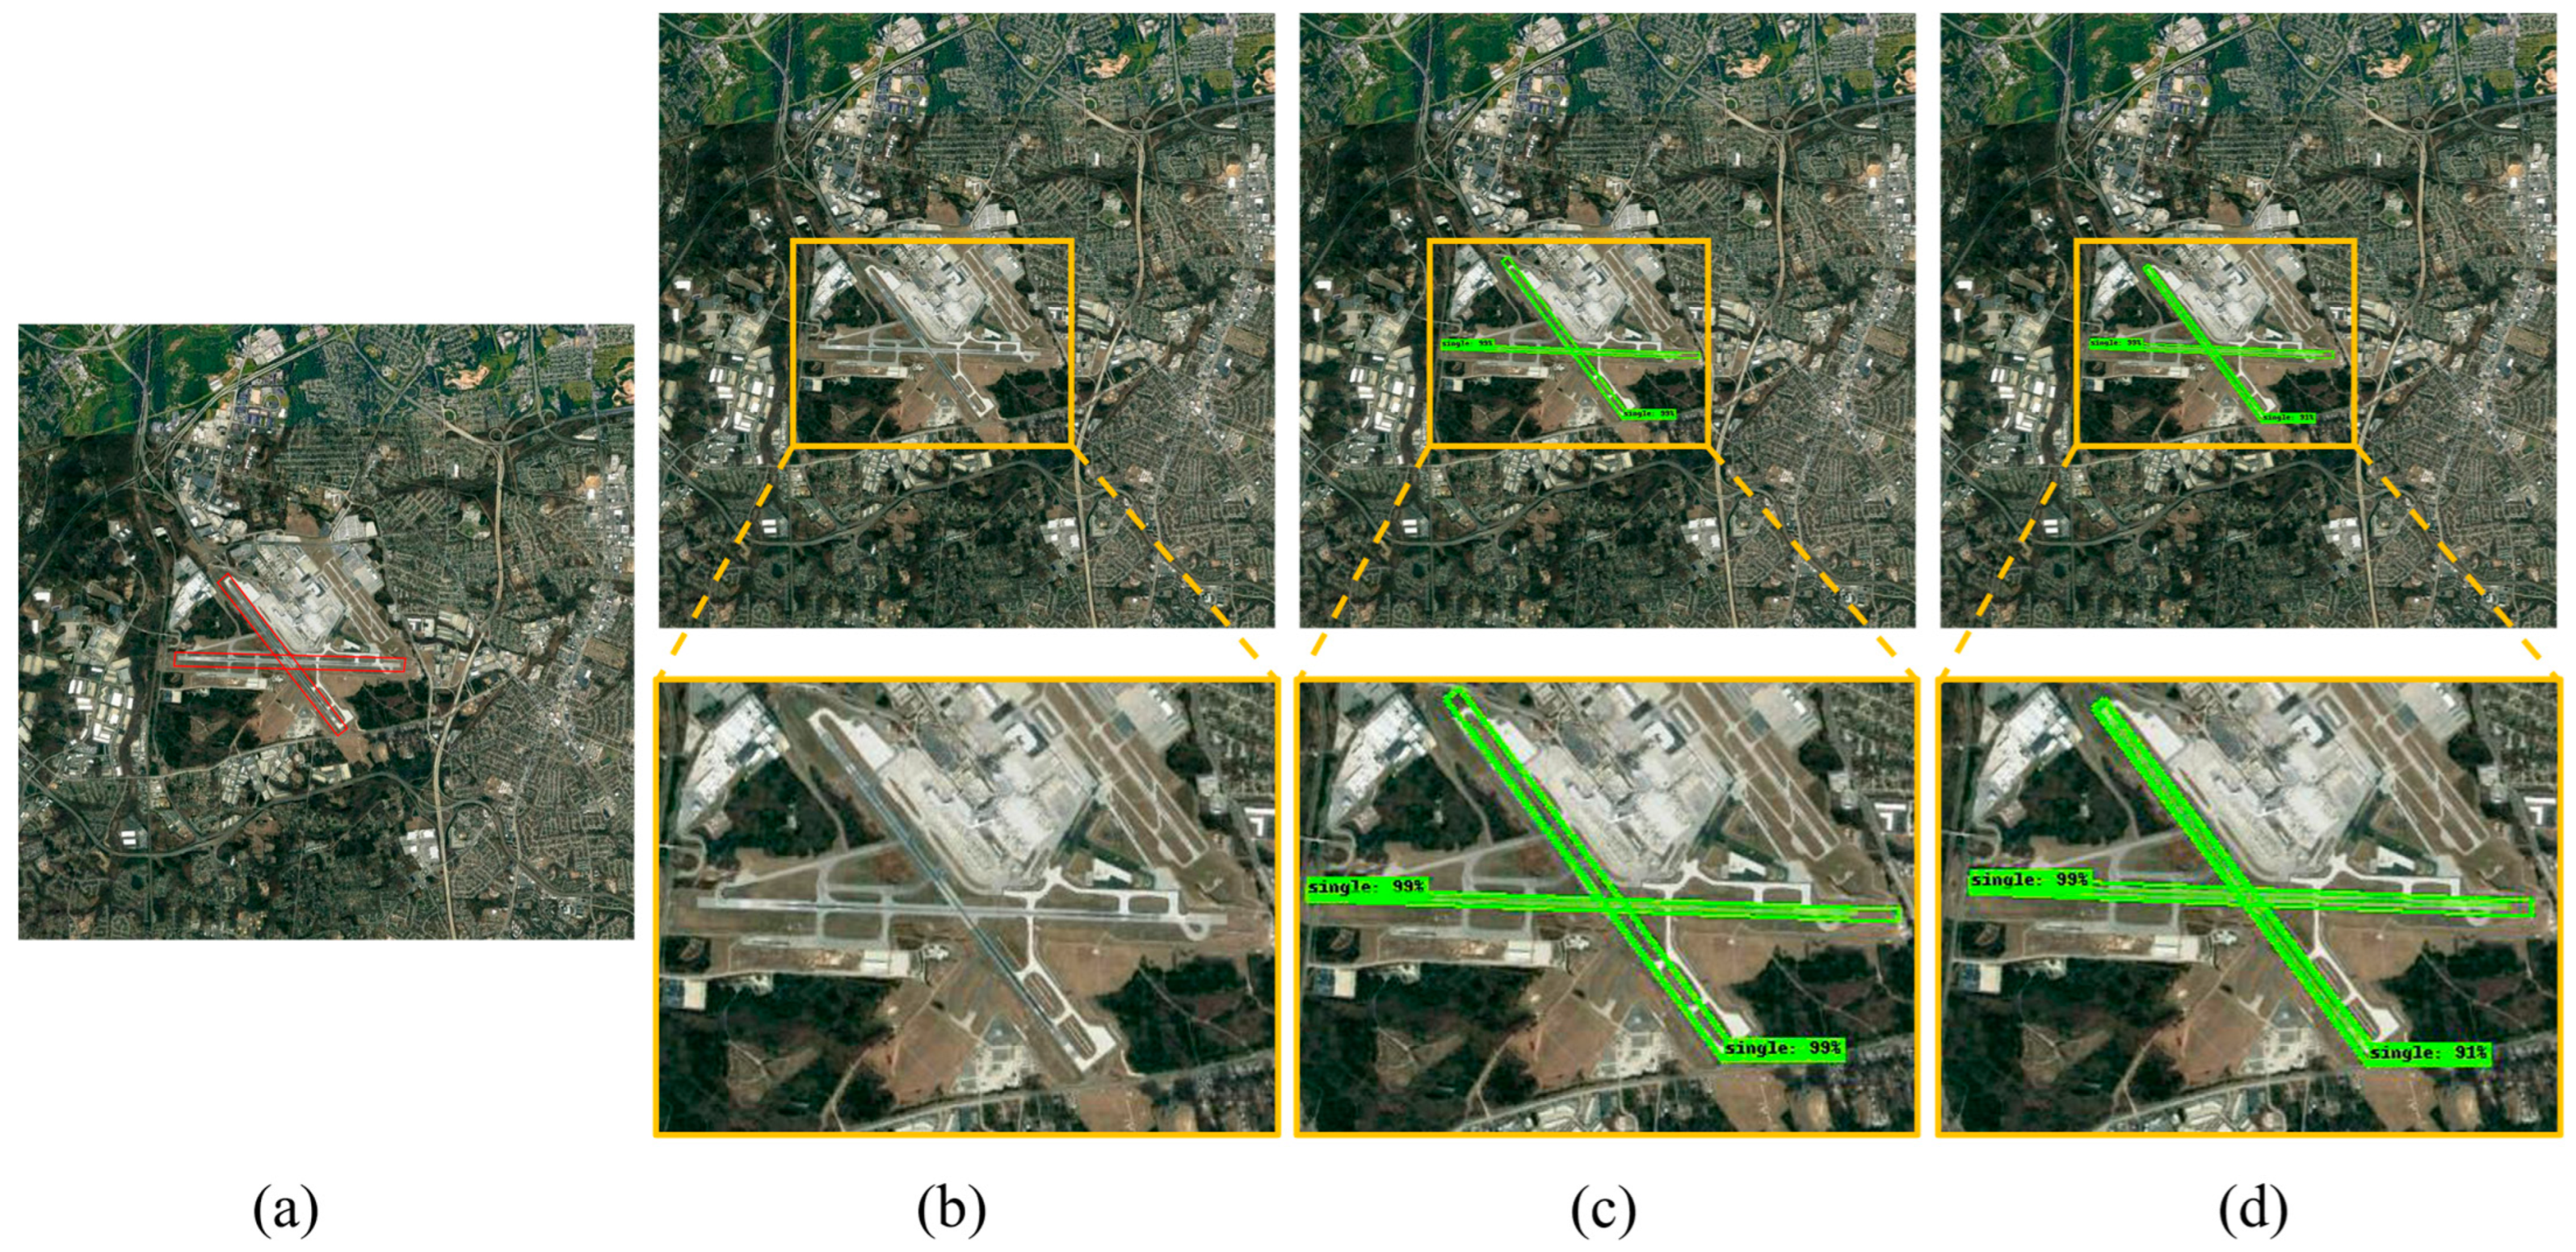
- To address the detection of airport runways, which are long, narrow, and rotational targets with variable orientations, this study uses RRPN to replace the traditional RPN, in order to avoid the interference of irrelevant background information caused by horizontal bounding boxes. Meanwhile, when extracting the region of interest (ROI), the RROI Align layer is used to replace the ROI Align layer, ensuring effective feature alignment under rotation and maintaining the spatial consistency of airport runways on the feature map, thus accurately cropping the features that match the target region. This method significantly improves the accuracy of the detection and segmentation of airport runways; in particular, it shows more pronounced effects in addressing the issue of false negatives of airport runways in large-scale images.
- (3)
- An attention mechanism is incorporated into the backbone feature extraction network, which enhances the response of the feature extractor to airport runway targets and suppresses background noise. This improvement further increases the accuracy of airport runway detection, significantly enhances the precision of airport runway segmentation, and reduces the occurrence of false positives and false negatives in airport runway detection. In particular, when handling multiple intersecting airport runways in a single remote sensing image, it effectively reduces the probability of false positives and false negatives.
2. Methods
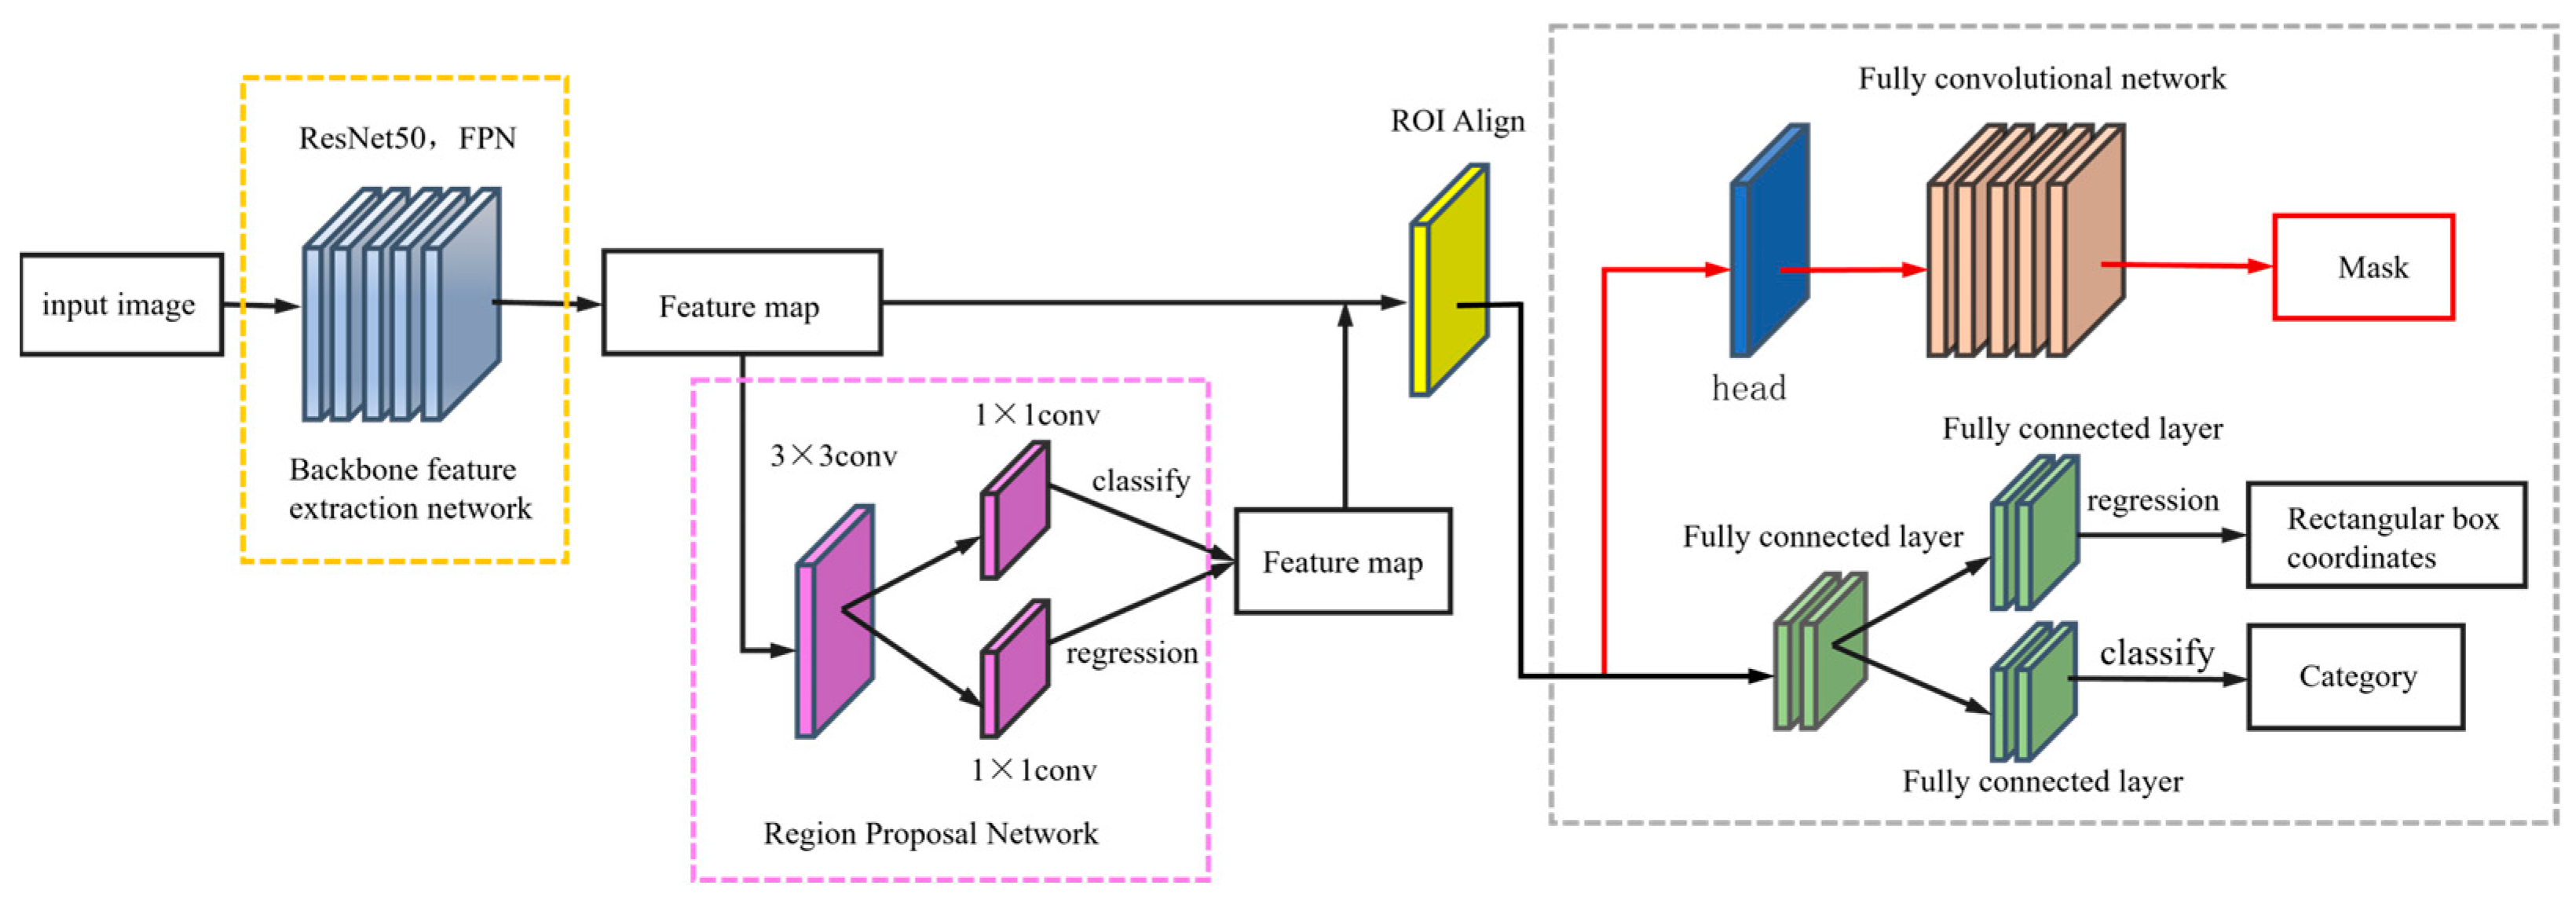
2.1. Base Network Model
2.2. Improvement Strategy of Mask RCNN Based on Airport Runways
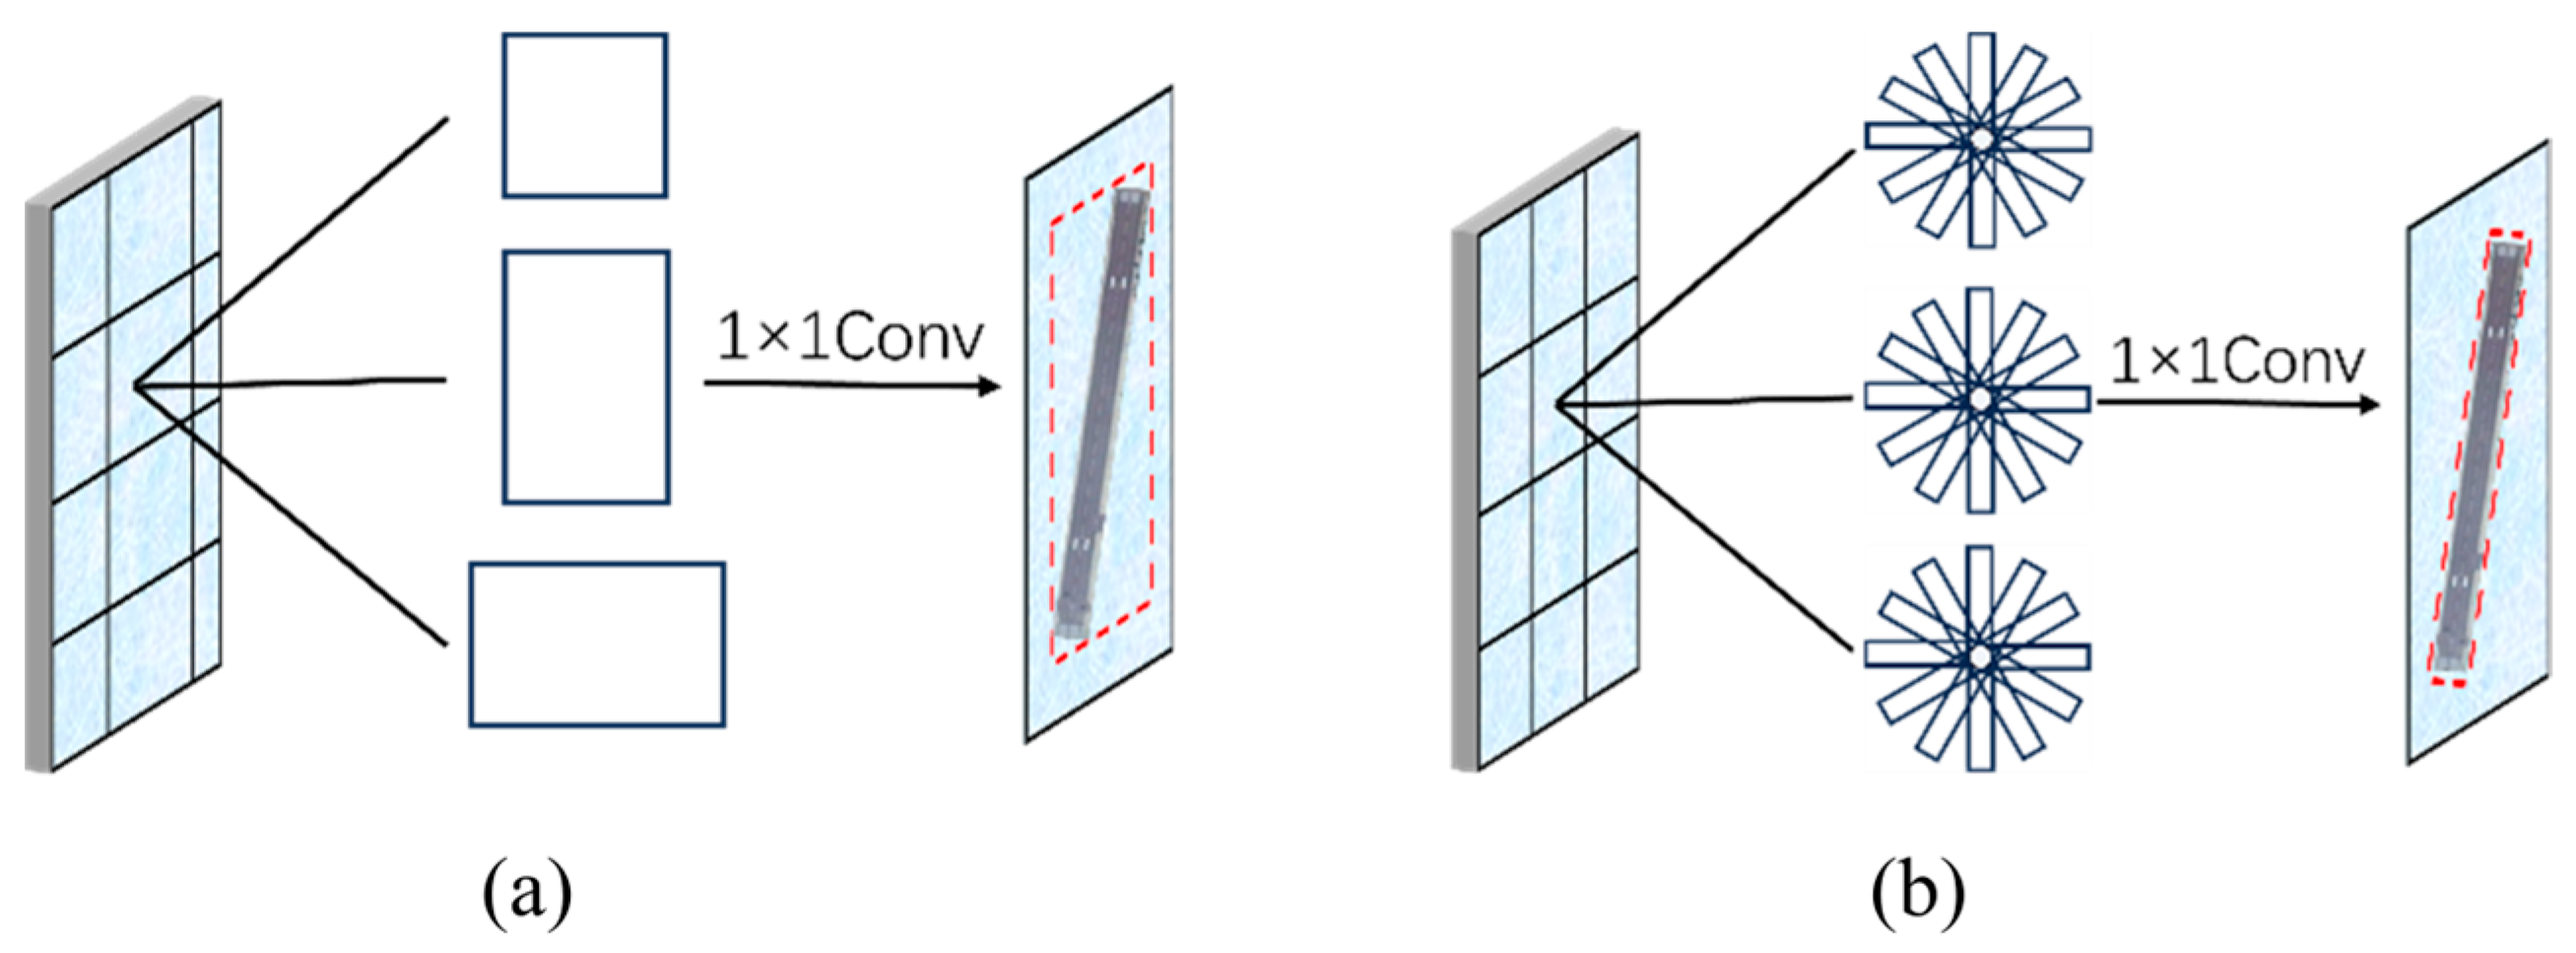
2.2.1. Replace the RPN Network with the RRPN Network
- (1)
- The Intersection Over Union (IOU) ratio between the bounding box and the sample true label is greater than 0.7.
- (2)
- The angle difference between the bounding box and the ground truth label is less than 15°.
2.2.2. Optimizing the ROI Align Layer
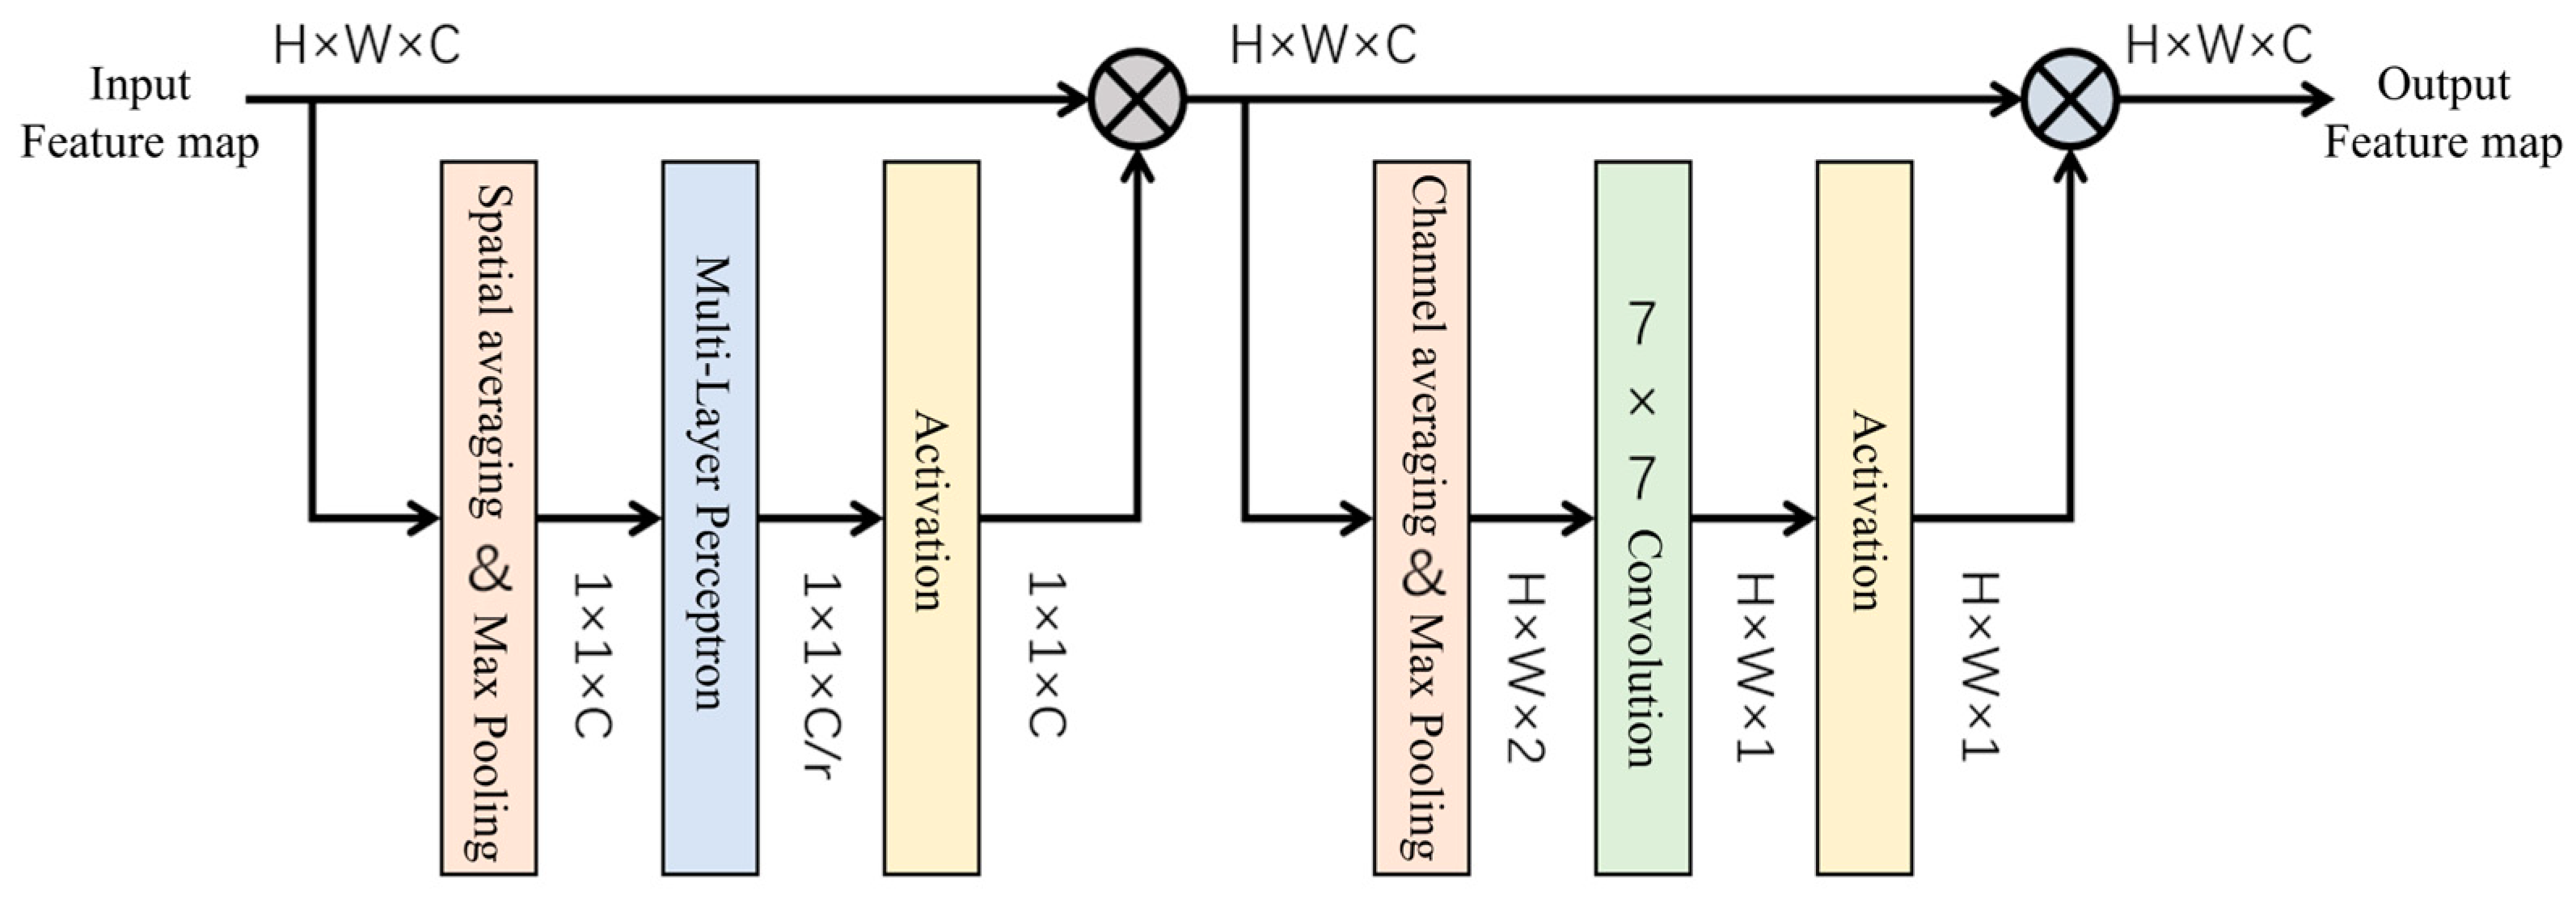
2.2.3. Integrate the Attention Mechanism into the Backbone Feature Extraction Network
3. Experiments and Analyses
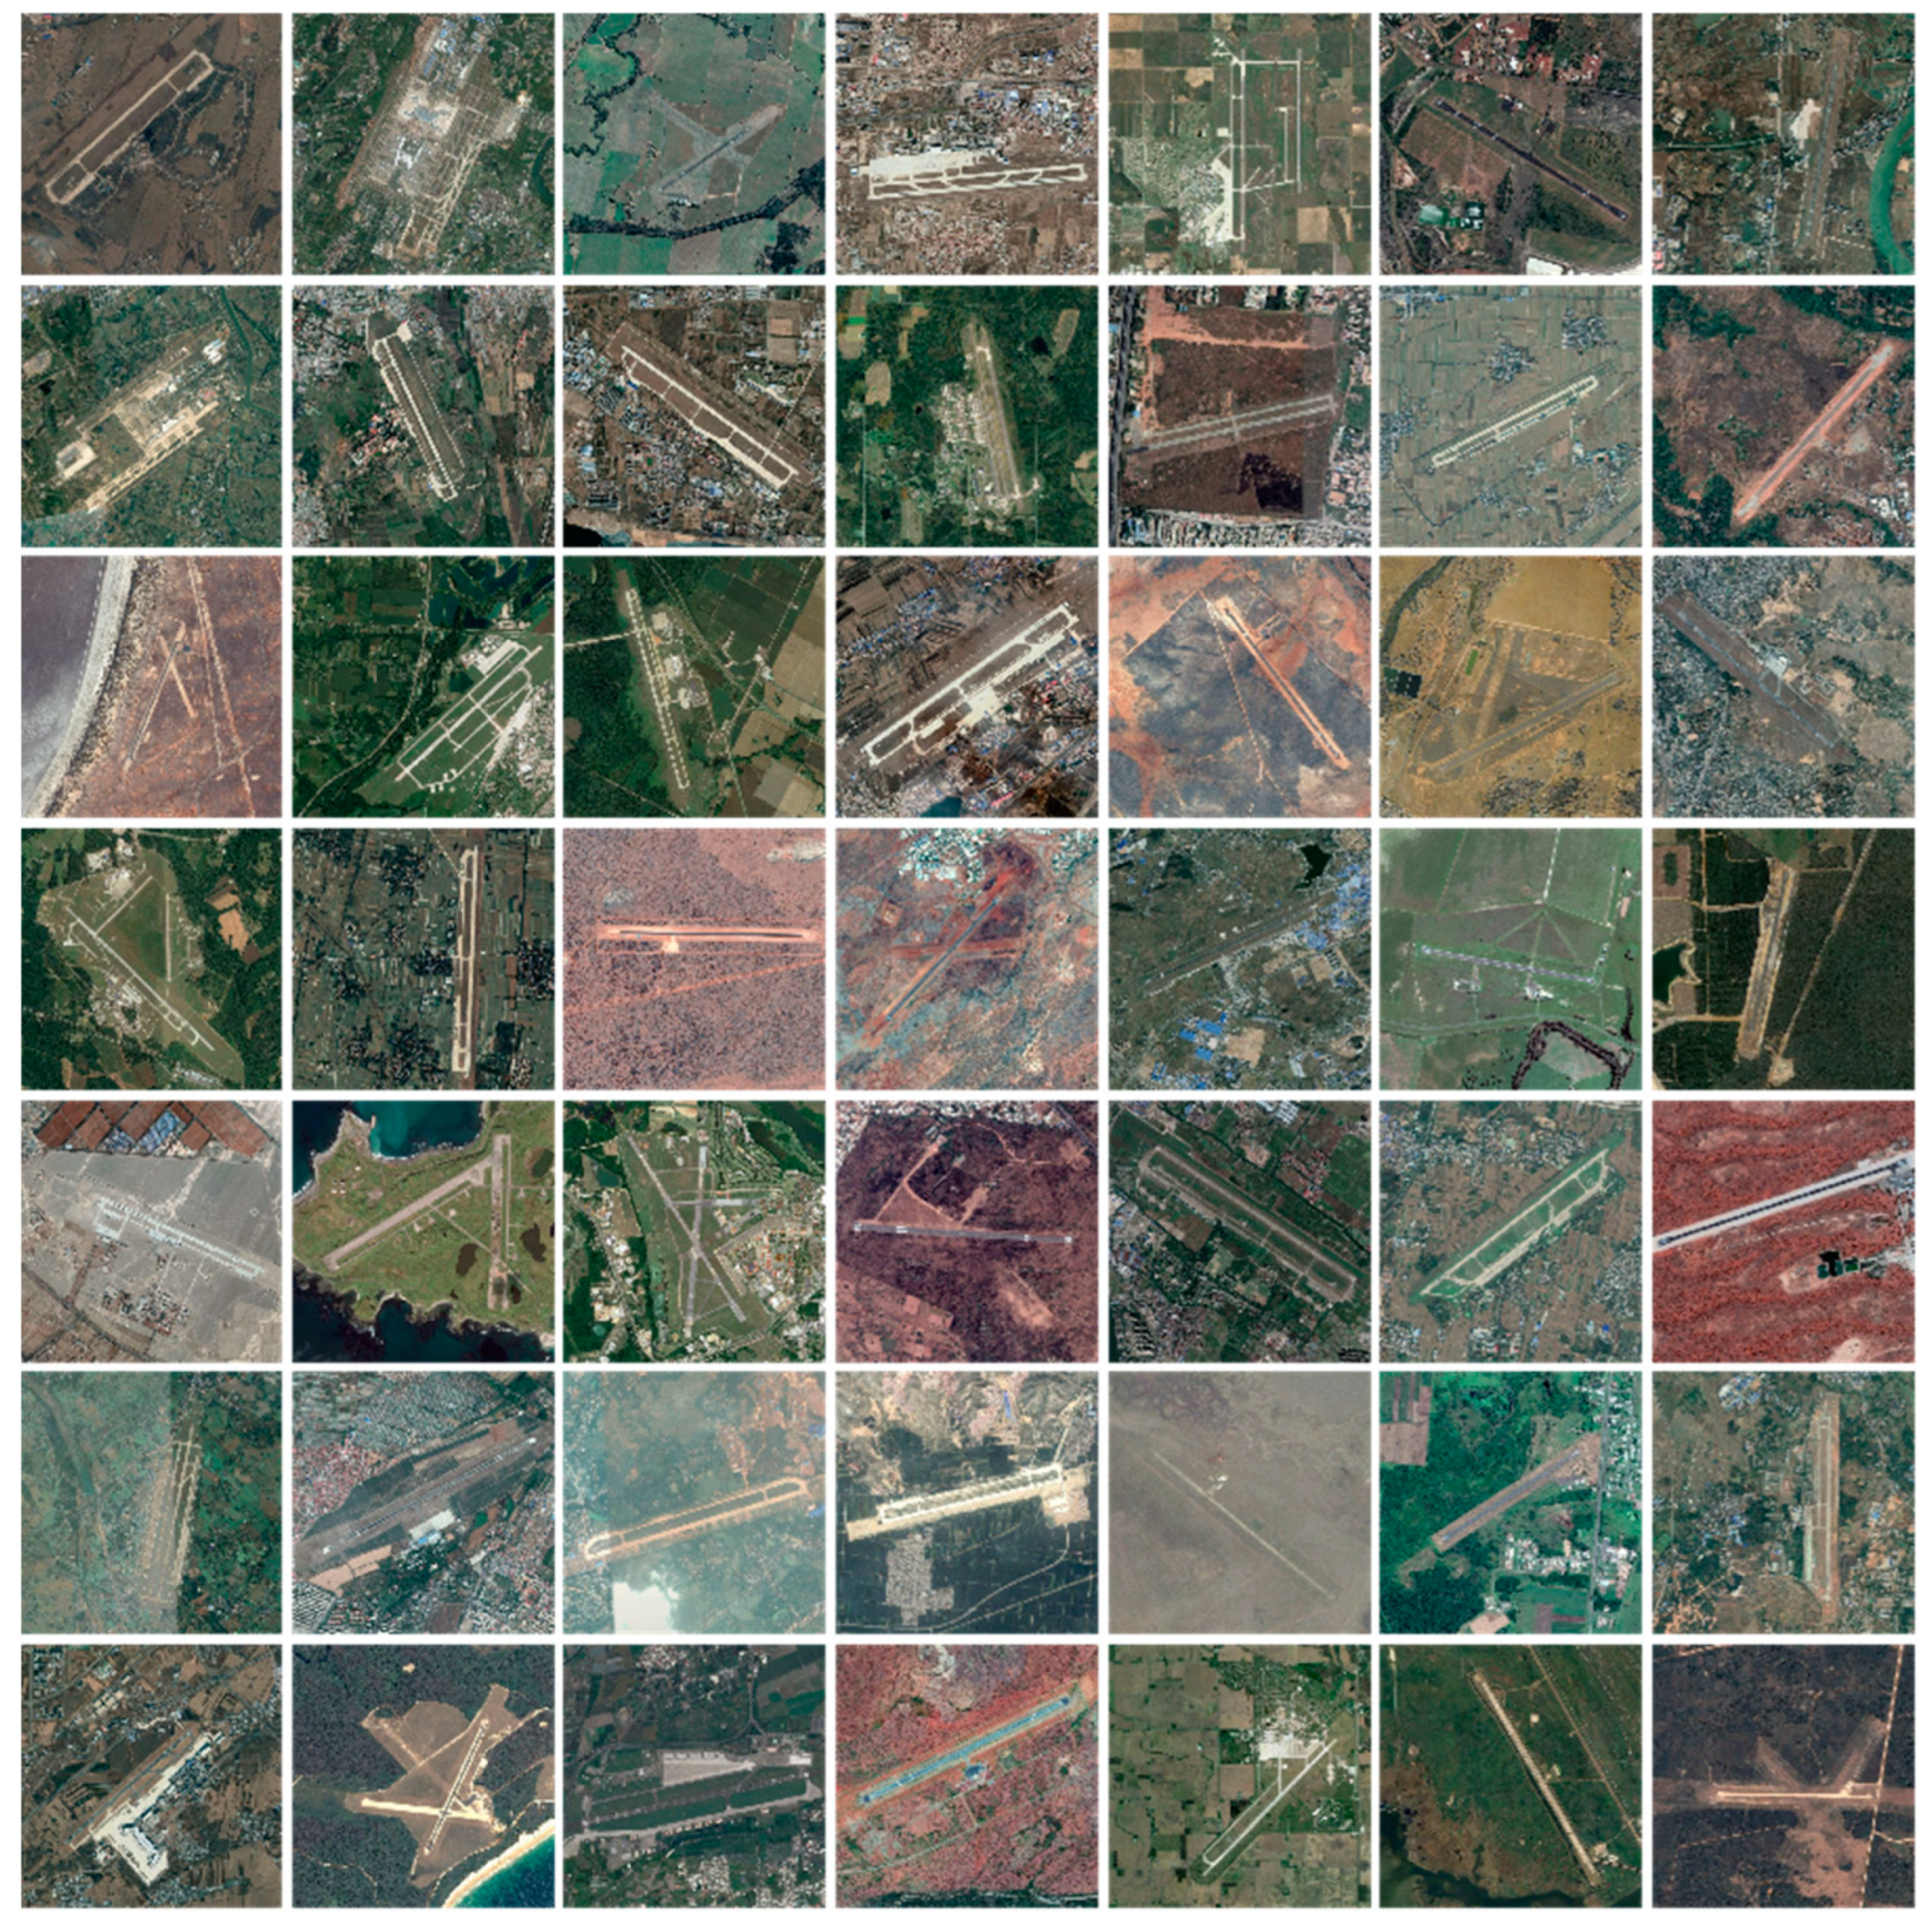
3.1. Airport Runway Experimental Dataset
3.2. Evaluation Indicators
3.3. Experimental Environment and Setup
- (1)
- When the IOU with the bounding box that has the highest confidence level is greater than 0.5.
- (2)
- When the IOU between two bounding boxes is greater than 0.3 and less than 0.5 while their angle difference is less than 15°.
3.4. Analysis of Experimental Results
4. Conclusions
Author Contributions
Funding
Institutional Review Board Statement
Informed Consent Statement
Data Availability Statement
Conflicts of Interest
References
- Tang, G.; Xiao, Z.; Liu, Q.; Liu, H. A Novel Airport Detection Method via Line Segment Classification and Texture Classification. IEEE Geosci. Remote Sens. Lett. 2015, 12, 2408–2412. [Google Scholar] [CrossRef]
- Pi, Y.; Fan, L.; Yang, X. Airport Detection and Runway Recognition in SAR Images. In Proceedings of the IGARSS 2003. 2003 IEEE International Geoscience and Remote Sensing Symposium. Proceedings (IEEE Cat. No.03CH37477), Toulouse, France, 21–25 July 2003. [Google Scholar]
- Budak, U.; Halici, U.; Sengur, A.; Karabatak, M.; Xiao, Y. Efficient Airport Detection Using Line Segment Detector and Fisher Vector Representation. IEEE Geosci. Remote Sens. Lett. 2016, 13, 1079–1083. [Google Scholar] [CrossRef]
- Ding, W.; Wu, J. An Airport Knowledge-Based Method for Accurate Change Analysis of Airport Runways in VHR Remote Sensing Images. Remote Sens. 2020, 12, 3163. [Google Scholar] [CrossRef]
- Zhang, F.; Du, B.; Zhang, L.; Xu, M. Weakly Supervised Learning Based on Coupled Convolutional Neural Networks for Aircraft Detection. IEEE Trans. Geosci. Remote Sens. 2016, 54, 5553–5563. [Google Scholar] [CrossRef]
- Tang, J.; Deng, C.; Huang, G.-B.; Zhao, B. Compressed-Domain Ship Detection on Spaceborne Optical Image Using Deep Neural Network and Extreme Learning Machine. IEEE Trans. Geosci. Remote Sens. 2015, 53, 1174–1185. [Google Scholar] [CrossRef]
- Liu, D.; He, L.; Carin, L. Airport Detection in Large Aerial Optical Imagery. In Proceedings of the 2004 IEEE International Conference on Acoustics, Speech, and Signal Processing, Montreal, QC, Canada, 17–21 May 2004. [Google Scholar]
- Yin, S.; Li, H.; Teng, L. Airport Detection Based on Improved Faster RCNN in Large Scale Remote Sensing Images. Sens. Imaging 2020, 21, 1–13. [Google Scholar] [CrossRef]
- Xu, Y.; Zhu, M.; Li, S.; Feng, H.; Ma, S.; Che, J. End-to-End Airport Detection in Remote Sensing Images Combining Cascade Region Proposal Networks and Multi-Threshold Detection Networks. Remote Sens. 2018, 10, 1516. [Google Scholar] [CrossRef]
- Chen, F.; Ren, R.; Van de Voorde, T.; Xu, W.; Zhou, G.; Zhou, Y. Fast Automatic Airport Detection in Remote Sensing Images Using Convolutional Neural Networks. Remote Sens. 2018, 10, 443. [Google Scholar] [CrossRef]
- Khelifi, A.; Gemici, M.; Carannante, G.; Johnson, C.C.; Bouaynaya, N.C. A Deep Learning Approach For Airport Runway Detection and Localization From Satellite Imagery. In Proceedings of the 2023 IEEE Symposium on Computers and Communications (ISCC), Gammarth, Tunisia, 9–12 July 2023; pp. 1066–1069. [Google Scholar]
- Li, Y.; Li, M.; Li, S.; Li, Y. Improved YOLOv5 for Remote Sensing Rotating Object Detection. In Proceedings of the 2021 6th International Conference on Communication, Image and Signal Processing (CCISP), Chengdu, China, 19–21 November 2021. [Google Scholar]
- Ji, C.; Cheng, L.; Li, N.; Zeng, F.; Li, M. Validation of Global Airport Spatial Locations From Open Databases Using Deep Learning for Runway Detection. IEEE J. Sel. Top. Appl. Earth Obs. Remote Sens. 2021, 14, 1120–1131. [Google Scholar] [CrossRef]
- Girshick, R.; Donahue, J.; Darrell, T.; Malik, J. Rich Feature Hierarchies for Accurate Object Detection and Semantic Segmentation. In Proceedings of the 2014 IEEE Conference on Computer Vision and Pattern Recognition, Columbus, OH, USA, 23–28 June 2014. [Google Scholar]
- Girshick, R. Fast R-CNN. In Proceedings of the 2015 IEEE International Conference on Computer Vision (ICCV), Santiago, Chile, 7–13 December 2015. [Google Scholar]
- Ren, S.; He, K.; Girshick, R.; Sun, J. Faster R-CNN: Towards Real-Time Object Detection with Region Proposal Networks. IEEE Trans. Pattern Anal. Mach. Intell. 2017, 39, 1137–1149. [Google Scholar] [CrossRef] [PubMed]
- He, K.; Gkioxari, G.; Dollar, P.; Girshick, R. Mask R-CNN. IEEE Trans. Pattern Anal. Mach. Intell. 2020, 42, 386–397. [Google Scholar] [CrossRef] [PubMed]
- Li, K.; Wan, G.; Cheng, G.; Meng, L.; Han, J. Object Detection in Optical Remote Sensing Images: A Survey and a New Benchmark. ISPRS J. Photogramm. Remote Sens. 2020, 159, 296–307. [Google Scholar] [CrossRef]
- Wang, P.; Hu, W.; Zhang, J.; Wen, Y.; Xu, C.; Qian, D. Enhanced Rotated Mask R-CNN for Chromosome Segmentation. In Proceedings of the 2021 43rd Annual International Conference of the IEEE Engineering in Medicine & Biology Society (EMBC), Mexico City, Mexico, 1–5 November 2021. [Google Scholar]
- Yang, S.; Pei, Z.; Zhou, F.; Wang, G. Rotated faster R-CNN for oriented object detection in aerial images. In Proceedings of the 2020 3rd International Conference on Robot Systems and Applications (ICRSA), Chengdu, China, 14–16 June 2020; pp. 35–39. [Google Scholar]
- Ma, J.; Shao, W.; Ye, H.; Wang, L.; Wang, H.; Zheng, Y.; Xue, X. Arbitrary-Oriented Scene Text Detection via Rotation Proposals. IEEE Trans. Multimed. 2018, 20, 3111–3122. [Google Scholar] [CrossRef]
- Shih, K.-H.; Chiu, C.-T.; Lin, J.-A.; Bu, Y.-Y. Real-Time Object Detection With Reduced Region Proposal Network via Multi-Feature Concatenation. IEEE Trans. Neural Netw. Learn. Syst. 2020, 31, 2164–2173. [Google Scholar] [CrossRef] [PubMed]
- Xin, Y.; Chen, D.; Zeng, C.; Zhang, W.; Wang, Y.; Cheung, R.C.C. High Throughput Hardware/Software Heterogeneous System for RRPN-Based Scene Text Detection. IEEE Trans. Comput. 2022, 71, 1507–1521. [Google Scholar] [CrossRef]
- Zhang, Z.; Guo, W.; Zhu, S.; Yu, W. Toward Arbitrary-Oriented Ship Detection With Rotated Region Proposal and Discrimination Networks. IEEE Geosci. Remote Sens. Lett. 2018, 15, 1745–1749. [Google Scholar] [CrossRef]
- Liu, Z.; Hu, J.; Weng, L.; Yang, Y. Rotated Region Based CNN for Ship Detection. In Proceedings of the 2017 IEEE International Conference on Image Processing (ICIP), Beijing, China, 17–20 September 2017. [Google Scholar]
- Koo, J.; Seo, J.; Jeon, S.; Choe, J.; Jeon, T. RBox-CNN. In Proceedings of the 26th ACM SIGSPATIAL International Conference on Advances in Geographic Information Systems, Seattle, WA, USA, 6–9 November 2018. [Google Scholar]
- Vaswani, A.; Shazeer, N.; Parmar, N.; Uszkoreit, J.; Jones, L.; Gomez, A.N.; Kaiser, L.; Polosukhin, I. Attention Is All You Need. Neural Inf. Process. Syst. 2017, 30, 5998–6008. [Google Scholar]
- Nie, X.; Duan, M.; Ding, H.; Hu, B.; Wong, E.K. Attention Mask R-CNN for Ship Detection and Segmentation From Remote Sensing Images. IEEE Access 2020, 8, 9325–9334. [Google Scholar] [CrossRef]
- Li, W.; Liu, K.; Zhang, L.; Cheng, F. Object Detection Based on an Adaptive Attention Mechanism. Sci. Rep. 2020, 10, 1–13. [Google Scholar] [CrossRef] [PubMed]
- Xia, G.-S.; Bai, X.; Ding, J.; Zhu, Z.; Belongie, S.; Luo, J.; Datcu, M.; Pelillo, M.; Zhang, L. DOTA: A Large-Scale Dataset for Object Detection in Aerial Images. In Proceedings of the 2018 IEEE/CVF Conference on Computer Vision and Pattern Recognition, Salt Lake City, UT, USA, 18–23 June 2018. [Google Scholar]
- Zaidi, S.S.A.; Ansari, M.S.; Aslam, A.; Kanwal, N.; Asghar, M.; Lee, B. A Survey of Modern Deep Learning Based Object Detection Models. Digit. Signal Process. 2022, 126, 103514. [Google Scholar] [CrossRef]


| IOU Calculation Method |
|---|
| - Input all rotated rectangular boxes R1~Rj; |
| - Select two rectangular boxes Ri, Rj; |
| - Put all the points (coordinates) that intersect both into the empty set H, which is then {e, f, g, h}; |
| - Then put the vertex coordinates of Ri in Rj into H, which is then {e, f, g, h, a}; |
| - The coordinates of the vertices of jR in iR are then put into H, which is then {e, f, g, h, a, D}; |
| - Sort the set H in counterclockwise order as {a, h, D, g, f, e}; |
| - Calculate the overlapping area Sc in H using triangulation; |
| - Finally yields IOU = Sc/SRi + SRj − SRc. |
| Real Situation | Classification Results | |
|---|---|---|
| Airport Runway | Non-Airport Runway | |
| Airport runway | TP | FN |
| Non-airport runway | FP | TN |
| Aspect Ratio Range | Quantities | Volume (%) |
|---|---|---|
| 1:1–1:10 | 25 | 2.32 |
| 1:10–1:20 | 48 | 4.45 |
| 1:20–1:30 | 237 | 21.99 |
| 1:30–1:40 | 354 | 32.84 |
| 1:40–1:50 | 263 | 24.40 |
| 1:50–1:60 | 104 | 9.65 |
| 1:60–1:70 | 34 | 3.15 |
| 1:70–1:80 | 8 | 0.74 |
| 1:80–1:90 | 3 | 0.28 |
| 1:90–1:100 | 2 | 0.19 |
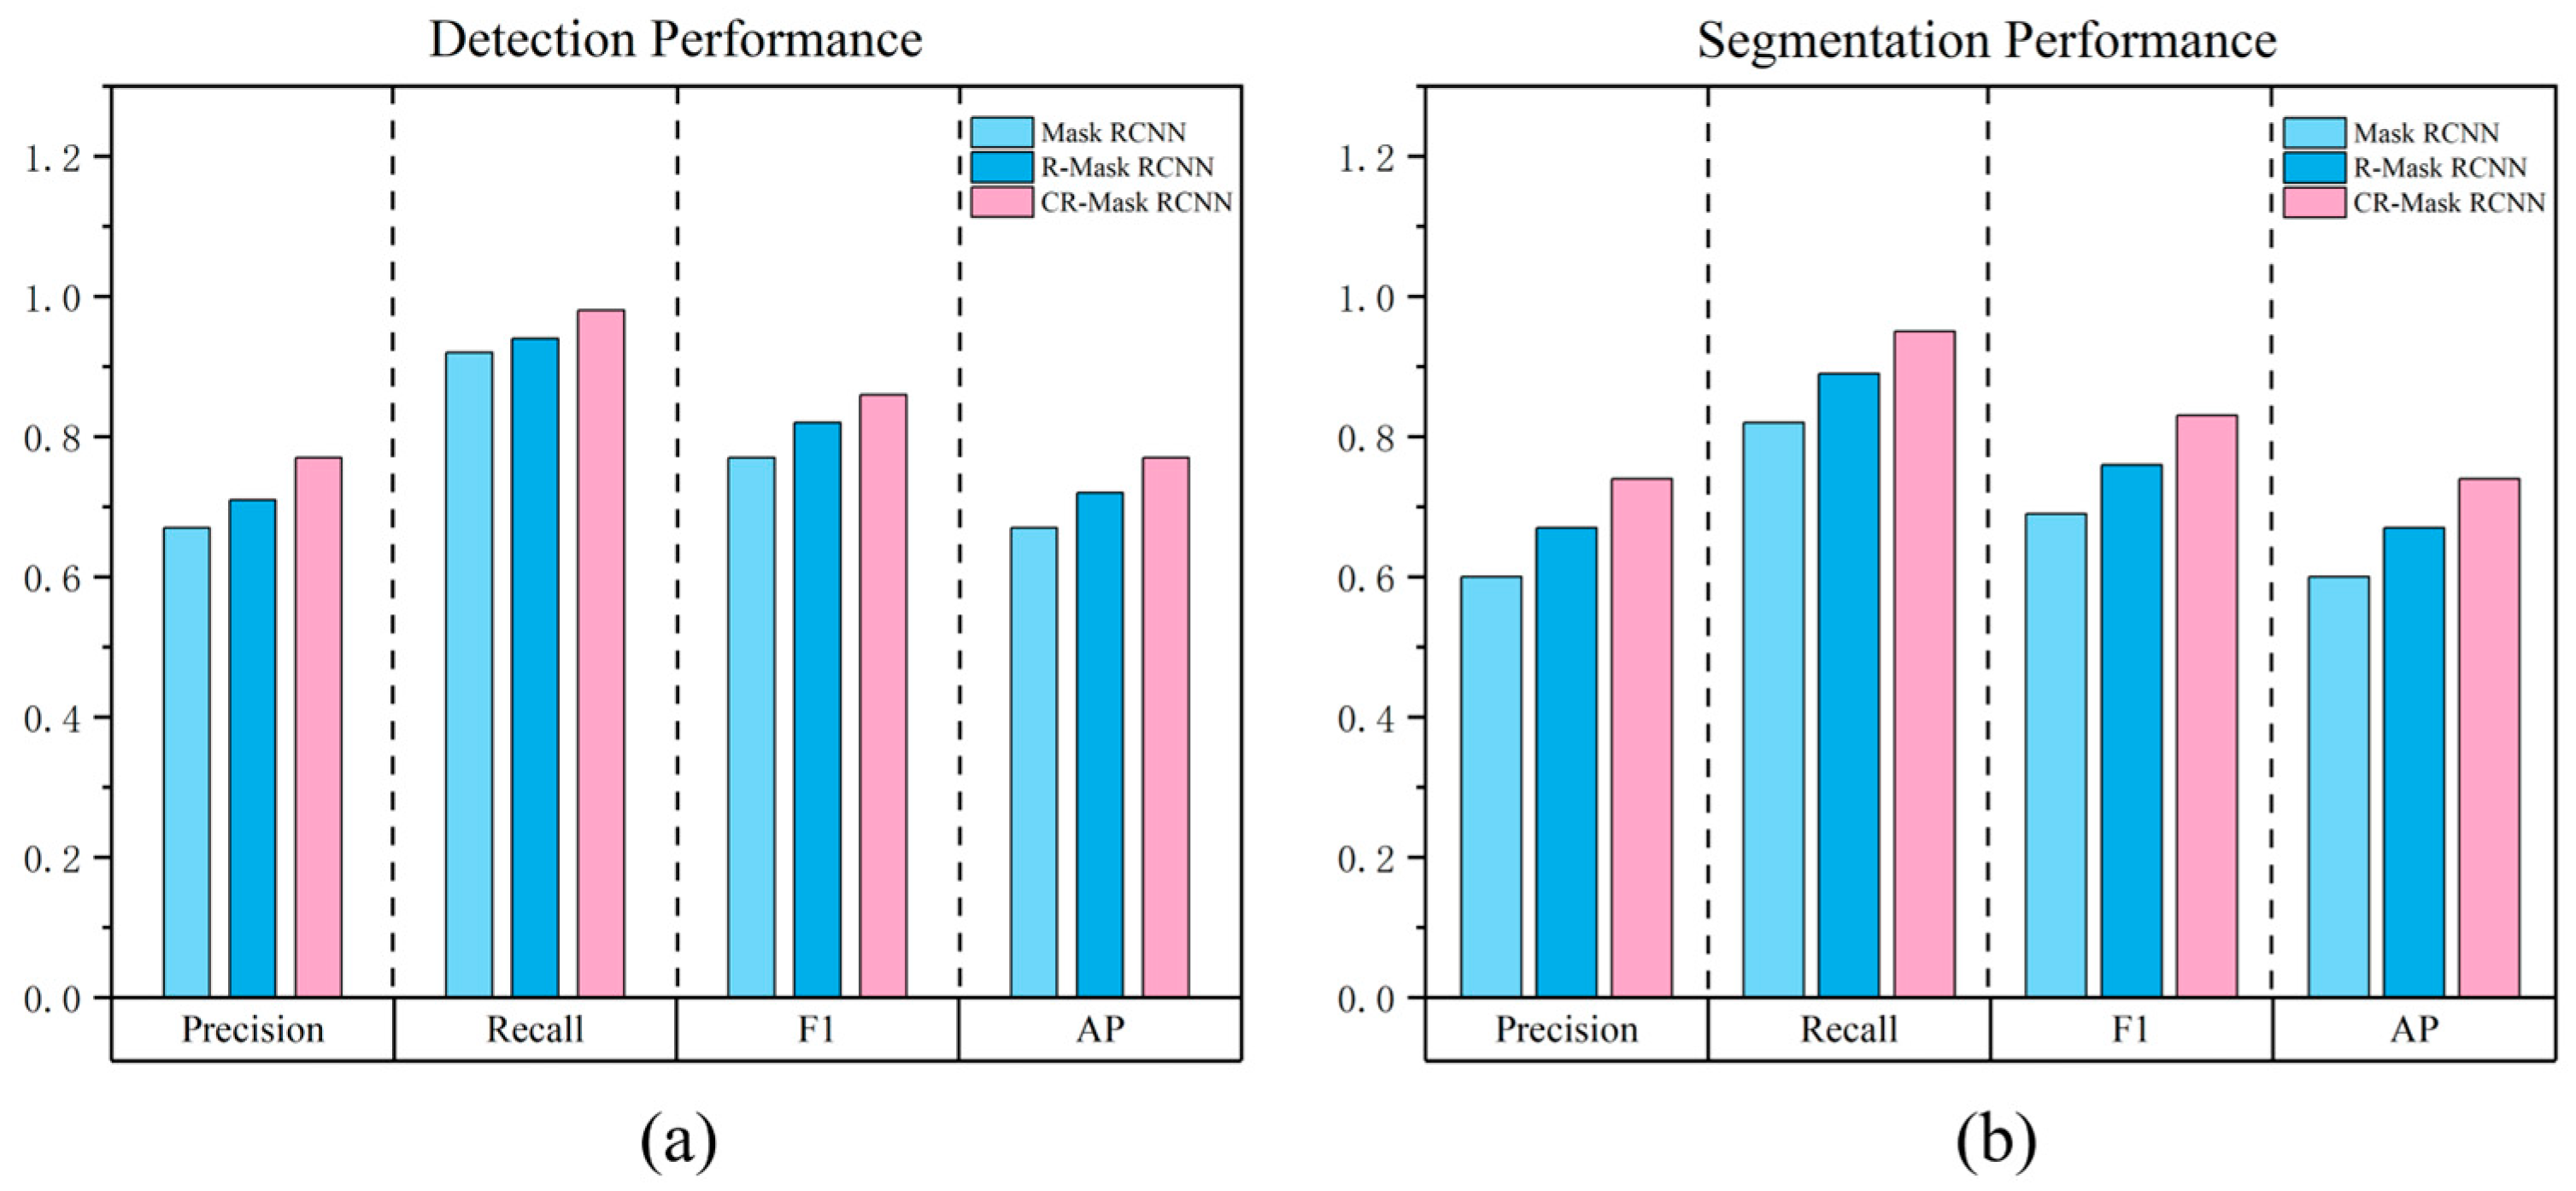
| Model | Precision | Recall | F1 | AP (%) |
|---|---|---|---|---|
| Mask RCNN | 0.67 | 0.92 | 0.77 | 67.39 |
| R-Mask RCNN | 0.71 | 0.94 | 0.82 | 72.28 |
| CR-Mask RCNN | 0.77 | 0.98 | 0.86 | 77.07 |
| Model | Precision | Recall | F1 | AP (%) |
|---|---|---|---|---|
| Mask RCNN | 0.60 | 0.82 | 0.69 | 59.60 |
| R-Mask RCNN | 0.67 | 0.89 | 0.76 | 66.51 |
| CR-Mask RCNN | 0.74 | 0.95 | 0.83 | 73.59 |
| Model | Training Time |
|---|---|
| Mask RCNN | 3 h |
| R-Mask RCNN | 4 h 30 min |
| CR-Mask RCNN | 5 h 10 min |
Disclaimer/Publisher’s Note: The statements, opinions and data contained in all publications are solely those of the individual author(s) and contributor(s) and not of MDPI and/or the editor(s). MDPI and/or the editor(s) disclaim responsibility for any injury to people or property resulting from any ideas, methods, instructions or products referred to in the content. |
© 2025 by the authors. Licensee MDPI, Basel, Switzerland. This article is an open access article distributed under the terms and conditions of the Creative Commons Attribution (CC BY) license (https://creativecommons.org/licenses/by/4.0/).
Share and Cite
Wan, M.; Zhong, G.; Wu, Q.; Zhao, X.; Lin, Y.; Lu, Y. CR-Mask RCNN: An Improved Mask RCNN Method for Airport Runway Detection and Segmentation in Remote Sensing Images. Sensors 2025, 25, 657. https://doi.org/10.3390/s25030657
Wan M, Zhong G, Wu Q, Zhao X, Lin Y, Lu Y. CR-Mask RCNN: An Improved Mask RCNN Method for Airport Runway Detection and Segmentation in Remote Sensing Images. Sensors. 2025; 25(3):657. https://doi.org/10.3390/s25030657
Chicago/Turabian StyleWan, Meng, Guannan Zhong, Qingshuang Wu, Xin Zhao, Yuqin Lin, and Yida Lu. 2025. "CR-Mask RCNN: An Improved Mask RCNN Method for Airport Runway Detection and Segmentation in Remote Sensing Images" Sensors 25, no. 3: 657. https://doi.org/10.3390/s25030657
APA StyleWan, M., Zhong, G., Wu, Q., Zhao, X., Lin, Y., & Lu, Y. (2025). CR-Mask RCNN: An Improved Mask RCNN Method for Airport Runway Detection and Segmentation in Remote Sensing Images. Sensors, 25(3), 657. https://doi.org/10.3390/s25030657