1. Introduction
As a crucial component within modern industry, bearings are regarded as the “joints” of mechanical devices. The primary function of bearings is to support rotating shafts or other moving bodies, and to reduce the coefficient of friction and secure the rotating shaft during mechanical transmission processes [
1]. With the continuous advancement of computer software and hardware technologies, the introduction of machine vision inspection systems into production sites has become feasible. Through the utilization of digital image techniques, effective defect detection and classification of bearing rings can be achieved, thereby enhancing production efficiency, reducing inspection time, and ensuring the quality compliance of bearings. This contributes to enterprise transformation and upgrading, thereby enhancing economic benefits.
In recent years, the application of machine vision and deep learning technologies in industrial defect detection has continued to expand, achieving remarkable results in multiple important fields such as glass [
2,
3], ceramics [
4,
5,
6], textiles [
7,
8], healthcare [
9,
10,
11], and steel [
12,
13]. These methods, leveraging their efficiency and automation capabilities, are gradually replacing traditional manual inspection, thereby enhancing detection accuracy and economic benefits. However, the application of vision-based intelligent detection techniques remains relatively limited in the domain of bearing surface defect inspection.
Currently, in the bearing manufacturing industry, small- and medium-sized enterprises still primarily rely on manual defect inspection. In contrast, large-scale bearing manufacturers have gradually adopted two mainstream approaches for surface defect detection: one based on traditional machine vision techniques, and the other employing deep learning-based recognition methods.
In the context of traditional machine vision-based detection, Zhou et al. [
14] proposed an automatic machine vision-based method for detecting defects on bearing ring surfaces. The process includes image acquisition, preprocessing, ROI extraction, and defect recognition, implemented through a multi-station visual inspection system. However, the method struggles to detect extremely small or excessively large defects. Wang et al. [
15] proposed a surface defect detection method for bearing outer rings based on machine vision. The detection process involves image acquisition using a CMOS industrial camera, gray histogram analysis, morphological background processing, Otsu segmentation, and morphological edge detection. Yet this method may be affected by the interference of complex backgrounds. Gu et al. [
16] proposed an automated defect detection approach incorporating gamma correction preprocessing and a modified Canny algorithm with adaptive thresholding for segmentation. Despite its innovative integration of traditional image processing techniques, the method achieves a relatively limited recognition accuracy of 93.3% and shows reduced efficacy on surfaces with complex textures. Liu et al. [
17] proposed an automatic detection system for micro-defects on bearing surfaces using self-developed hardware and software. Utilizing dual-light illumination, the system performs threshold segmentation, contour extraction, and positioning recognition to efficiently identify four types of defects (gaps, stains, shrunken lids, scratches). Nevertheless, the method requires strictly controlled lighting conditions.
In terms of deep learning-based detection schemes, Yao et al. [
18] developed a rider optimization-driven convolutional neural network (RO-MCNN) for vision-based bearing surface defect detection. The method utilizes Gaussian denoising, LBP feature extraction, and MCNN classification, but demands substantial computational resources for optimization. Liang et al. [
19] developed a lightweight network (LSK-YOLOv8n) with multi-level attention fusion for elastomeric bearing damage detection. The method integrates Large Selective Kernel attention and Focal-EIoU loss to handle structural interference and sample imbalance, though computational efficiency requires further optimization. Tayyab et al. [
20] presented a hybrid–ensemble method for bearing defect diagnosis, combining deep features from CNNs and handcrafted features (HOG/LBP) with classical ML models. The method utilizes decision-level fusion to reduce computational cost while maintaining high accuracy. Han et al. [
21] proposed BED-YOLO for bearing surface defect detection. They designed the IFC module to generate and normalize the spatial attention map, giving priority to retaining key features. In addition, by incorporating the EFFSC module to efficiently fuse features, the expressiveness and processing speed of the model were significantly improved. Li et al. [
22] proposed a bearing surface defect detection method based on the improved YOLOv8. They adopted FasterNet to optimize the backbone network and combined it with BiFPN to improve the efficiency of feature fusion at different scales. Meanwhile, the SAConv module was introduced to enhance the model’s feature extraction and processing capabilities, thus improving the detection accuracy of the model. Liu et al. [
23] proposed an improved RT-DETR model for bearing defect detection. They introduced the Dysample dynamic upsampling method to reduce the loss of feature information. Additionally, they incorporated the EMO module and the D-LKA attention module to enhance the model’s performance in feature extraction and feature fusion, achieving a balance between detection accuracy and detection efficiency. Zhou et al. [
24] proposed a shifted-window Transformer (sSwin) for bearing defect detection. They designed shunted large–small windows to replace the shifted-window mechanism. Meanwhile, the proposed local connection module enhanced the boundary interaction between adjacent tokens, bringing significant performance gains for bearing defect detection.
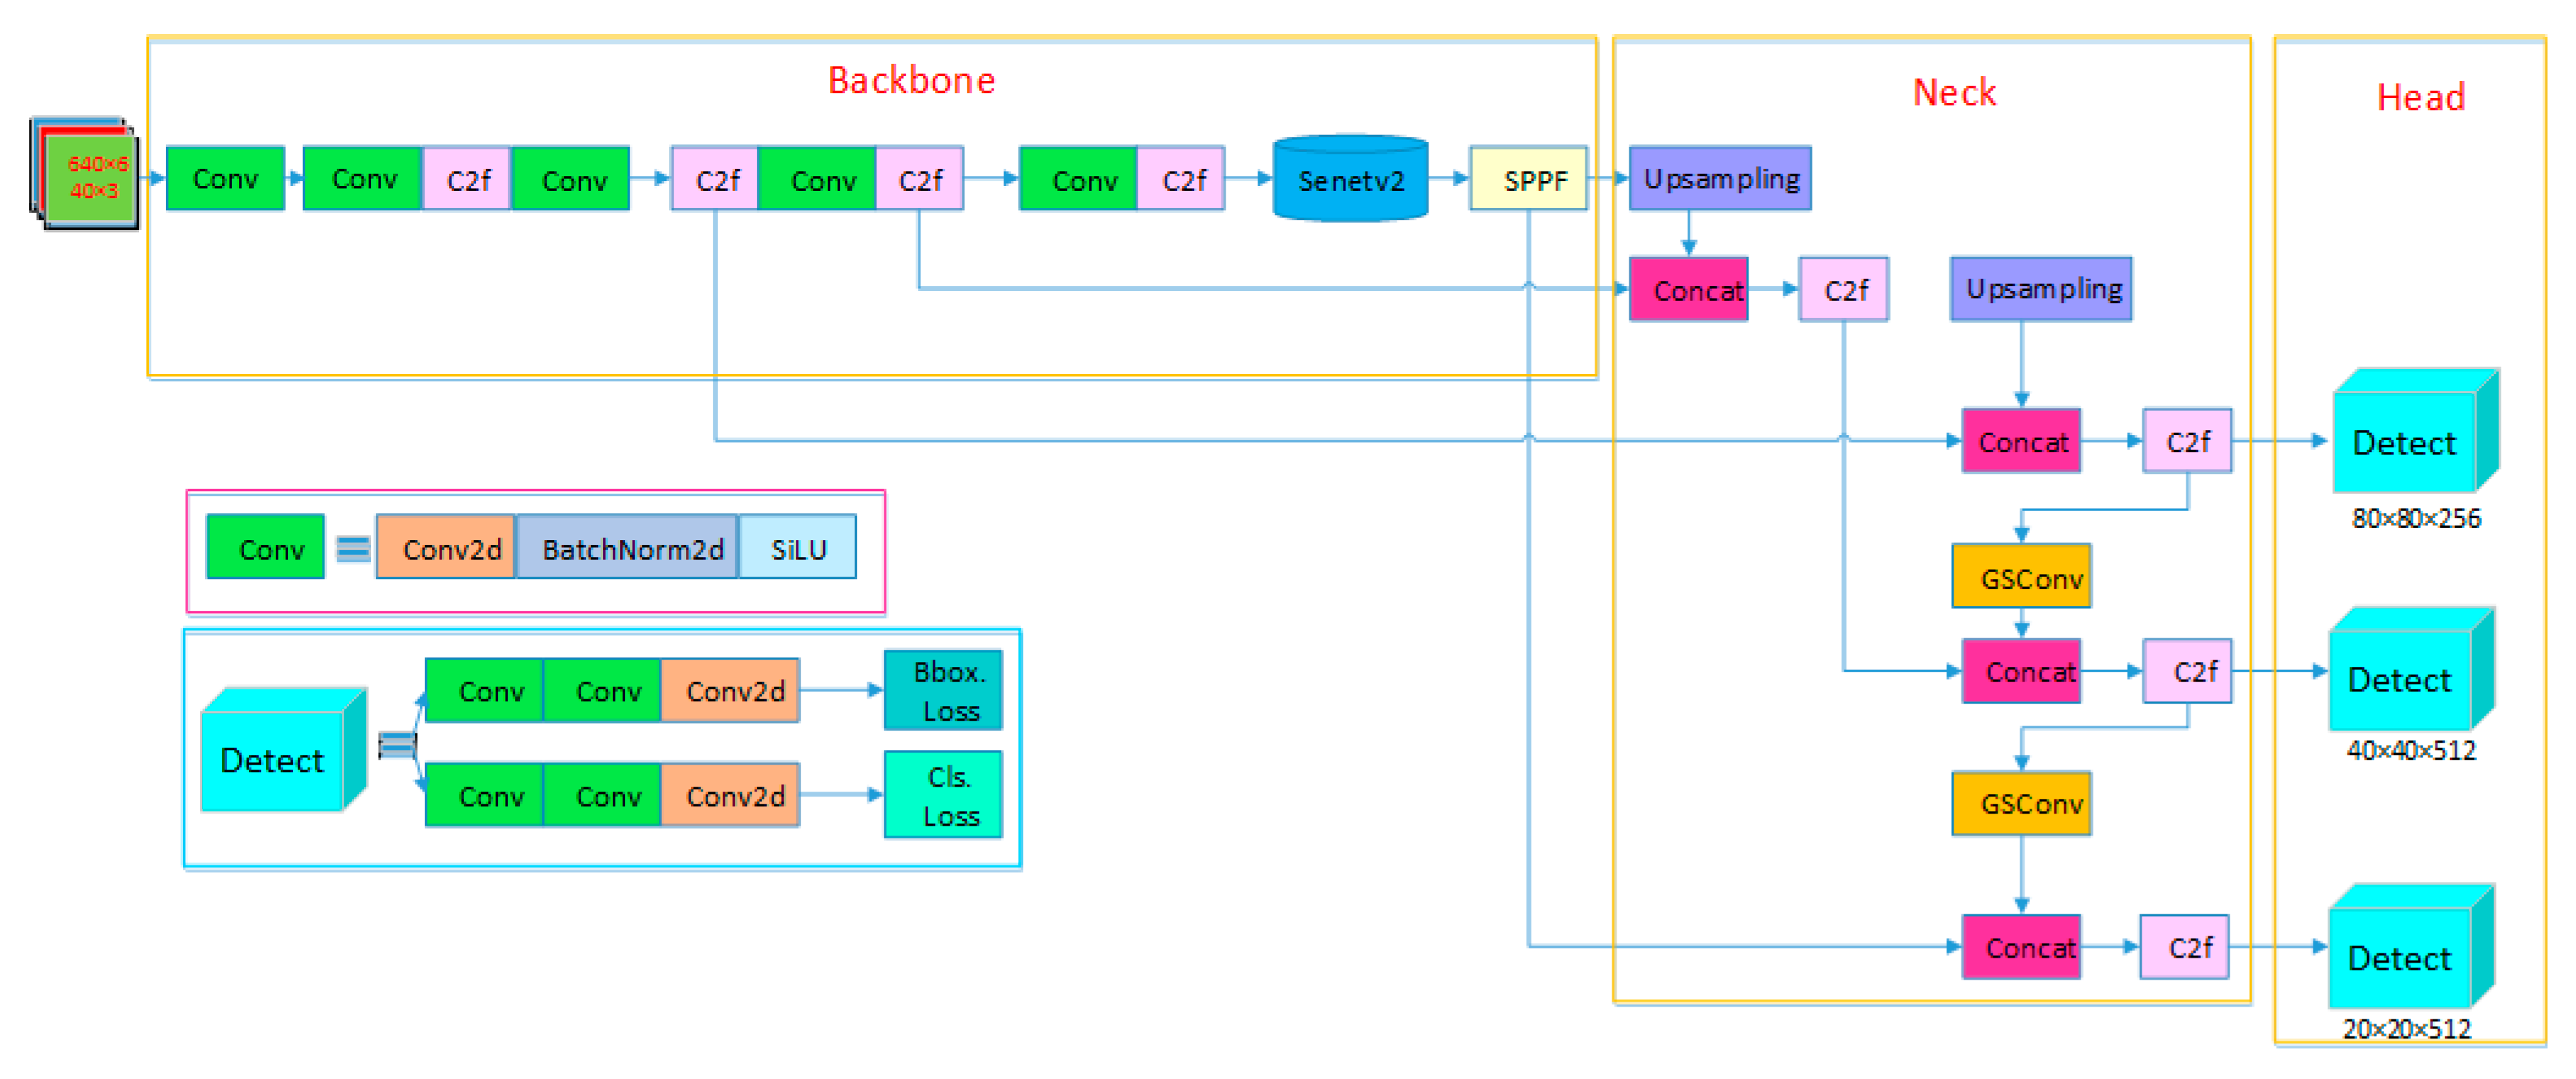
The application prospects of target detection technology based on deep learning theory in surface defect detection of bearing rings are promising. YOLOv8, as one of the most advanced single-stage object detection networks currently available, stands out in the field of object detection due to its exceptional detection accuracy and efficient inference speed. This model demonstrates significant advantages in handling small object detection and dense object detection tasks, while also exhibiting strong robustness, enabling it to effectively adapt to complex and variable detection environments. Compared to subsequent versions such as YOLOv11, YOLOv8 has undergone more extensive validation and in-depth optimization in practical application scenarios, with its performance stability and practicality being thoroughly verified. Additionally, YOLOv8 benefits from a large and active technical community, supported by comprehensive and detailed documentation and resources. This provides substantial convenience for developers during model development, debugging, and optimization, allowing them to quickly access the necessary technical support, thereby significantly enhancing development efficiency and project progression. However, despite YOLOv8′s excellent performance in numerous fields, its direct application to bearing surface defect detection tasks still faces certain challenges, such as insufficient sensitivity to minute defects and a relatively high false detection rate in complex backgrounds. Further research and optimization are required to adapt the model to the specific requirements of such scenarios. The background texture of bearing rings is complex, the defect sizes are varied, and there are numerous types of defects with uneven brightness. Additionally, the production environment of bearing rings often contains a large amount of oil and dust, which can interfere with bearing ring images. Considering these challenges and the optical characteristics of bearing rings, imaging features of defects, and detection requirements, an improved YOLOv8n-GSS defect detection network is proposed, and an automatic detection system for surface defects on bearing rings is developed, achieving and realizing industrial applications. The main contributions of this paper are as follows:
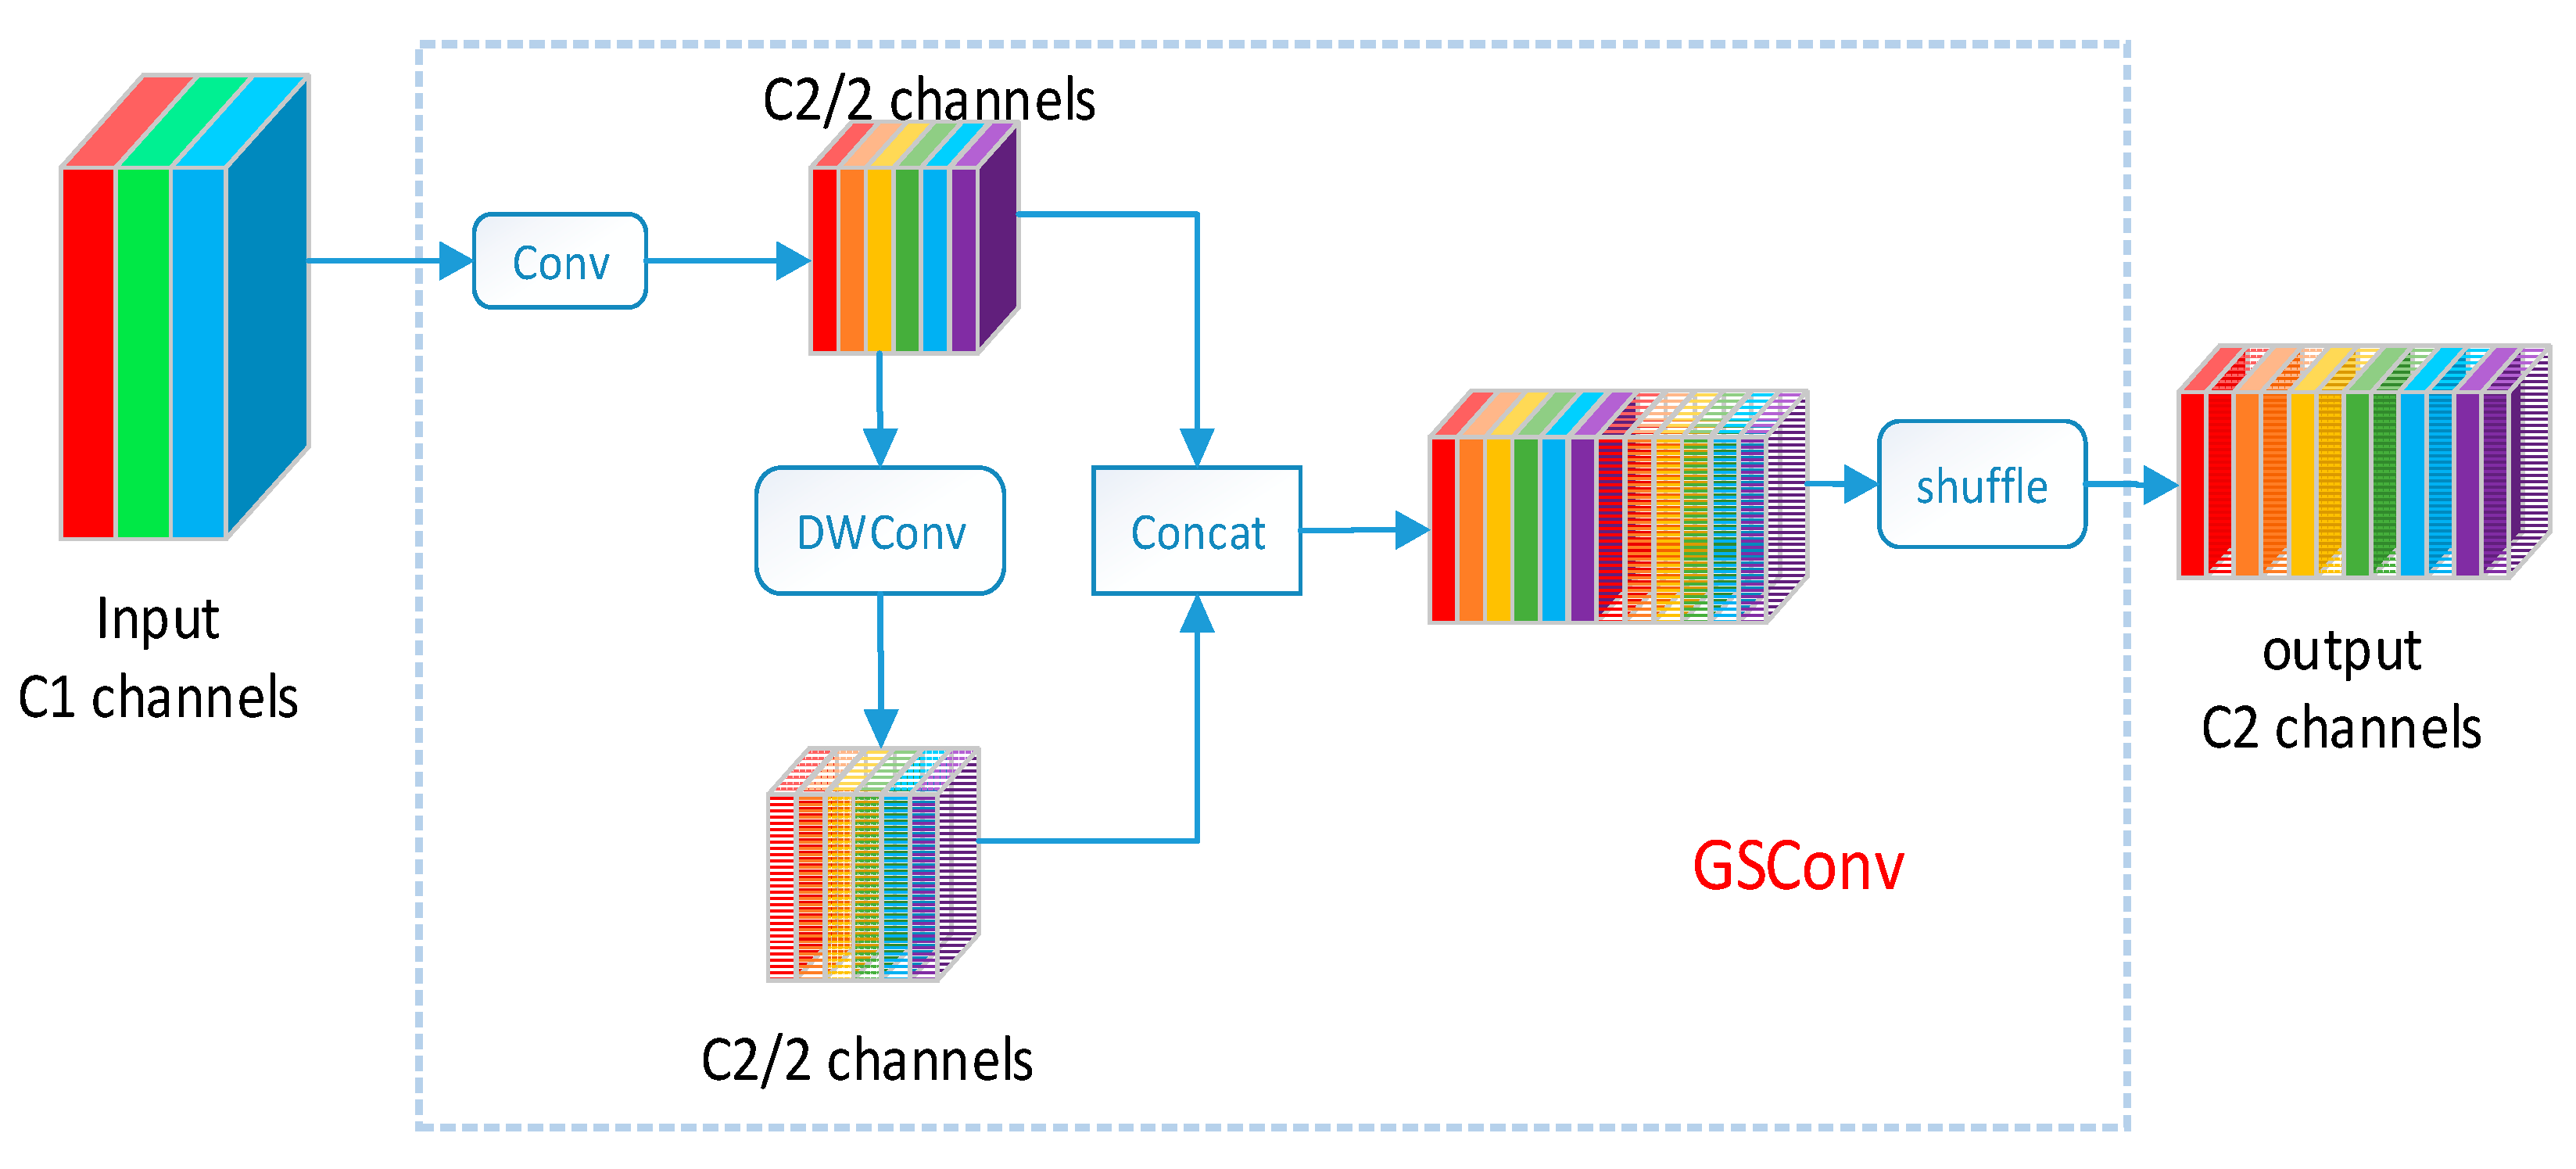
Replaced standard convolutions between the C2f module and Concat module in the neck module with lightweight convolutions, GsConv, to reduce computational costs.
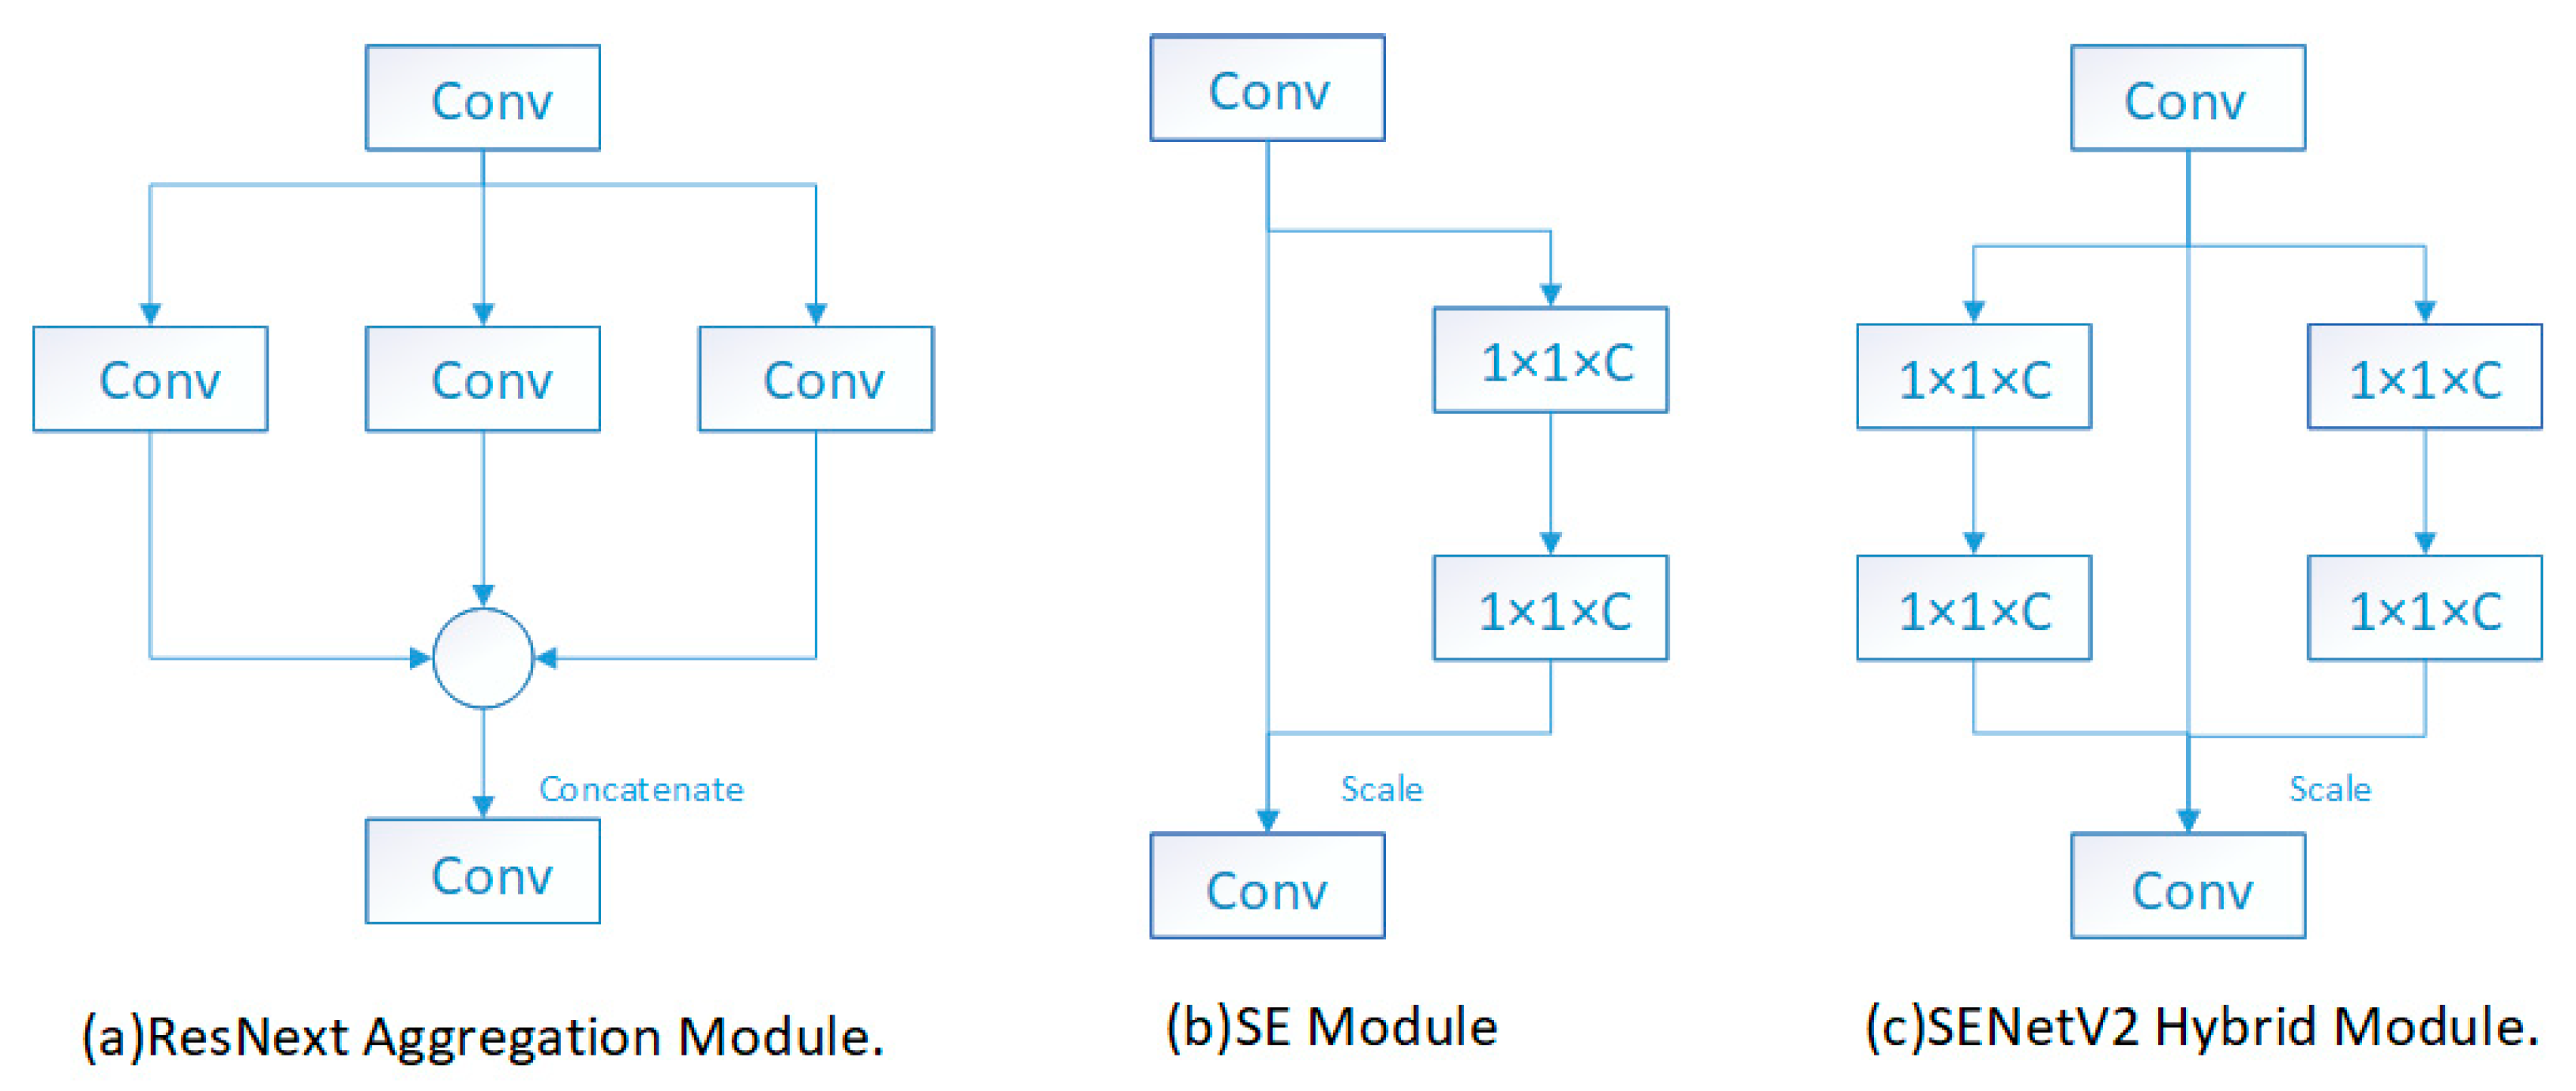
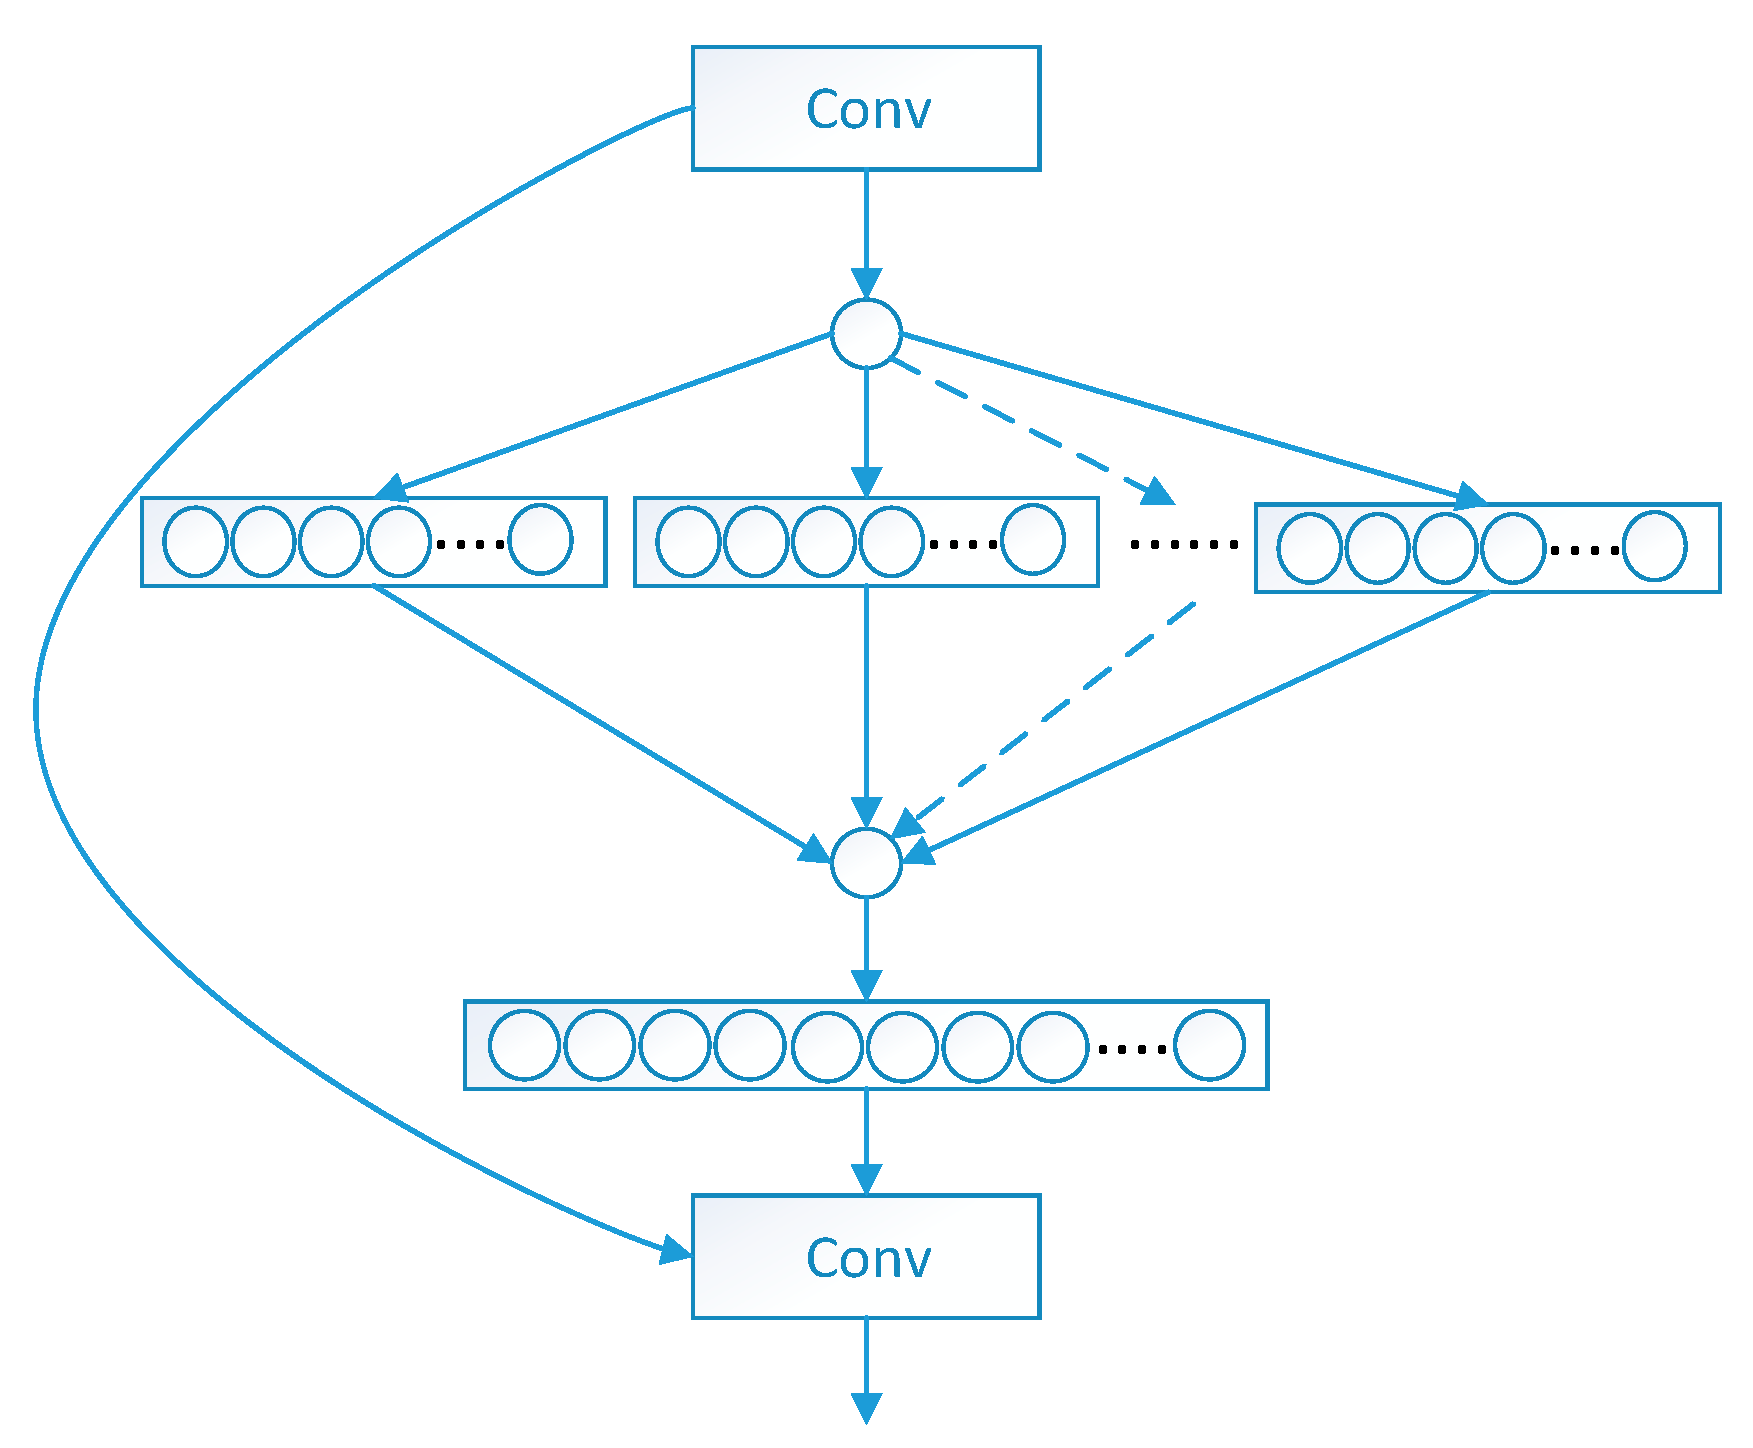
Added an SENetV2 attention mechanism before the SPPF module at the backbone end, which better captures and represents important features in the image, effectively improving the accuracy and robustness of the model for defect detection.
Developed a smart visual online inspection system for surface quality of bearing rings.
The rest of this paper is organized as follows:
Section 2 introduces the smart visual online inspection system for surface quality of bearing rings.
Section 3 details the detection method, including the network structure of improved YOLOv8.
Section 4 presents the experimental validation of our method.
Section 5 concludes our work.
2. Intelligent Visual Online Inspection System for Bearing Ring Surface Quality
2.1. Inspection System Introduction
The overall structure of the intelligent visual inspection system for surface defects of bearing rings designed and developed in this study is shown in
Figure 1. The system consists of three major modules: mechanical transmission, machine vision, and electrical control. The mechanical transmission module, based on a frame structure, utilizes motor drives and pneumatic cylinders to achieve precise grasping and positioning of the bearings, transporting them steadily to designated inspection stations. The machine vision module integrates high-resolution industrial cameras, dedicated optical lighting systems, industrial computers, and specialized visual detection algorithms. It performs high-quality image acquisition of bearing surfaces at various workstations, providing a reliable data foundation for subsequent defect identification and classification. The electrical control module, centered on a Programmable Logic Controller (PLC) and high-precision photoelectric sensors, is responsible for system operational logic control and real-time signal interaction, ensuring coordination within the inspection process and responsiveness.
In the design of the visual system, the MV-CS200-10GM line scan camera from the Chinese company Hikvision (Hikvision, Hangzhou, China) was selected as the primary imaging device. This camera features a resolution of 20 megapixels, capable of covering the entire bearing area, thus providing a high-resolution foundation for subsequent imaging. Furthermore, during the imaging process, a high-resolution MVL-KF1628M-12MP lens, also from Hikvision, and a dome-shaped shadowless light source were equipped to achieve clear imaging of the bearing ring surface. Such a combination ensures the quality and accuracy of imaging, providing reliable data support for subsequent defect detection. Finally, a detection prototype was constructed, with its exterior appearance depicted in
Figure 1a, while the internal structure can be observed in
Figure 1b, and the lighting arrangement utilizing the camera and light source combination is illustrated in
Figure 1c.
The industrial assembly line imposes a throughput requirement of 6–10 s per piece for the automatic defect detection system of bearing inner rings. To objectively evaluate the deployment suitability of different models, this study conducts experiments in a hardware environment identical to that used in industrial settings. Through key performance metrics such as frames per second (FPS), it systematically investigates whether each model can meet the real-time detection requirements under the specified production cycle.
2.2. Types of Bearing Ring Defects
The defects of bearing rings include Helix marks, forging waste, black spots, dents, and scratches [
25]. Different types of bearing defects are illustrated in
Figure 2.
- 1.
Helix marks.
The Helix mark defect, as depicted in
Figure 2a, arises from sharp burrs on grinding wheels, guide wheels, and cutting plates, resulting in spiral-shaped incisions resembling blade-like points on the outer diameter of the roller. This defect typically appears black and exceeds a size of 0.5 × 1.0 mm
2.
- 2.
Forging waste.
As shown in
Figure 2b, the forging waste defect manifests as residual unremoved black areas on the surface due to non-uniform grinding during the polishing process. This defect typically appears as dark-colored arc-shaped features.
- 3.
Black spots.
As shown in
Figure 2c, the black spot defect is characterized by the presence of irregular black spots of varying sizes on the bearing end face, with individual dimensions exceeding 0.3 × 0.3 mm
2.
- 4.
Dent.
As illustrated in
Figure 2d, the dent defect primarily results from inevitable collisions with hard objects during handling and transportation, leading to localized surface depressions.
- 5.
Scratches.
The scratch defect, as illustrated in
Figure 2e, primarily consists of surface linear scratches of a certain depth on workpieces generated during machining, handling, and measurement processes. This defect typically appears black and exceeds a size of 0.1 × 0.1 mm
2.
- 6.
Abrasion.
The abrasion defect is illustrated in
Figure 2f. It is caused by contact and relative motion between the bearing surface and harder foreign particles, which gouges the material surface, resulting in linear scratches of varying morphology and dimensions.
2.3. Detection Difficulties
Based on the imaging characteristics and detection requirements of bearing ring defects, the main challenges are as follows:
- 1.
Variety of defect types.
The defects of bearing rings are distributed on end faces, side faces, raceways, and flanges. The production process is complex, resulting in diverse defect morphologies and complex texture backgrounds.
- 2.
Susceptible to interference.
The production workshop environment for bearing rings is complex and variable, subject to interference from factors such as dust, oil stains, and temperature changes. Dust on the bearing ring surface can occur, and the imaging characteristics of dust are very similar to those of black spot defects, leading to potential misjudgments.
- 3.
Similar defects.
The forging waste defect is very similar to the black spot defect, making it difficult to differentiate between them.
- 4.
Varied sizes.
Defects such as spiral threads, forging waste, and scratches vary significantly in size. Therefore, the detection model needs to effectively detect targets of different scales.
- 5.
Different lighting requirements.
Different defects have different requirements for the brightness of the light source. For example, dent defects may not be identifiable under high brightness, while forging waste defects may be missed under low brightness.
4. Experimental Verification
4.1. Construction and Preprocessing of the Bearing Inner Ring Surface Defect Dataset
4.1.1. Data Acquisition System
The dataset of bearing ring surface defects (DO-BSD) used in this study was constructed using a self-developed, enclosed bearing ring surface defect detection system on an actual industrial production assembly line. The system features a fully enclosed physical structure with integrated controllable lighting units, effectively eliminating interference from ambient light on defect detection and ensuring absolute consistency in imaging conditions. The dataset covers multiple types of tapered roller bearing inner rings, including models such as 30315, 30307, and 32207, spanning over ten common specifications with inner diameters ranging from 30 mm to 80 mm. All collected bearing samples comply with the ISO 355:2019 international standard [
31], ensuring a unified normative basis for geometric structure and dimensions.
To guarantee the consistency and reproducibility of the image data and provide reliable input for deep learning model training, strict control measures were implemented during the data acquisition process, as detailed below:
Sensing and Triggering Mechanism: The system utilizes an EE-SX671 photoelectric sensor from OMRON Corporation, Japan, to detect bearing positioning. The selection of this specific sensor model was primarily based on the inherent strong anti-interference capability and high stability of photoelectric sensors in complex industrial environments. Compared to infrared sensors, this type exhibits superior suppression of common interference sources such as oil stains and metal reflections. The sensor’s high-repeatability positioning accuracy and response time of <1 ms enable it to reliably trigger image capture within the production line cycle. Prior to deployment, the sensor underwent on-site calibration. Using a precision displacement platform, we fine-tuned its installation angle and detection distance. The calibration outcome was verified by repeatedly passing a reference bearing through the station; iterations were performed until the trigger was activated exclusively when the bearing centroid was within ±0.5 mm of the predefined location. This ensures that a trigger signal is sent to the PLC and industrial camera only when the bearing reaches the preset imaging position. This mechanism physically eliminates image background interference caused by random workpiece misalignment, thereby providing stable and consistent input conditions for subsequent deep learning models.
Imaging System: Two high-resolution industrial cameras, the MV-CH050-10UM from Hikvision (China) and the MV-CS200-10GM, also from Hikvision, were employed along with a dome diffuse light source, the LTS-3DM175-B from Dongguan Leshi Automation Technology Co., Ltd. (Dongguan, China). This configuration generates uniform diffuse reflection illumination, effectively eliminating reflections from the curved metal surfaces of the bearings and interference from ambient light variations. It ensures that all images are captured under consistent lighting conditions, guaranteeing brightness uniformity and a high signal-to-noise ratio for the dataset from the source.
4.1.2. Dataset Preprocessing and Composition
The original images acquired by the aforementioned data acquisition system have a resolution of 5472 × 3468 pixels, with each image occupying approximately 19 MB of storage space. Due to the complexity of the bearing ring manufacturing process, the sample distribution across different defect types exhibits significant class imbalance. To ensure the rationality of the training data, improve model training efficiency, and enhance data consistency, this study implemented a comprehensive data preprocessing pipeline, which consists of the following steps:
Image Resizing and Cropping: The original images were uniformly cropped into 640 × 640-pixel patches to better suit the input requirements of the YOLO network.
Manual Screening: Experienced operators visually inspected and selected patches containing defect regions for subsequent model training.
Noise Reduction: A Gaussian filter with a kernel size of 3 × 3 and a standard deviation (σ) of 1.5 was applied to suppress high-frequency noise and imaging artifacts.
Pixel Normalization: Pixel intensity values were linearly normalized from the original range of [0, 255] to [0, 1] to stabilize and accelerate the training process.
Mosaic Data Augmentation: To address the inherent class imbalance in the dataset, the Mosaic augmentation technique was employed. This method synthesizes new training images by combining four randomly selected image patches, thereby helping to balance the sample distribution across different defect categories.
Additional Augmentations: Further geometric and photometric transformations—including random rotation, random cropping, random scaling, and random brightness adjustment—were utilized. These augmentations simulate variations in defect locations and lighting intensities, thereby enhancing model robustness.
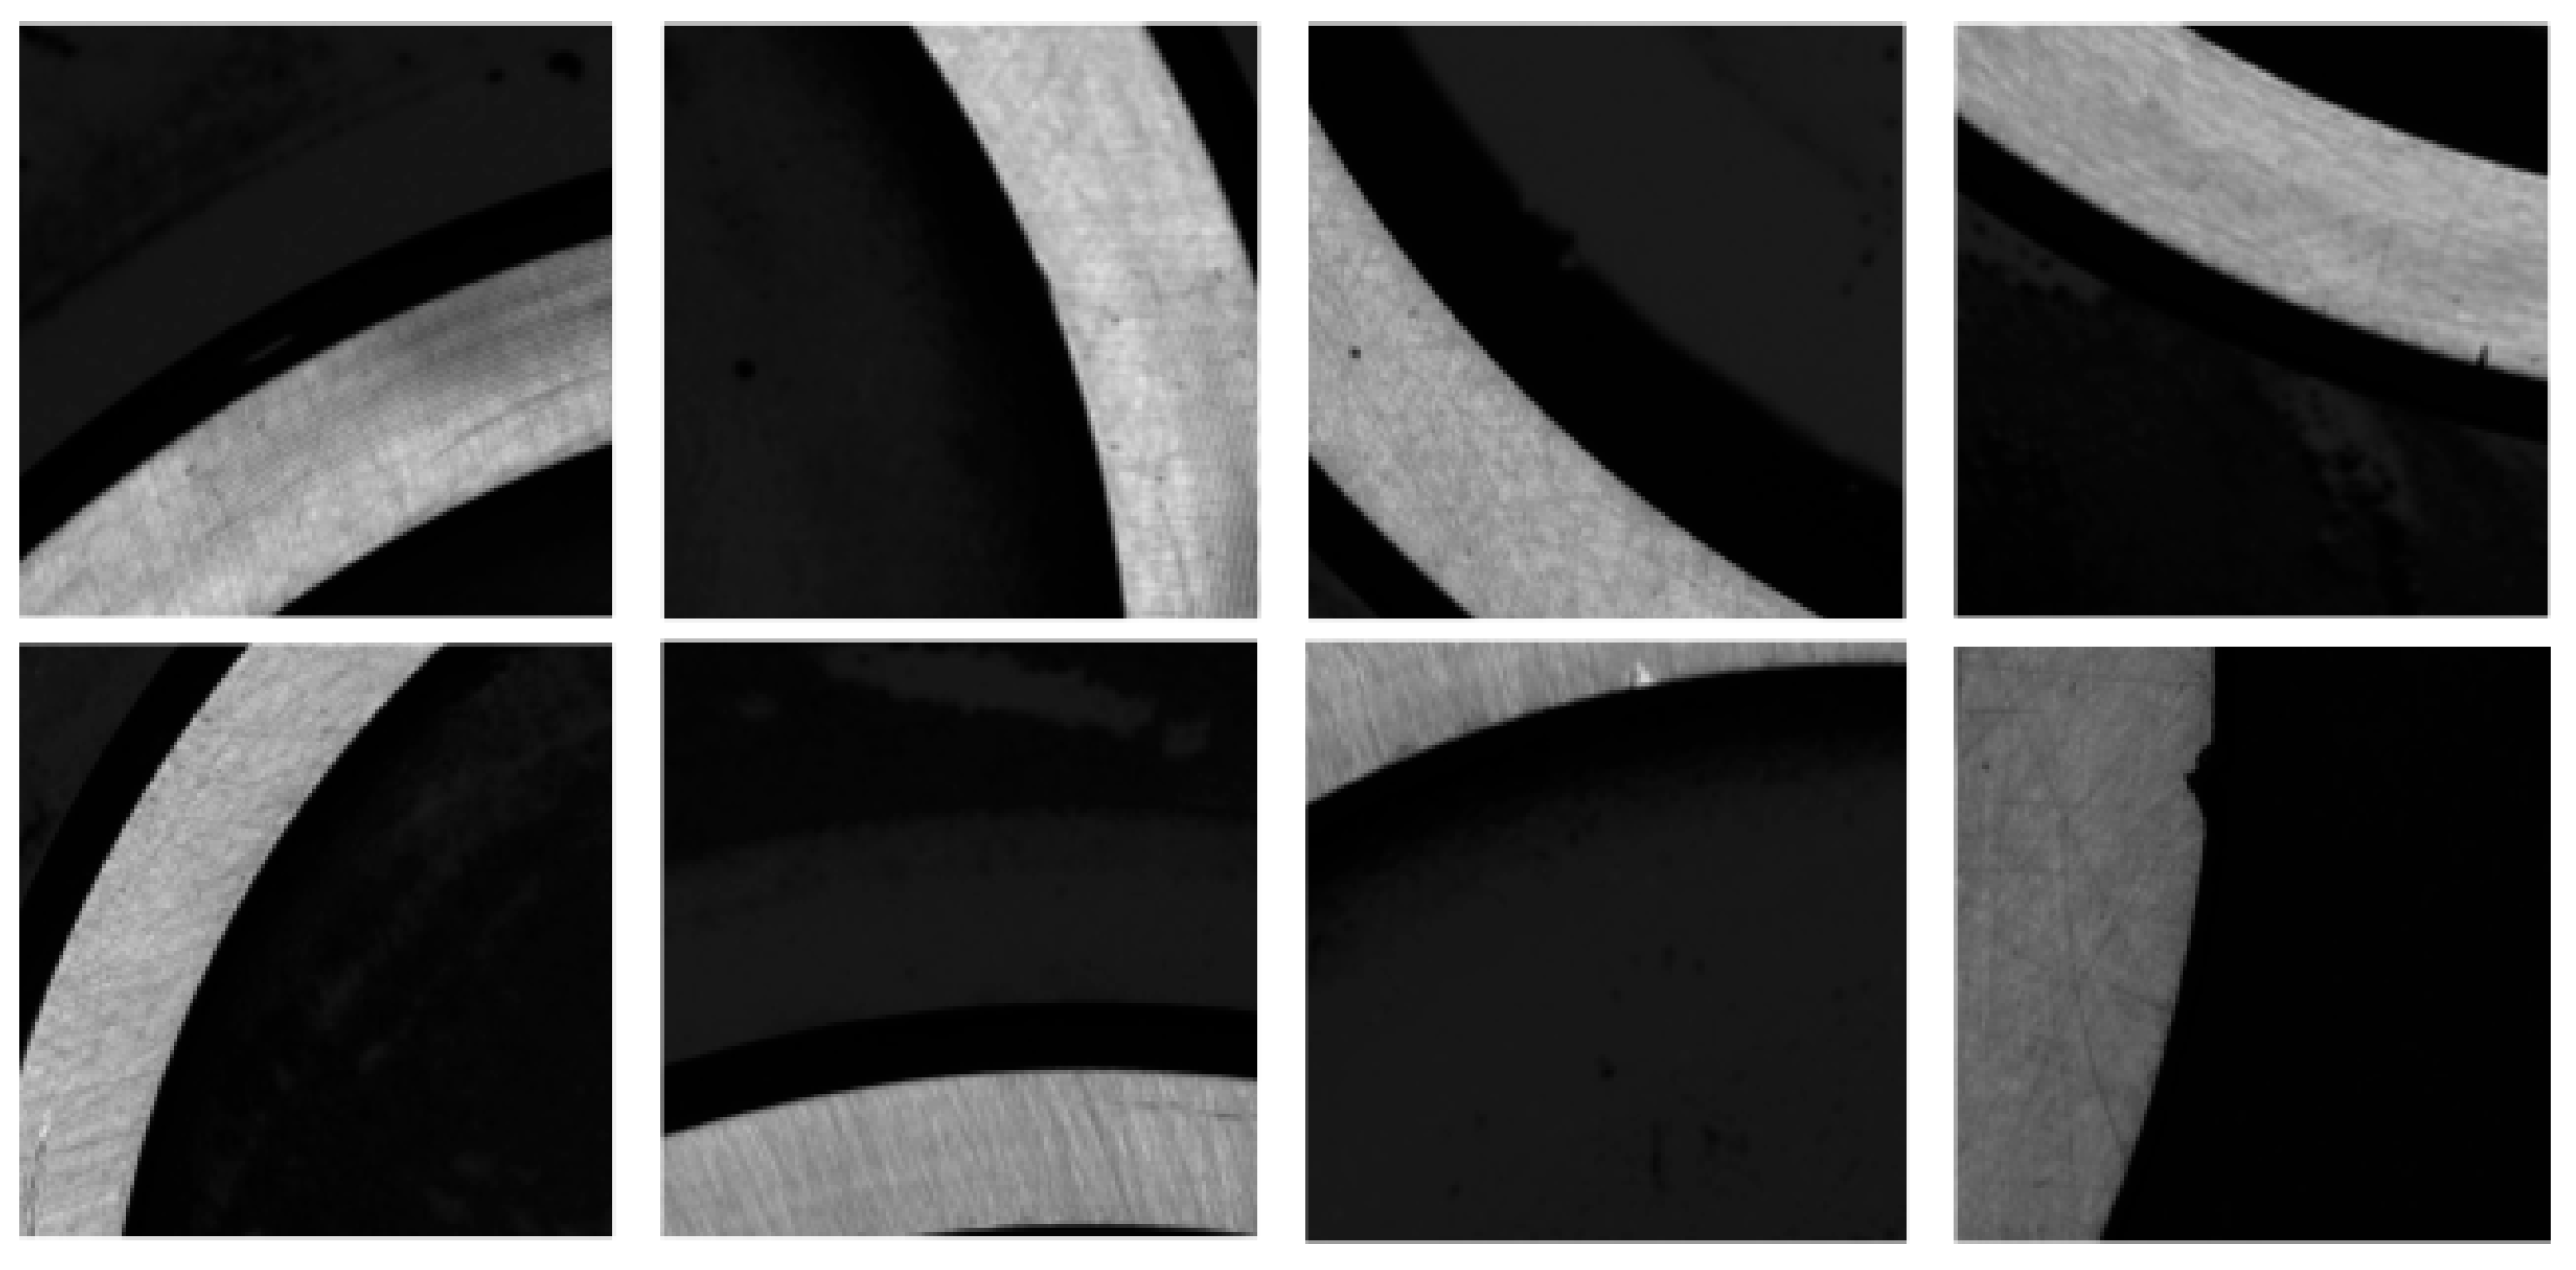
Upon completion of this preprocessing pipeline, the total number of defect samples was expanded from 3175 to 6805. This expansion enhances the model’s generalization capability and improves defect detection performance. The statistical distribution of various defect types after the expansion is summarized in
Table 1, and a visual representation of the constructed dataset is provided in
Figure 9.
The splitting of the dataset is an essential step prior to network training, as it directly impacts the rationality and validity of performance evaluation. To ensure an unbiased assessment, the preprocessed data was partitioned in a stratified manner based on defect categories, randomly divided into training, validation, and test sets in a ratio of 6:2:2. This random partitioning strategy ensures that all subsets share similar data distributions, thereby preventing evaluation bias and guaranteeing the fairness and representativeness of the training, validation, and testing processes. Detailed results of the dataset splitting can be found in
Table 2.
4.2. Experimental Setup
Table 3 provides detailed information about the hardware environment and software versions used for the experiments. This information is essential for the training and validation of the experiments.
The training parameters of the network also affect the performance of the model, as shown in
Table 4.
4.3. Performance Indices
To comprehensively evaluate the effectiveness of the proposed YOLOv8-GSS defect detection model and specifically analyze its sensitivity and detection capability for defects of different sizes, this study adopts the standard evaluation metric system from the COCO dataset. The selected metrics include the following: average precision (AP), mean average precision (mAP), precision at different Intersection-over-Union thresholds (AP50, AP75), and average precision for objects of varying scales (APS, APM, APL). Furthermore, to assess the model’s complexity and inference efficiency, we also report the number of parameters (Params), floating-point operations (FLOPs), and frames per second (FPS). This comprehensive evaluation framework can objectively reflect the model’s performance across multiple dimensions—including detection accuracy, robustness, multi-scale adaptability, and computational efficiency—thereby providing a reliable assessment of its suitability for real-world industrial defect detection scenarios.
4.4. Convergence Analysis
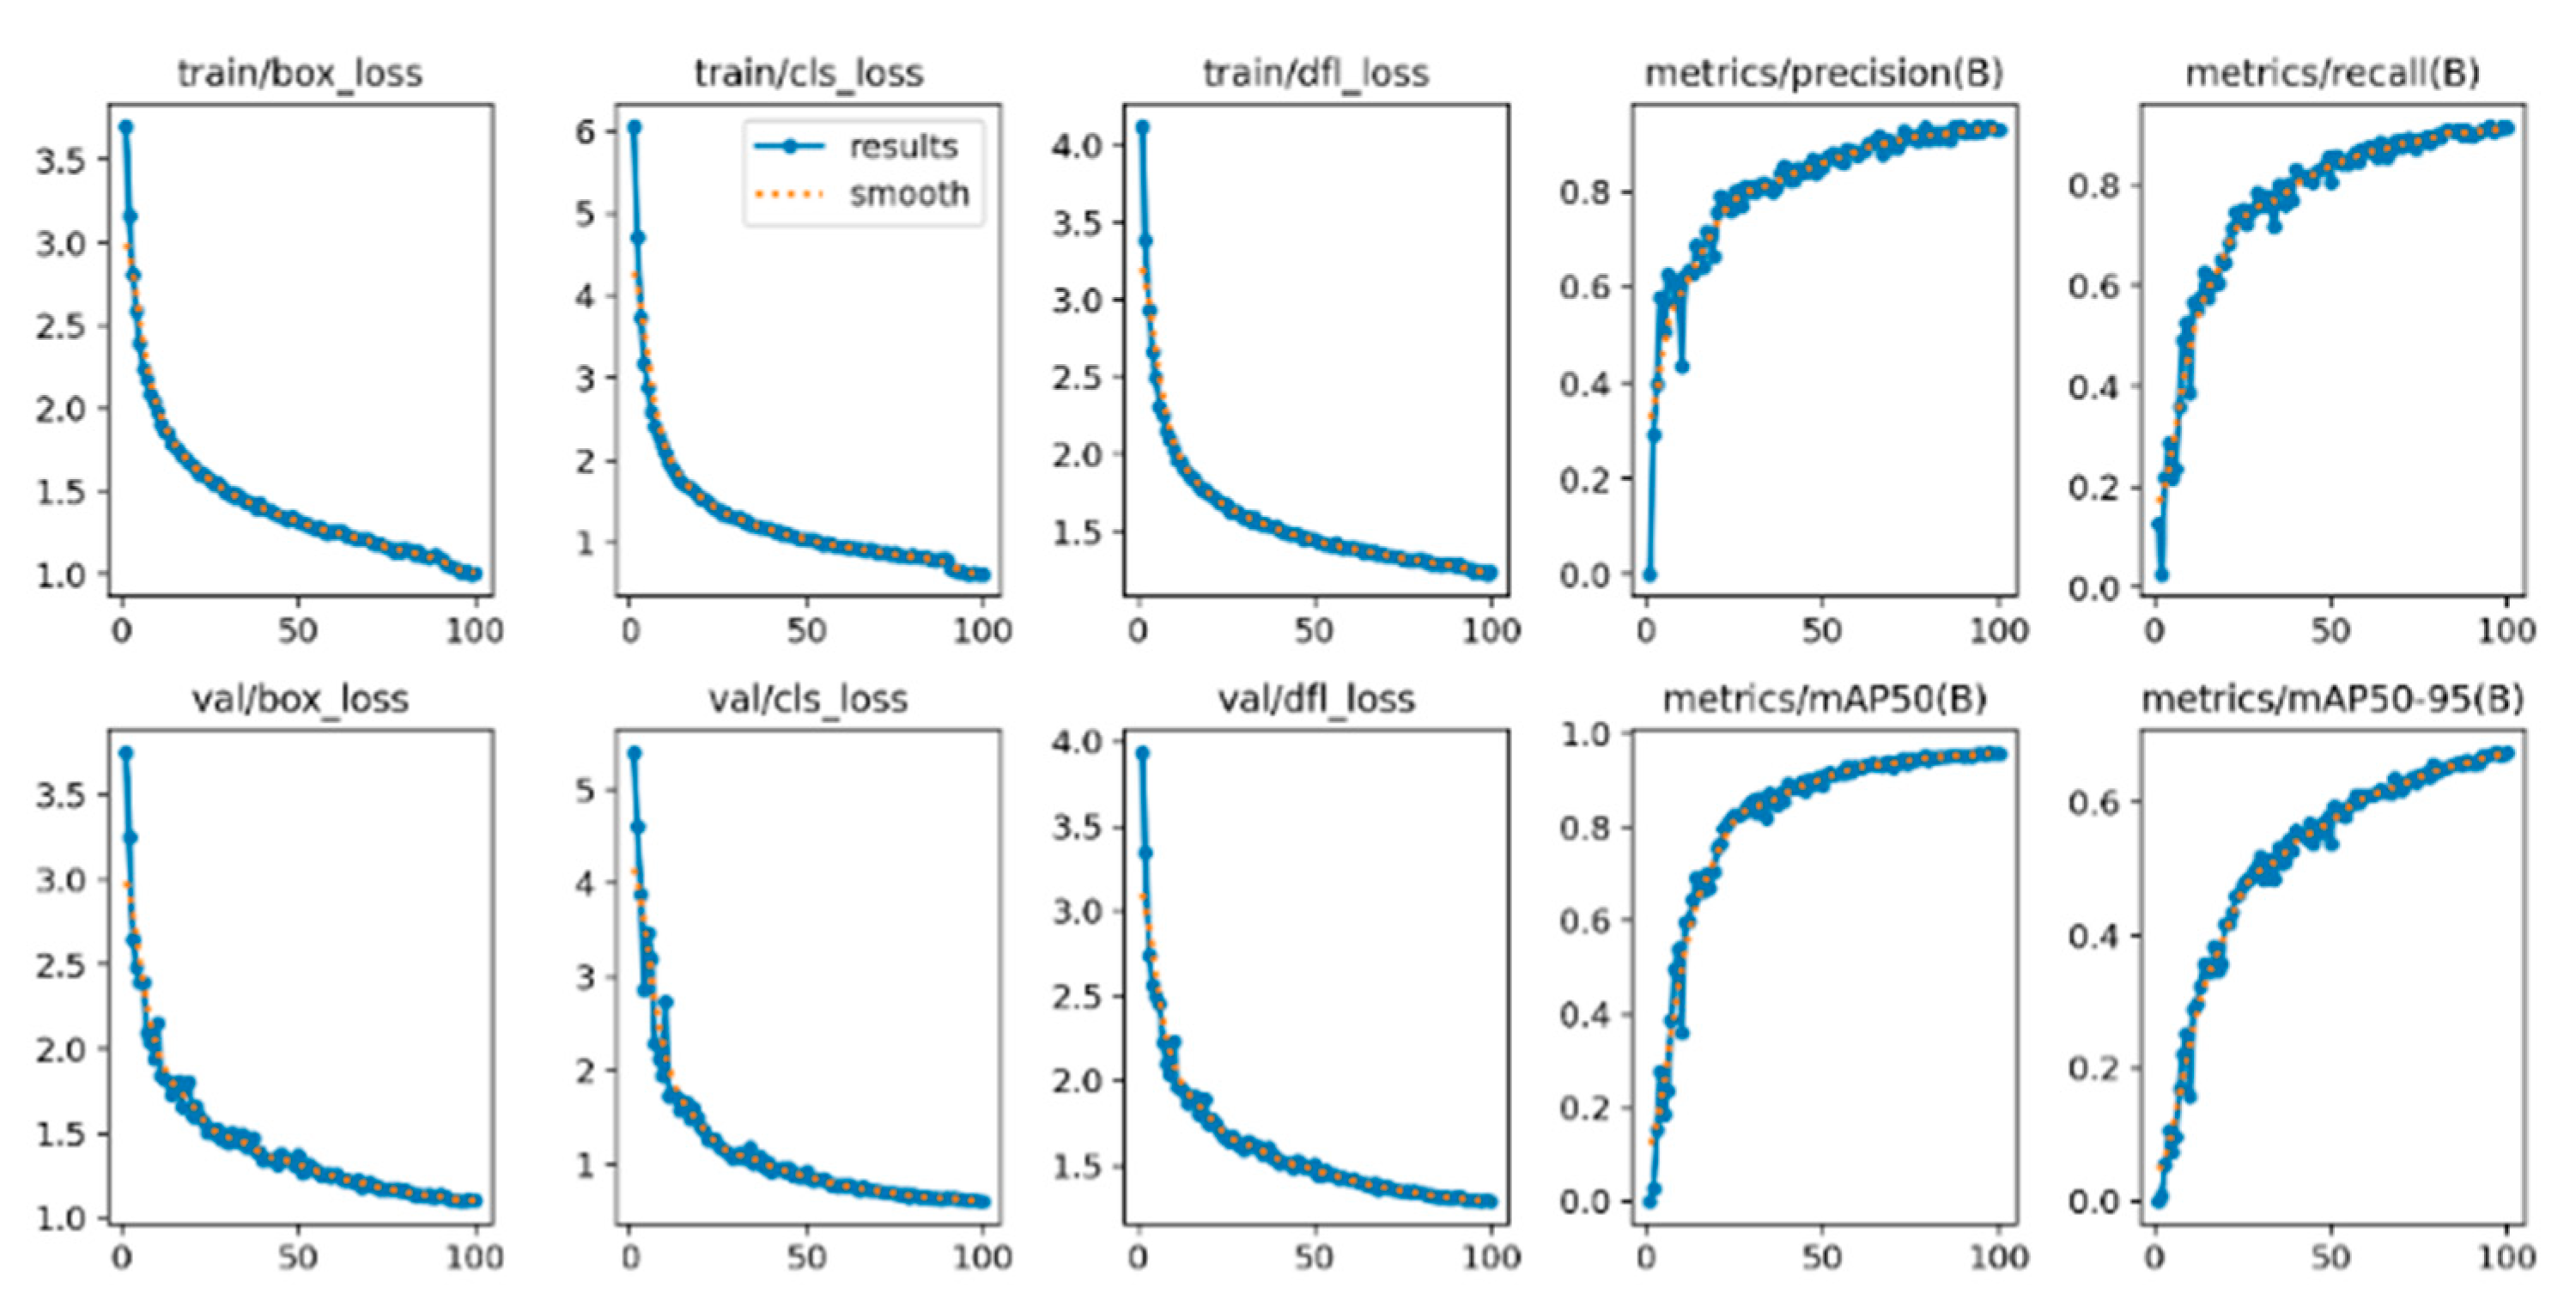
Figure 10 and
Figure 11 show the loss curves of these two models in terms of bounding box loss, confidence loss, and category loss. After comparative analysis, it is found that the YOLOv8n-GSS model converges slightly faster than the YOLOv8n model in terms of bounding box loss, confidence loss, and category loss, which indicates that the YOLOv8n-GSS model reaches the minimum value of the loss function faster during the training process.
In addition, the YOLOv8n-GSS model performs better in terms of both precision and recall, which implies that it has higher accuracy and better recall in the target detection task. These results indicate that the YOLOv8n-GSS model has better convergence performance and detection performance relative to the YOLOv8n model in the optimized case, and thus is more desirable in practical applications.
4.5. Hyperparametric Study
Hyperparameter configuration has a decisive impact on the generalization capability and final predictive accuracy of deep learning models. To systematically evaluate the rationality of the hyperparameter combinations adopted in this study, we employed an integrated strategy combining the control variable method and full factorial design. Comprehensive ablation experiments were conducted on key parameters including input image size, training epochs, batch size, learning rate, and optimizer.
Table 5 details the experimental results, demonstrating the influence of these parameters on the performance of the YOLOv8n-GSS model on the bearing inner ring surface defect dataset.
As illustrated in
Table 5, the control variable method was employed to evaluate the impact of different hyperparameter settings on network training outcomes. A comparison between Experiment 1 and Experiment 2 demonstrates that increasing the image size to 640 significantly improves model accuracy, which can be attributed to the retention of more detailed defect features at higher resolutions. In contrast, extending the training cycles in Experiment 3 resulted in a slight performance degradation compared to Experiment 1, indicating that the model had essentially converged after 100 epochs. Furthermore, as different optimizers exhibit varying sensitivities to learning rates, Experiments 1, 4–6, 10, and 11 were designed to compare the SGD and RAdam optimizers under commonly used learning rate configurations. The results clearly show that the SGD optimizer outperforms RAdam in this task. Additionally, Experiments 7–14 were systematically conducted to investigate the interaction between batch size and learning rate. Through this combined approach of control variables and full factorial design, it is possible to assess not only the individual effects of each hyperparameter but also the interplay between these two critical parameters, thereby providing comprehensive and reliable evidence for the selection of the configuration in Experiment 1.
From the experimental results, it can be observed that the hyperparameter set used in Experiment 1 yielded the highest detection accuracy, with the YOLOv8-GSS network achieving an mAP of 97.8%. This outcome validates the rationality of the parameter configuration proposed in this study.
4.6. Ablation Experiment
There are two model improvements, and in order to verify the validity of each improvement and the validity of the combination of the two improvements, ablation experiments were conducted on the improved model, with the experimental results detailed in
Table 6.
Based on the ablation study results presented in
Table 6, the contributions of each module to model performance can be systematically evaluated. The YOLOv8n baseline model achieves an mAP of 95.9% on the DO-BSD dataset. Upon integrating the GSConv lightweight convolution module, the mAP increases to 96.1%, while the number of parameters is reduced by 89,760 and FPS improves by 9 frames per second. This improvement primarily stems from the depthwise-separable convolutions and channel shuffling mechanism employed by GSConv, which significantly reduce model complexity while effectively preserving key defect features through enhanced feature reuse efficiency. Subsequently, the introduction of the SENetV2 attention mechanism further elevates the mAP to 97.2%, despite a corresponding 4% decrease in FPS. This performance gain originates from the attention mechanism’s adaptive recalibration of feature channels, enabling the model to concentrate on more discriminative features in defect regions. When both GSConv and SENetV2 are integrated, the model achieves the optimal balanced performance: mAP is significantly improved by 1.9 percentage points compared to the baseline, the parameter count is reduced by 73,376, and a net gain of 4 FPS is maintained. This demonstrates that the designed lightweight backbone network not only enhances feature extraction capability through feature reuse mechanisms but also improves feature utilization via attention guidance, ultimately achieving a synergistic optimization of detection accuracy and speed while reducing the number of parameters.
4.7. Comparison Experiment
In order to validate the effectiveness of the YOLOv8n-GSS defect detection model, this chapter conducts a comparative analysis with several mainstream detection models, including the single-stage detectors YOLOv5, YOLOv8, RT-DETR, and YOLOv11, as well as the two-stage detector Faster R-CNN. The comparative results, based on the standard COCO dataset evaluation metrics, are presented in
Table 7.
Based on the experimental data presented in
Table 7, the proposed YOLOv8n-GSS model demonstrates comprehensively superior performance compared to other models on the DO-BSD defect detection dataset. YOLOv8n-GSS achieves an AP50 of 97.8%, representing improvements of 14.2%, 0.5%, 1.0%, 2.6%, 0.6%, and 1.9% over Faster R-CNN, YOLOv5, RT-DETR, MobileNetv4, YOLOv11, and YOLOv8, respectively. Furthermore, systematic progress has been made in detection accuracy for large, medium, and small targets. This overall performance enhancement primarily stems from two key architectural improvements: Firstly, the replacement of standard convolutions and Concat operations with the lightweight GsConv module significantly enhances multi-scale feature fusion capability while maintaining model efficiency, leveraging its unique depthwise-separable convolutions and channel shuffling mechanism. Secondly, the integration of the SENetV2 attention mechanism prior to the SPPF module in the backbone network enables adaptive calibration of critical feature channels, effectively improving the model’s sensitivity to subtle defect features and its discriminative ability for multi-scale characteristics.
In terms of inference efficiency, the model achieves a detection speed of 115 FPS on the RTX A5000 hardware platform, with a theoretical throughput of 414,000 images per hour. When further considering the system overhead caused by image acquisition, data transmission, and system communication in practical industrial deployment (assuming a performance loss of approximately 50%), the effective throughput of the model can still be maintained at over 160,000 images per hour. This throughput capability fully meets the image acquisition and detection requirements of a production line configured with a six-camera station processing 10 bearings per minute. The experimental results indicate that the YOLOv8n-GSS model not only possesses high detection accuracy and fast inference speed but also retains a sufficient performance margin to handle fluctuations in industrial environments, demonstrating promising engineering applicability and deployment potential.
To provide an intuitive comparison of the detection performance across different models, this study randomly selected one sample from each of the six defect categories in the DO-BSD dataset for testing and visualized the results (as shown in
Figure 12). The visualization results are consistent with the quantitative analysis, indicating significant differences in the performance of the models on these samples. Specifically, the Faster R-CNN architecture exhibited clear limitations in helical mark defects and dent defects. Comprehensive comparative evaluation demonstrates that the proposed YOLOv8n-GSS model delivers outstanding performance across all defect categories, with key metrics such as detection accuracy and model robustness significantly surpassing those of other compared models.
4.8. Network Generalization Experiment
To evaluate the generalization capability of the proposed YOLOv8-GSS model, additional comparative experiments were conducted on the Light Guide Plate Surface Defect Dataset (LGP-SDD) [
32]. These experiments followed the same environmental configuration and methodology as those used for bearing inner ring defect detection. The LGP-SDD contains four types of defects—white spots, bright lines, dark lines, and surface defects—with all images resized to 416 × 416 pixels. After applying the same data augmentation strategy, the total number of effective samples was increased to 4112. The dataset was then divided into training, validation, and test sets in a ratio of 6:2:2 based on defect categories. As shown in
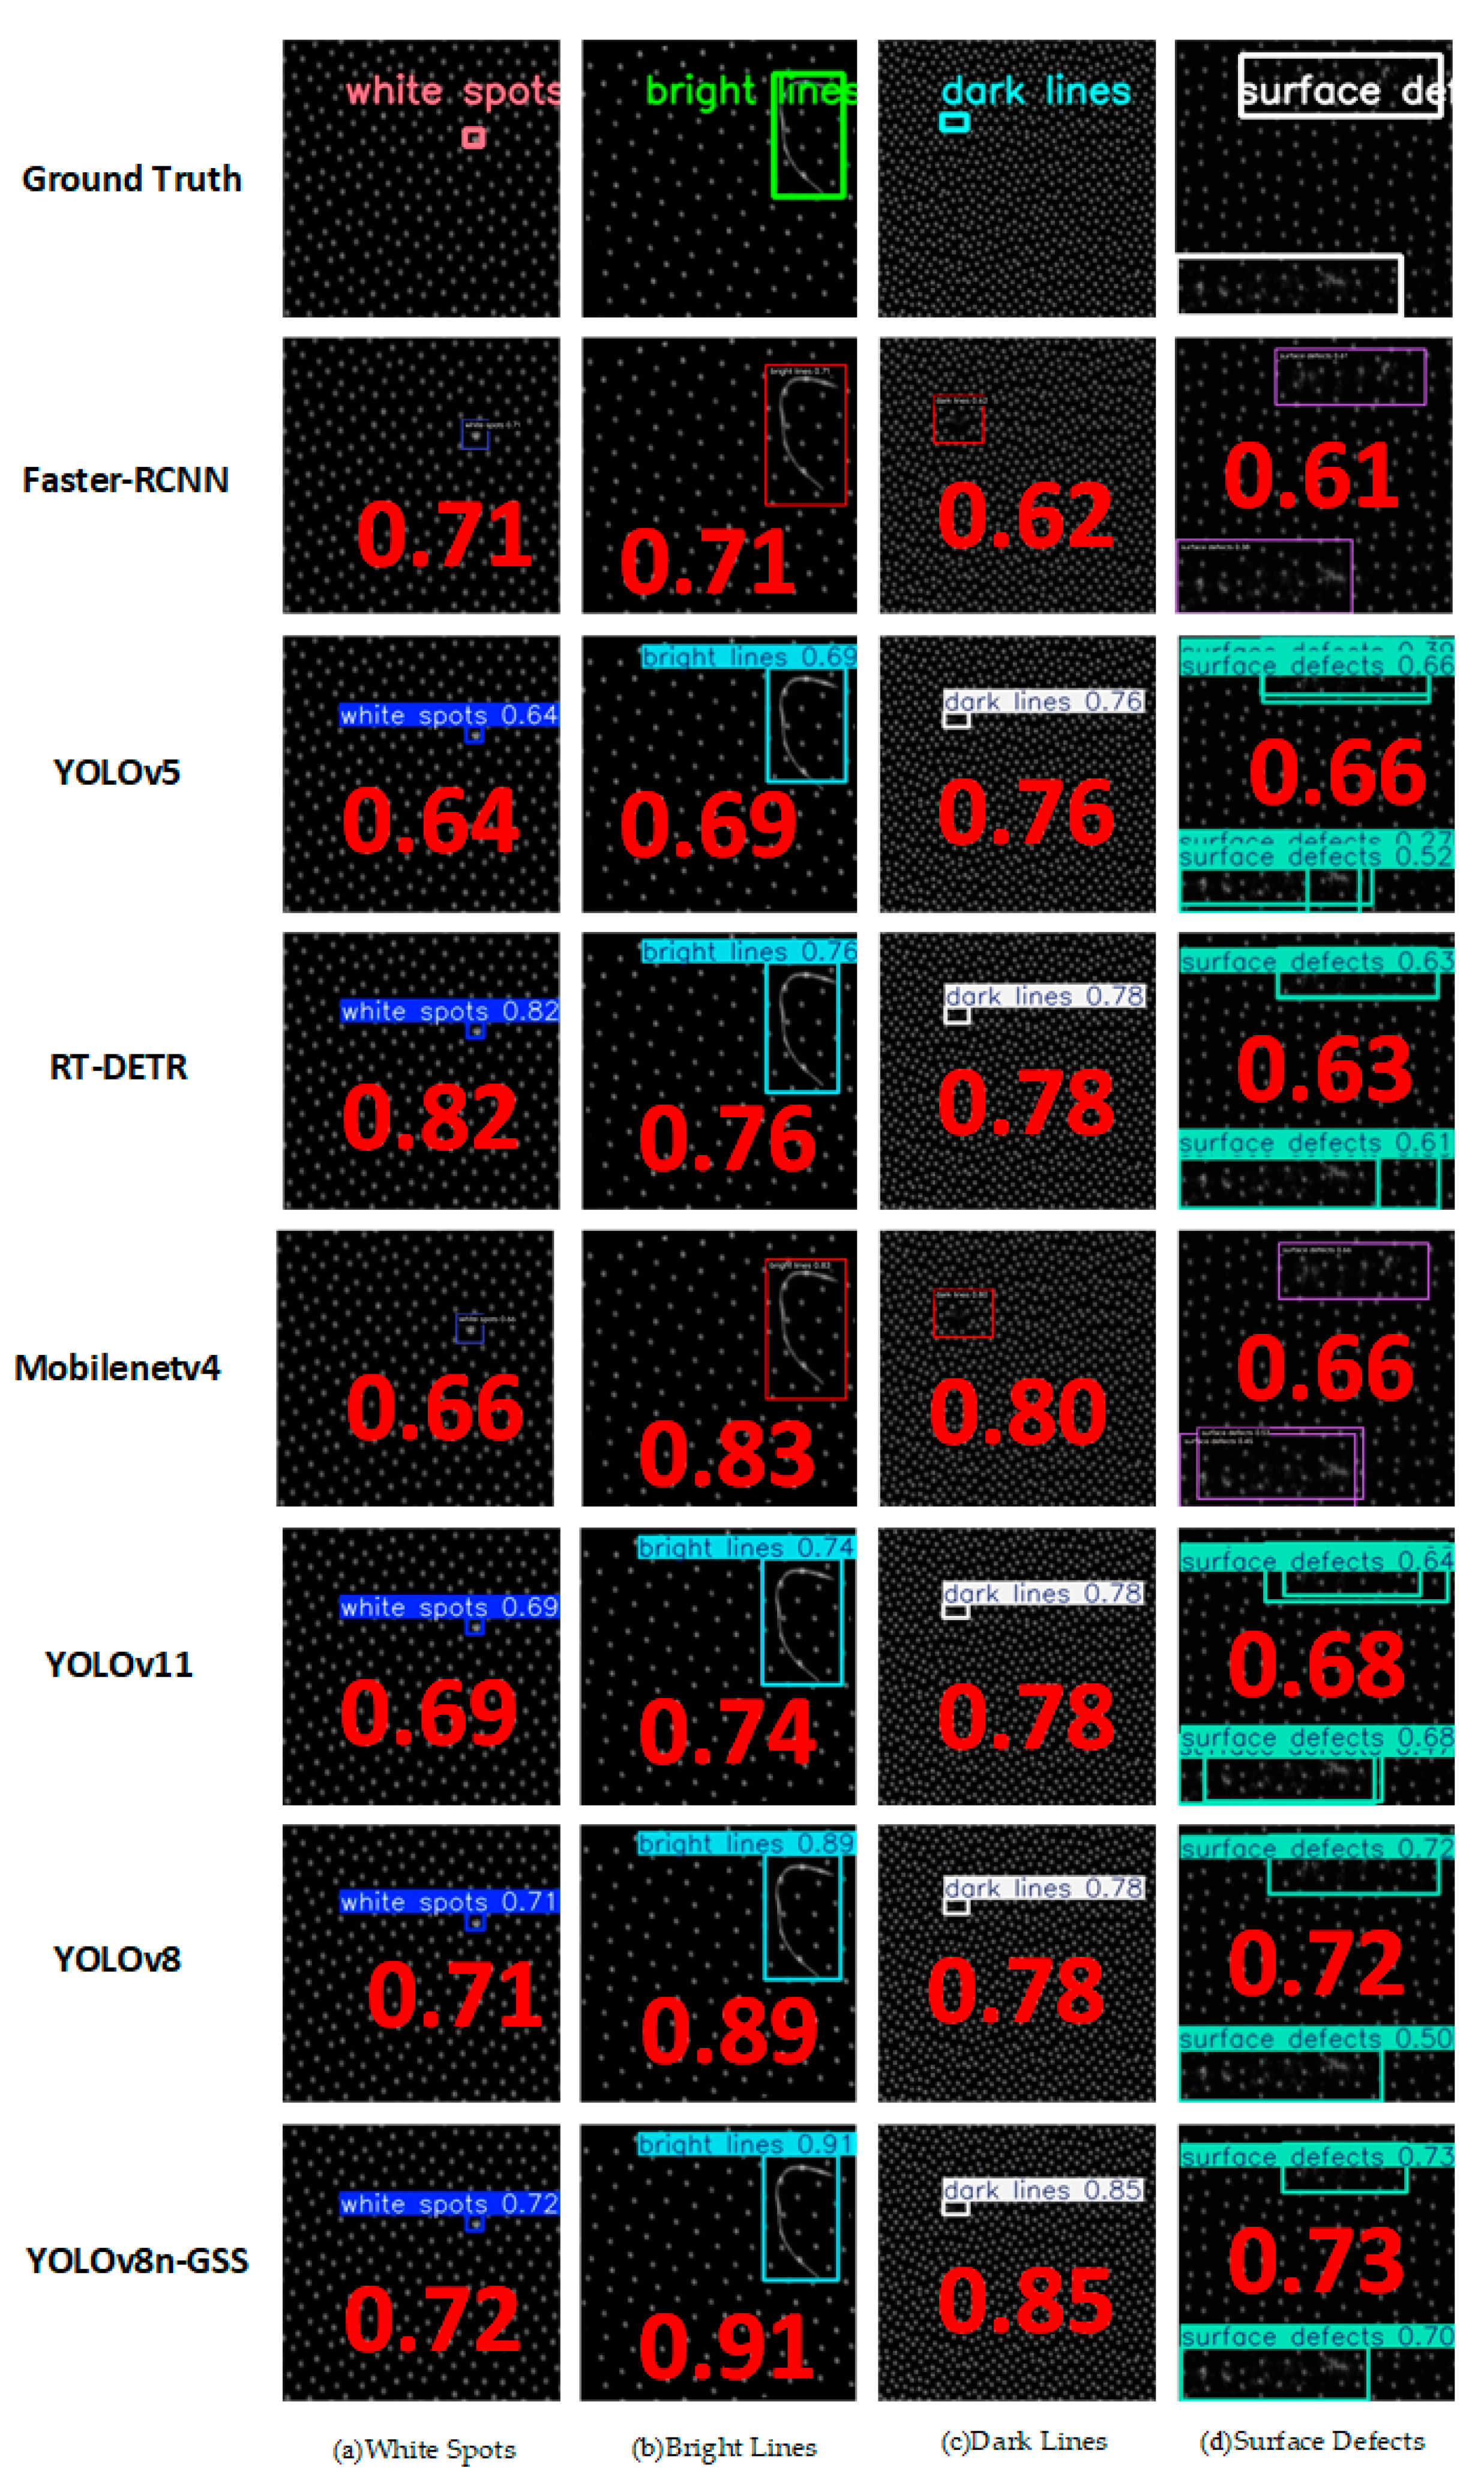
Table 8, quantitative comparisons between YOLOv8-GSS and several mainstream algorithms were performed under this unified experimental setup. Furthermore, representative samples of each defect type were randomly selected for visual analysis, and the results are displayed in
Figure 13, providing an intuitive comparison of the detection performance across different networks.
As shown by the experimental results in
Table 8, the proposed YOLOv8-GSS defect detection network performs favorably on the LGP-SDD dataset, achieving a mean average precision (mAP) of 98.4%. Specifically, compared to Faster R-CNN, YOLOv5, RT-DETR, MobileNet, YOLOv11, and the original YOLOv8 baseline, it shows significant mAP improvements of 6.1%, 0.7%, 3.3%, 3.5%, 0.7%, and 0.3%, respectively.
More notably, in a detailed comparison with the YOLOv8 baseline, although the proposed model does not achieve the highest per-class accuracy for white spots, bright lines, and certain surface defects, the performance gap remains minimal. A key advantage of our model lies in its detection of dark line defects, where it achieves a significant performance gain of 1.7%. This improvement is primarily attributed to the GsConv module, which enhances the retention and transmission of weak spatial features characteristic of low-contrast defects like dark lines through its depthwise-separable convolutions and channel shuffling mechanism, effectively preventing these features from being submerged in deeper network layers. This is coupled with the integrated SENetV2 attention mechanism, which adaptively calibrates feature channel weights, significantly amplifying feature responses sensitive to dark line defects while suppressing background noise interference. This targeted enhancement not only directly improves the detection rate for dark lines but also effectively mitigates the performance imbalance across different defect categories observed in the baseline model, thereby collectively contributing to more balanced and robust overall detection performance. Furthermore, the model reduces both the parameter count and computational complexity (GFLOPS), thereby enhancing its practical deployment capability in industrial scenarios without compromising high accuracy.
As shown in
Figure 13, the comparative test results of different network models on various defect detection tasks for thermally compressed light guide plates are presented. It can be observed that the YOLOv8n-GSS model demonstrates superior robustness and applicability compared to other networks. Specifically, the detection confidence scores of the proposed model for white spots, bright lines, dark lines, and surface defects reach 0.72, 0.91, 0.85, and 0.73, respectively, representing improvements of 0.01, 0.02, 0.07, and 0.01 over the baseline YOLOv8 network. The experimental results indicate that YOLOv8n-GSS not only performs well on specific datasets but also maintains efficient and reliable detection performance when confronted with diverse industrial defect scenarios. The robustness and generalization capability of the model establish a solid foundation for its practical application in industrial settings, thereby contributing to the intelligent advancement of quality control in manufacturing.
5. Limitations and Future Work
The YOLOv8-GSS model still exhibits certain missed detections and false detections on the DO-BSD dataset. To further analyze the phenomena and reasons behind these errors, understand the model’s limitations, and provide direction for subsequent optimization, this paper visualizes some samples with detection failures, and the results are shown in
Figure 14.
Figure 14a shows a forging waste defect that was misclassified as a black spot defect, while
Figure 14b shows an abrasion defect that was misjudged.
As shown in
Figure 14a, the improved network misclassified a large forging waste defect as a black spot defect. This misjudgment primarily stems from two factors: firstly, both types of defects share similar black-color features and variable geometric sizes, resulting in high visual similarity; secondly, the specific forging waste defect far exceeds the conventional size range, almost covering the entire image area, causing it to blend highly with the black background and making distinction difficult. To address this issue, future work could involve targeted expansion of the dataset to include such oversized forging waste defect samples with low contrast against the background, improve the quality of annotations for features like morphology, and guide the model to understand the boundary relationships between defects and the normal background by designing loss functions or network structures.
As shown in
Figure 14b, the network exhibited a misjudgment regarding abrasion defects, mistakenly identifying some fine scratches as abrasion defects. This misjudgment arises from two core challenges: firstly, the inherent fine scratches produced during the bearing manufacturing process are highly visually similar to actual abrasion defects, and the complex background texture of the workpiece surface further interferes with judgment; secondly, the vision-based unimodal detection method struggles to perceive and quantify the key physical dimension of scratch “depth,” making it ineffective at distinguishing harmless scratches from functional abrasion. To resolve this issue, subsequent efforts will consider designing channel attention or deformable convolutions to enhance the model’s ability to discriminate subtle feature differences, enabling it to focus more on local micro-textures and depth cues. Alternatively, attempts may be made to integrate 2D visual information with 3D point cloud data or hyperspectral information that can reflect surface contour depth, thereby providing the model with “depth” perception capability and fundamentally overcoming the limitations of unimodal vision.
6. Conclusions
A defect detection algorithm based on YOLOv8-GSS was proposed to solve the problems of complex texture background, uneven brightness, defect size, and variety in bearing ring surface images. Specifically, to reduce computational costs, the standard convolution between the C2f module and the Concat module in the neck network is replaced with a lightweight convolution method, namely GsConv. To enhance the model’s diversity and robustness, the SENetV2 attention mechanism is integrated before the SPPF module in the backbone network. The improved YOLOv8-GSS network is used in a large number of experiments on the self-constructed bearing ring defect dataset. The experimental results demonstrate that the proposed YOLOv8-GSS defect detection method achieves an AP50 of 97.8%, representing a 1.9% improvement over the YOLOv8 baseline network, while maintaining a detection speed of 115 FPS. It is noteworthy that, compared to the YOLOv8 baseline, our method achieves improvements of 2.4%, 3.6%, and 2.3% in APS, APM, and APL, respectively, while achieving higher inference speed (FPS) with fewer parameters. The improved YOLOv8-GSS network is lightweight while maintaining high real-time detection efficiency to meet the requirements of industrial test applications. Finally, comparative experiments conducted on the hot-pressed light guide plate dataset demonstrate that the proposed improvements exhibit strong generalization capabilities in other industrial defect detection domains. These results not only validate the robustness and adaptability of the method, but also provide valuable insights and potential directions for subsequent research in industrial image detection and processing.


