
L-Shaped Coplanar Strip Dipole Antenna Sensor for Adulteration Detection


Abstract
1. Introduction
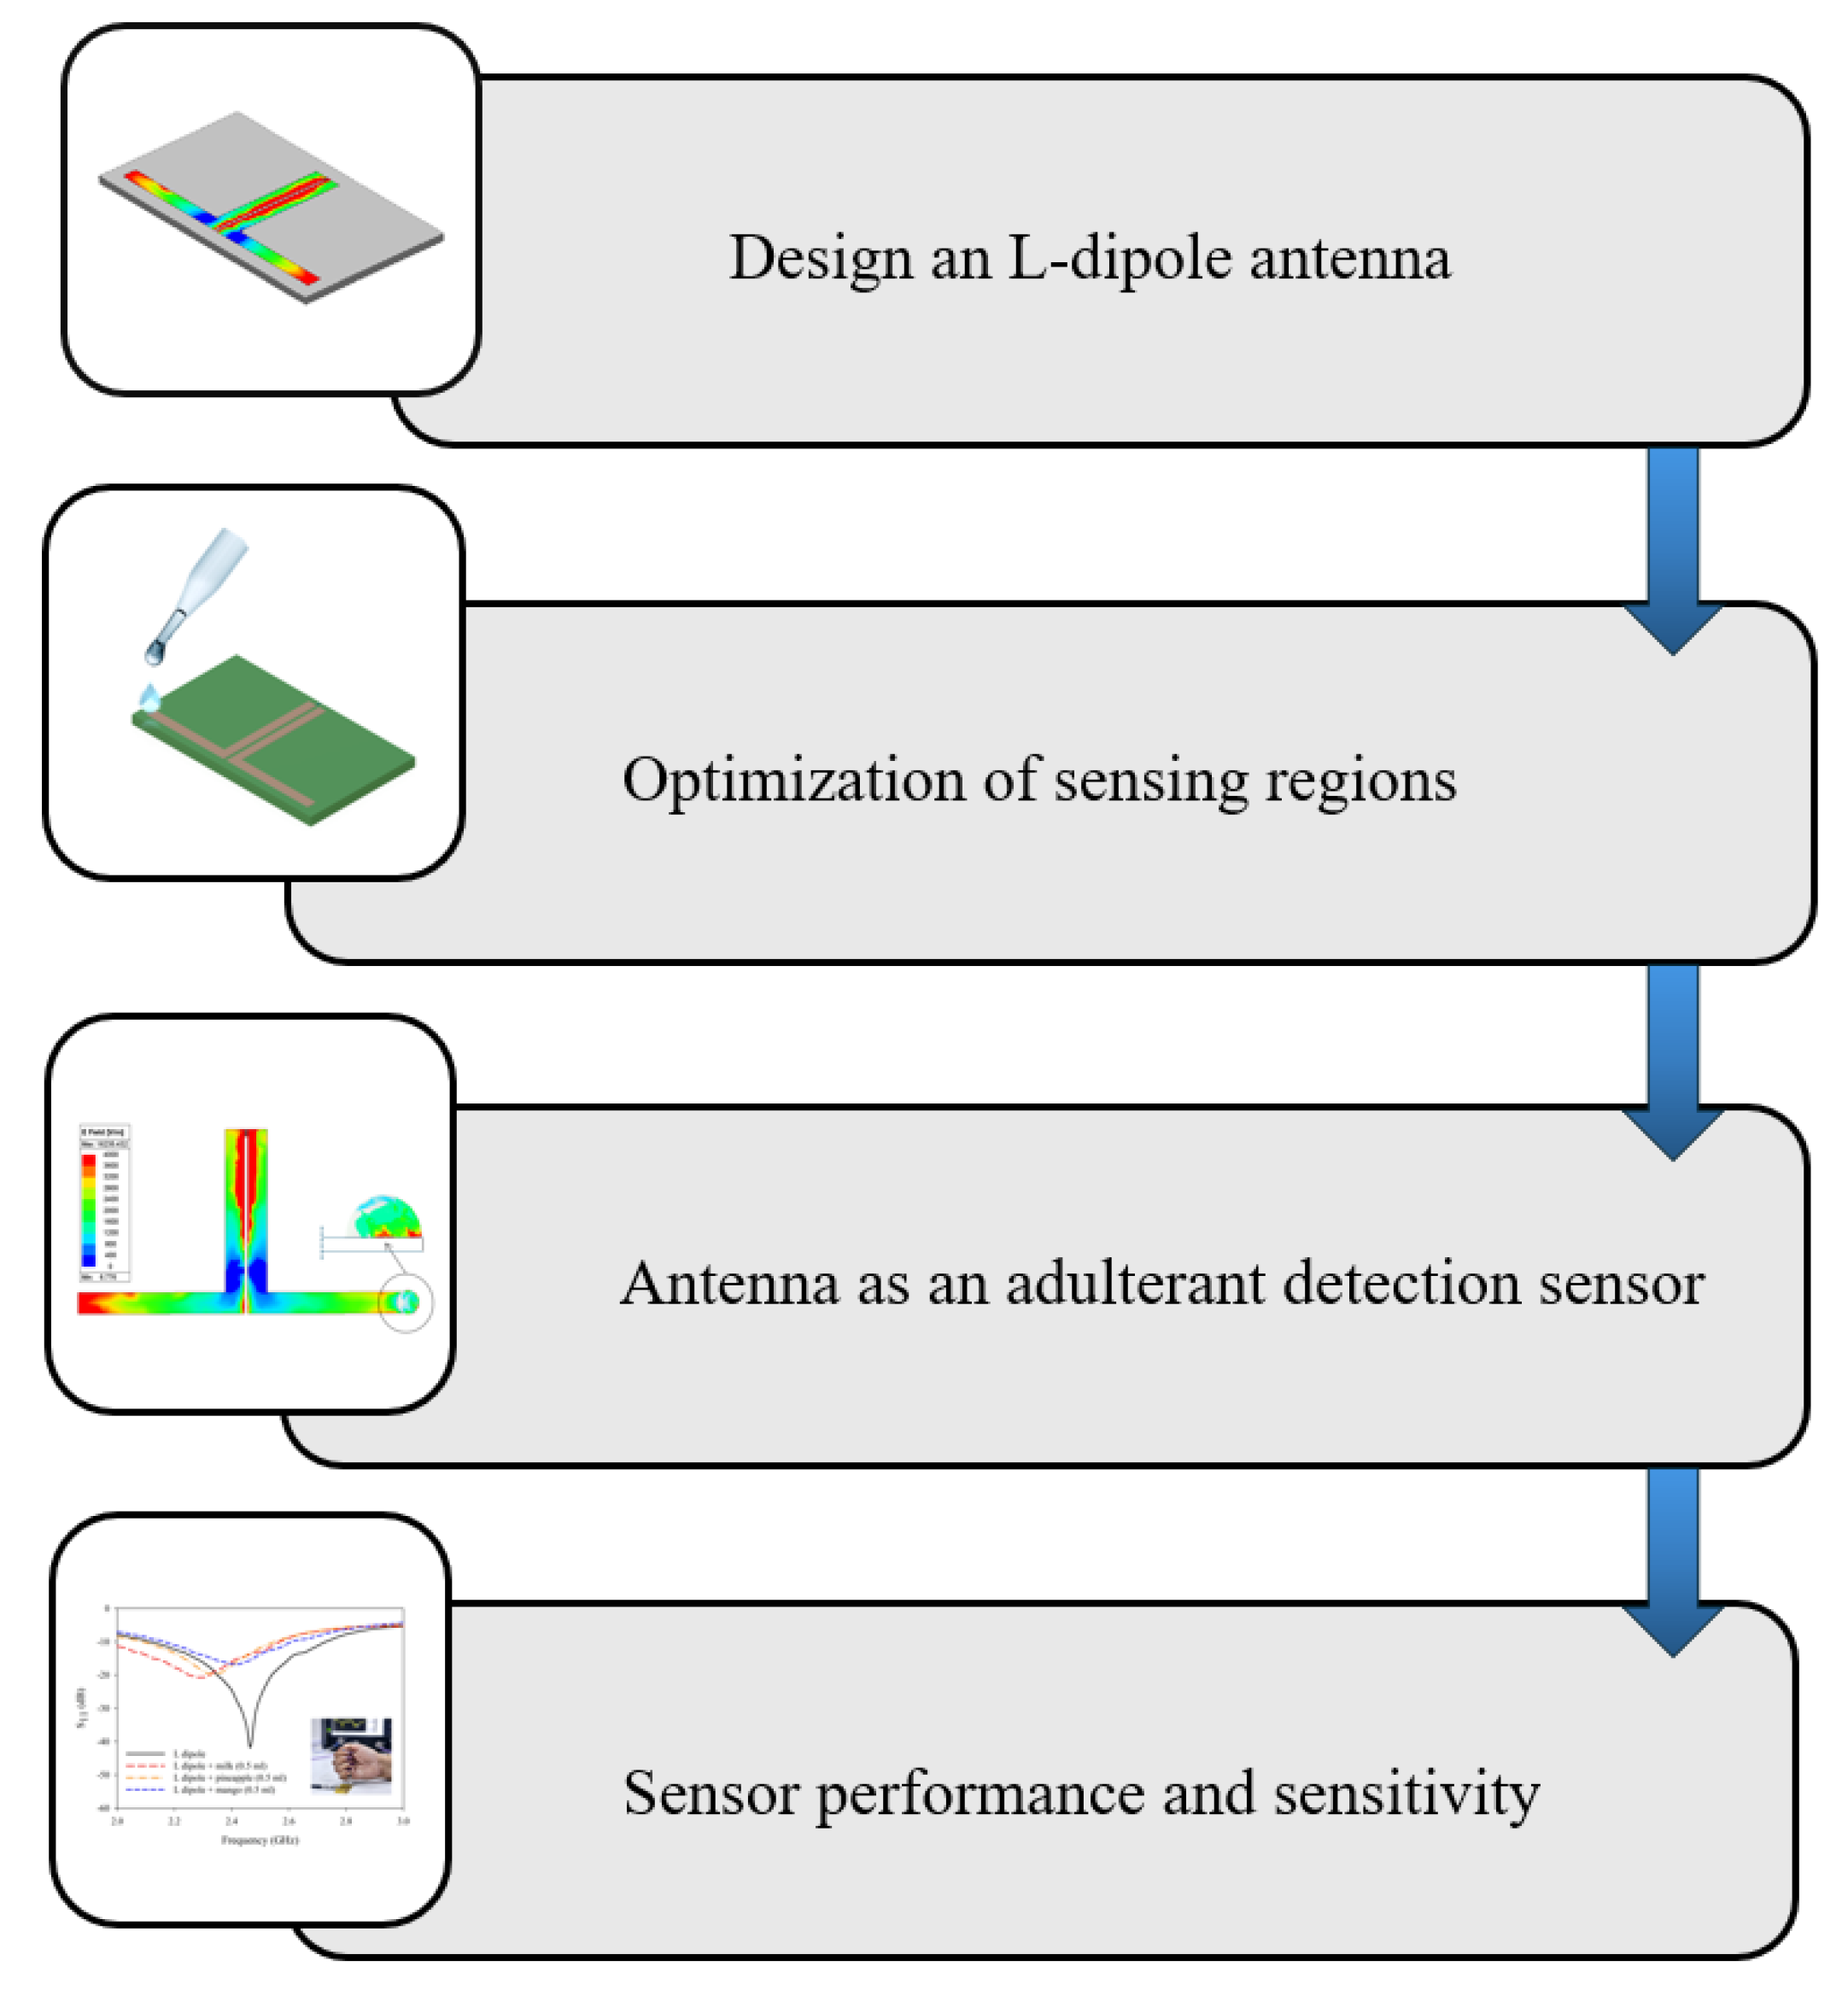
2. Methodology
2.1. Antenna Design
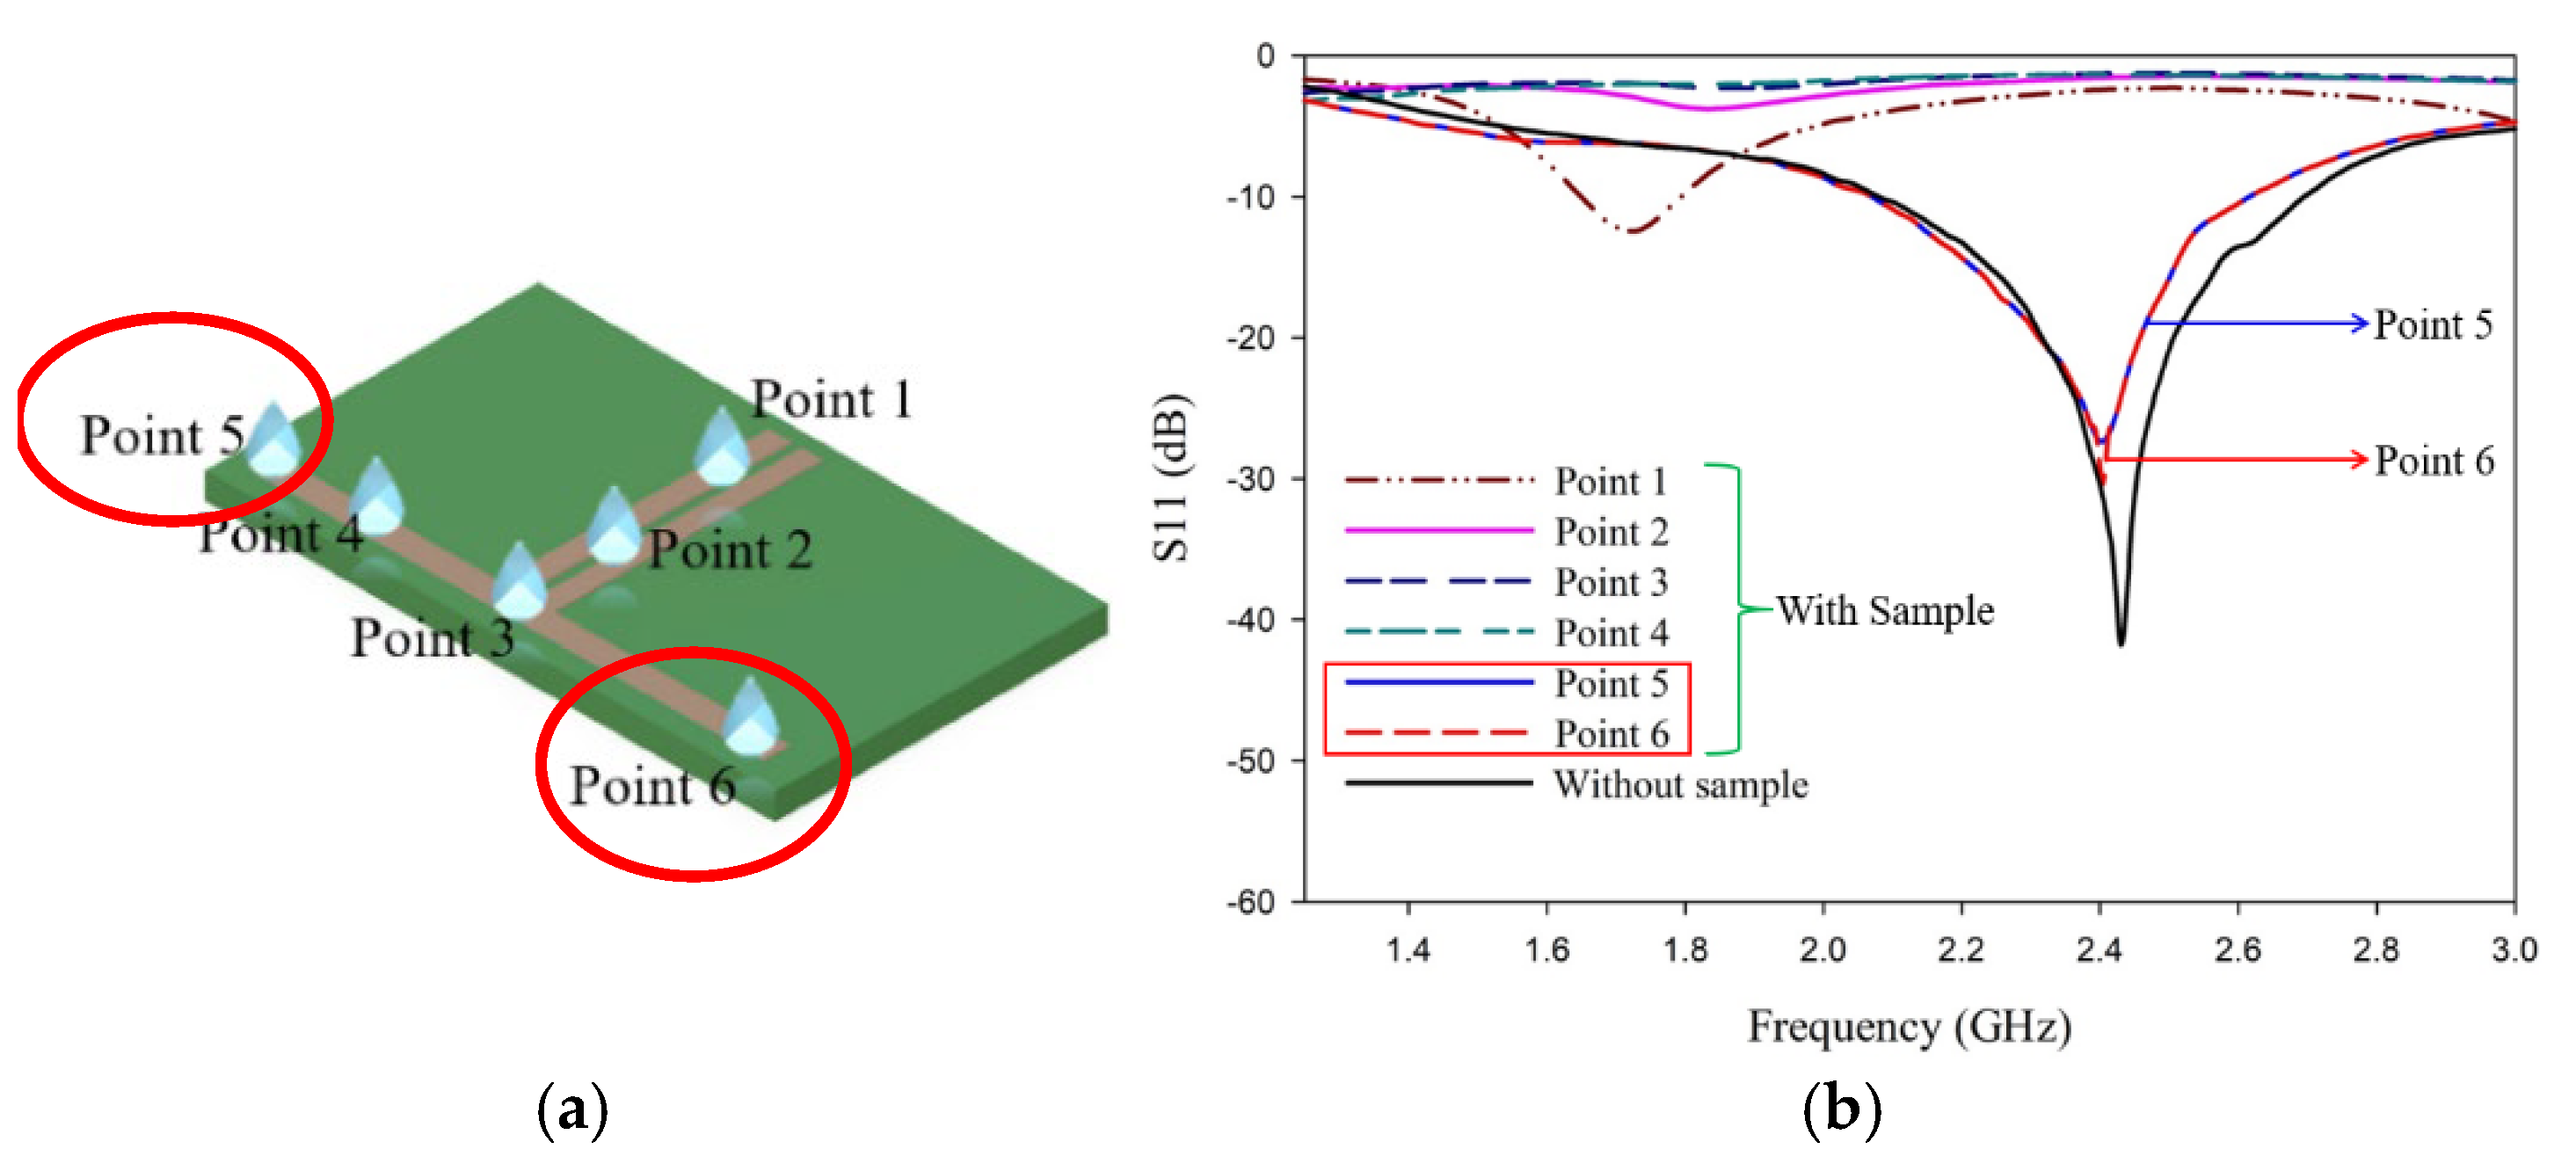
2.2. L Shaped Coplanar Strip Dipole Antenna as a Sensor
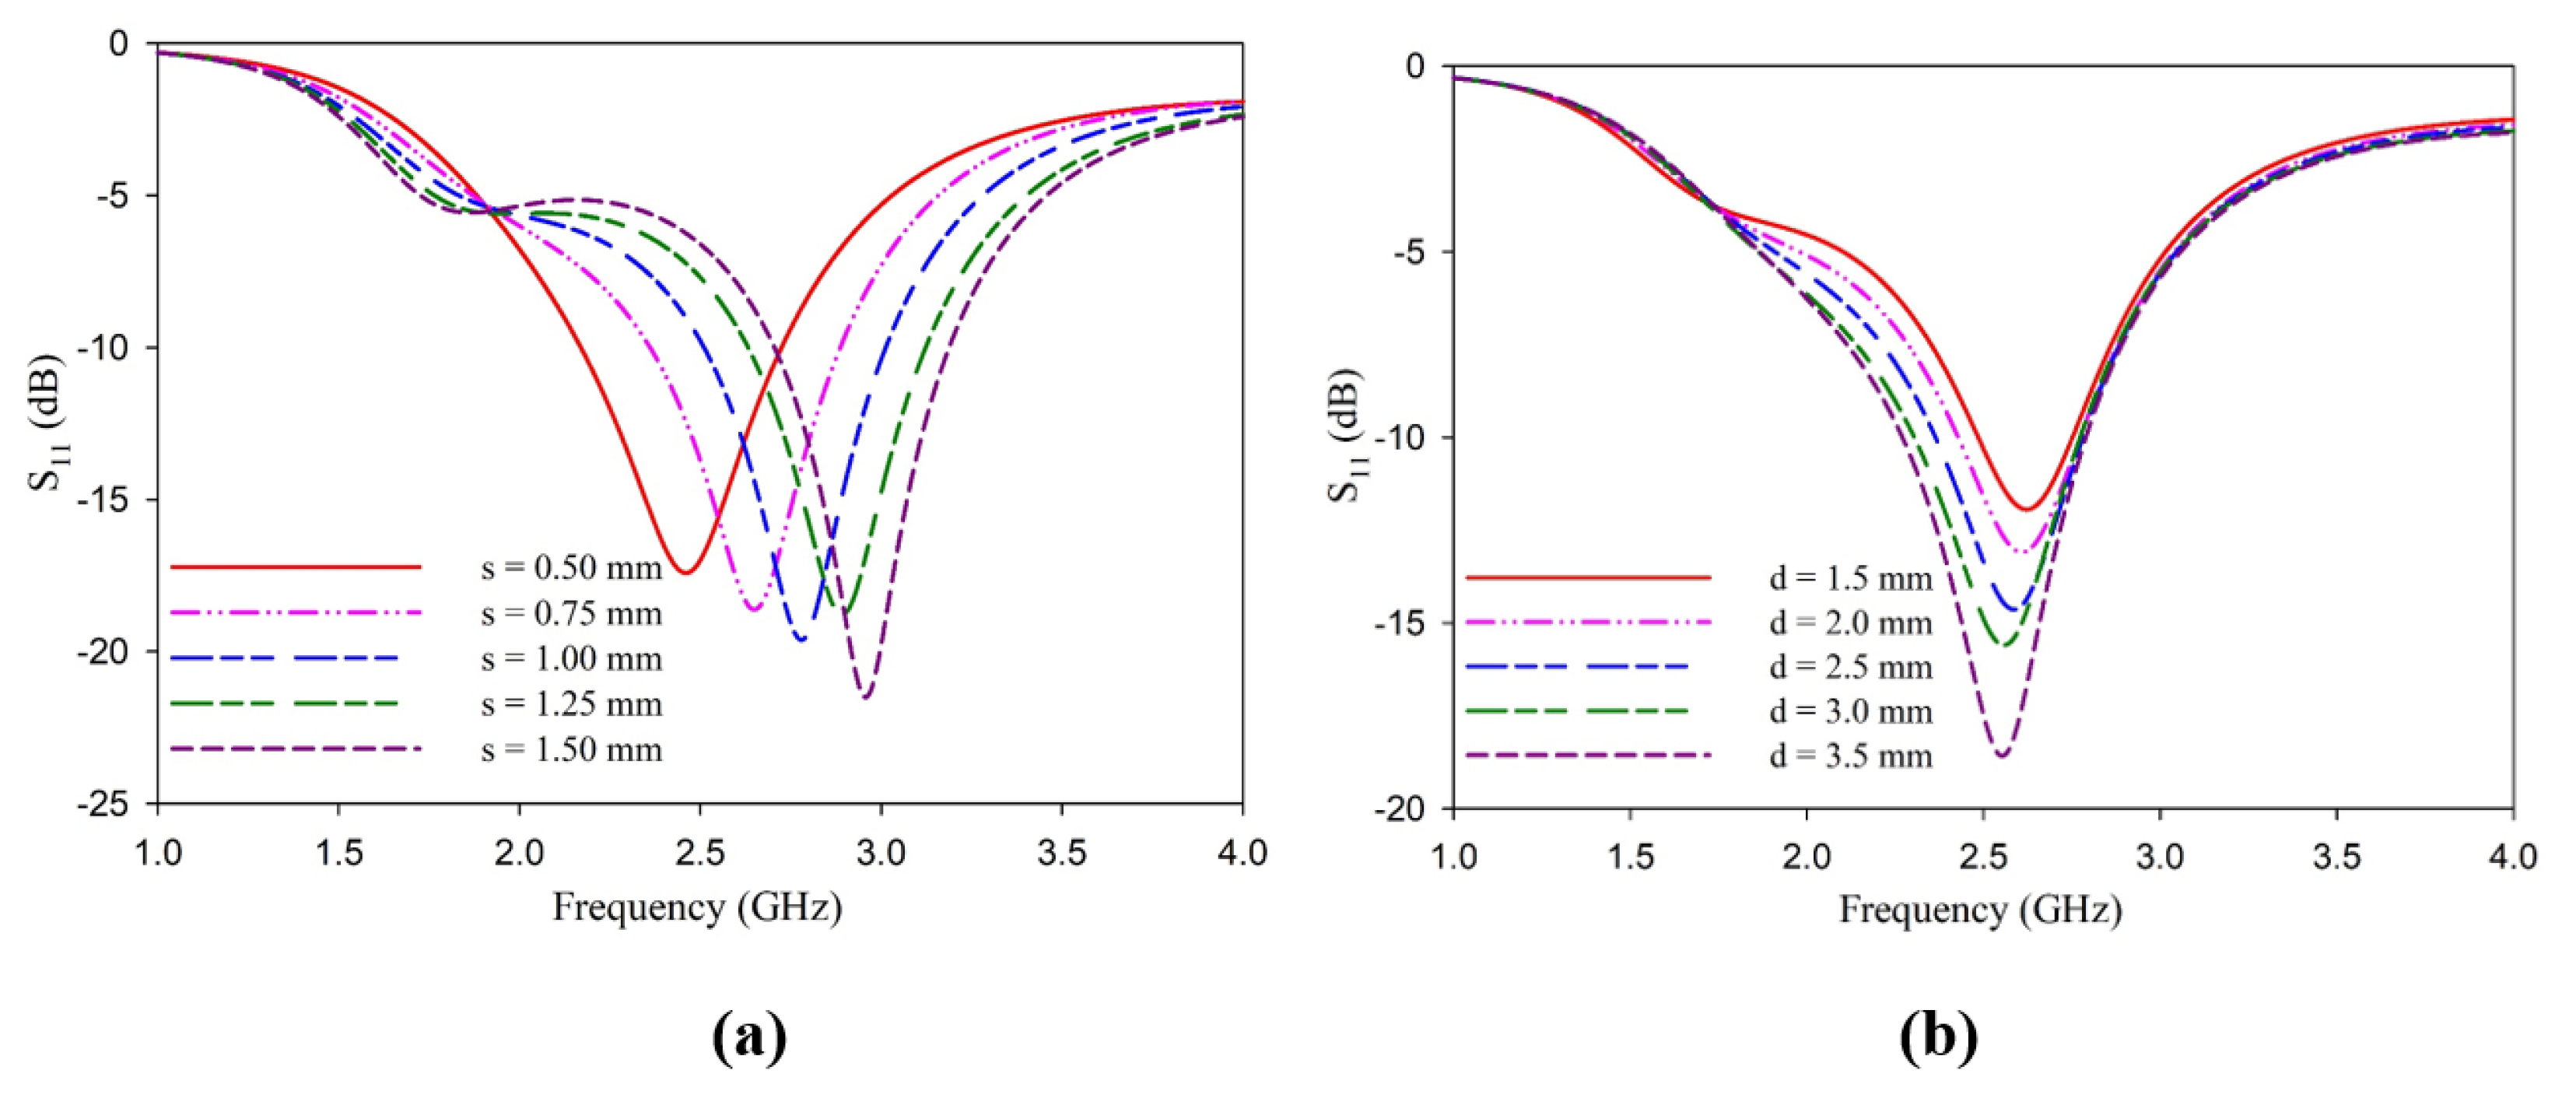
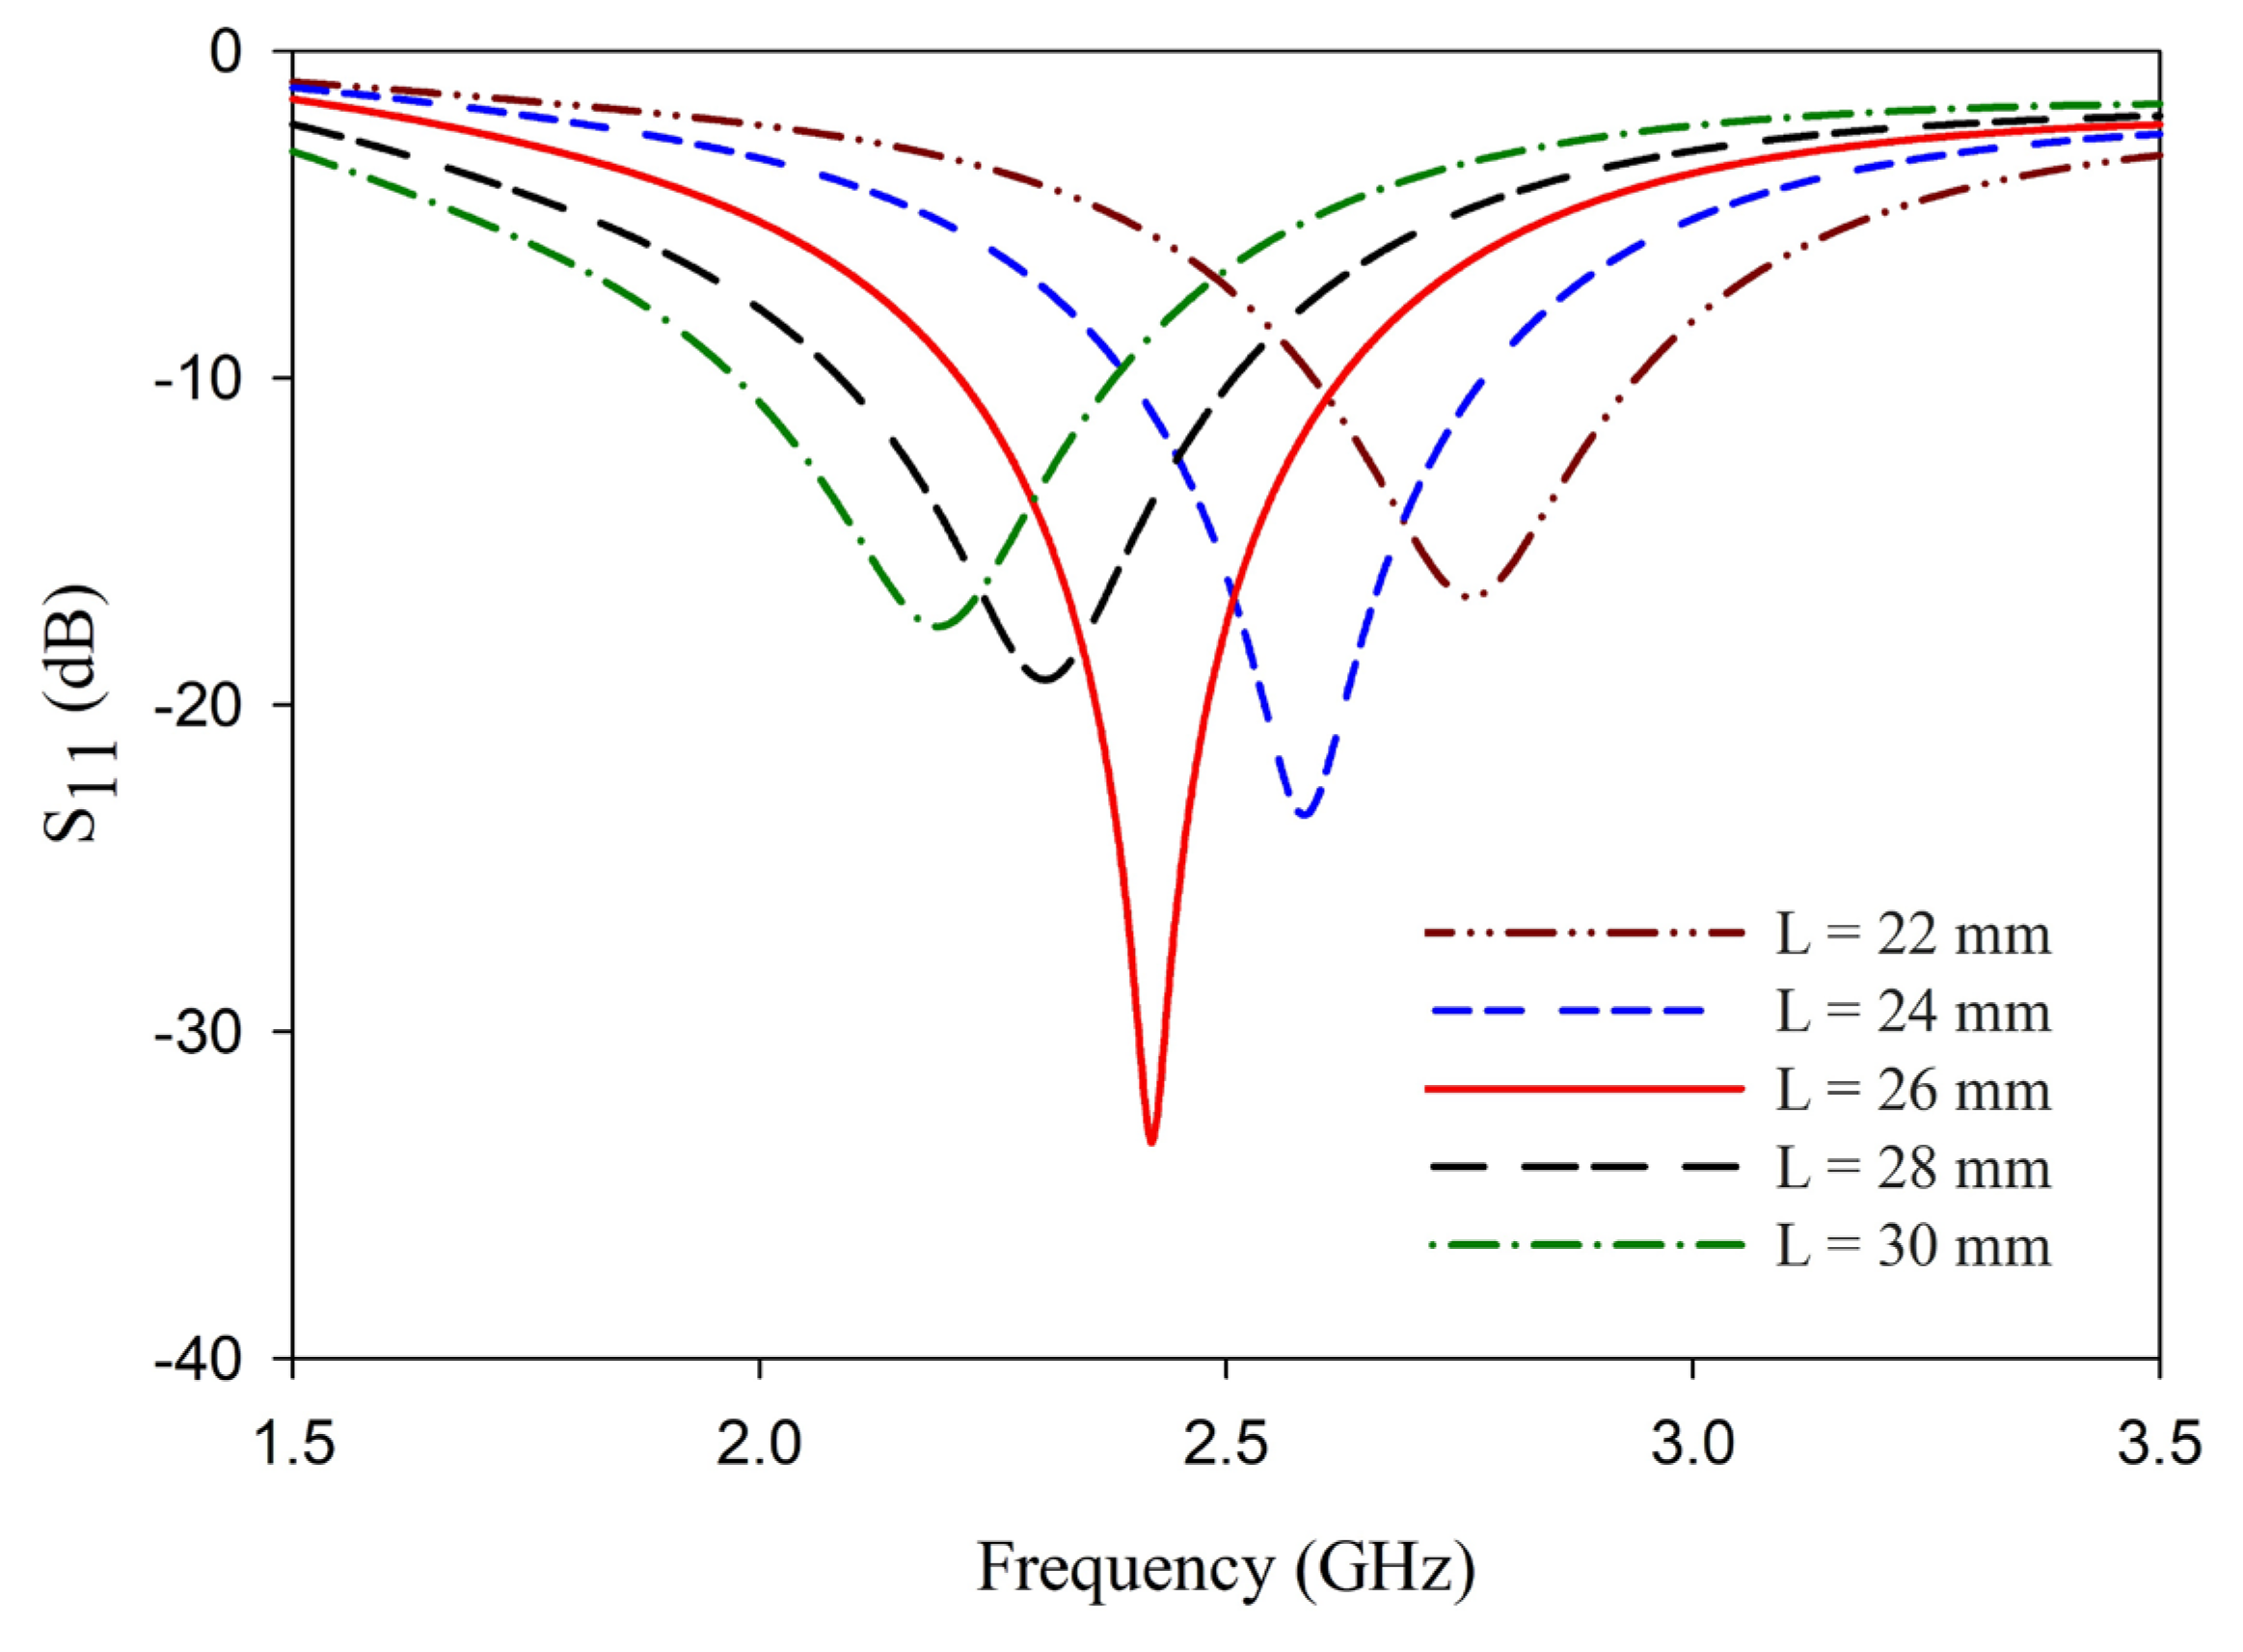
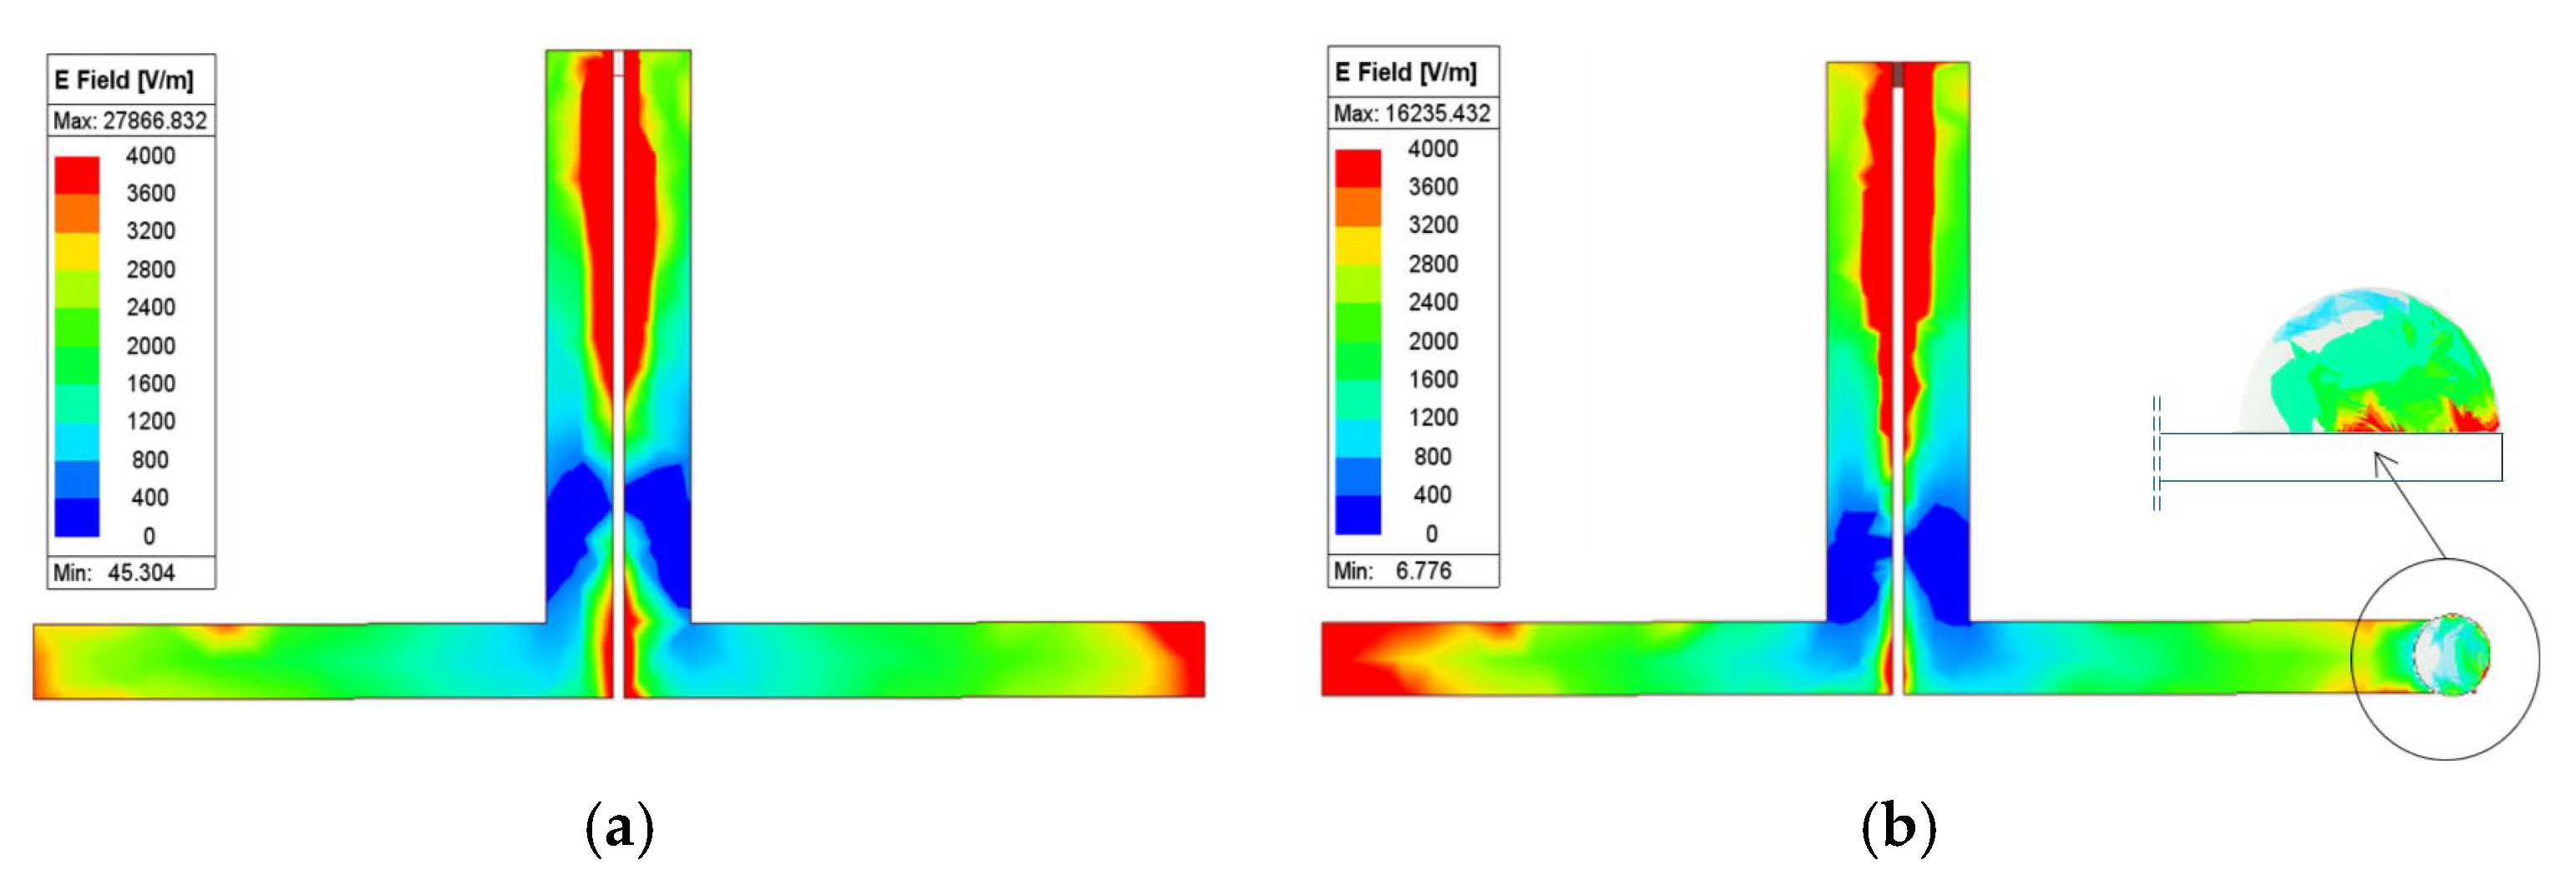
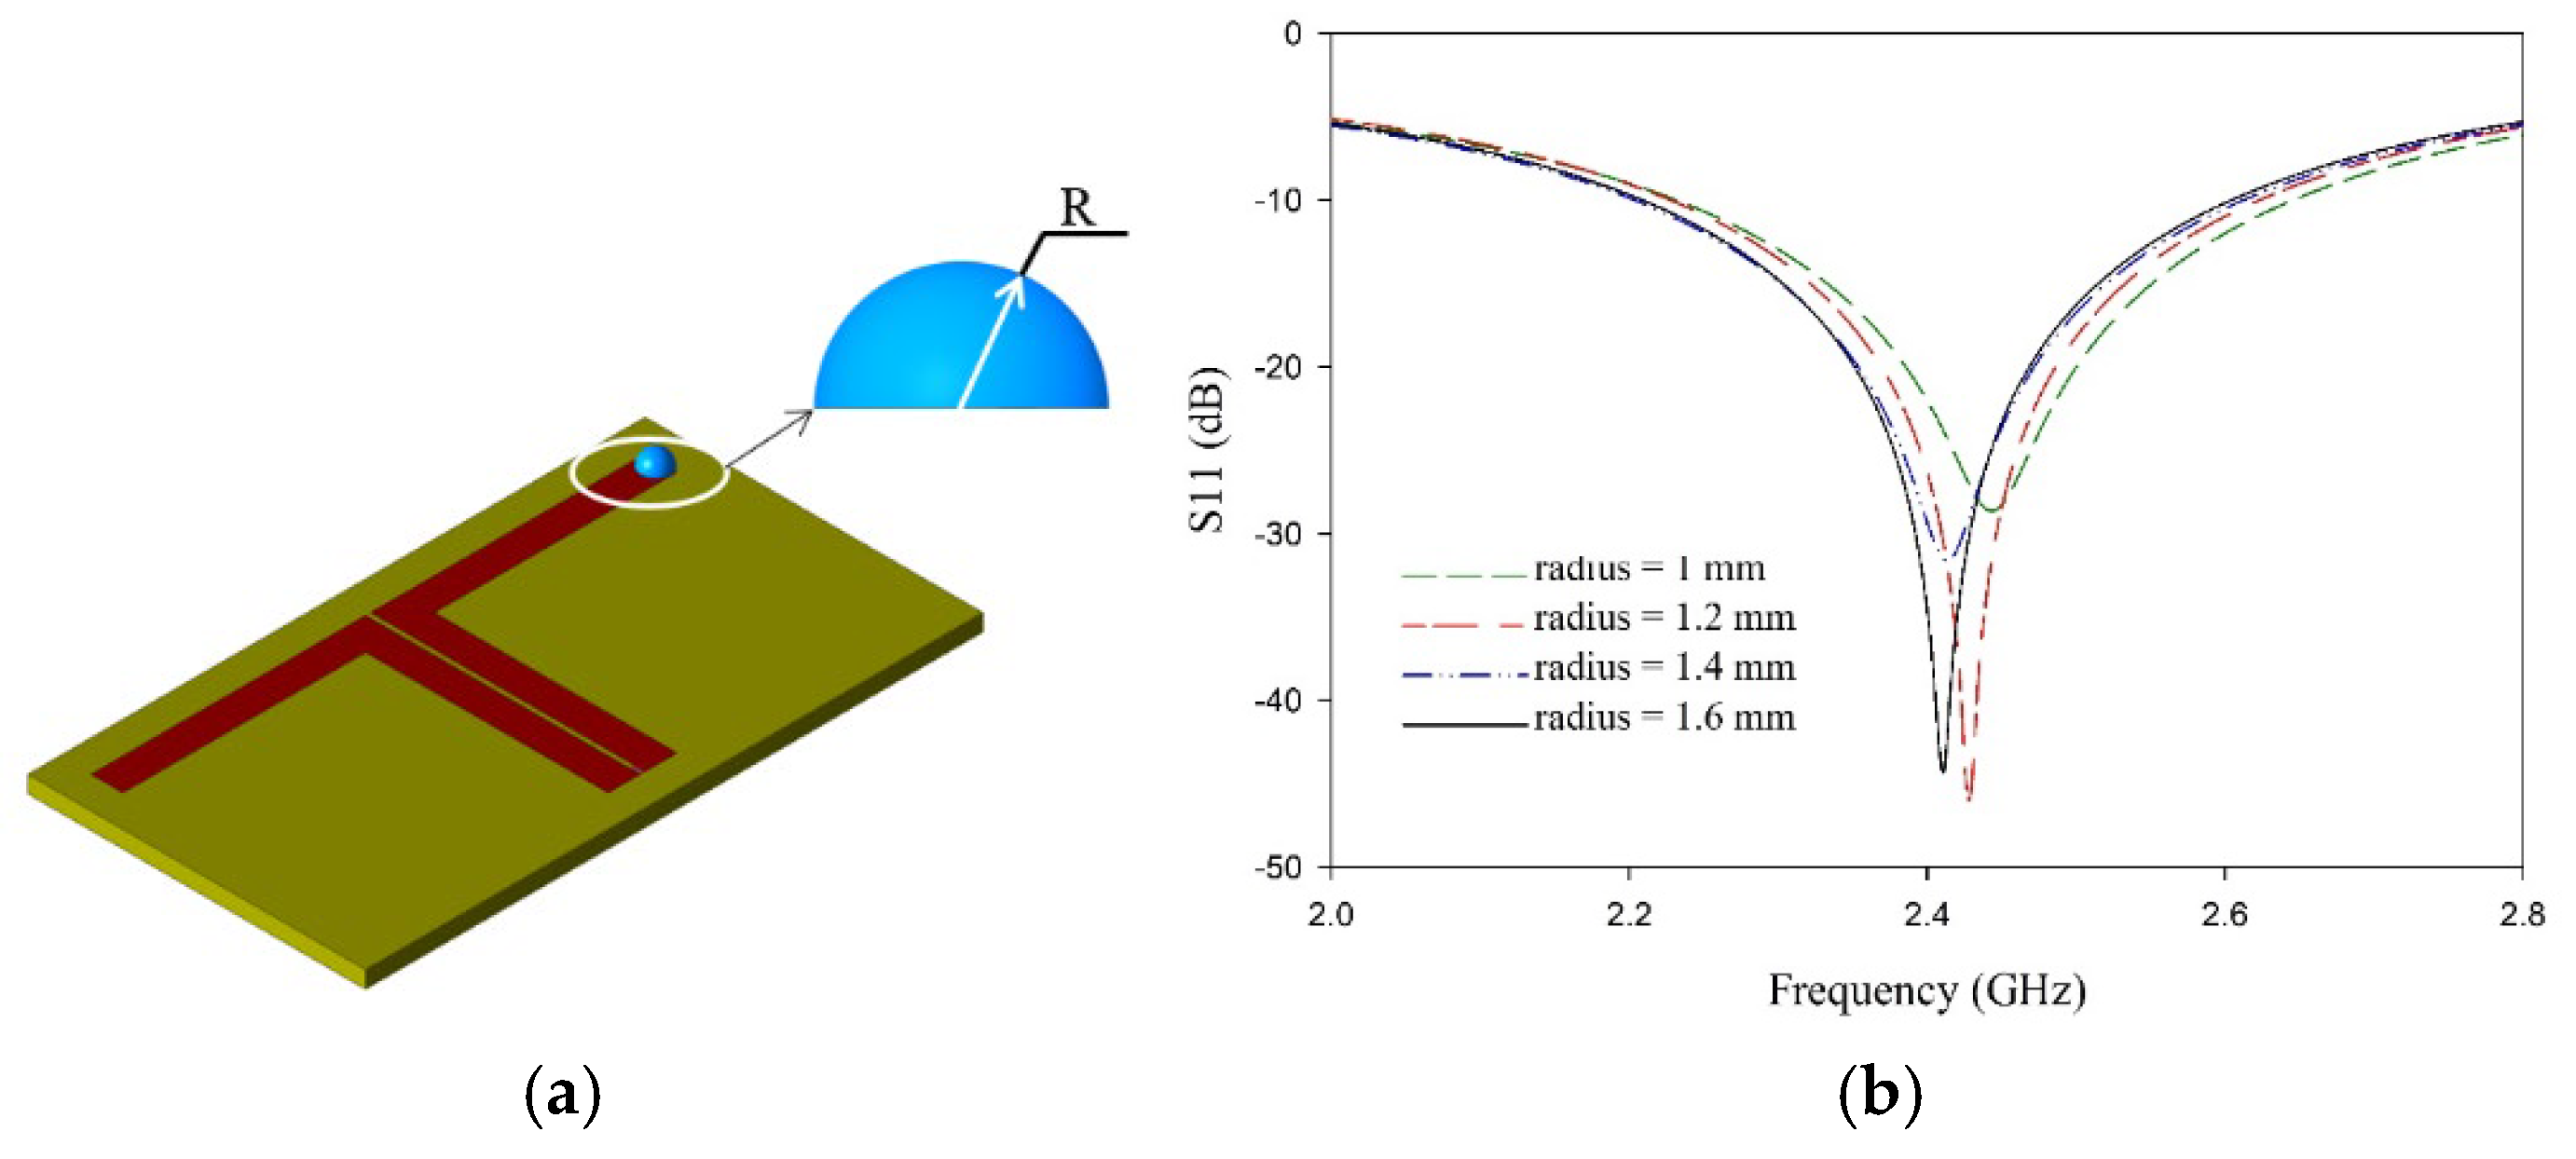
3. Analysis of L-Shaped Coplanar Strip Dipole Antenna
4. L-Shaped Coplanar Strip Dipole Antenna as Sensor
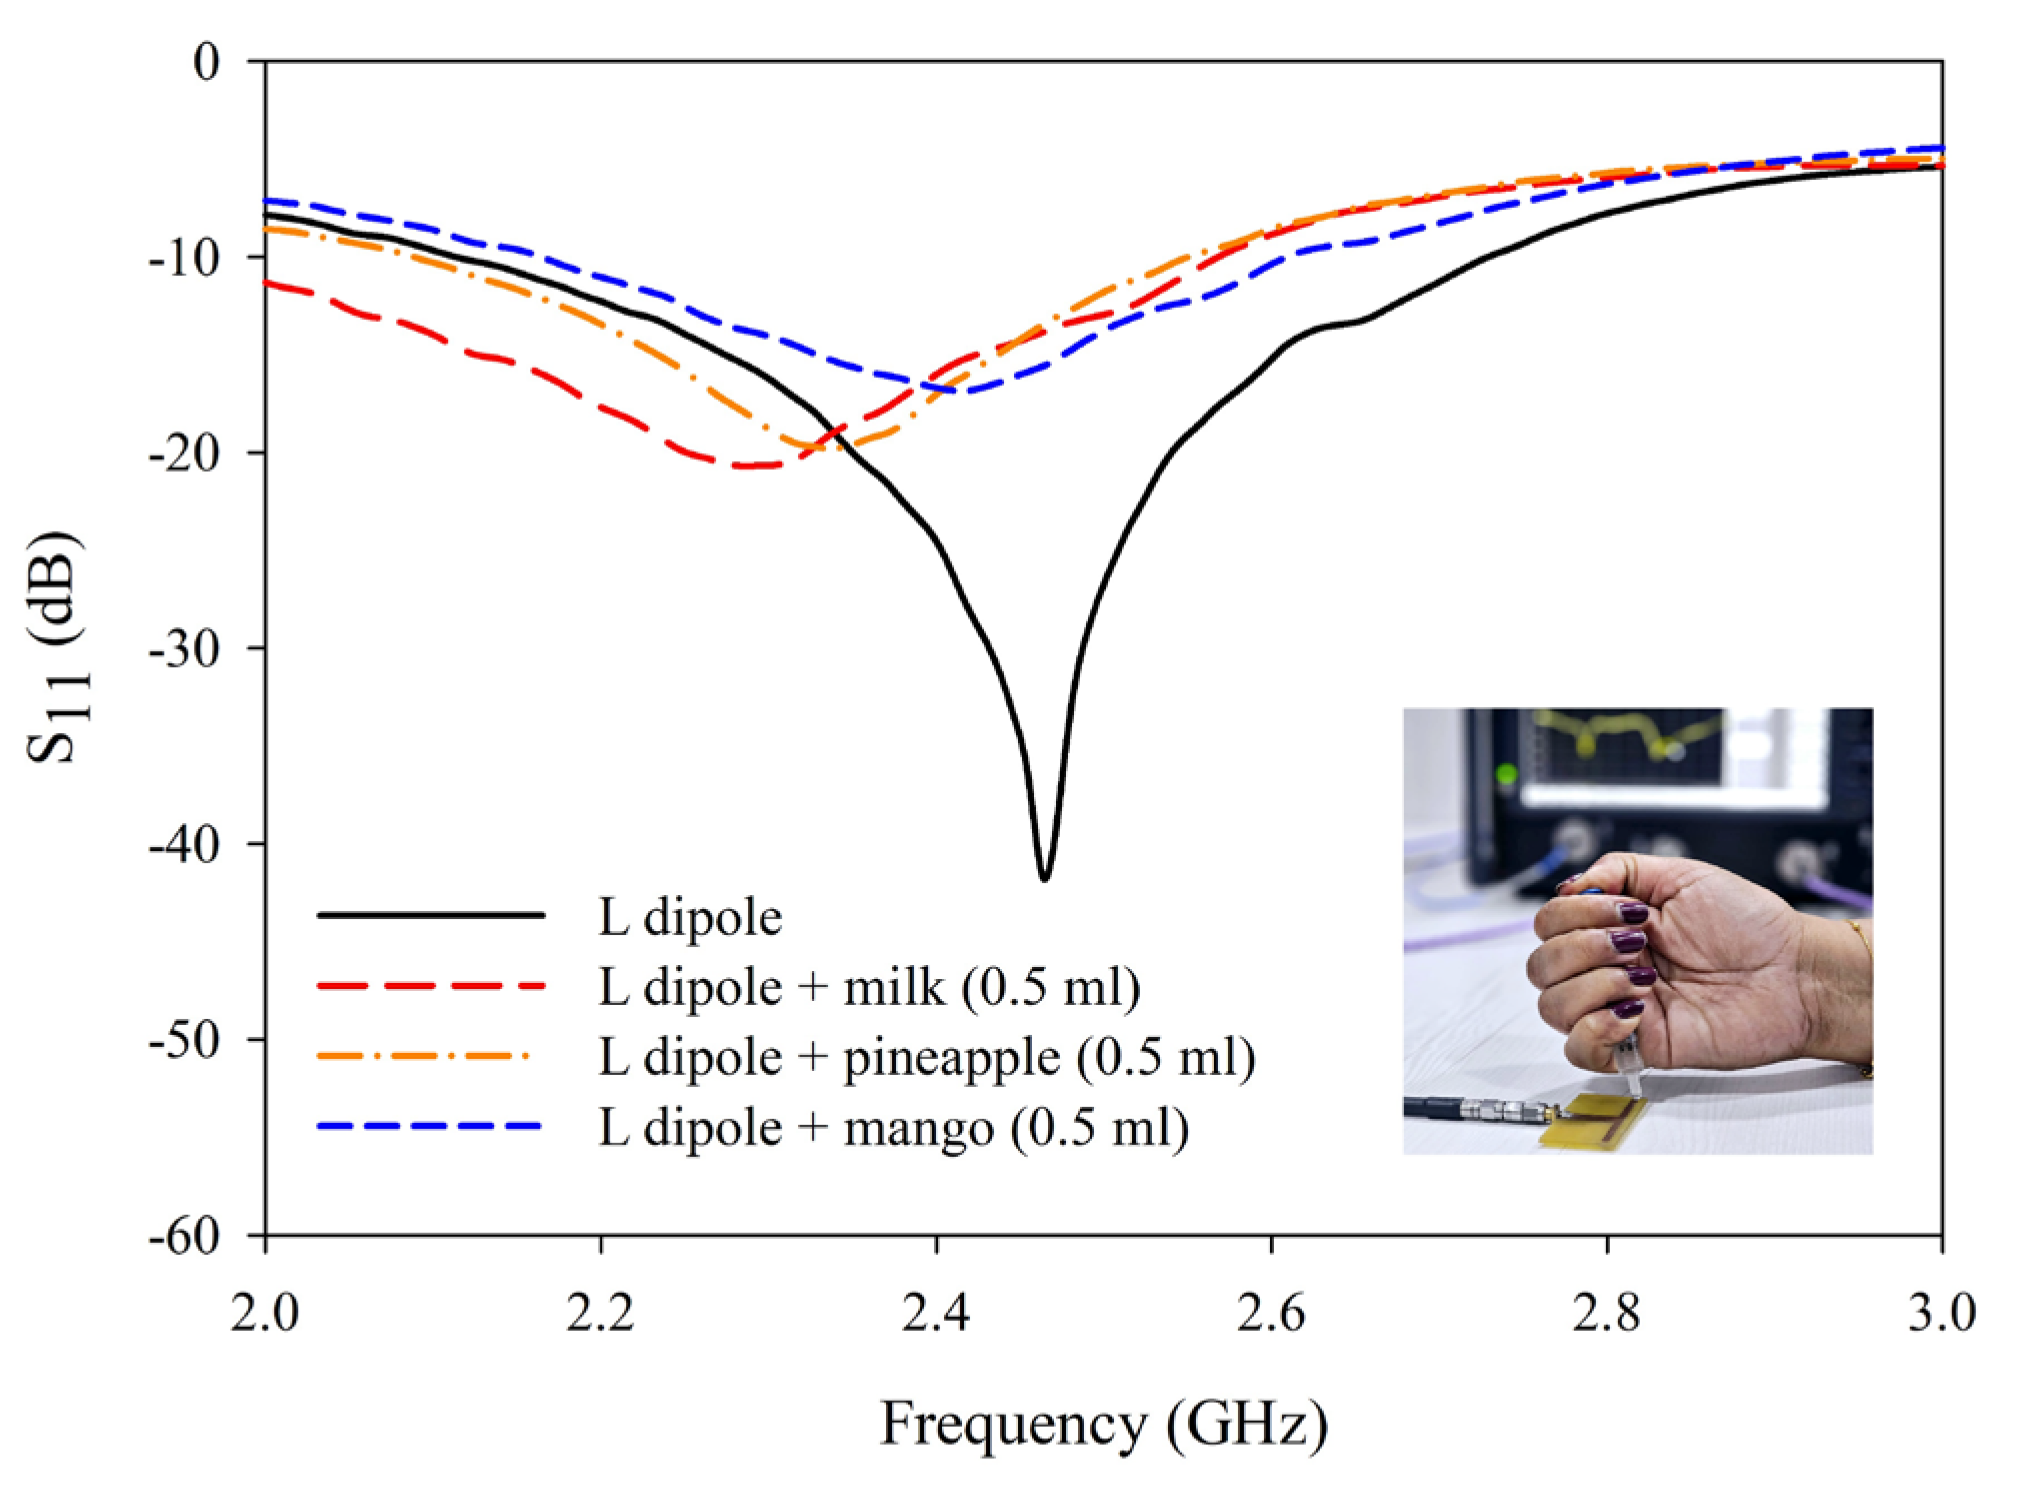
5. Results and Discussion
- is the dielectric constant of the mixture (sample added to adulterant).
- is the volume fraction of the unadulterated sample.
- is the volume fraction of the adulterant.
- is the dielectric constant of the unadulterated sample.
- is the dielectric constant of the adulterant.

| Sl. No: | Type of Antenna Sensor | Substrate | Size (mm3) | Frequency of Operation (GHz) | Sensitivity |
| 1 | Present work | εr = 4.4 h = 1.6 mm | 52.5 × 28 × 1.6 | 2.46 | 159 MHz/% pineapple juice with H2O2 |
| 2 | [18] | εr = 4.4 h = 1.6 mm | 38.8 × 38.8 × 1.6 | 2.48 | 0.27 |
| 3 | [25] | εr = 4.4 h = 2.5 mm | 10 × 10 × 1.56 | 13.3 | 28% |
| 4 | [26] | εr = 4.5 h = 2.5 mm | 80 × 80 × 31.5 | 6.9 | 0.038 |
| 5 | [27] | εr = 4.4 h = 1.5 mm | 35 × 25 ×1.6 | 2.4 | 0.214 |
| 6 | [28] | εr = 4.4 h = 1.5 mm | 22.84 × 10.18 × 11.57 | 8 −12.5 | 0.85 |
| 7 | [29] | εr = 3.5 h = 0.76 mm | 80 × 80 × 0.76 | 2.653 | 0.45 |
| 8 | [30] | εr = 4.4 h = 1.6 mm εdr = 9.8 h = 6.35 mm | 80 × 80 × 7.95 | 2.25 | 8.75 MHz/εr |
| 9 | [31] | εr = 2.2 h = 3.175 mm | 90 × 90 × 3.175 | 4.4 | - |
| 10 | [32] | εr = 2.2 h = 0.8 mm | 40 × 15 × 0.8 | 2.6 | 0.27 |
6. Conclusions
Author Contributions
Funding
Institutional Review Board Statement
Informed Consent Statement
Data Availability Statement
Conflicts of Interest
References
- Nyfors, E.; Vainikainen, P.-V. Industrial Microwave Sensors; Artech House: Norwood, MA, USA, 1989; 351p. [Google Scholar]
- Buyukakkaslar, M.T.; Erturk, M.A.; Aydin, M.A. A Review on Radar-Based Human Detection Techniques. Sensors 2024, 24, 5709. [Google Scholar] [CrossRef] [PubMed]
- Oliveira, J.G.D.; Junior, J.G.D.; Pinto, E.N.M.G.; Neto, V.P.S.; D’Assunção, A.G. A new planar microwave sensor for building materials complex permittivity characterization. Sensors 2020, 20, 6328. [Google Scholar] [CrossRef] [PubMed]
- Abbasi, Z.; Niazi, H.; Abdolrazzaghi, M.; Chen, W.; Daneshmand, M. Monitoring pH level using high-resolution microwave sensor for mitigation of stress corrosion cracking in steel pipelines. IEEE Sens. J. 2020, 20, 7033–7043. [Google Scholar] [CrossRef]
- Yee, T.S.; Shrifan, N.H.; Al-Gburi, A.J.; Isa, N.A.; Akbar, M.F. Prospect of using machine learning-based microwave nondestructive testing technique for corrosion under insulation: A review. IEEE Access 2022, 10, 88191–88210. [Google Scholar] [CrossRef]
- Menon, S.K.; Donelli, M. Development of a microwave sensor for solid and liquid substances based on closed loop resonator. Sensors 2021, 21, 8506. [Google Scholar] [CrossRef]
- Omer, A.E.; Shaker, G.; Safavi-Naeini, S.; Kokabi, H.; Alquié, G.; Deshours, F.; Shubair, R.M. Low-cost portable microwave sensor for non-invasive monitoring of blood glucose level: Novel design utilizing a four-cell CSRR hexagonal configuration. Sci. Rep. 2020, 10, 15200. [Google Scholar] [CrossRef]
- Baghelani, M.; Abbasi, Z.; Daneshmand, M. High-dynamic-range chipless microwave resonator-based strain sensor. IEEE Trans. Instrum. Meas. 2021, 70, 1–7. [Google Scholar] [CrossRef]
- Dey, S.; Bhattacharyya, R.; Sarma, S.E.; Karmakar, N. CA novel “smart skin” sensor for chipless RFID-based structural health monitoring applications. IEEE Internet Things J. 2020, 8, 3955–3971. [Google Scholar] [CrossRef]
- Elsheakh, D.N.; Mohamed, R.A.; Fahmy, O.M.; Ezzat, K.; Eldamak, A.R. Complete breast cancer detection and monitoring system by using microwave textile based antenna sensors. Biosensors 2023, 13, 87. [Google Scholar] [CrossRef]
- Kazemi, N.; Abdolrazzaghi, M.; Musilek, P. Comparative analysis of machine learning techniques for temperature compensation in microwave sensors. IEEE Trans. Microw. Theory Tech. 2021, 69, 4223–4236. [Google Scholar] [CrossRef]
- Song, Z.; Li, M. Ultra-Wideband Circular Polarized Implantable Patch Antenna for Implantable Blood Glucose Detection System Applications. Sensors 2024, 24, 5292. [Google Scholar] [CrossRef] [PubMed]
- Han, X.; Li, X.; Zhou, Y.; Ma, Z.; Peng, P.; Fu, C.; Qiao, L. Microwave sensor loaded with complementary curved ring resonator for material permittivity detection. IEEE Sens. J. 2022, 22, 20456–20463. [Google Scholar] [CrossRef]
- Kazemi, N.; Musilek, P. Enhancing microwave sensor performance with ultrahigh Q features using CycleGAN. IEEE Trans. Microw. Theory Tech. 2022, 70, 5369–5382. [Google Scholar] [CrossRef]
- Rasoulzadeh, A.; Ghobadi, C.; Nourinia, J.; Mohammadi, P. A Highly Sensitive and Compact Size Microstrip Sensor for Characterization of Solid and Liquid Material with Broad Range Permittivity. IEEE Access 2024, 12, 87864–87872. [Google Scholar] [CrossRef]
- Haq, T.; Koziel, S. Inverse modeling and optimization of CSRR-based microwave sensors for industrial applications. IEEE Trans. Microw. Theory Tech. 2022, 70, 4796–4804. [Google Scholar] [CrossRef]
- Wu, W.-J.; Zhao, W.-S.; Wang, D.-W.; Yuan, B.; Wang, G. A dual-mode microstrip sensor for simultaneously extracting complex permittivity and permeability of magnetodielectric samples. Sens. Actuators A Phys. 2023, 349, 114000. [Google Scholar] [CrossRef]
- Aiswarya, S.; Meenu, L.; Menon, K.A.U.; Donelli, M.; Menon, S.K. A Novel Microstrip Sensor Based on Closed Loop Antenna for Adulteration Detection of Liquid Samples. IEEE Sens. J. 2023, 24, 1405–1414. [Google Scholar] [CrossRef]
- Lee, K.M.; Cho, J.; Kim, M. Microstrip-line sensor for the estimation of the fluid level inside a closed metal pipe. IEEE Access 2024, 12, 19983–19992. [Google Scholar] [CrossRef]
- Zhang, N.; Zhang, Z.; Xue, S.; Wang, X.; Wang, T.; Sun, P.; Lu, G. Dual-mode anti-interference humidity detection: Differential microwave sensor based on microstrip circuit. Sens. Actuators B Chem. 2023, 390, 133944. [Google Scholar] [CrossRef]
- Dong, H.; Zhen, C.; Li, X.; Pang, J.; Niu, Y.; Tan, Q.; Xiong, J. Design and testing of miniaturized dual-band microstrip antenna sensor for wireless monitoring of high temperatures. IEEE Sens. J. 2023, 23, 27242–27250. [Google Scholar] [CrossRef]
- Hosseini, A.; Niksan, O.; Kazemi, K.K.; Jain, M.C.; Adhikari, K.K.; Zarifi, M.H. Planar sensing platform based on split ring resonators and microstrip yagi-uda antennas. IEEE Sens. J. 2023, 23, 24428–24437. [Google Scholar] [CrossRef]
- Singh, U.; Ahmed, A.; Mukherjee, J. Microstrip Patch antenna as sensor based on Meta material integrated structures for non-invasive characterization of biological materials. IEEE Sens. J. 2024, 24, 9970–9981. [Google Scholar] [CrossRef]
- Andevari, S.A.; Olvera-Cervantes, J.-L.; Saavedra, C.E. Inclination sensor with a wide angle measurement range using half-wavelength microstrip resonator. IEEE Access 2023, 11, 28699–28705. [Google Scholar] [CrossRef]
- Nitika; Kaur, J.; Khanna, R. Exploration of adulteration in common raw spices using antenna-based sensor. Int. J. Microw. Wirel. Technol. 2023, 15, 1117–1129. [Google Scholar] [CrossRef]
- Wu, W.J.; Wang, G. A modified AMC-based antenna sensor for contactless measurement of complex permittivity. Measurement 2023, 206, 112261. [Google Scholar] [CrossRef]
- Javed, A.; Arif, A.; Zubair, M.; Mehmood, M.Q.; Riaz, K. A low-cost multiple complementary split-ring resonator-based microwave sensor for contactless dielectric characterization of liquids. IEEE Sens. J. 2020, 20, 11326–11334. [Google Scholar] [CrossRef]
- Dutta, D.; Sagar, Y.V.; Sarkar, A. Independently Operational Dual-Band Metamaterial based Smart EM Sensing System for Detection and Quantification of Adulteration in Cooking Oils. IEEE Sens. J. 2024, 24, 33171–33181. [Google Scholar] [CrossRef]
- Yeo, J.; Lee, J.-I. High-sensitivity slot-loaded microstrip patch antenna for sensing microliter-volume liquid chemicals with high relative permittivity and high loss tangent. Sensors 2022, 22, 9748. [Google Scholar] [CrossRef]
- Iqbal, A.; Smida, A.; Saraereh, O.A.; Alsafasfeh, Q.H.; Mallat, N.K.; Lee, B.M. Cylindrical dielectric resonator antenna-based sensors for liquid chemical detection. Sensors 2019, 19, 1200. [Google Scholar] [CrossRef]
- Mohd Bahar, A.A.; Zakaria, Z.; Md Arshad, M.K.; Isa, A.A.; Dasril, Y.; Alahnomi, R.A. Real time microwave biochemical sensor based on circular SIW approach for aqueous dielectric detection. Sci. Rep. 2019, 9, 5467. [Google Scholar] [CrossRef]
- Abdolrazzaghi, M.; Daneshmand, M.; Iyer, A.K. Strongly enhanced sensitivity in planar microwave sensors based on metamaterial coupling. IEEE Trans. Microw. Theory Tech. 2018, 66, 1843–1855. [Google Scholar] [CrossRef]
- Chen, W.-S.; Hsieh, M.-Y. Dielectric constant calculation based on mixture equations of binary composites at microwave frequency. Ceram. Int. 2017, 43, S343–S350. [Google Scholar] [CrossRef]
- Zhu, X.; Guo, W.; Wu, X. Frequency- and Temperature-Dependent Dielectric Properties of Fruit Juices Associated with Pasteurization by Dielectric Heating. J Food Eng 2012, 109, 258–266. [Google Scholar] [CrossRef]


| Sample | R2 | Sensitivity (MHz/mL) |
|---|---|---|
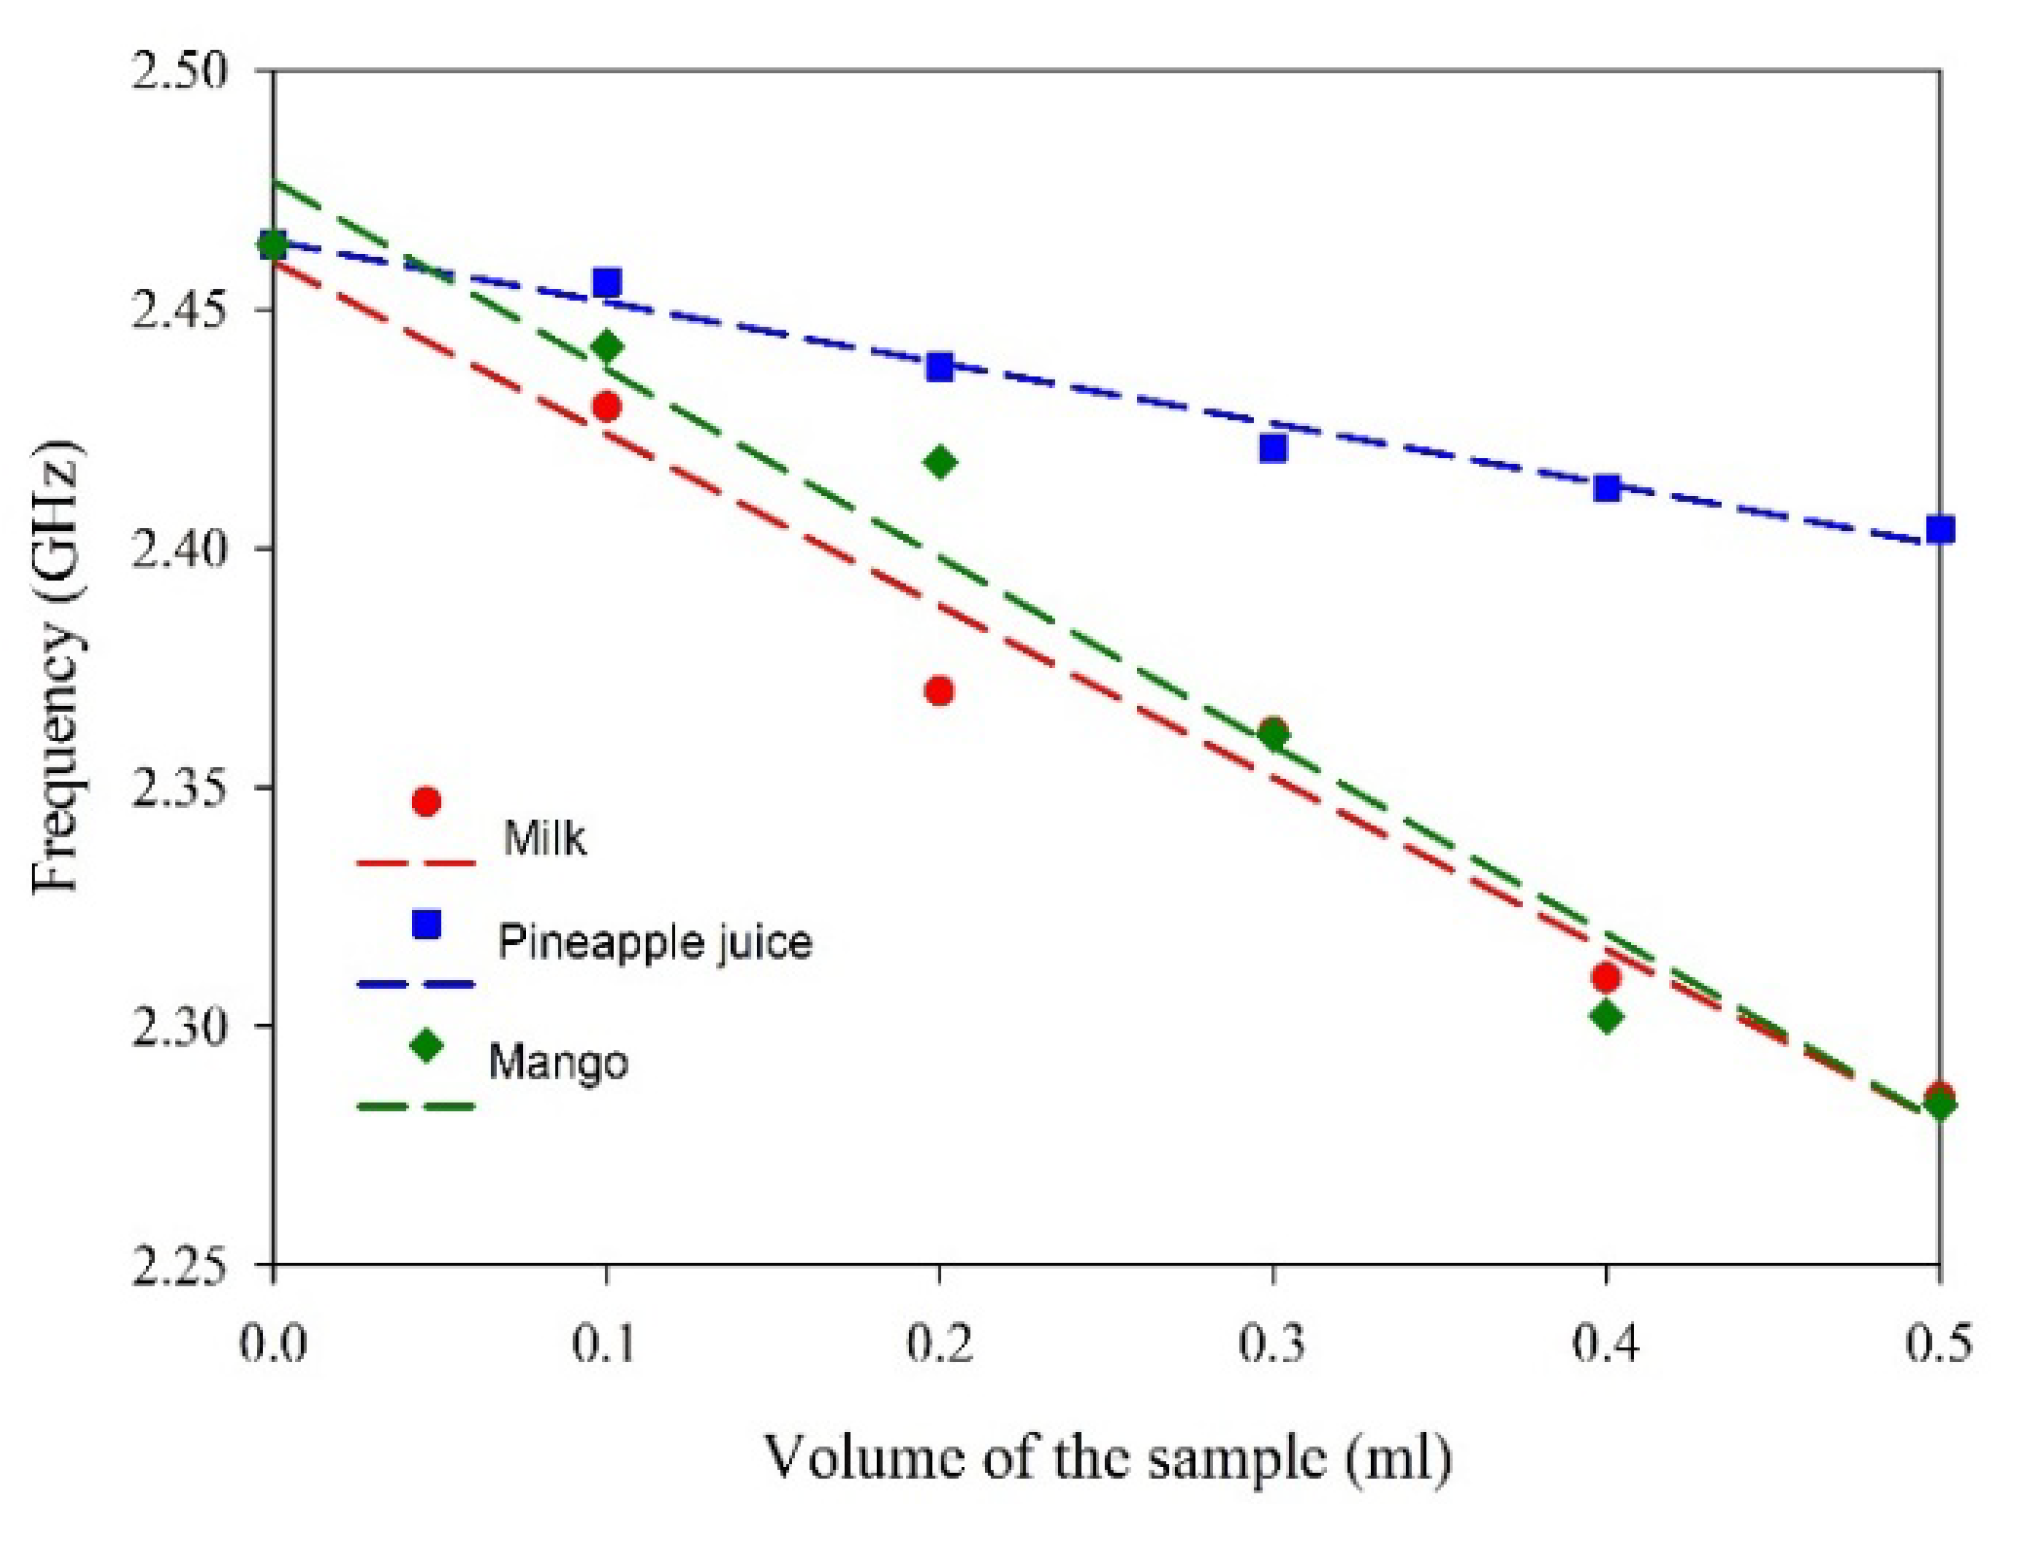
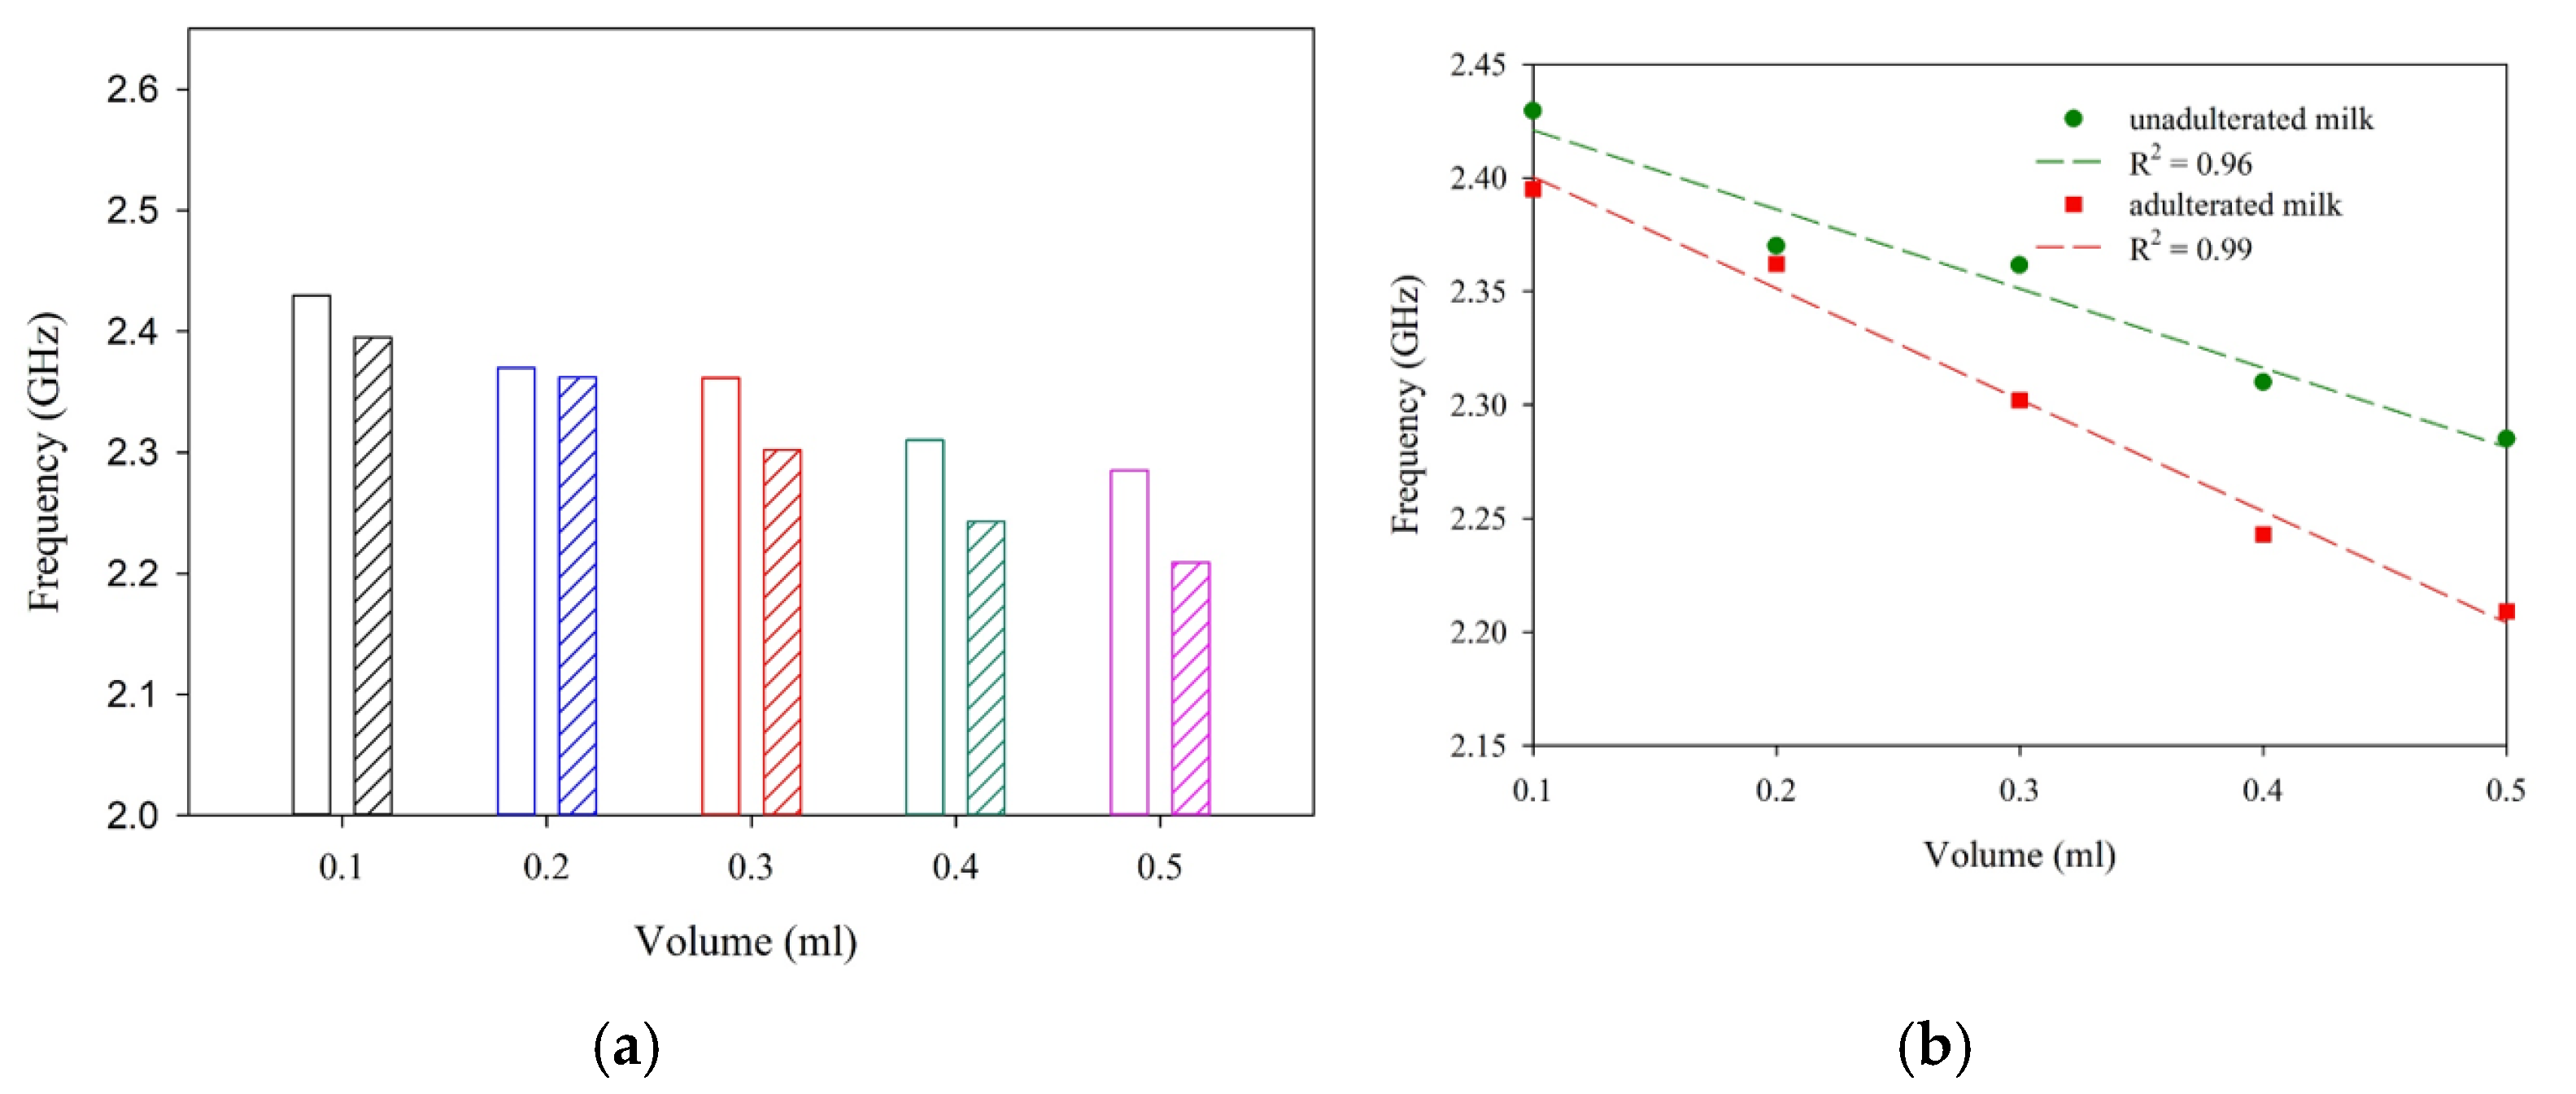
| Milk | 0.96 | −359.9 |
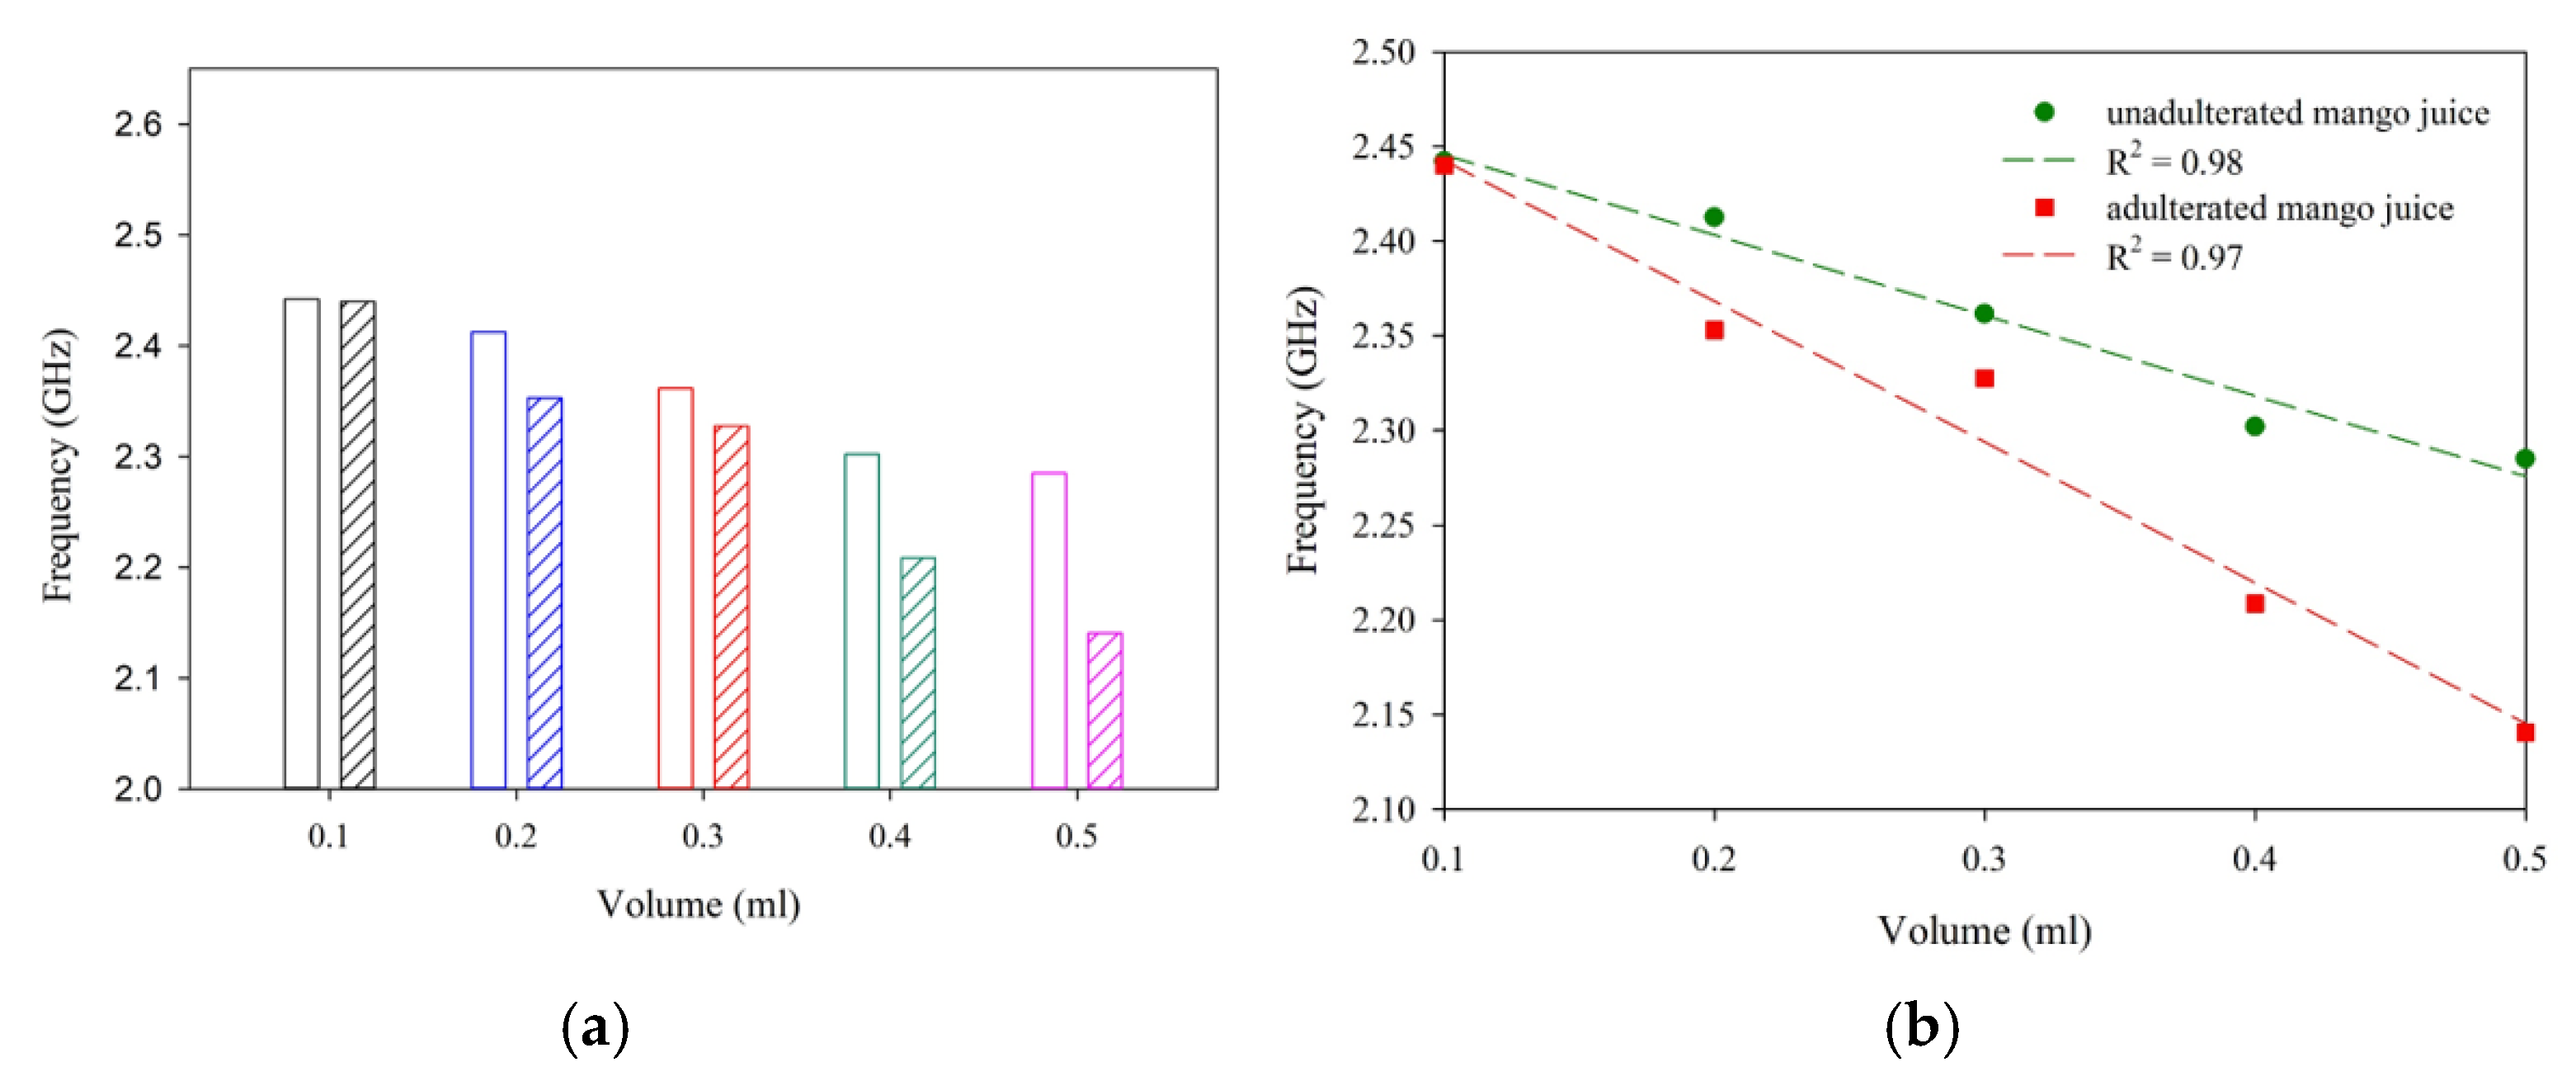
| Mango juice | 0.98 | −393.5 |
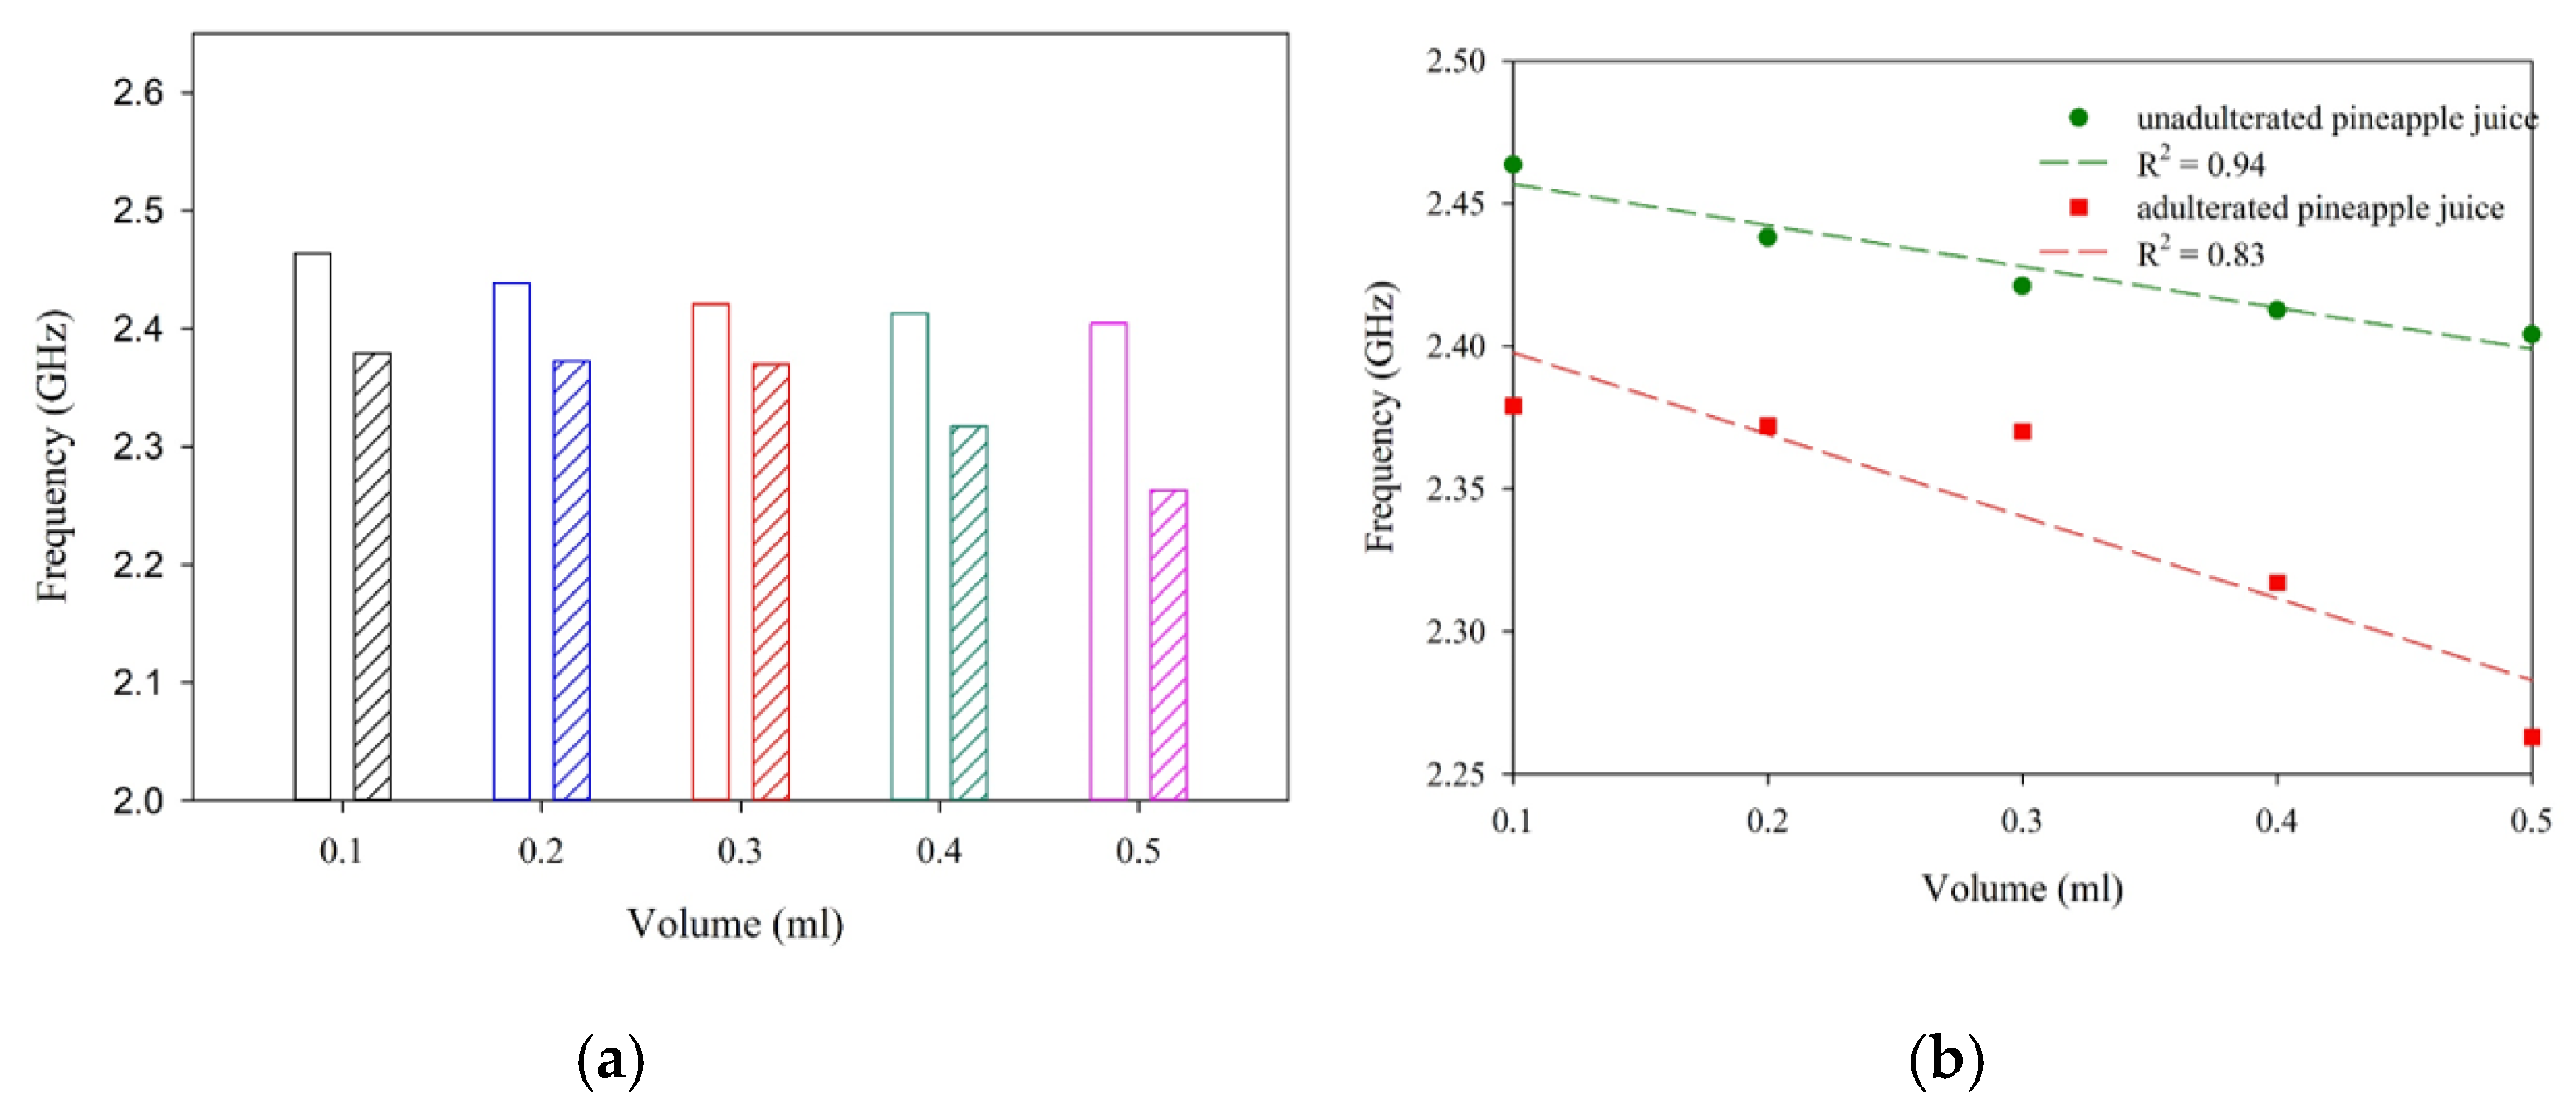
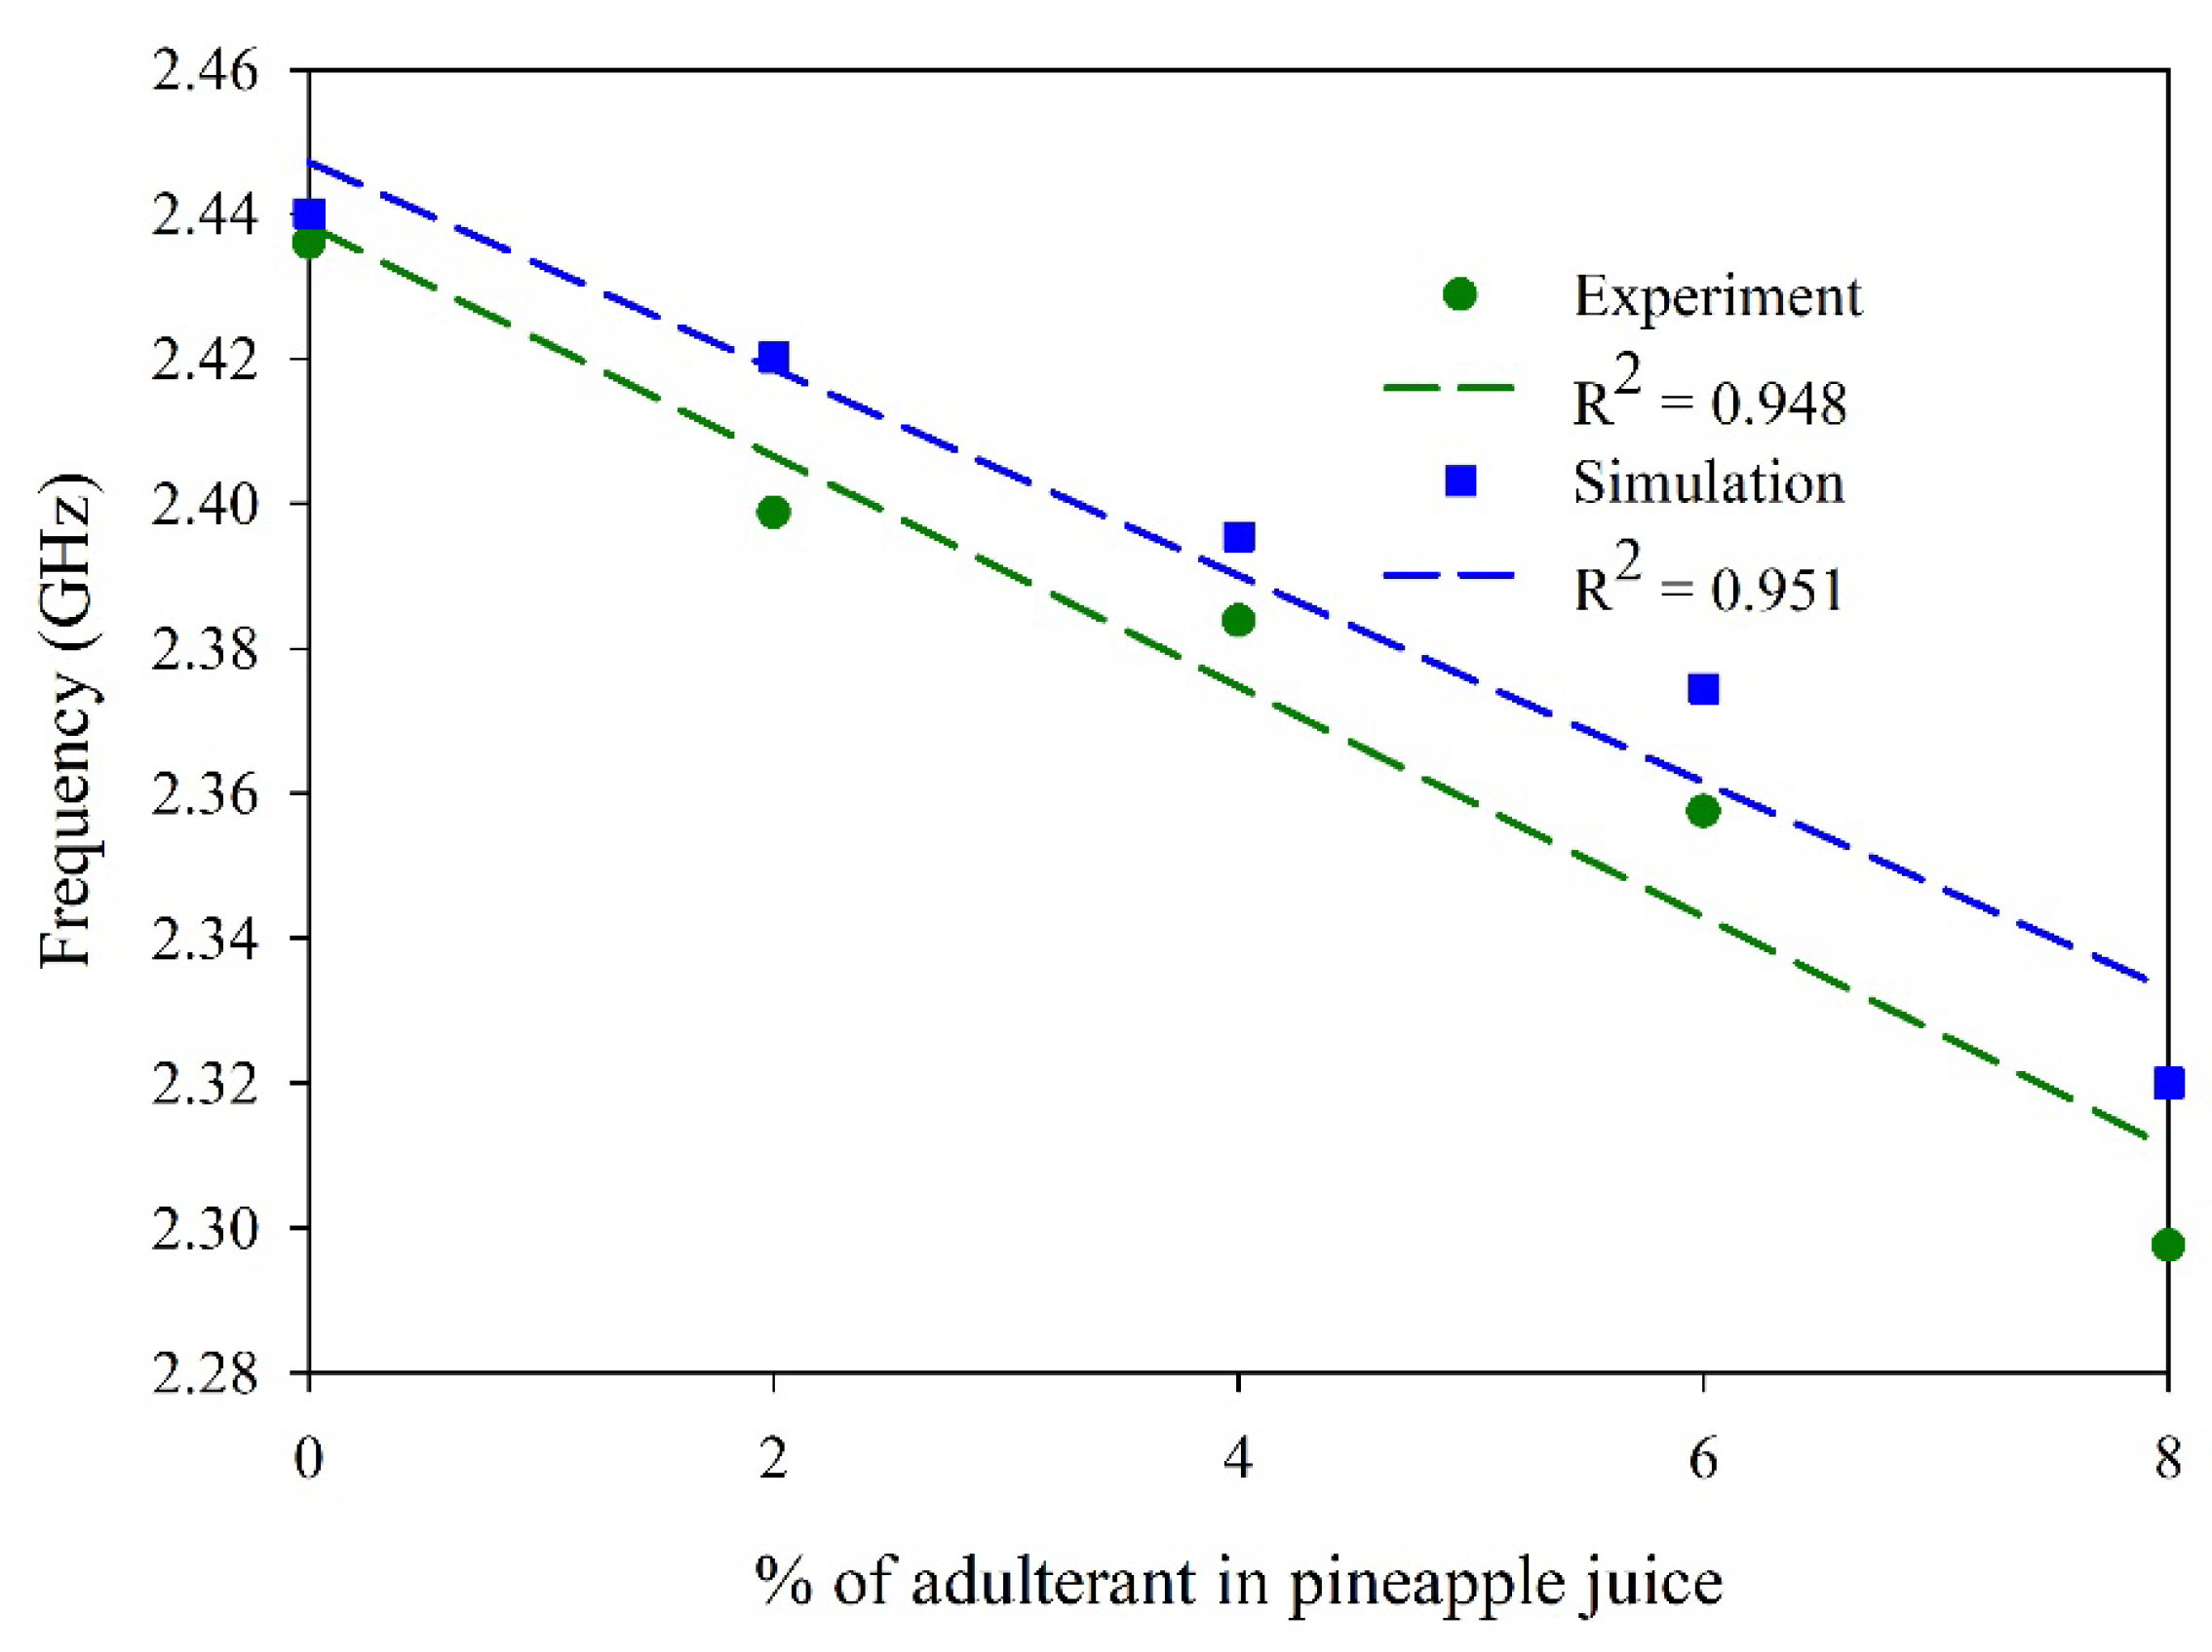
| Pineapple juice | 0.94 | −126.9 |
| Sample | R2 | Sensitivity (MHz/mL) |
|---|---|---|
| Milk with H2O2 (50% each) | 0.99 | −491 |
| Mango juice with H2O2 (50% each) | 0.97 | −766.3 |
| Pineapple juice with H2O2 (50% each) | 0.83 | −287.1 |
| Item | Concentration (%) | Δε | |
|---|---|---|---|
| 0% | 10% H2O2 | ||
| Milk | 57 | 59.72 | 4.77% |
| Pineapple juice | 73.7 | 74.75 | 1.42% |
| Mango juice | 32.5 | 37.67 | 15.9% |
| Sl No | 100% Sample | 98% Sample | 96% Sample | 94% Sample | 92% Sample | 90% Sample | ||
|---|---|---|---|---|---|---|---|---|
| 1 | Total volume (V) | (ml) | 3 | |||||
| 2 | Volume of sample (Vs) | (ml) | 3 | 2.94 | 2.88 | 2.82 | 2.76 | 2.7 |
| 3 | Volume of adulterant (Va) | (ml) | 0 | 0.06 | 0.12 | 0.18 | 0.24 | 0.3 |
| 4 | Volume fraction of sample (Vfs) | 1 | 0.98 | 0.96 | 0.94 | 0.92 | 0.9 | |
| 5 | Volume fraction of adulterant (Vfa) | 0 | 0.02 | 0.04 | 0.06 | 0.08 | 0.1 | |
| 6 | εmix (Pineapple) | 73.7 | 73.91 | 74.12 | 74.33 | 74.54 | 74.75 | |
| 7 | εmix (Milk) | 57 | 57.544 | 58.088 | 58.632 | 59.176 | 59.72 | |
| 8 | εmix (Mango juice) | 32.5 | 33.534 | 34.568 | 35.602 | 36.636 | 37.67 | |
Disclaimer/Publisher’s Note: The statements, opinions and data contained in all publications are solely those of the individual author(s) and contributor(s) and not of MDPI and/or the editor(s). MDPI and/or the editor(s) disclaim responsibility for any injury to people or property resulting from any ideas, methods, instructions or products referred to in the content. |
© 2025 by the authors. Licensee MDPI, Basel, Switzerland. This article is an open access article distributed under the terms and conditions of the Creative Commons Attribution (CC BY) license (https://creativecommons.org/licenses/by/4.0/).
Share and Cite
Menon, S.K.; Donelli, M. L-Shaped Coplanar Strip Dipole Antenna Sensor for Adulteration Detection. Sensors 2025, 25, 506. https://doi.org/10.3390/s25020506
Menon SK, Donelli M. L-Shaped Coplanar Strip Dipole Antenna Sensor for Adulteration Detection. Sensors. 2025; 25(2):506. https://doi.org/10.3390/s25020506
Chicago/Turabian StyleMenon, Sreedevi K., and Massimo Donelli. 2025. "L-Shaped Coplanar Strip Dipole Antenna Sensor for Adulteration Detection" Sensors 25, no. 2: 506. https://doi.org/10.3390/s25020506
APA StyleMenon, S. K., & Donelli, M. (2025). L-Shaped Coplanar Strip Dipole Antenna Sensor for Adulteration Detection. Sensors, 25(2), 506. https://doi.org/10.3390/s25020506