Article

Range Extension of Borehole Strainmeters Using MOSFET-Based Multi-Switch Automatic Zero Setting

1
National Institute of Natural Hazards, Beijing 100085, China
2
School of Emergency Management Science and Engineering, University of Chinese Academy of Sciences, Beijing 100049, China
*
Author to whom correspondence should be addressed.
Sensors 2025, 25(2), 476; https://doi.org/10.3390/s25020476
Submission received: 20 December 2024 / Revised: 9 January 2025 / Accepted: 13 January 2025 / Published: 15 January 2025
(This article belongs to the Special Issue Sensors Technologies for Measurements and Signal Processing)

Abstract

:
Borehole strainmeters are essential tools for observing crustal deformation. In long-term observational applications, the dynamic changes in crustal deformation over multi-year scales often exceed the single measurement range of borehole strainmeters. Expanding the measurement range while maintaining high precision is a critical technical challenge. To address this, a full-range measurement system was developed using a bidirectional analog multi-switch based on MOS transistors and automatic feedback control. This system automatically adjusts the zero point of the measurement bridge, maintaining the bridge output at a near-balanced state. The quantifiable zero-setting actions are dynamically converted into equivalent voltage, enabling automatic full-range measurements while fully utilizing the effective linear range of the differential capacitive sensors. A laboratory performance tests demonstrated that an RZB borehole strainmeter equipped with this automatic zero-setting range extension system successfully covers the differential capacitive sensor’s effective linear range of approximately 100 μm.

1. Instruction

Variations in crustal stress and strain fields are the fundamental drivers of geodynamic processes such as rock layer fractures and earthquakes [1]. Borehole strainmeters play a critical role in crustal deformation monitoring [2,3], with a high-frequency range comparable to that of seismographs [2,4] and a low-frequency range overlapping with the observational capabilities of GPS and InSAR. These attributes make borehole strainmeters ideal for capturing short-term continuous crustal deformation [5,6]. Since the 1980s, countries such as China, the United States, and Japan have implemented borehole strain observation programs [7,8,9,10,11]. As an early adopter, China has developed various borehole strainmeter models, including the RZB, SKZ, and YRY types. Over three decades of advancement, borehole strain observation has become an essential tool in crustal deformation studies [2,3,12], contributing significantly to geophysics, seismology, and geodesy [13].
The four-component borehole strain measurement system typically comprises a strain probe, a host unit, and a means of data acquisition. The strain probe is installed within the borehole, where displacement sensors monitor the deformation of the borehole aperture. The host unit contains the measurement circuits for the sensors and is connected to the downhole probe via cables. The data acquisition system collects and stores the data from sensor measurements, analyzing them to obtain the relative deformation state of the surrounding rock formations and its dynamic evolution [14]. The strain probe usually adopts a steel cylinder casing structure, as shown in Figure 1, and is coupled to the borehole bedrock using cement.
The micro-displacement sensors are evenly distributed inside the steel cylinder at 45° intervals, and fixed at both ends to the inner wall of the casing [15]. When subjected to uniform horizontal principal strains ε1 and ε2 at a distance, the theoretical relative change in the borehole aperture in the direction θ of a given sensor is as follows:
S θ = A ε 1 + ε 2 + B ε 1 ε 2   cos ( θ φ )
Here, θ is the angle of the sensor arrangement, φ is the angle of the maximum principal strain, A and B are related to the effective Young’s modulus and Poisson’s ratio of the cylinder and surrounding rock, and the relative deformation S θ is measured by the sensor. By solving the simultaneous equations from four sensors, the relative deformations in the uniform horizontal principal strains ε1 and ε2, as well as the direction φ, can be determined [16]. The sensors typically comprise a differential capacitive micro-displacement sensor and form a ratio measurement bridge with the ratio transformer in the host unit [17]. Crustal deformation causes displacement of the capacitor plates, generating an unbalanced signal in the bridge. This signal is processed via impedance transformation, AC amplification, phase-sensitive detection, and low-pass filtering, and converted into a voltage representing the displacement of the capacitor plate by an analog-to-digital converter (ADC). This voltage is subsequently used to calculate the strain [3,17].
Due to the need for long-term monitoring, borehole strainmeters must accommodate significant crustal deformation. Large, unbalanced signals from the measurement bridge may exceed the limits of downstream processing circuits, requiring the bridge to be rebalanced, a process known as zero setting [6]. Electrical zero setting is typically achieved by adjusting the transformer tap point to rebalance the bridge, while mechanical zero setting involves physically repositioning the capacitor’s central plate.
Mechanical adjustments allow the bridge to be rebalanced over a broader range, thus expanding the measurement range [18]. However, these adjustments introduce mechanical components that increase the system complexity and risk of failure. In contrast, electrical zero setting uses a multi-tap ratio transformer, which effectively acts as an equivalent transformer with 10,000 tap windings. When the bridge circuit output exceeds the limits of downstream processing, adjusting the transformer tap modifies the voltage division ratio, reestablishing balance.
Using the RZB strainmeter as an example, the measurable effective plate spacing of its differential capacitive sensor is approximately 300 µm. Without mechanical zero setting, the sensor’s total effective linear range in practice is roughly 100 µm, as shown in Figure 2. The displacement of the capacitor plates within this range is considered a single adjustment measurement span, typically about 1 µm, which is significantly smaller than the total sensor range [19]. If the zero setting is not promptly adjusted during measurements, issues such as data discontinuities and breakpoints can arise. Moreover, during periods of rapid crustal deformation, frequent manual adjustments increase the operational workload at observation stations.
In 1984, Gladwin et al. proposed an automatic zero-setting approach using relay switches to control the selection of transformer taps [11]. While relay-based mechanical switches enable lossless signal transmission, they suffer from limitations such as unreliable contacts, slow switching speeds, and low integration. In this study, we present a fully electronic automatic zero-setting measurement system utilizing MOSFET-based multi-switches. This system enables the full-range measurement of the sensor, effectively utilizing the linear range of the capacitive sensor [19]. Additionally, the electronic solution offers advantages including high reliability, high integration, low power consumption, and fast switching.

2. Automatic Zero-Setting Measurement System Design

This paper presents the design of a full-range measurement system for differential capacitive micro-displacement sensors based on the automatic zero setting. As depicted in Figure 3, the system consists of a differential capacitive micro-displacement sensor, a radiometric measurement bridge circuit, a microcontroller-driven MOSFET multi-stage switch array, and a data acquisition and automatic control system. The differential capacitive displacement sensor, combined with the ratio transformer, forms the measurement bridge. When the capacitive plates are displaced, the unbalanced signal generated by the bridge undergoes impedance transformation, amplification, phase-sensitive detection, and low-pass filtering before being captured by the ADC, producing a voltage output proportional to the displacement of the plates.
If the displacement of the capacitive plates exceeds the threshold, the control system automatically selects the appropriate MOS transistor switch to engage the corresponding tap on the ratio transformer. This action realigns the measurement bridge to a near-balanced state. The automatic zero setting operation is quantifiable, and the data acquisition system, in combination with the bridge’s actual output voltage and the quantified zero-setting voltage, calculates an equivalent voltage representing the displacement of the intermediate plates. This process achieves full-range measurement capabilities.

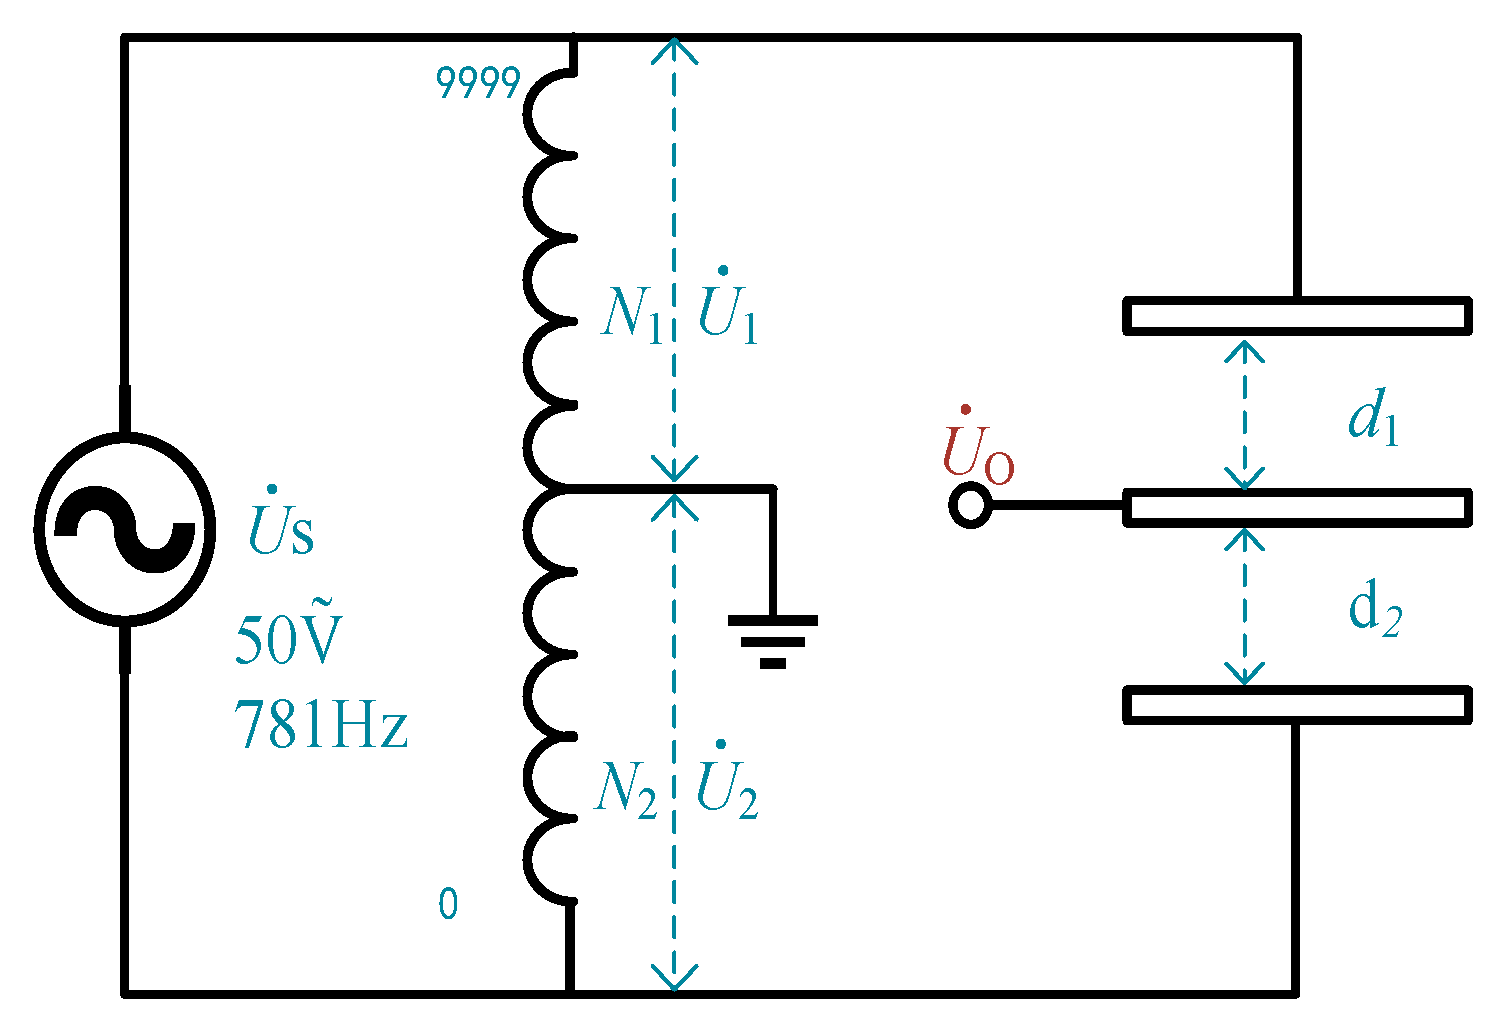
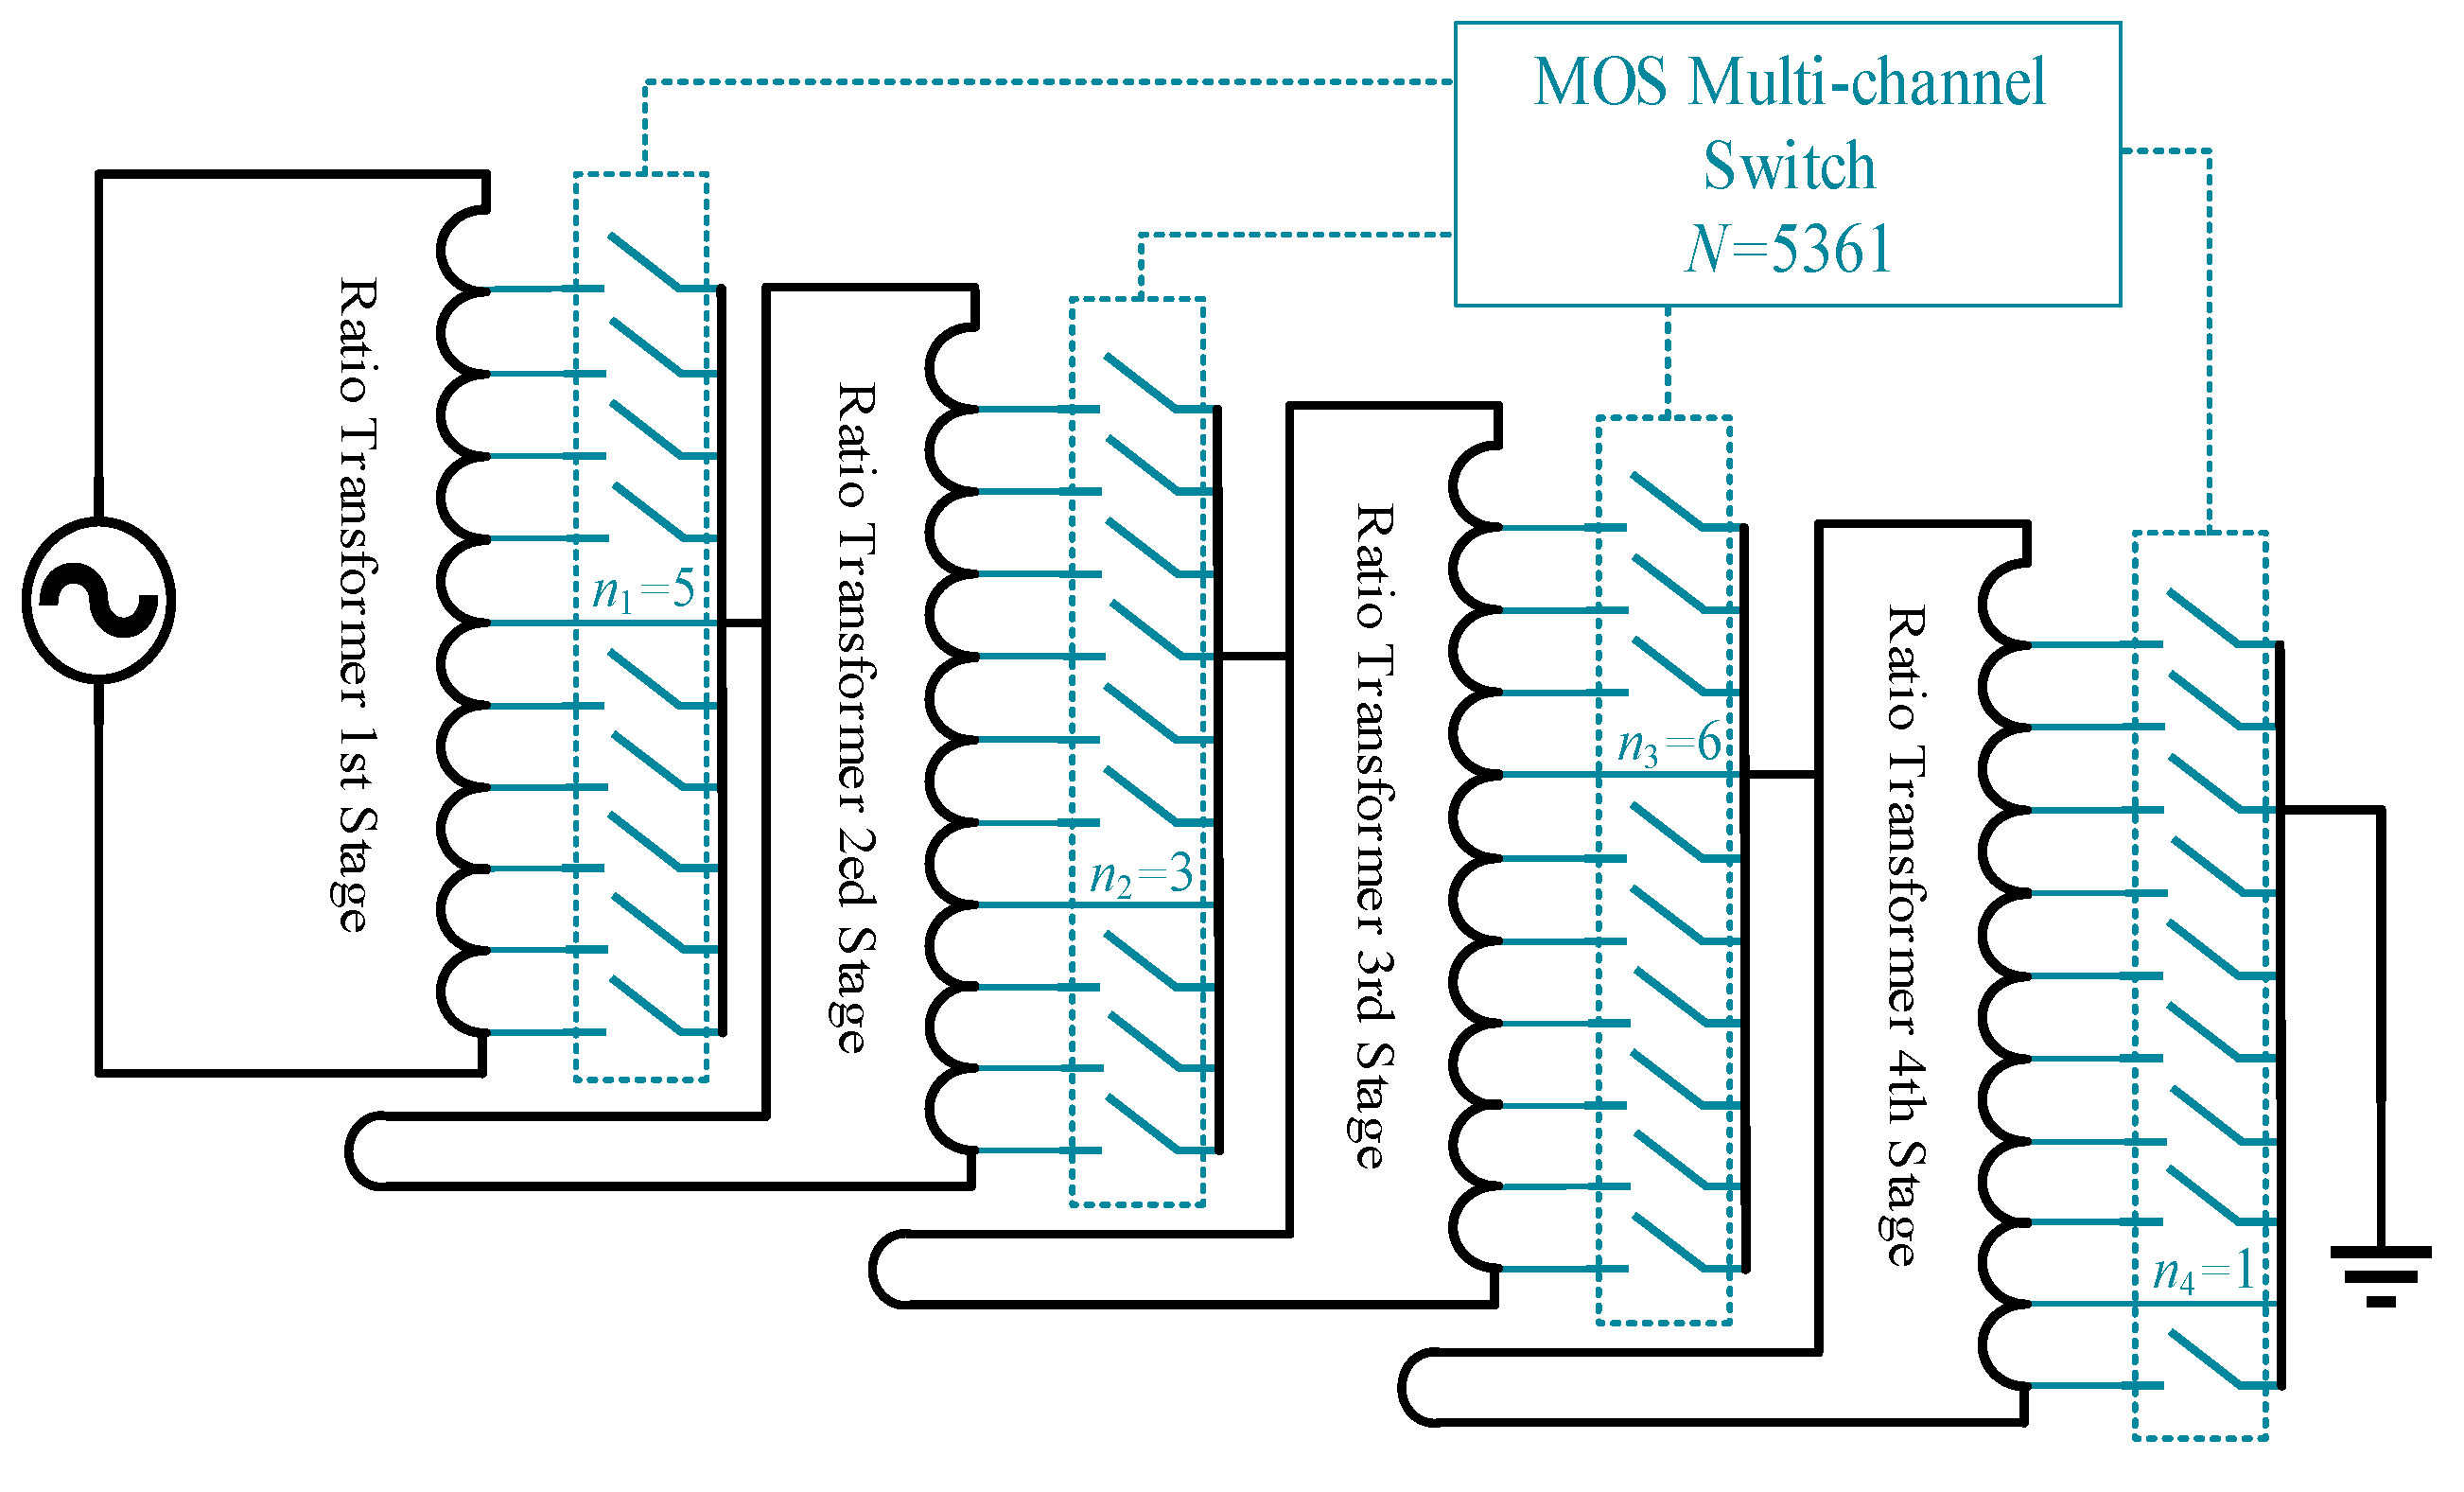
2.1. Principle of Range Extension

Range extension is achieved by dynamically zero-setting the measurement bridge, ensuring that the output voltage of the intermediate plate remains within the circuit and ADC limits. By quantifying the zero-setting process and integrating it with the actual output voltage of the bridge, the system calculates a wide range of equivalent voltage values. This approach removes the limitations imposed by the circuit and ADC range, thus extending the system’s overall measurement range. The measurement bridge comprises a differential capacitive sensor and an equivalent transformer with N turns, as shown in the equivalent circuit diagram in Figure 4.
The differential capacitive micro-displacement sensor includes three capacitive plates: two fixed plates (upper and lower) with a combined physical spacing of d1 + d2 = 0.5 mm and one movable intermediate plate, forming two differential capacitors. The transformer is modeled as having 10,000 turns, divided into two inductances at a variable tap point such that N1 + N2 = 10,000. Together with the differential capacitors, the transformer forms an AC Wheatstone measurement bridge. To improve the output signal’s signal-to-noise ratio and reduce parasitic capacitance interference, the excitation signal’s Us voltage should be maximized and the frequency minimized within feasible limits. In practice, based on long-term practical experience, US is typically selected as a 50 V, 781 Hz AC signal.
The unbalanced signal U ˙ O is output from the intermediate plate of the capacitive sensor to the ground. In the ideally balanced state, the ratio of the gaps between the upper and lower plates, d1/d2, equals the turns ratio of the inductances on either side of the tap point, N1/N2, which is also equal to the voltage division ratio of the bridge, U ˙ 1 / U ˙ 2 . Under these conditions, the bridge output voltage U ˙ O = 0, and the relationship can be expressed as Equation (2):
d 1 d 2 = N 1 N 2 = U ˙ 1 U ˙ 2
When the intermediate plate is displaced by d , it generates an unbalanced voltage signal U ˙ O , which is amplified, phase-sensitively detected, and filtered to obtain the effective voltage value. The ADC collects the final output voltage U O , which is proportional to the displacement d of the intermediate plate. If the displacement d is large, the resulting U ˙ O may exceed the backend circuit’s limits, necessitating a reconfiguration of the transformer’s tap connection. This adjustment modifies the turns ratio of the transformer to (N1 − n)/(N2 + n), restoring the bridge to a near-balanced state.
This zero-setting process is quantifiable, with the voltage change caused by adjusting one coil turn, denoted as UC. The equivalent voltage change, u , due to the intermediate plate’s displacement d is expressed as the sum of the quantified equivalent zero-setting voltage, n U C , and the actual output voltage, U O , after zeroing:
u = n U C + U O
The displacement d is linearly related to u , with S representing the sensitivity of the measurement system.
d = S u

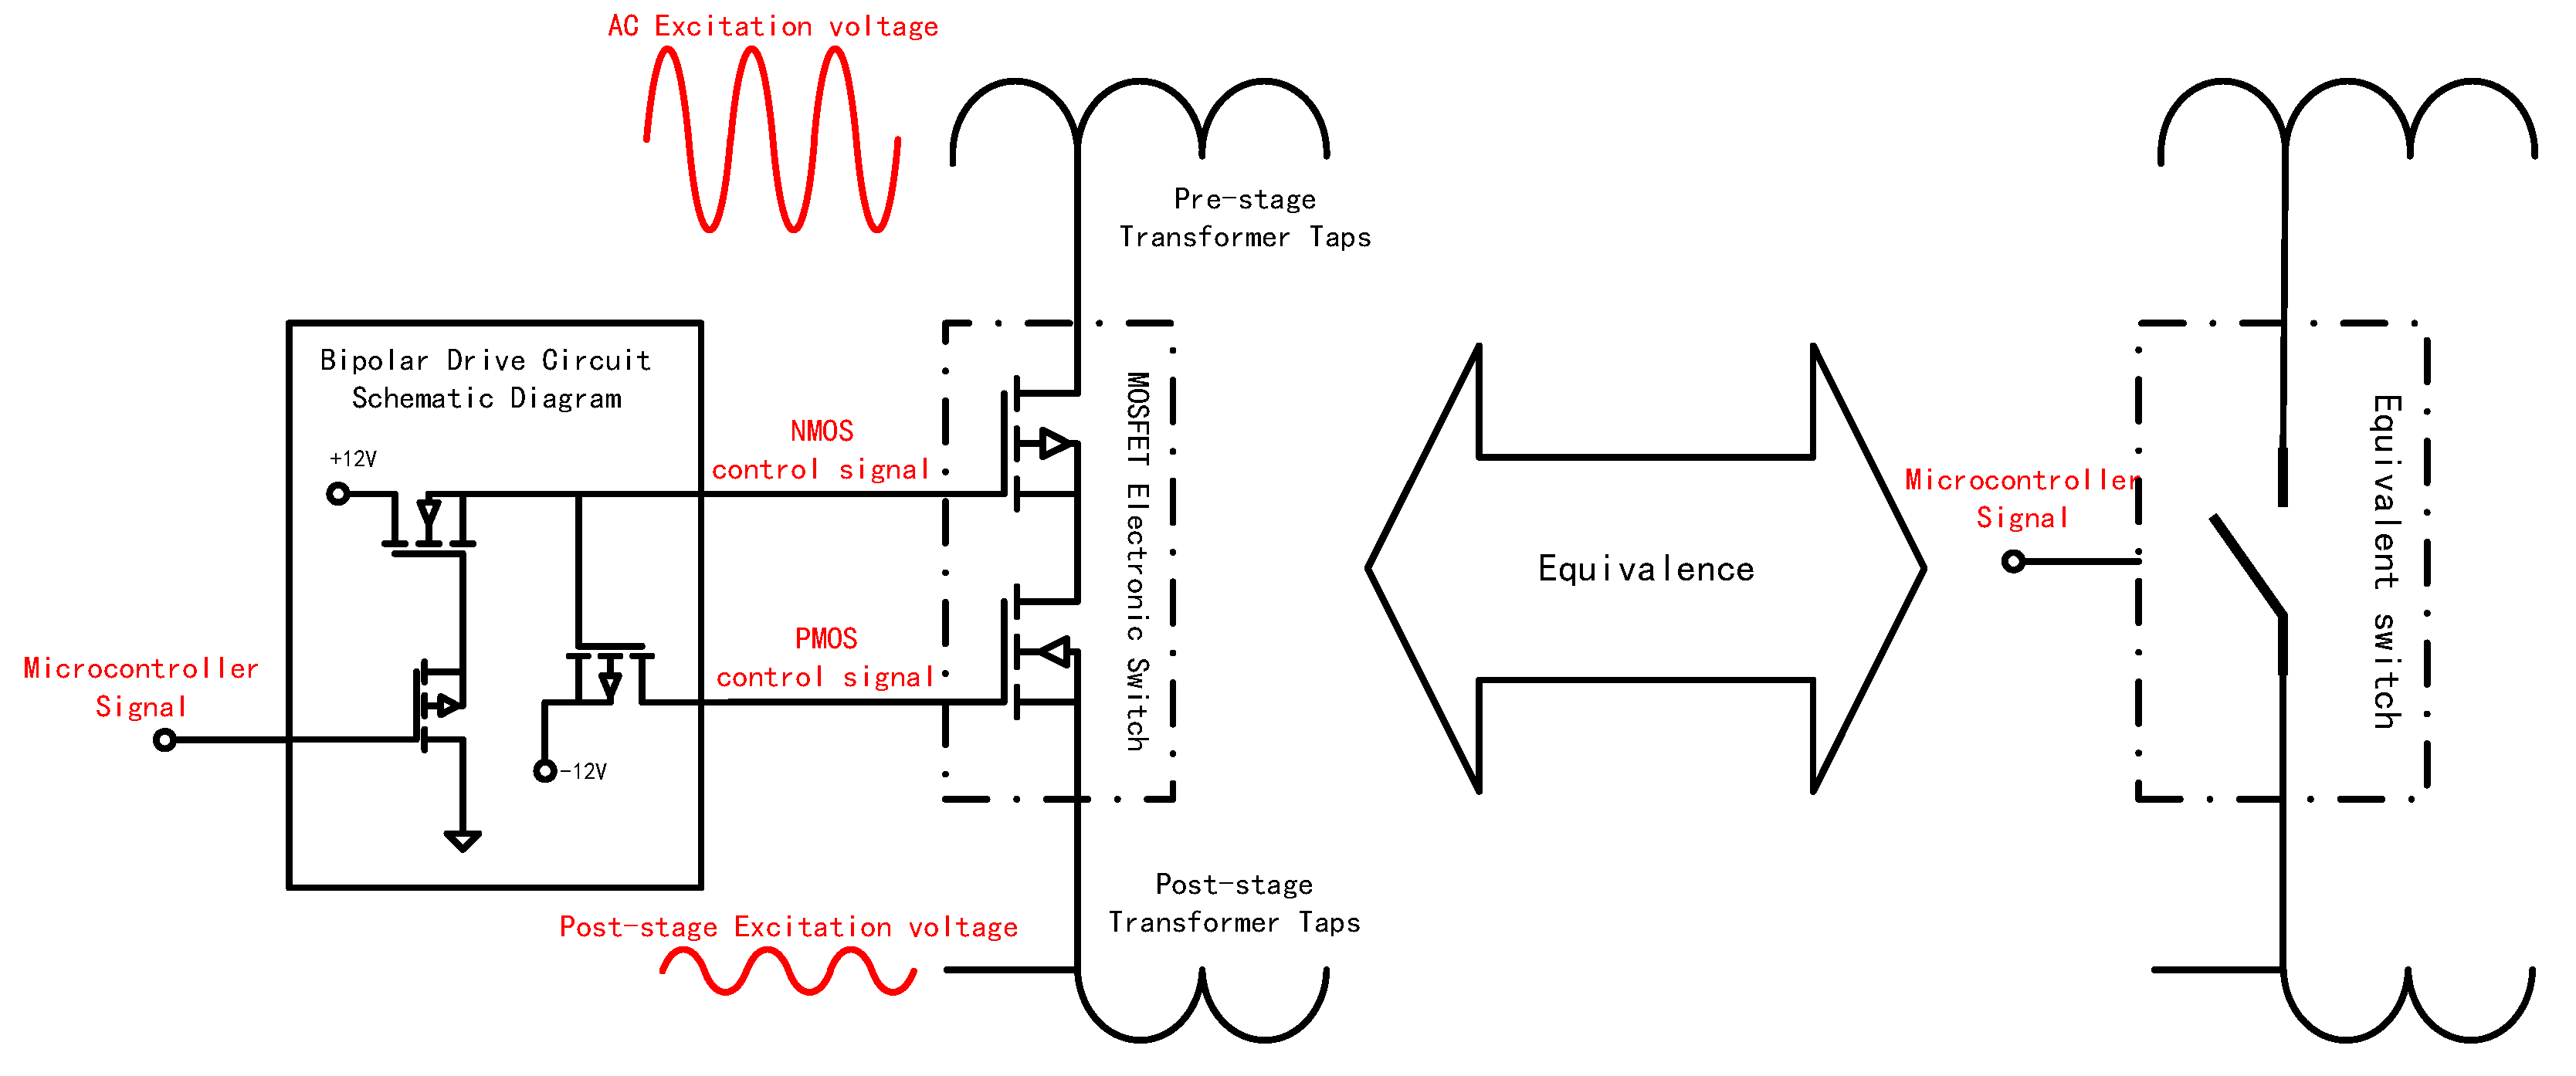
2.2. Design of the MOSFET Multi-Channel Switch

The core of achieving full-range measurements lies in the system’s ability to automatically select the appropriate transformer tap connection point based on voltage variations in the bridge output, thereby automatically zero-setting the measurement bridge. However, manufacturing a transformer with 10,000 individual turns and controlling 10,000 discrete tap levels is extremely challenging. In practical applications, a multi-stage transformer, cascaded to form a ratio transformer, is commonly used as an equivalent substitute. The structure, illustrated in Figure 5, consists of four stages of 10-turn transformers arranged in cascade. The excitation signal decreases by a factor of 1/10 for each stage. Each stage’s transformer connects to the next through a multi-switch array that selects different taps, ultimately achieving a voltage division accuracy of 0–9999/10,000, equivalent to the voltage division effect of a 10,000-tap transformer. The serial number of the tap connection point N corresponds to the number of turns N2 described in Section 2.1 and can be expressed as N = n1 × 1000 + n2 × 100 + n3 × 10 + n4, where n1 to n4 represent the selected taps at each stage.
This study designs a bidirectional electronic switch array, controllable via a microprocessor. The switch array consists of 10 electronic switches per group, with four groups installed at the positions indicated in Figure 5, to select the taps of the ratio transformer at various stages. The structure of a single switch is shown in Figure 6, comprising a series connection of NMOS and PMOS transistors configured head-to-tail alongside a driving circuit. The drain of the NMOS transistor connects to the tap of the previous transformer stage, while the source of the PMOS transistor connects to the next transformer stage. This configuration functions equivalently to the controllable switch structure depicted on the right side of Figure 6.
The measurement bridges of strainmeters typically use ±50 V or higher AC signals as the excitation source. Consequently, the source terminals of the MOS transistors must withstand voltage fluctuations of at least ±5 V. To prevent unintentional conduction of the electronic switches, this paper implements a bipolar saturation drive control method. When the microcontroller outputs a low-level signal, the bipolar drive circuit applies −12 V to the gate of the NMOS transistor and +12 V to the gate of the PMOS transistor. Despite source voltage fluctuations, both MOS switches maintain the correct Vgs bias, ensuring they remain in the off state. Under these conditions, the NMOS transistor blocks the positive half-cycle of the AC excitation signal, and the PMOS transistor blocks the negative half-cycle, effectively disconnecting the tap from the subsequent transformer stage. Conversely, when the microcontroller outputs a high-level signal, the drive circuit applies +12 V to the gate of the NMOS transistor and −12 V to the gate of the PMOS transistor, ensuring proper Vgs bias. Both MOS transistors conduct simultaneously, selecting the tap and connecting it to the next transformer stage.

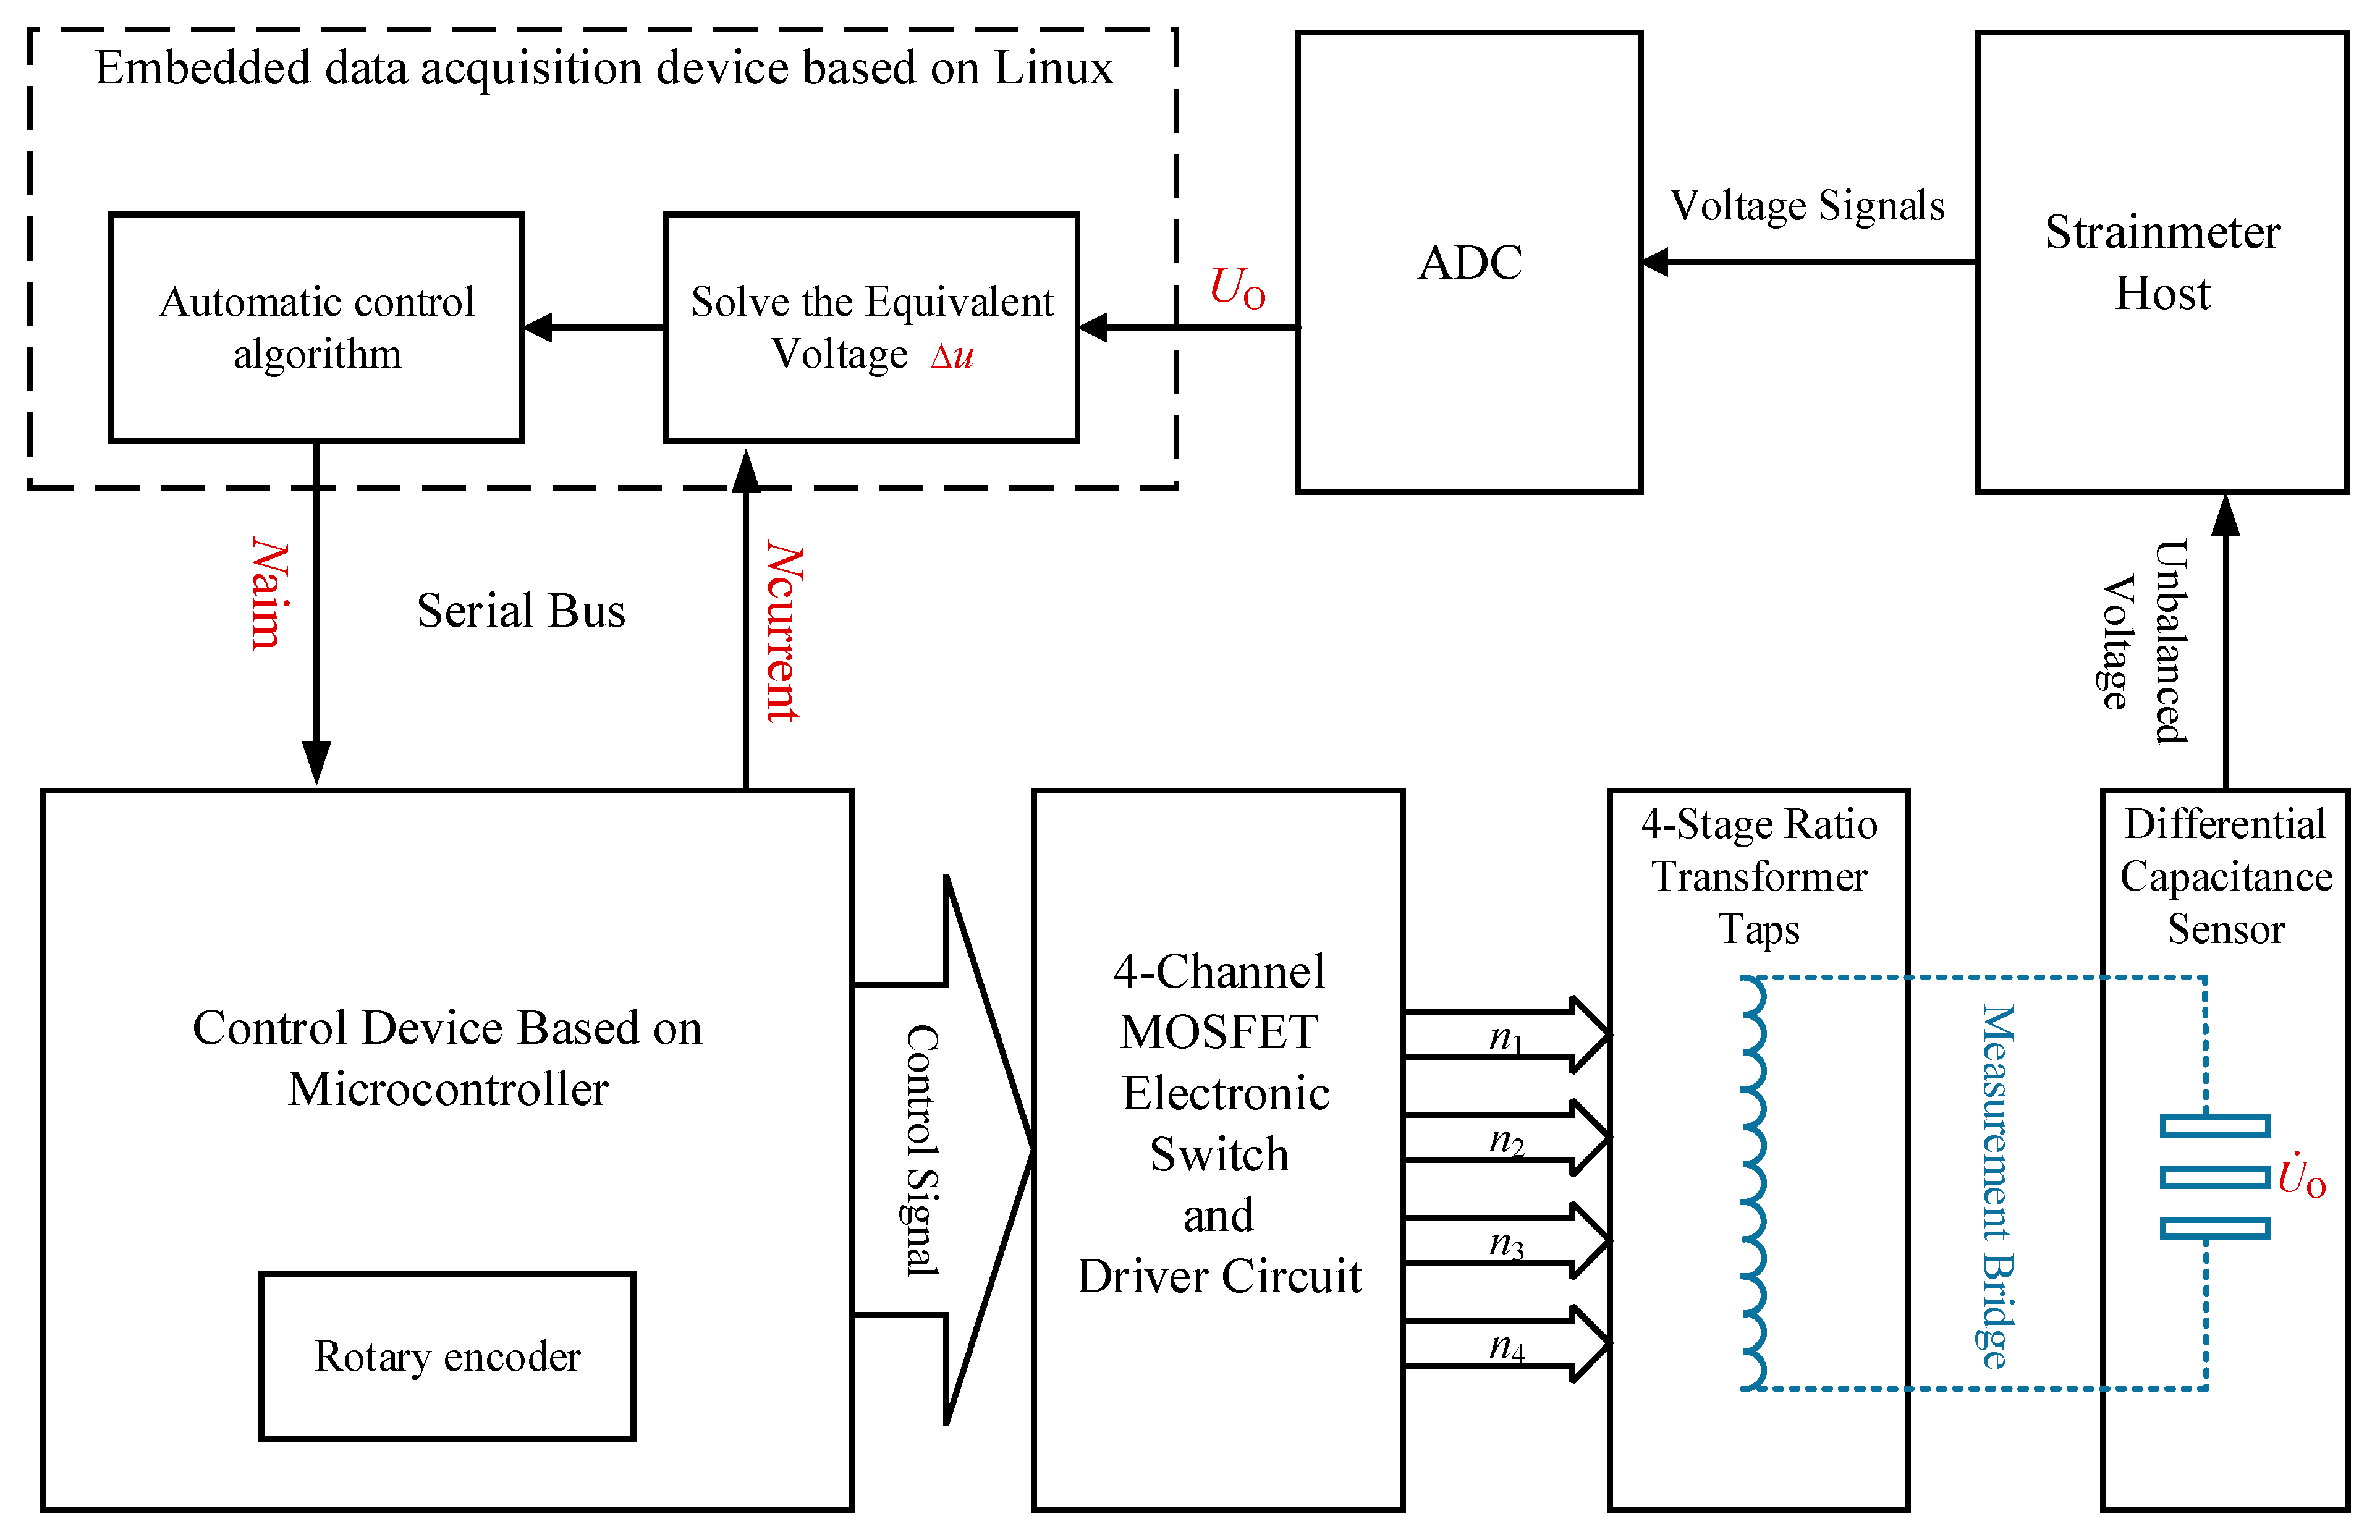
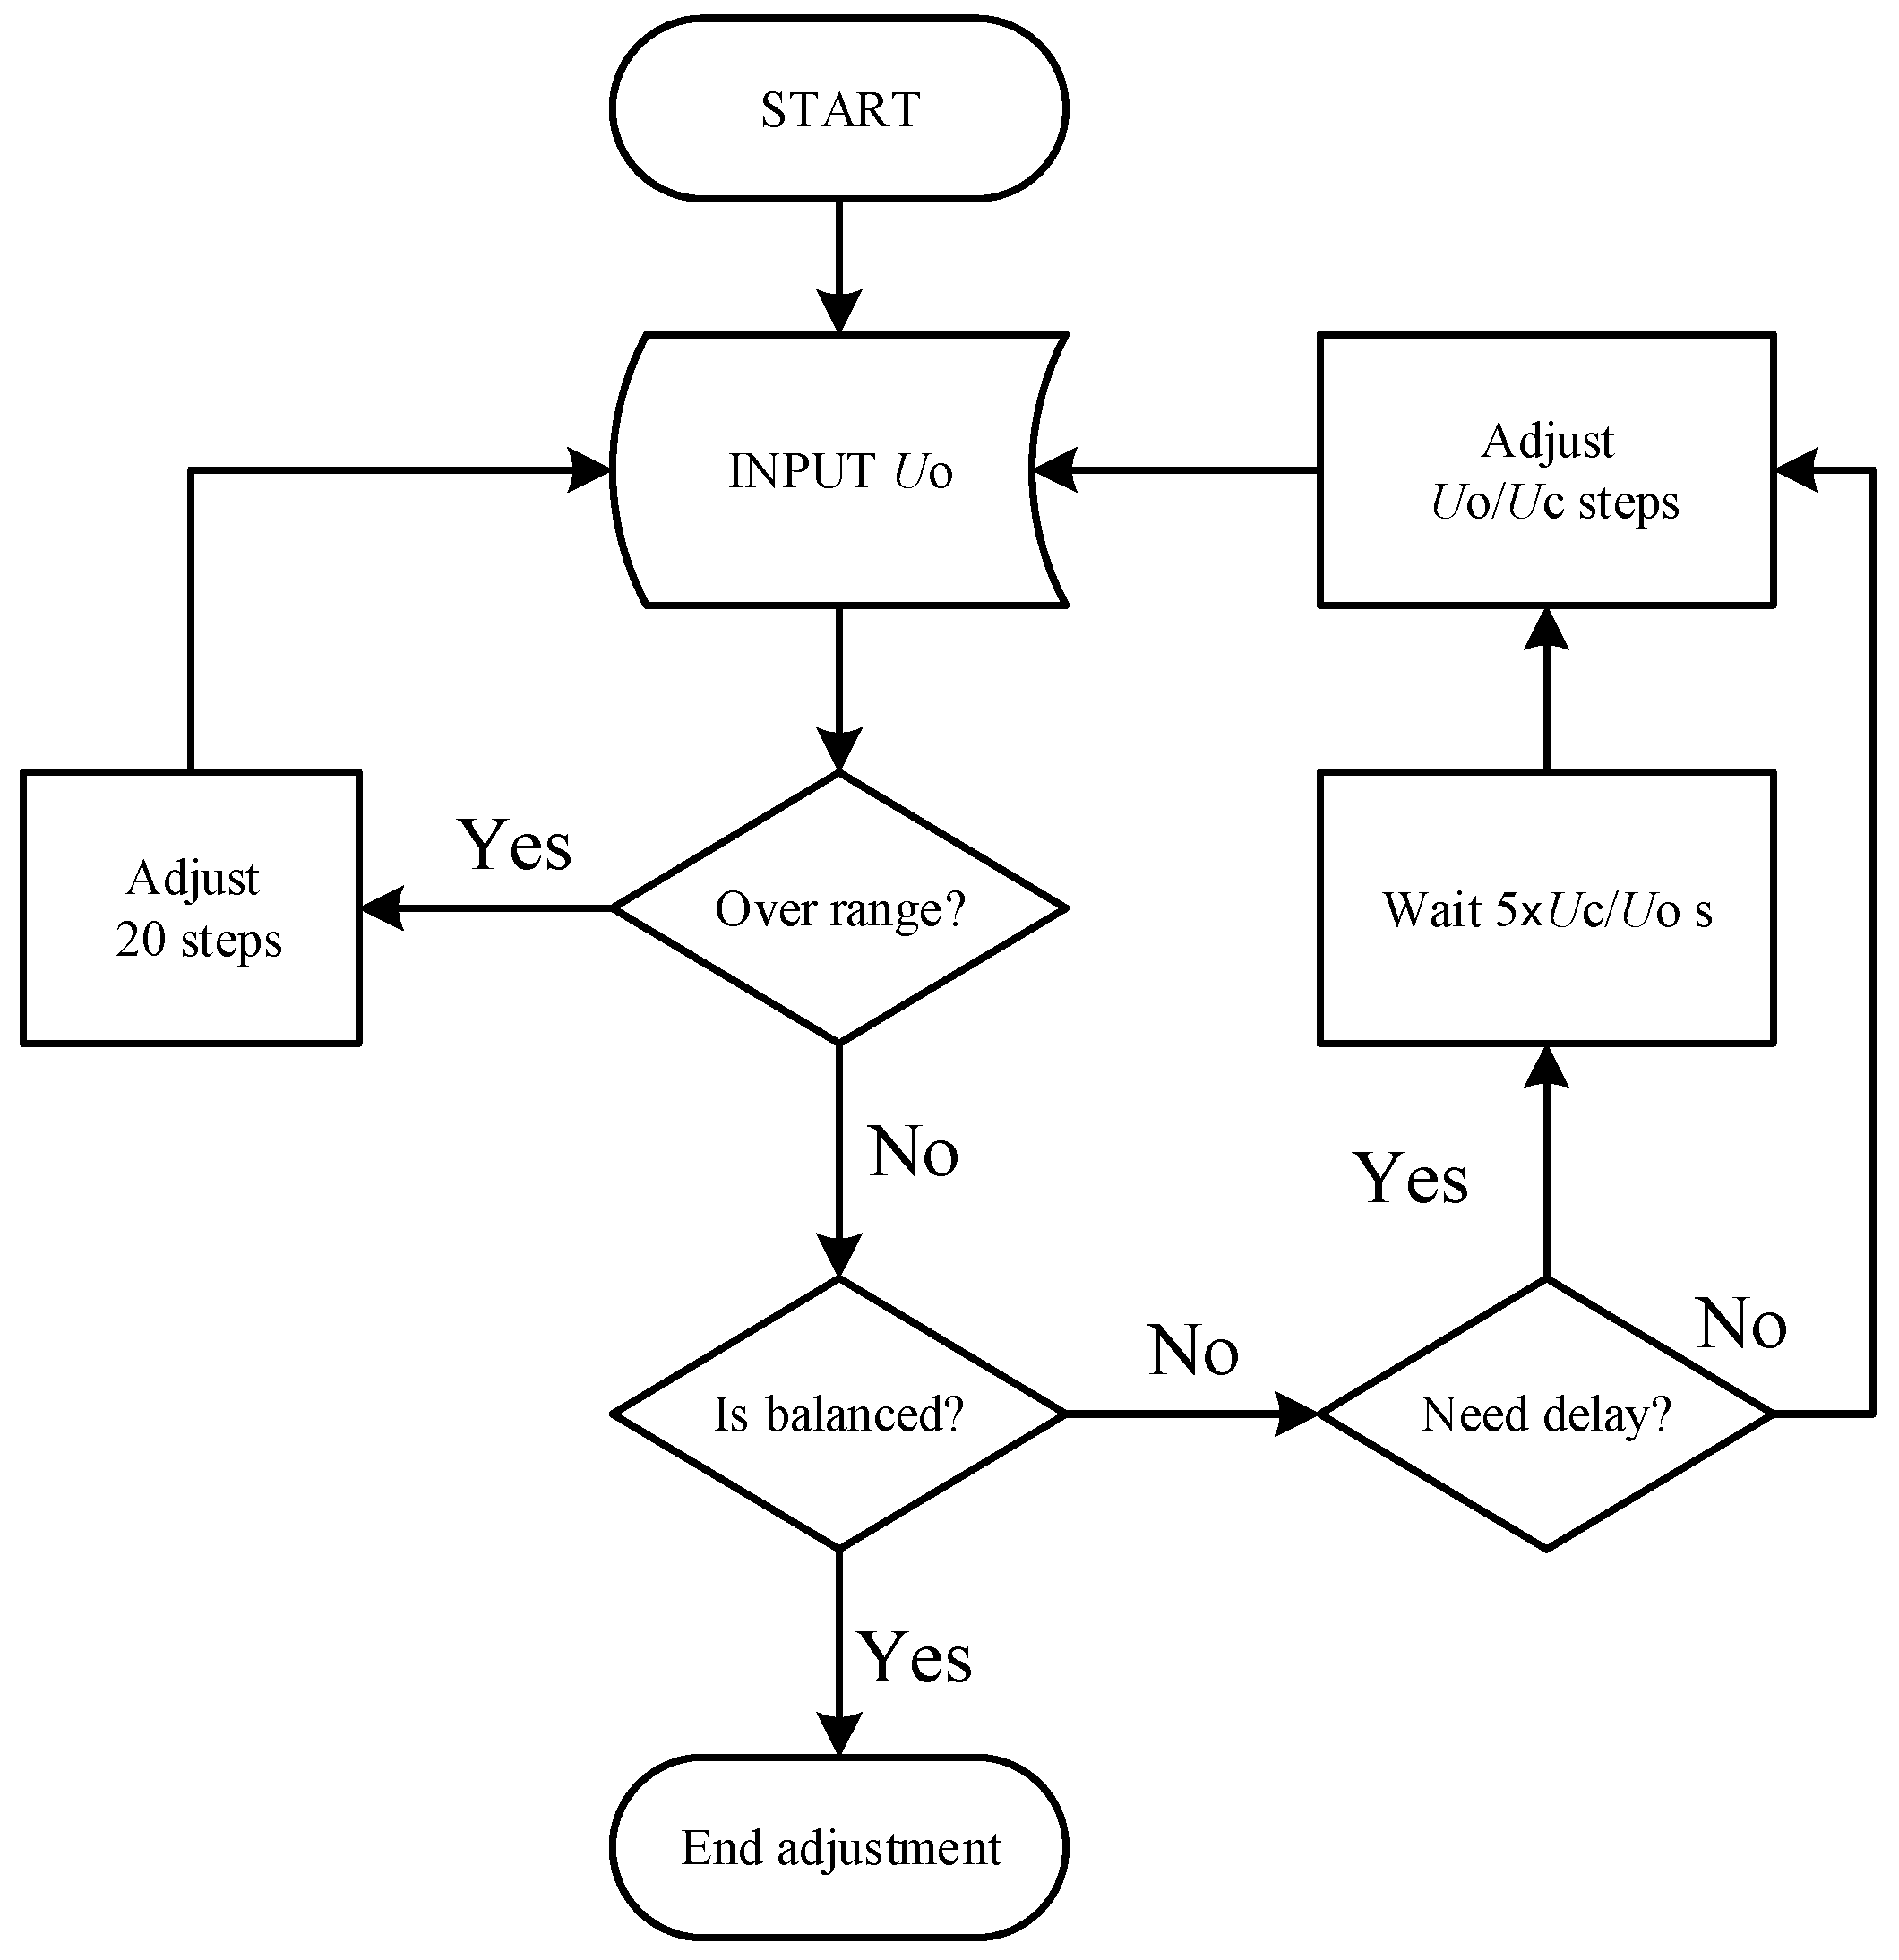
2.3. Design of the Automatic Zero-Setting Control System

The automatic zero-setting control system consists of two main components: the upper computer and the lower computer, which communicate via a bus. The primary function of the lower computer is to manage the switch array and select the specified tap connection point of the ratio transformer. The primary function of the upper computer is to calculate the real-time position of the sensor’s plate and the appropriate tap positions, N, by monitoring feedback from the sensor’s output voltage, UO, and maintaining the measurement bridge in a near-balanced state by commanding the lower computer. The workflow is shown in Figure 7.
The lower computer, which is built on the microcontroller, sends the control signals to drive four groups of 10 electronic switch arrays, selecting the tap connection point N based on a command from the upper computer. The method use to connect the switch array and the ratio transformer is shown in Figure 5 in Section 2.2. While the measurement bridge maintained a near-balanced state, the voltage signal output from the sensor was processed by the strain host circuit and then collected by the ADC as the signal UO, which is transmitted to the upper computer.
The upper computer, which is an ARM-based Linux embedded system, calculates the equivalent voltage representing the sensor’s displacement in real-time using the current N value and UO, based on Equation (3) in Section 2.1. If the input imbalance voltage UO exceeds the preset zero-setting threshold, the automatic control algorithm calculates the target tap serial number N a i m , as given in Equation (5), and sends commands to the lower computer through a delay control algorithm to adjust the tap of the ratio transformer to the target value, thereby rebalancing the bridge.
N a i m = N c u r r e n t + U O U C
Here,   N c u r r e n t represents the current tap serial number, UO is the feedback voltage from the ADC, and UC is the voltage change caused by a single change in the transformer tap, as described in Equation (3) from Section 2.1. The ratio UO/UC determines the adjustment step size. For instance, if UC = 150 mV and UO = 1500 mV, adjusting N by 10 steps will bring the measurement bridge back to a balanced state. In this system, the maximum ADC output UO is ±1500 mV; when UO exceeds the circuit range, the ADC outputs the maximum value, making it impossible for the system to accurately calculate the required adjustment step for the zero-setting. At this time, continuous adjustments are needed until it falls back within the required range. To prevent the adjustments from exceeding the measurement range, the system sets a maximum adjustment step size of approximately 20 coil turns.
Due to the filtering circuits, a stabilization period is required after each adjustment, introducing a delay in bridge control. To ensure rapid and precise zeroing without oscillation when the ADC output exceeds its range, the system incorporates a delay control algorithm that dynamically adjusts the adjustment frequency between 0.5 and 5 s. The flowchart of the delay control algorithm is shown in Figure 8.
When the input signal UO exceeds the maximum range, the system adjusts the tap connection point with the largest step size and fastest frequency. Once the signal returns within the range, the system reduces the step size and dynamically adapts the stabilization time based on the adjustment’s magnitude. This design enables the system to rapidly zero the bridge, achieving an adjustment speed of up to 20 steps per second. For smaller adjustments, the bridge can reach a balanced state within 1–2 steps.
Step changes with varying magnitudes can be applied to the sensor’s plate to simulate the significant crustal deformation that accumulates over the long-term operation of the measurement system. The zero-setting process and resulting measurement curves are illustrated in Figure 9.
The left graph shows the measurement curve for a single measurement range when the plate undergoes a step change of 0.6 μm at 0 s. Due to the filtering circuits, the system stabilizes after approximately 12 s. In this scenario, the voltage does not exceed the zero-setting threshold and the automatic zero setting is not triggered. The right graph illustrates the measurement curves for plate displacements of 2 μm, 11 μm, and 21 μm. After the ADC output voltage exceeds the zero-setting threshold, the system rapidly zeroes the bridge, quantifying the zero-setting process as the equivalent voltage output and recording the complete measurement curve. The system achieves a dynamic range equivalent to 100 V. At t1 = 28 s, the zero-setting time for a 2 μm step change is recorded. Similarly, t2 = 42 s corresponds to an 11 μm step change, and t3 = 58 s corresponds to a 21 μm step change. These results demonstrate that the system responds quickly and can zero step changes within 20 μm in under 1 min.

3. Experiments and Testing

3.1. Experimental Platform Introduction

The experimental platform consists of three main components—the sensor, the RZB strainmeter host, and the automatic control and data acquisition system—as shown in Figure 10. The differential capacitive sensor is fixed on a micromotion measurement table, which applies displacements with an accuracy of 0.1 µm. The RZB strainmeter host is connected to the sensor via a cable and includes a ratio transformer, AC amplification, phase-sensitive detection, and low-pass filtering circuits, together with an excitation generation circuit. An electronic switch array is installed within the RZB strainmeter host, replacing the original mechanical dial-switch. The automatic zero-setting control system is integrated with the ADC in the data acquisition system, enabling communication with the host via a digital bus. The entire experimental setup is placed on a seismic isolation test platform.

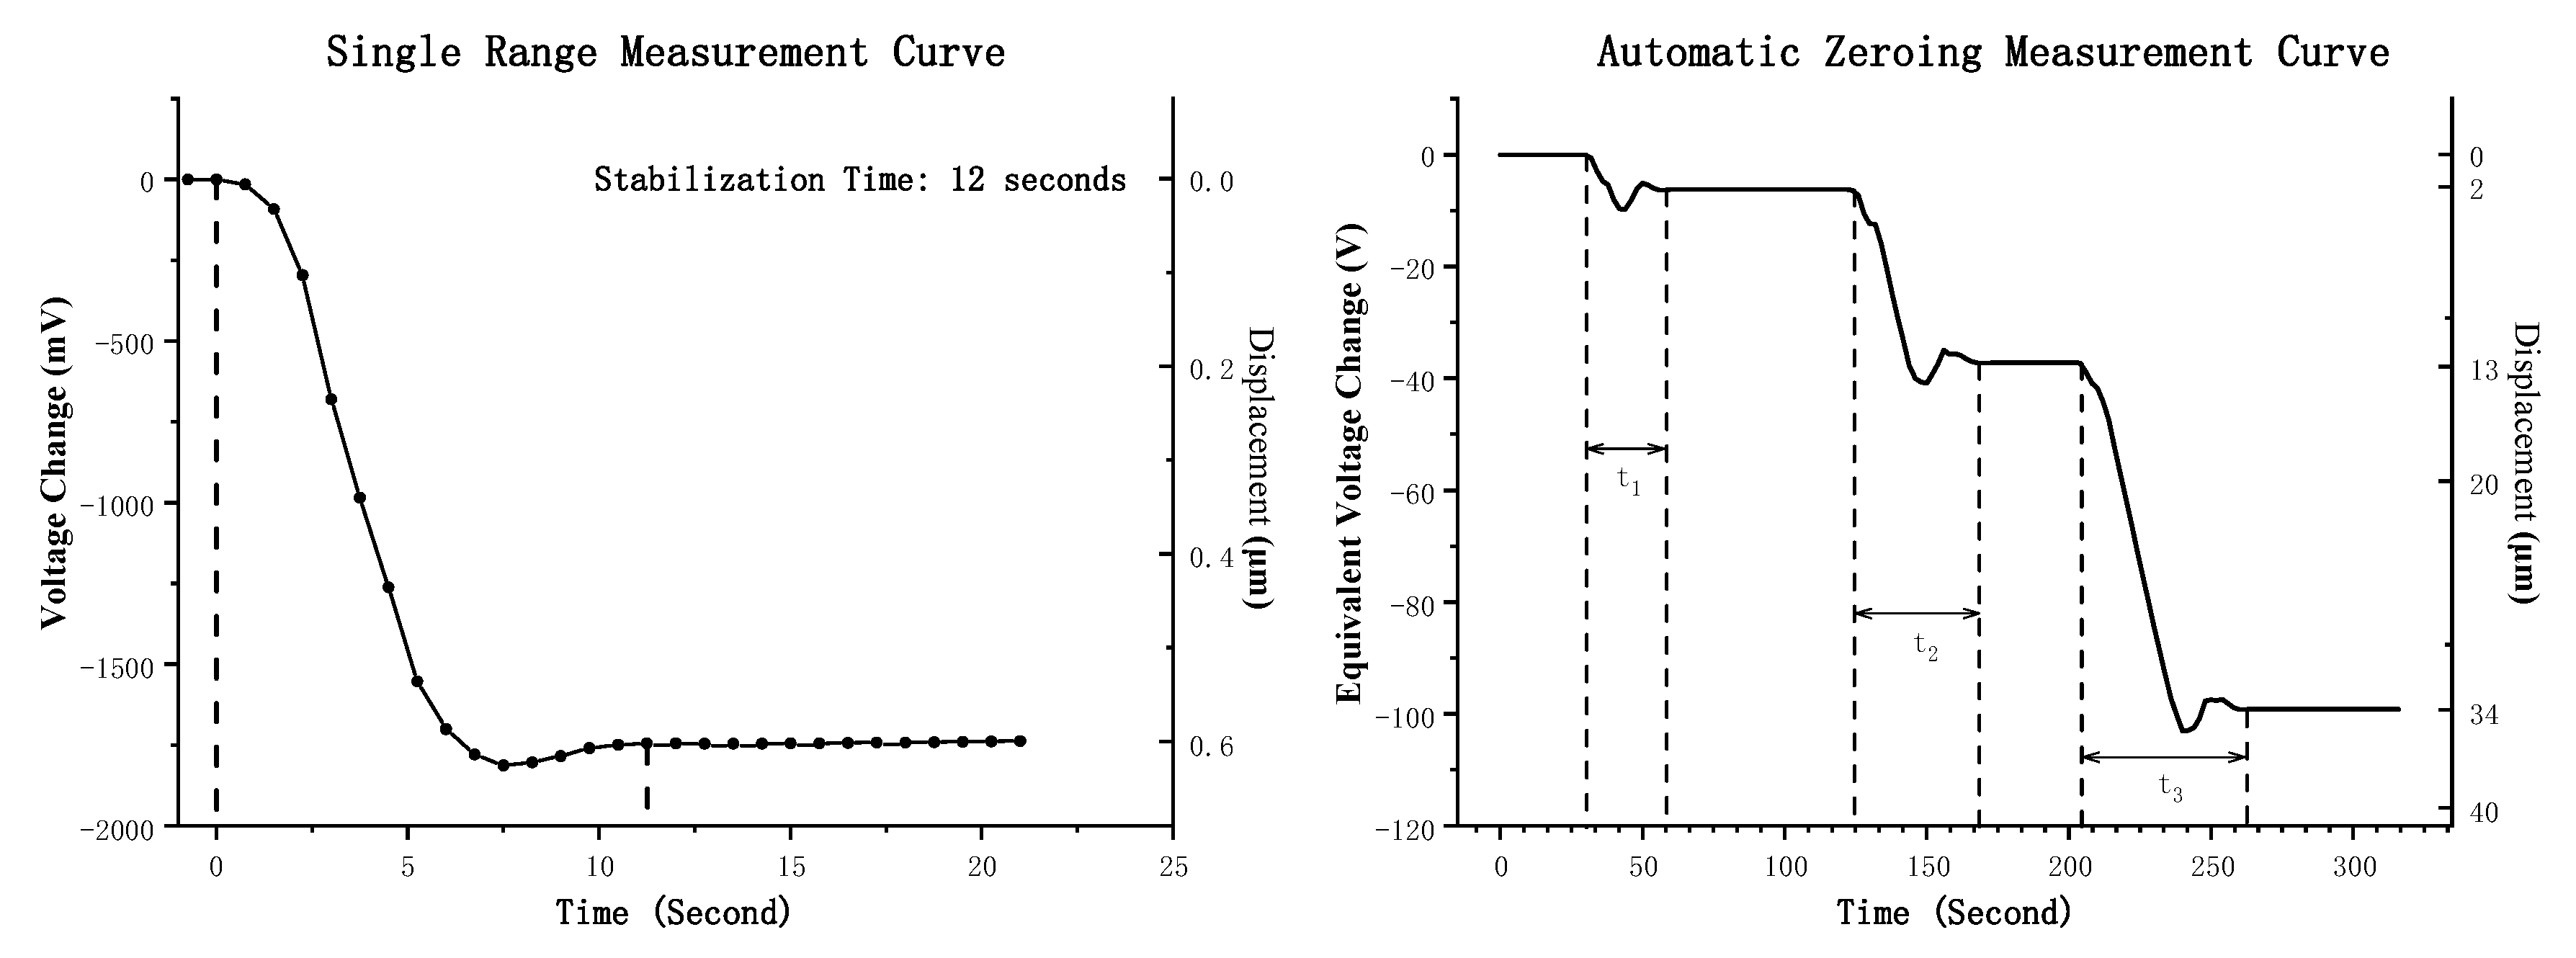
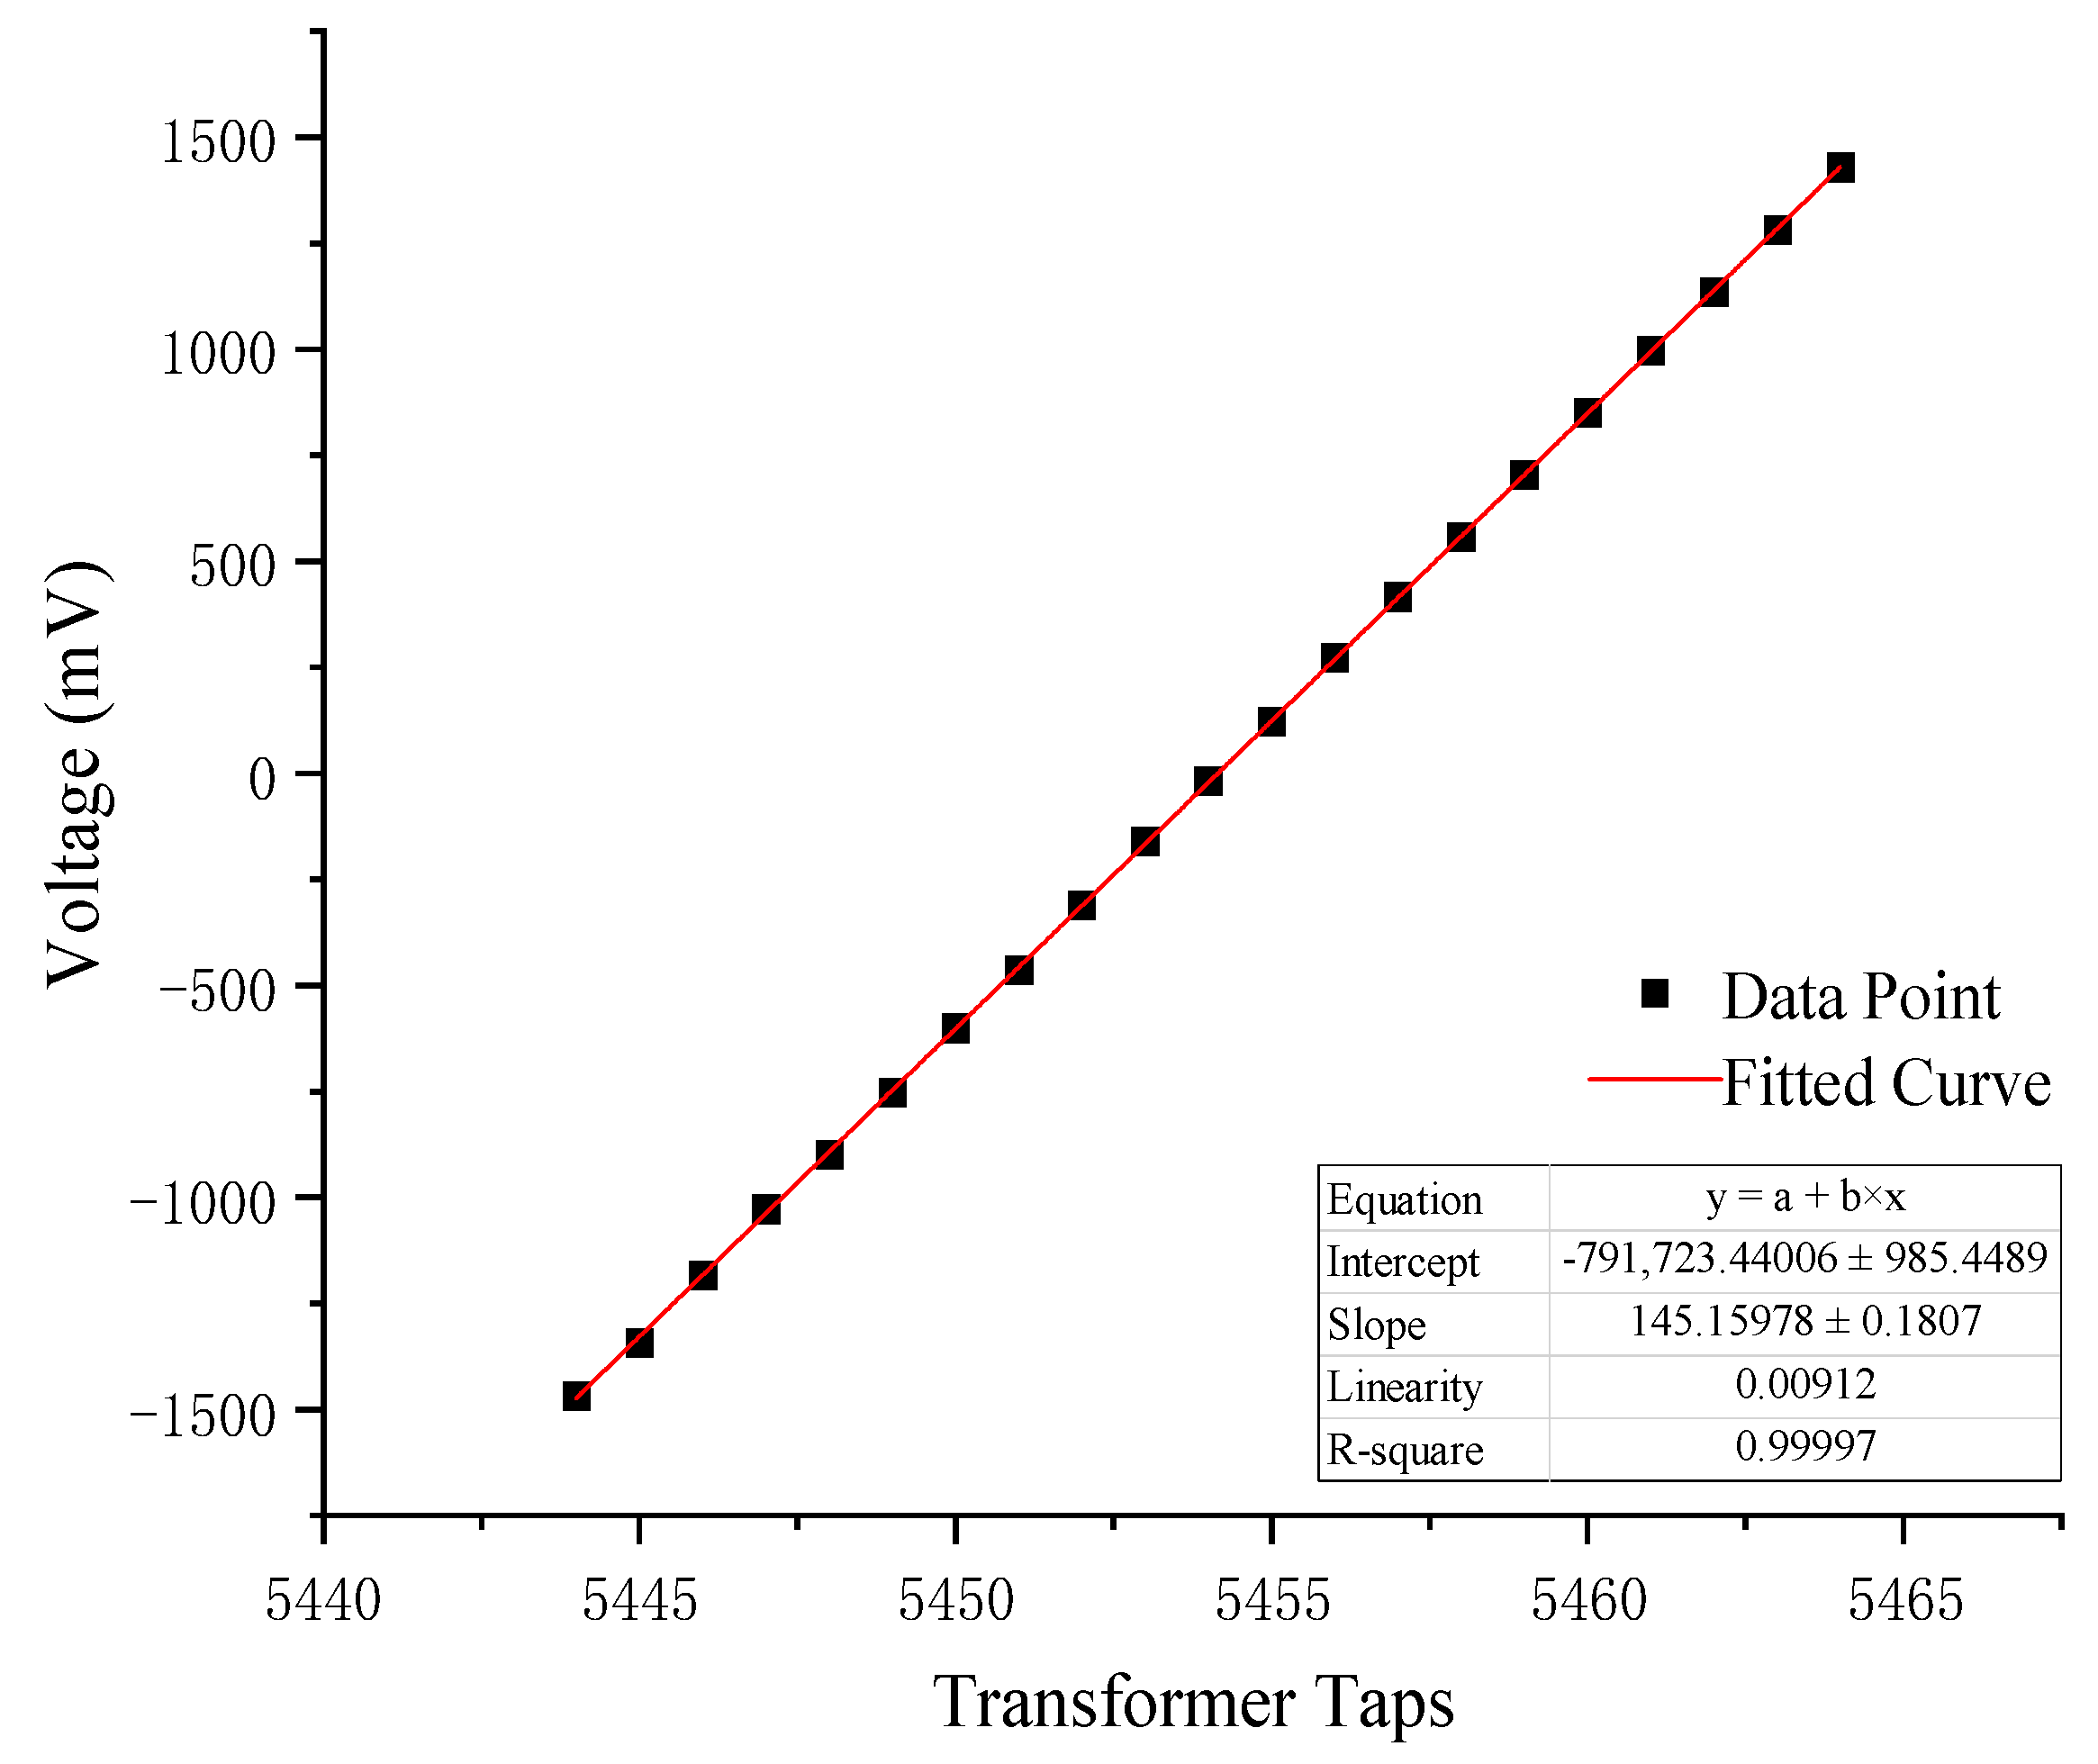
3.2. Quantitative Calibration of the Zero-Setting Experiment

In Equations (3) and (4) of Section 2.1, using UC as an intermediate variable, the relationship between the tap point N of the ratio transformer, the output voltage UO, and the measured displacement is established. To verify the linear quantification capability of the automatic zero-setting process based on electronic switches and to calibrate the voltage change, UC, associated with a single-turn adjustment of the transformer coil, standard test components were integrated into the measurement system under controlled laboratory conditions. Once the system output stabilized, an electronic switch was used to adjust one turn of the transformer coil, and the corresponding ADC output voltage values were recorded until the signal approached the full-scale range of the ADC. The experimental data are shown in Table 1, and the fitting curve is shown in Figure 11. The voltage change, UC, induced by one coil turn adjustment was determined to be 145.16 mV, with a nonlinearity error of 0.912%.

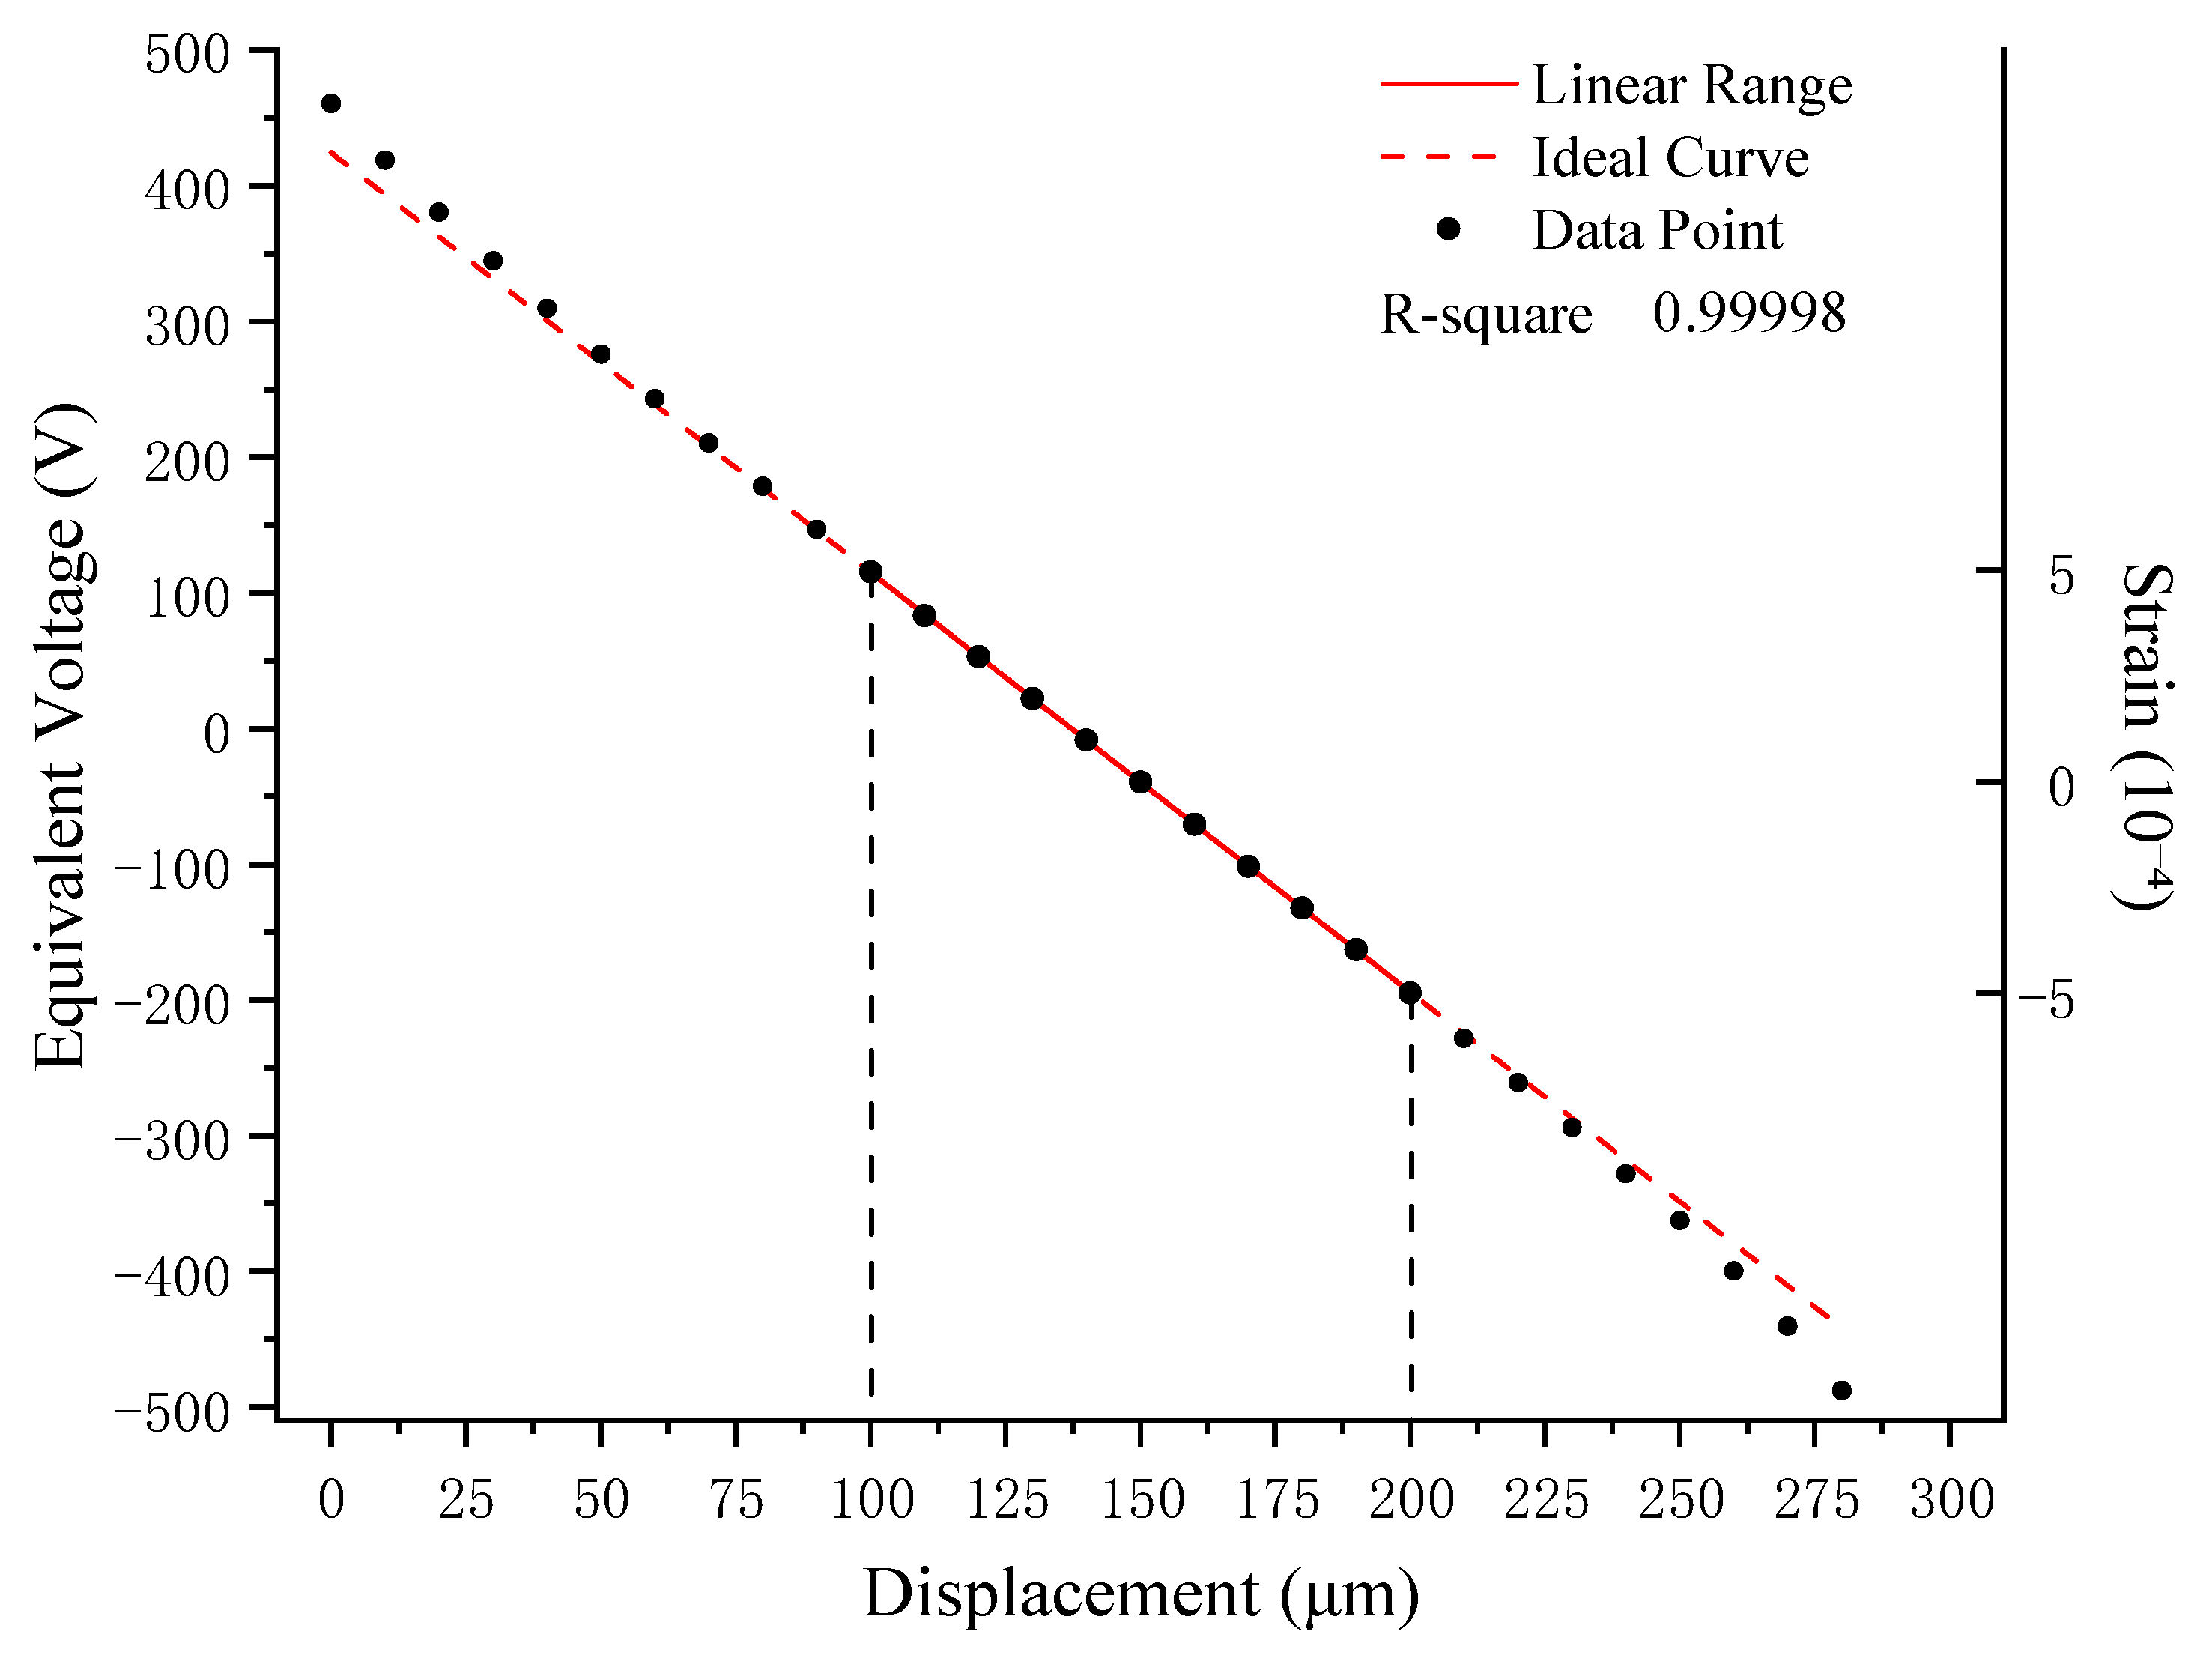
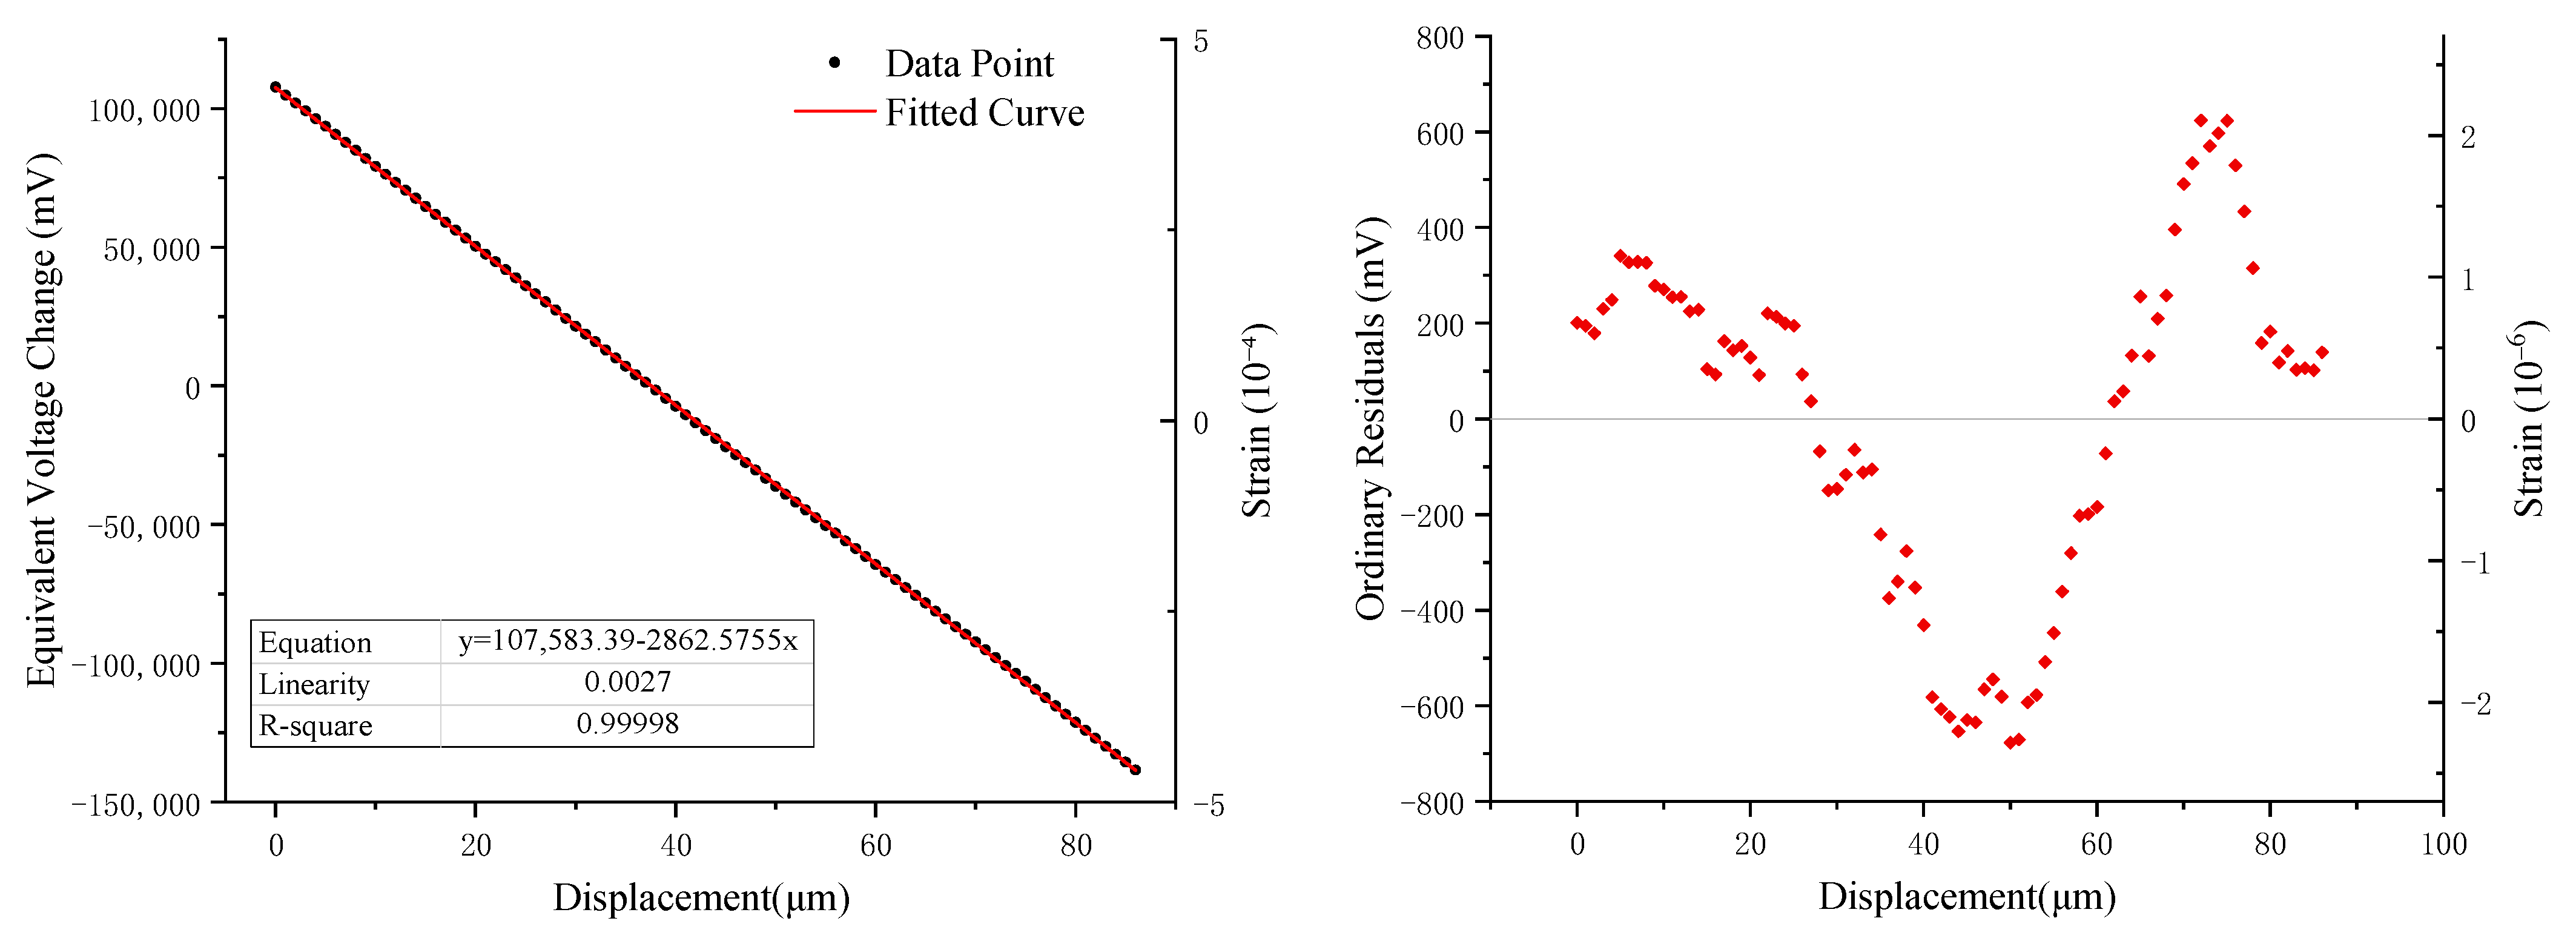
3.3. Linearity Calibration Experiment

To assess the linearity of the system over its full measurement range, the RZB strainmeter was used as the experimental platform. A differential capacitive sensor was fixed on a micro-motion measurement stage, adjusted to within the effective linear range, and the measurement bridge was balanced. Displacements of up to 86 μm were applied cumulatively to the sensor by turning the micro-motion stage knob. The system tracked these displacements, automatically zero-setting and outputting equivalent voltage values. The experimental data are shown in Table 2, and the calibration curve, fitting curve, and residuals are shown in Figure 12.
The experimental results demonstrate that the displacement step applied by the micro-displacement stage is approximately 1 µm, and the equivalent voltage change output of the measurement system is about 2862 mV, which corresponds to the sensitivity S in Equation (4). The linearity error was calculated using Equation (6), and according to the Industry Standards(DB/T 31.2-2008) [20]; this value should be less than 1%.
L i n e a r i t y   e r r o r = y m a x y F u l l   S c a l e × 100 %
In this Equation, y m a x   = 676.9 mV is the maximum absolute error and y F u l l   S c a l e   = 246,242.868 mV is the system output range. The linearity error of the measurement system is 0.27%, which already meets the industry standard requirement of less than 1%. Analyzing the distribution of residuals reveals a clear regularity; it was confirmed that this regularity is due to systematic errors rather than being introduced by the electronic switch array through extensive repeated experiments and comparative experiments. Theoretically, these errors could be predicted and corrected using mathematical methods. The experimental results demonstrate excellent linearity over the 86 µm range, with a nonlinearity error of 0.27%, fully utilizing the sensor’s effective linear range [19].

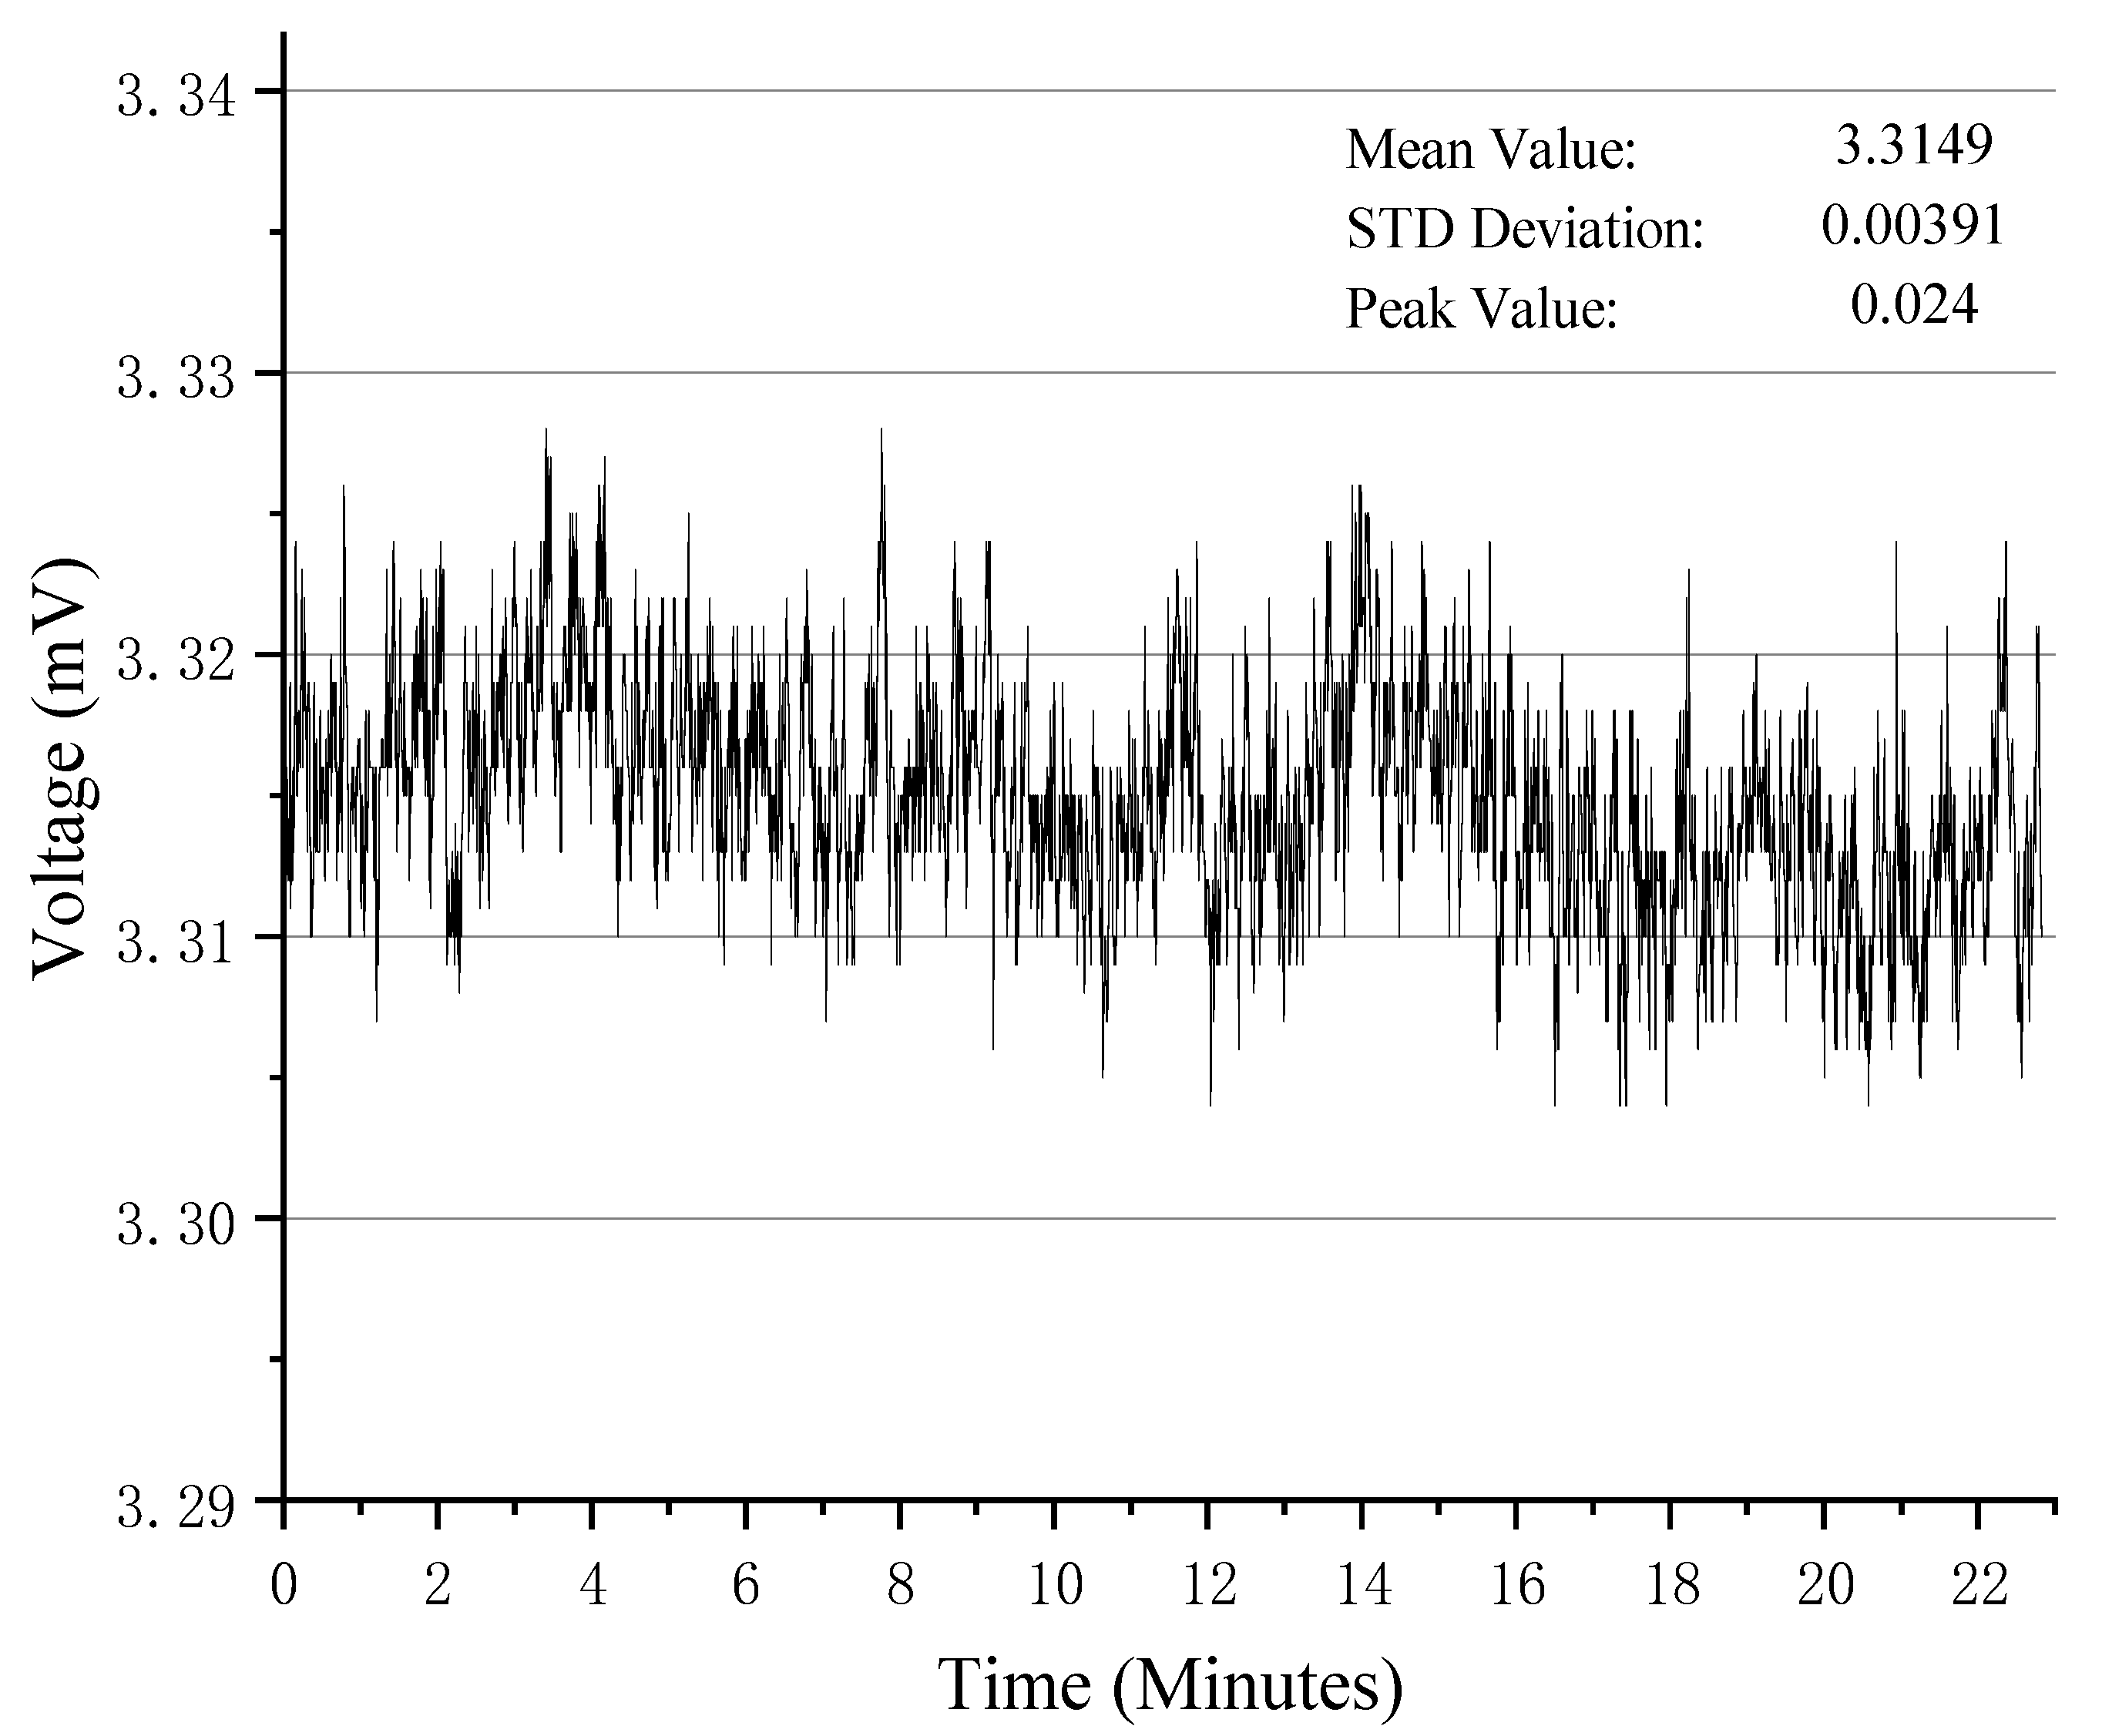
3.4. Noise Testing and Resolution Testing

To evaluate the noise level of the electronic system and its theoretical resolution, standard test components were connected to the measurement system under laboratory conditions. Once the system output was stabilized, an output signal curve was recorded, as shown in Figure 13, with a sampling period of 0.5 s and 2740 sampling data points.
The theoretical minimum resolution was calculated using the ratio of the effective value of the measured output noise y n to system sensitivity S:
y n = 1 N i = 1 N ( y i y ¯ ) 2
R R e s o l u t i o n = y n E f f e c t i v e   v a l u e   o f   n o i s e S S e n s i t i v i t y
Given y n   = 0.00391 mV, a peak-to-peak noise of 0.024 mV, and a system sensitivity S of 2862.5755 mV/μm (Figure 12), the theoretical minimum resolution R was calculated as 0.00136 nm.

4. Conclusions

This study designed a range-extension measurement system utilizing MOSFET-based electronic multi-switches and an automatic zero-setting control approach. The system integrates a Linux-based embedded upper computer with a microcontroller to control MOS bidirectional switches for transformer tap selection. It achieves automatic zero-setting for a differential capacitive sensor measurement bridge and enables full-range measurements by quantifying zero-setting actions into equivalent voltage values.
(1)
The system successfully implements automatic zero-setting and full-range measurement, reducing data loss risks associated with traditional manual zero-setting methods. Its fully electronic design enhances its integration and stability.
(2)
Laboratory testing showed an electronic noise level below 0.024 mV and a theoretical minimum resolution of 0.00136 nm. Zero-setting quantification calibration achieved a linearity error of 0.91% and large-range linearity calibration with a differential capacitive sensor yielded a nonlinearity error of 0.27%. The system can zero large step changes of up to 20 μm within 1 min and record the full measurement curve.
(3)
The system design incorporates modularity and compatibility, facilitating ease of human–machine interaction and ensuring compatibility with legacy equipment. It can serve as a solution for automated full-range measurements or as an upgrade to traditional manual dial systems, particularly in applications involving crustal stress and strain measurements.

Author Contributions

Conceptualization, Z.C., H.L. and Y.D.; data curation, C.Y., W.W. and W.Z.; formal analysis, Z.C., W.W., L.W. and Y.D.; funding acquisition, Z.C. and H.L.; investigation, W.W. and J.C.; methodology, C.Y., Z.C., H.L. and W.W.; project administration, Z.C.; resources, Z.C., H.L. and L.W.; software, C.Y. and W.Z.; supervision, Z.C. and H.L.; validation, C.Y. and W.W.; visualization, C.Y. and J.C.; writing—original draft, C.Y. and Z.C.; writing—review and editing, Z.C. and H.L. All authors have read and agreed to the published version of the manuscript.

Funding

This work is funded by the National Science and Technology Major Project (2024ZD1000702).

Institutional Review Board Statement

Not applicable.

Informed Consent Statement

Not applicable.

Data Availability Statement

Data are contained within the article.

Acknowledgments

The authors would like to thank the National Science and Technology Major Project for financial support.

Conflicts of Interest

The authors declare no conflicts of interest.

References

  1. Qiu, Z.H.; Xie, F.R.; Su, K.Z.; Ouyang, Z. New era of borehole strain observation. Recent Dev. World Seismol. 2004, 1, 7–14. [Google Scholar]
  2. Tang, L.; Fan, J.; Liu, G.; Qiu, Z. The Reliability Analysis of Strain Seismic Waves Recorded by High Sampling Four-component Borehole Strainmeter. Earthq. Res. China 2023, 39, 78–87. [Google Scholar]
  3. Wang, L.; Li, P.; Zhang, C.; Zhu, X.Q.; Gao, X.; Wang, B.P. Comparison and Analysis of Component Borehole Strain (YRY,RZB) Data in Yingkou Seismic Station. J. Disaster Prev. Reduct. 2018, 34, 46–56. [Google Scholar]
  4. Tang, L.; Qiu, Z.H.; Li, Y.J.; Li, Y.; Fan, J.Y. Determination and analysis of near-surface stress-strain state of 4-component borehole strainmeter. Geomat. Inf. Sci. Wuhan Univ. 2025, 50, 63–73. [Google Scholar] [CrossRef]
  5. Tang, L.; Qiu, Z.H.; Fan, J.Y.; Luo, Z.H. Characteristic analysis of coseismic variation of 4-component borehole strain observation with different sampling rates. J. Geod. Geodyn. 2022, 42, 1196–1201. [Google Scholar]
  6. Li, X.D.; Deng, W.P.; Jia, H.F.; He, A.H. Upgrading of Mainframe of RZB-Type Capacitor Borehole Strainmenters. J. Geod. Geodyn. 2016, 36, 1020–1024. [Google Scholar] [CrossRef]
  7. Liu, G.; Dong, S.W.; Chen, X.H. EarthScope-the latest advances of the United State’s deep exploration program. Acta Geol. Sin. 2010, 84, 909–926. (In Chinese) [Google Scholar]
  8. Buehler, J.S.; Shearer, P.M. Pn tomography of the western United States using USArray. J. Geophys. Res. Solid Earth 2010, 115, B09315. [Google Scholar] [CrossRef]
  9. Williams, M.L.; Fischer, K.M.; Freymueller, J.T.; Tikoff, B.; Tréhu, A.M. Unlocking the Secrets of the North American Continent: An EarthScope Science Plan for 2010–2020; EarthScope: Washington, DC, USA, 2010; 78p. [Google Scholar]
  10. Qiu, Z.H.; Shi, Y.L. Developments of borehole strain observation outside China. Acta Seismol. Sin. 2004, 17, 172–178. [Google Scholar] [CrossRef]
  11. Gladwin, M.T. High-precision multicomponent borehole deformation monitoring. Rev. Sci. Instrum. 1984, 55, 2011–2016. [Google Scholar] [CrossRef]
  12. Su, K.Z. Forty years of four-component borehole strain gauge in China. Seismol. Geomagn. Obs. Res. 2020, 41, 172–180. (In Chinese) [Google Scholar]
  13. Li, H.L.; Li, H. Status and developments of borehole strain observations in China. Acta Geol. Sin. 2010, 84, 895–900. [Google Scholar]
  14. Wu, S.G. The key technology analysis of borehole strain meter design. Seismol. Geomagn. Obs. Res. 2014. (In Chinese) [Google Scholar]
  15. Chen, Z.; Li, H.; Dong, Y.; Wang, W.; Wu, L.; Zhan, W. Research on the RZB-Type Three-Dimensional Drilling Strain Measurement System. Sensors 2024, 24, 3954. [Google Scholar] [CrossRef] [PubMed]
  16. Qiu, Z.H.; Shi, Y.L.; Ouyang, Z.X. Relative in-situ calibration of 4-component borehole strain observation. J. Geod. Geodyn. 2005, 25, 118–122. [Google Scholar]
  17. Ouyang, Z.X.; Zhang, Z.R.; He, C.P. A High-Precision Displacement Measurement System Based on Inductive Coupling Ratio Arm. Appl. Electron. Technol. 2004, 30, 41–43. (In Chinese) [Google Scholar] [CrossRef]
  18. Wu, L.H.; Li, H.; Chen, Z.; Wang, W.B.; Dong, Y.K. Research on the Stability of RZB Borehole Strainmeter Sensor with Range Extension and In-Situ Calibration. J. Geod. Geodyn. 2022, 42, 318–320. [Google Scholar] [CrossRef]
  19. Wu, L.H.; Xiong, Y.Z.; Li Tao Chen, Z. Study of the Range Expansion of the RZB Borehole Strain Meter. J. Geod. Geodyn. 2015, 35, 4. [Google Scholar] [CrossRef]
  20. DB/T 31.2-2008; Technical Requirements of Instruments in Network for Earthquake Monitoring. The Instrument for Crustal Deformation Observation. Part 2: Strainmeter. China Earthquake Administration: Beijing, China, 2008. (In Chinese)
Figure 1. Schematic diagram of borehole strain observation system.
Sensors 25 00476 g001
Figure 2. Calibration curve for the full range of the sensor.
Sensors 25 00476 g002
Figure 3. Design of a full-range measurement system based on the automatic zero setting.
Sensors 25 00476 g003
Figure 4. Measurement bridge equivalent circuit diagram.
Sensors 25 00476 g004
Figure 5. Ratio transformer and multi-switch array structure diagram.
Sensors 25 00476 g005
Figure 6. MOSFET bidirectional switch schematic.
Sensors 25 00476 g006
Figure 7. Automatic zero-setting control system block diagram.
Sensors 25 00476 g007
Figure 8. Delay control algorithm flowchart.
Sensors 25 00476 g008
Figure 9. Automatic Zero Setting Measurement Curve.
Sensors 25 00476 g009
Figure 10. Full-range measurement system based on the automatic zero setting.
Sensors 25 00476 g010
Figure 11. Quantitative calibration curve.
Sensors 25 00476 g011
Figure 12. Linearity calibration curve.
Sensors 25 00476 g012
Figure 13. System output noise curve.
Sensors 25 00476 g013
Table 1. Quantitative calibration test data.
NVoltage (mv)NVoltage (mv)
5444−14695455122
5445−13435456273
5446−11835457416
5447−10285458556
5448−9005459704
5449−7525460850
5450−6015461997
5451−46354621136
5452−31254631281
5453−16054641429
5454−185455122
5444−1469
Table 2. Linearity calibration experiment data.
Δd (μm)ΔV (mv)Err (mv)Δd (μm)ΔV (mv)Err (mv)Δd (μm)ΔV (mv)Err (mv)Δd (μm)ΔV (mv)Err (mv)
0107,784.111200.7242244,827.505220.77944−19,023.257−653.32266−81,215.114131.482
1104,915.231194.4192341,957.199213.04945−21,862.209−629.69867−83,999.909209.263
2102,037.514179.2782439,081.193199.61846−24,729.664−634.57868−86,813.207258.540
399,225.926230.2652536,213.737194.73847−27,523.011−565.34969−89,538.145396.178
496,381.843248.7582633,249.37092.94648−30,364.813−544.57570−92,305.838491.060
593,611.300340.7902730,330.60836.76049−33,263.622−580.80971−95,124.837534.636
690,735.293327.3602827,363.391−67.88250−36,222.288−676.90072−97,898.231623.818
787,873.539328.1812924,418.976−149.72151−39,078.342−670.37973−100,814.142570.482
885,008.934326.1513021,560.072−146.05052−41,863.137−592.59874−103,650.244596.956
982,098.723278.5163118,726.821−116.72653−44,710.640−577.52675−106,486.345623.430
1079,228.418270.7863215,916.372−64.59954−47,503.986−508.29676−109,442.161530.190
1176,349.561254.5053313,006.162−112.23455−50,305.884−447.61877−112,400.828434.099
1273,487.806255.3253410,150.108−105.71256−53,082.128−361.28678−115,382.298315.205
1370,594.698224.792357151.536−241.70857−55,864.072−280.65679−118,400.822159.256
1467,735.793228.464364155.815−374.85458−58,648.867−202.87580−121,239.773182.880
1564,748.623103.869371328.265−339.82959−61,507.772−199.20481−124,167.086118.143
1661,875.46793.28838−1470.782−276.30060−64,355.275−184.13182−127,006.038141.766
1759,082.121162.51839−4409.496−352.43961−67,105.865−72.14783−129,907.697102.682
1856,200.414143.38640−7351.061−431.42862−69,859.30736.98884−132,766.602106.353
1953,347.210152.75841−10,363.884−581.67663−72,701.10957.76185−135,634.057101.474
2050,459.803127.92642−13,251.292−606.50864−75,488.754132.69186−138,458.757139.349
2147,560.99491.69243−16,130.149−622.78965−78,227.944256.077
Disclaimer/Publisher’s Note: The statements, opinions and data contained in all publications are solely those of the individual author(s) and contributor(s) and not of MDPI and/or the editor(s). MDPI and/or the editor(s) disclaim responsibility for any injury to people or property resulting from any ideas, methods, instructions or products referred to in the content.

