1. Introduction
Malaria remains a significant global health concern, particularly affecting low-income countries where resources are scarce and healthcare systems are overburdened. According to the World Health Organization (WHO), an estimated 249 million malaria cases occurred in 2022, resulting in approximately 608,000 deaths worldwide [
1]. The disease is caused by the
Plasmodium parasite and is transmitted to humans through the bite of the female
Anopheles mosquito. Among the various species,
Plasmodium falciparum is the most prevalent and lethal [
2].
The current gold standard for malaria diagnosis involves manually counting parasites in stained blood smears—a labor-intensive and highly subjective process [
3,
4]. This method requires well-trained microscopists, which makes it impractical in many endemic regions due to a shortage of skilled personnel [
5]. Two primary methodologies are employed: thin blood smears, which provide a single layer of red and white blood cells (WBCs), and thick blood smears, which concentrate multiple layers of blood for higher sensitivity [
6]. While thick smears enhance parasite detection, they present challenges such as overlapping cells and staining artifacts that complicate analysis. Standard staining methods include Giemsa and Romanowsky dyes, with the latter being preferred for its stability in humid climates [
5]. Maintaining staining quality is essential for accurate parasite visualization, yet it remains problematic in resource-limited settings.
Manual microscopic examination for parasite detection, life stage differentiation, and parasite counting is laborious and subjective [
5]. Additionally, the WHO acknowledges that microscopists often work in low-resource and isolated environments without systems to ensure diagnostic quality. Heavy workloads and a lack of trained health personnel further limit the effectiveness of microscopy in regions with a high disease burden [
5]. These challenges have prompted the development of computational image-processing methods to support malaria diagnosis. Such tools improve the reliability of test interpretations, reduce healthcare workers’ workload, and lower diagnostic costs [
6].
Existing computational methods primarily focus on parasite detection but often fail to address other critical aspects, such as smear quality assessment and leukocyte detection, leaving a significant gap in comprehensive diagnostic solutions. Various machine learning (ML) approaches have been employed to detect and quantify parasites in stained blood smear images. For example, Rosado et al. [
7] developed a method to detect
Plasmodium falciparum trophozoites and WBCs in Giemsa-stained thick blood smears, achieving 80.5% recall, 93.8% specificity, and 91.8% accuracy at the patch level using adaptive thresholding and a support vector machine (SVM) classifier. Dave et al. [
8] applied histogram-based adaptive thresholding and mathematical morphological operations for segmentation, achieving 86.34% recall and 96.60% specificity at the patch level with a cubic SVM for classifying parasites in different life stages. Delahunt et al. [
9] described an automated malaria diagnosis system for thick smears, achieving 95% specificity at the patient level using morphological, color, and texture features with a linear SVM. However, classifying parasite stages in thick blood smears remains particularly challenging, with limited studies reporting accuracies of around 76%. Furthermore, many existing methods require high computational resources and extended processing times, which are impractical in resource-limited environments.
Deep learning (DL) techniques have emerged as powerful tools for automatic feature extraction and detection in thick blood smears. Quinn et al. [
10] proposed a convolutional neural network (CNN) model for parasite detection, reporting an average precision of 97% using smartphone-captured images divided into patches. Mehanian et al. [
11] utilized CNN models for parasite detection and quantification, achieving recall, precision, and specificity of 91.6%, 89.7%, and 94.1%, respectively, although with a processing time of 20 min. Yang et al. [
12] introduced smartphone-based algorithms employing customized CNN and Faster R-CNN models for parasite detection, achieving detection rates of 96.84% and 96.81% at the image and patient levels, respectively. Despite these advancements, challenges such as classifying parasite stages in thick blood smears and evaluating staining quality for parasite visualization still need to be explored. In our previous work, we developed an image-based approach using the HSV color space and an SVM, achieving an F1-score of 97% for classifying smear quality [
13]. However, the detection of leukocytes and assessment of staining quality still need to be explored.
Our research addresses these critical gaps by developing an integrated system that detects and classifies malaria parasites, assesses image quality, and counts leukocytes in Romanowsky-stained thick blood smears. This novel and comprehensive approach can transform malaria diagnostics by providing a cost-effective and scalable solution accessible to remote and resource-limited areas. Moreover, its ease of integration into existing diagnostic workflows ensures that minimal additional training is required for healthcare personnel.
In summary, this paper proposes a comprehensive system that (1) automatically assesses image quality, (2) detects and counts leukocytes, and (3) detects and classifies malaria parasites in images of Romanowsky-stained thick blood smears, a diagnostic medium often overlooked despite its relevance in tropical regions. Our approach fills gaps in malaria diagnostics by leveraging image processing, classical ML, and DL techniques. Unlike previous studies focusing solely on parasite detection, our system offers a holistic diagnostic tool for resource-limited settings. By integrating these components, we aim to improve diagnostic accuracy, facilitate prompt treatment, and ultimately contribute to reducing the global burden of malaria.
2. Materials and Methods
This section outlines the methodology for quality analysis, leukocyte detection, and malaria parasite detection and classification in Romanowsky-stained thick blood smear images of Plasmodium vivax. This study analyzed 1000 anonymized images previously used for actual diagnoses and labeled them with information on color quality, diagnosis, leukocyte location, parasite count, location, and stage.
Image quality was assessed using feature extraction techniques based on the HSV color space and support vector machines (SVMs). Leukocyte detection involved experimental designs leveraging distinct color spaces and image enhancement techniques. Parasite detection was performed by classifying parasite candidates (cropped image segments) using a custom convolutional neural network (CNN). The SVM and CNN methods were further compared to classify parasite stages, as illustrated in
Figure 1.
2.1. Image Dataset
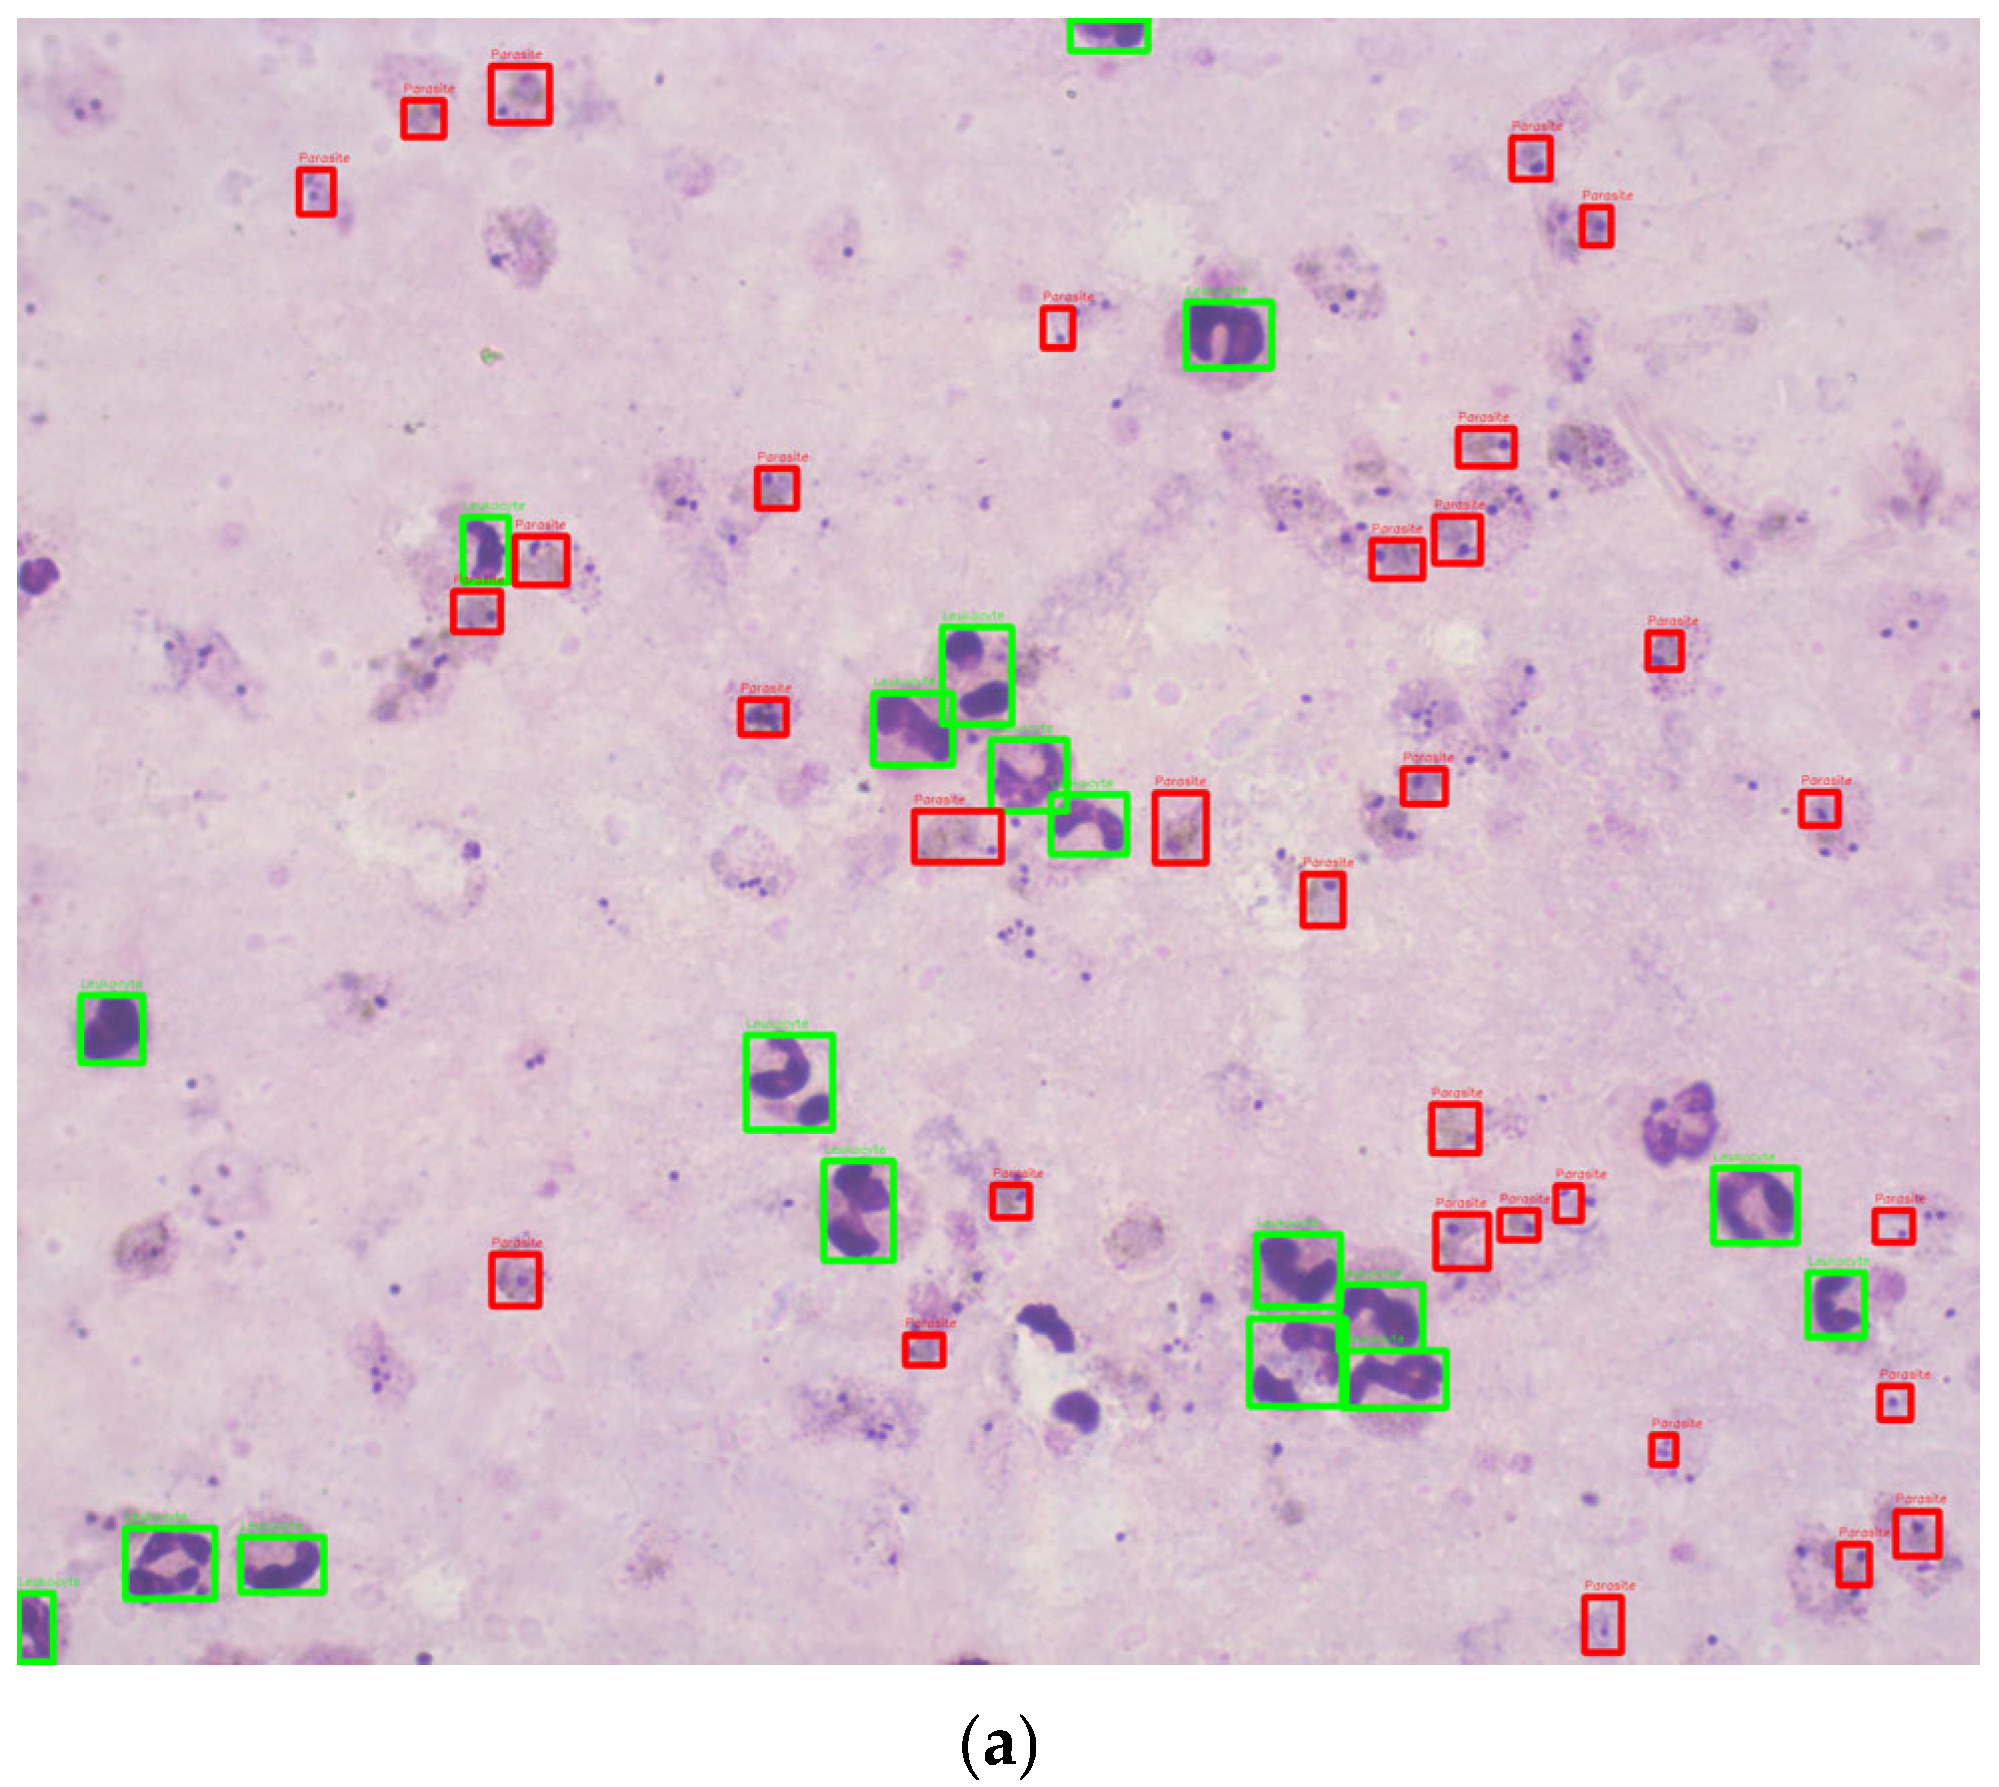
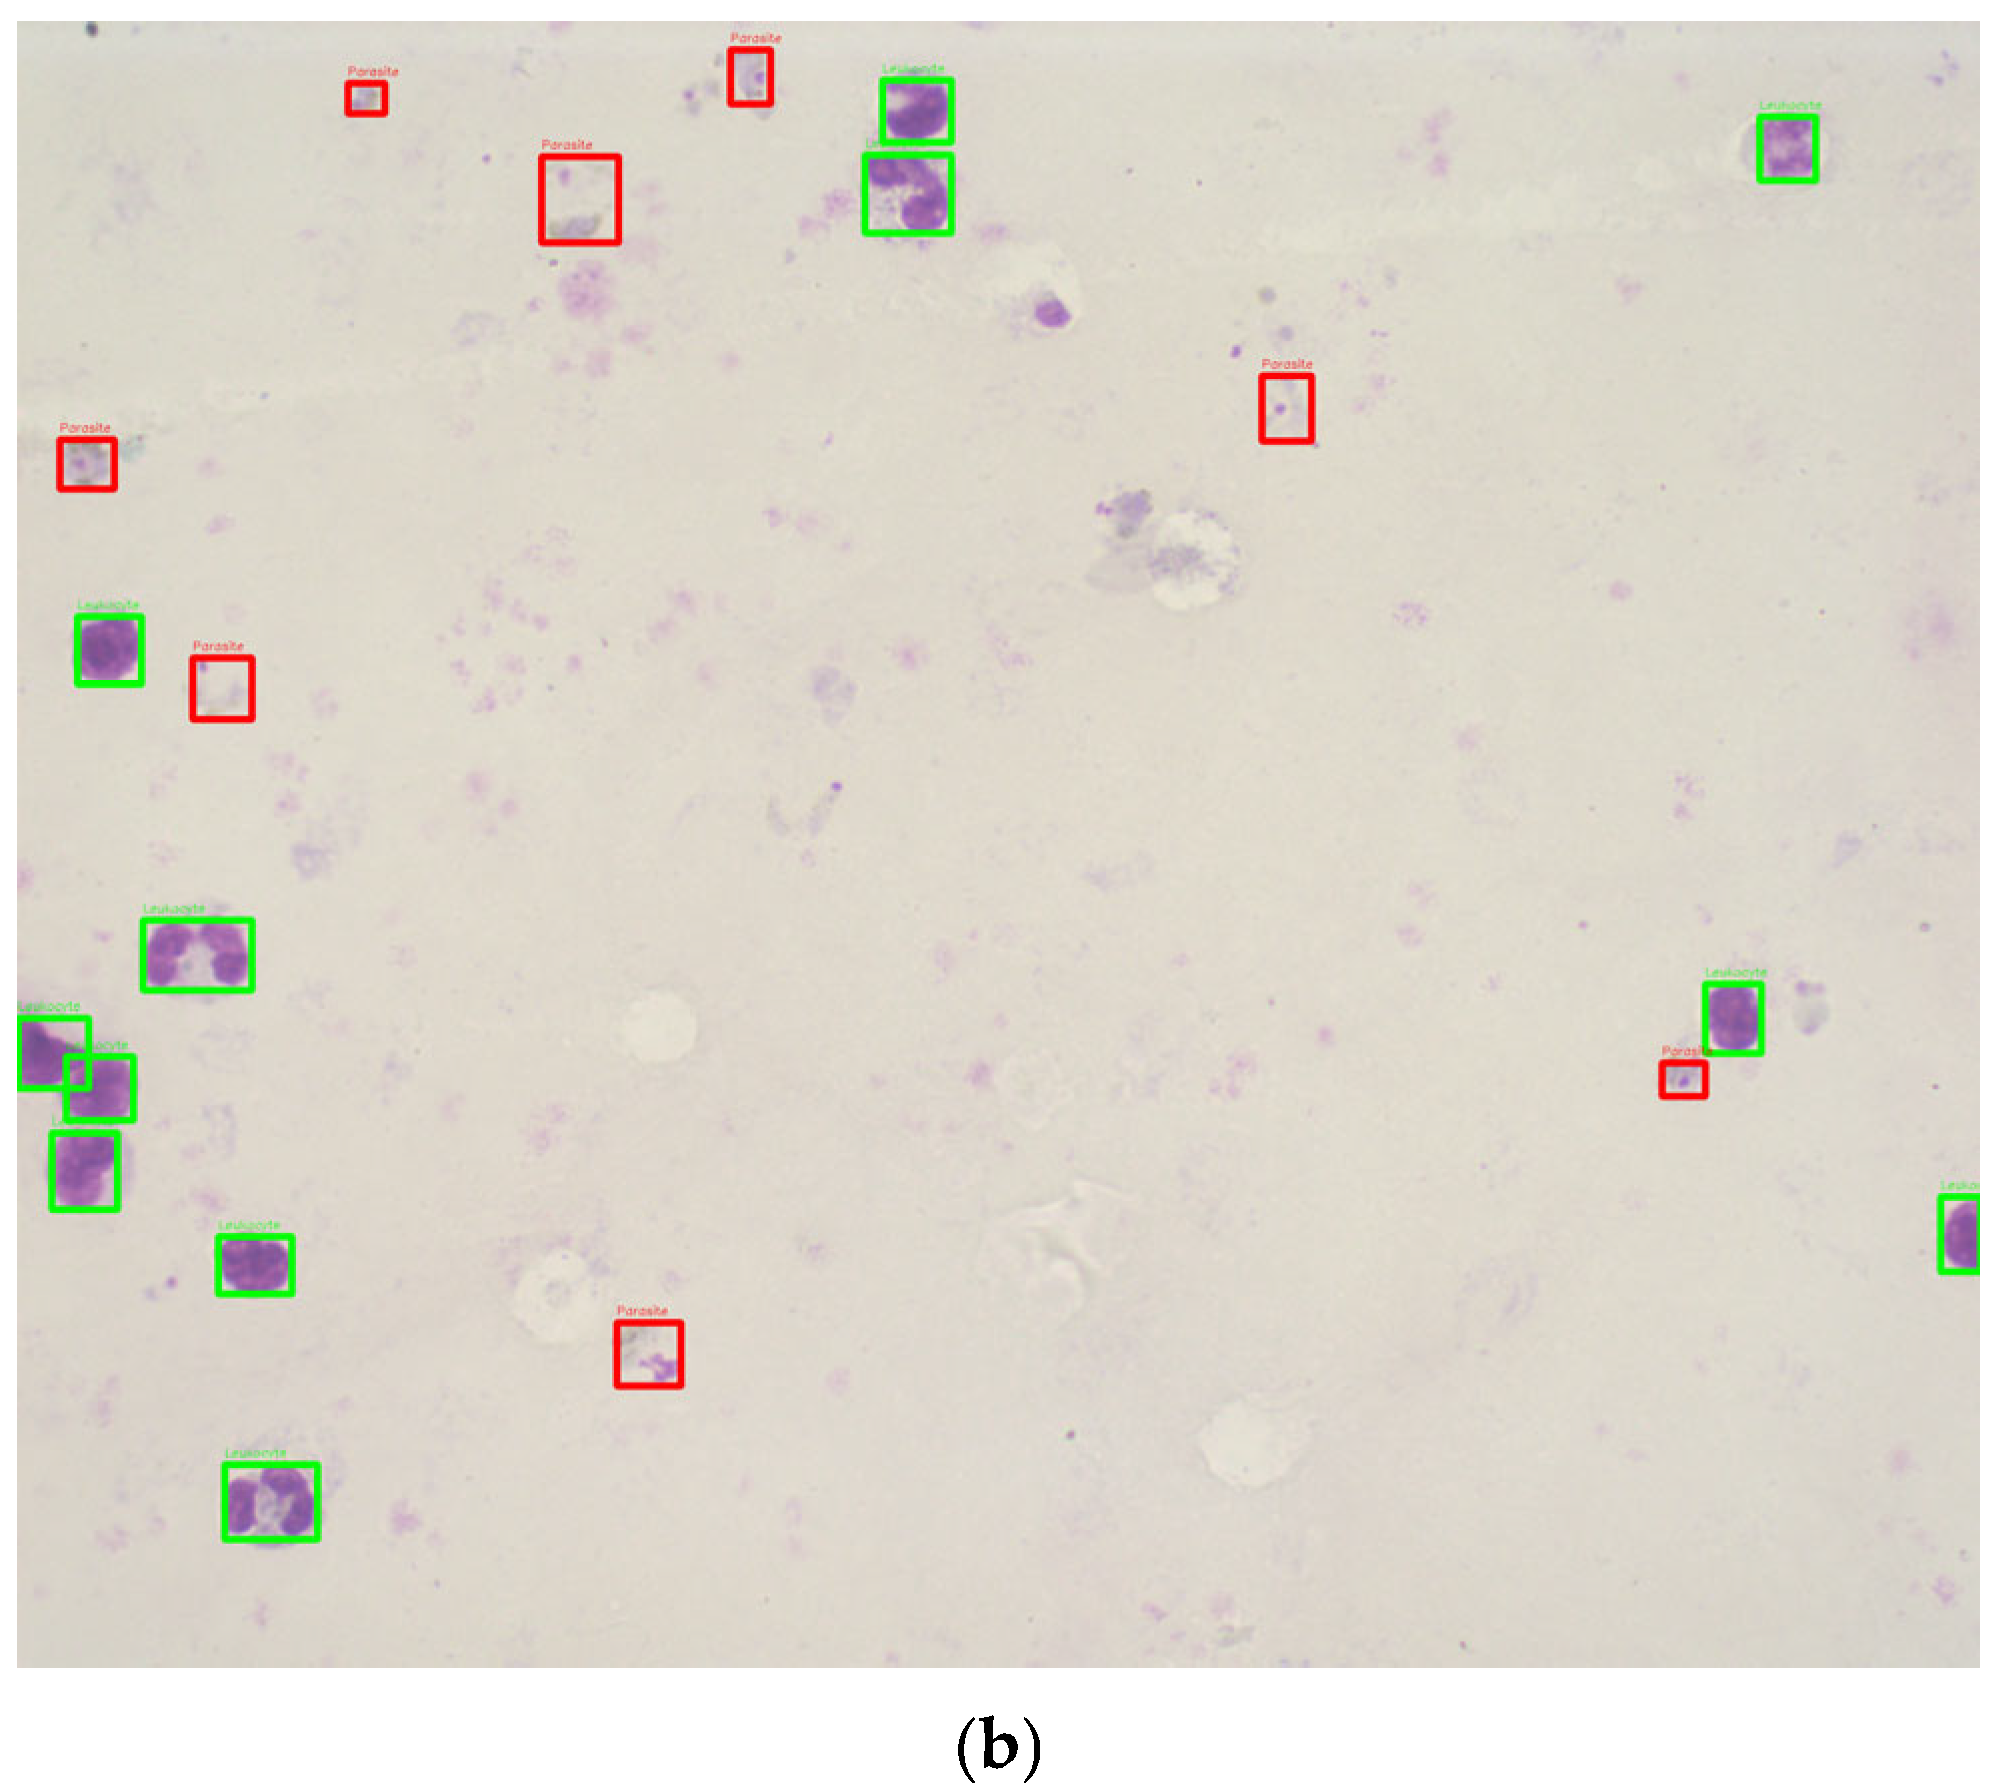
This study utilized 1000 Romanowsky-stained thick blood smear images from the National Institute of Health in Colombia. These images were derived from 100 slides, with ten images captured per slide near the sample center to ensure uniformity. Each image was taken with a Zeiss Scope A1 optical microscope at 100× magnification, resulting in RGB color images with a resolution of 2452 × 2056 pixels. The images were annotated by experts, using bounding boxes to label the life stages of each parasite (
Figure 2). To the best of our knowledge, no previous studies have used datasets of Romanowsky-stained thick blood smears, a dye commonly employed in tropical climates due to its stability.
The database expands on a previous dataset of 420 images created by one of the authors, used initially to evaluate the coloration quality of thick blood smears (TBS) [
13]. For this new project, the same methodology from the prior work was applied to collect and annotate an additional 580 images, resulting in 1000 images.
The images were captured using a standardized methodology to ensure consistency in color representation and image quality:
The dataset was created using a 100× magnification Axio Zeiss Scope A1 optical microscope (Carl Zeiss, Oberkochen, Germany). The LED-illuminated microscope eliminated the need for a blue filter.
Key microscope components, such as the reflector insert, field diaphragm, and aperture diaphragm, were kept in fixed positions to standardize the lighting conditions. As malaria diagnosis professionals at the National Health Institute of Colombia (INS) recommended, the light intensity was calibrated at 22.4 lux using a light meter (Model 407026, Extech, Nashua, NH, USA).
The images, each with a resolution of 2056 × 2452 pixels, were captured in PNG format and stored with annotations of relevant biological features.
The original 42 thick blood smear samples were collected from malaria cases caused by
Plasmodium vivax during 2017–2018 [
13]. Each thick blood smear was photographed in 10 central fields to ensure uniformity and avoid variability caused by peripheral blood thickness. This methodology was replicated for additional slides to expand the dataset.
The images were annotated by personnel certified in malaria parasite stage identification using the web-based tool Labelbox [
14]. The annotations include bounding boxes identifying parasite life stages (e.g., trophozoites, schizonts, gametocytes) and leukocyte locations.
Data Partitioning
The dataset consisted of 1000 Romanowsky-stained thick blood smear images, including 217 classified as good and 783 as bad quality. Among these, 702 images contained parasites, while 298 did not. A total of 6188 parasites were annotated, distributed as 5927 trophozoites, 114 schizonts, and 147 gametocytes, with sizes ranging from 13 to 138 pixels. Additionally, 12,712 leukocytes were identified, ranging in size from 15 to 222 pixels. Twelve images lacked leukocytes, while others contained up to 43, with an average of 13 leukocytes per image.
The images were annotated by personnel certified in identifying malaria parasites, including one of the authors, who also contributed to the previous work on the original dataset [
13]. The classification into “good” and “bad” quality was based on criteria defined by the National Health Institute of Colombia (INS) and aligned with WHO protocols [
15], focusing on background coloration and staining quality.
The distribution of a higher proportion of low-quality images than high-quality ones reflects the real-world conditions in resource-limited settings where malaria diagnoses are commonly made. Low-quality images are more prevalent in these settings due to available equipment and technology constraints. Prioritizing low-quality images in the training dataset enables the model to develop greater resilience and effectiveness when processing suboptimal images, ultimately improving its performance in actual field conditions. By incorporating a more significant number of low-quality images, the model’s ability to accurately identify and classify malaria cases is enhanced, even when image quality is less than ideal, a situation often encountered in rural laboratories or areas with limited resources. This strategy also addresses the challenge posed by the variability in image quality, a common issue in malaria diagnosis in settings with limited technical resources [
16].
The dataset was divided into training (70%), validation (15%), and testing (15%) subsets using a stratified sampling approach. This split was conducted separately for good and bad quality images, ensuring the same distribution of quality categories in each subset. Although the dataset contained more bad quality images than good quality images, balancing adjustments were not performed during partitioning. Instead, class balancing was addressed during the detection and classification phases.
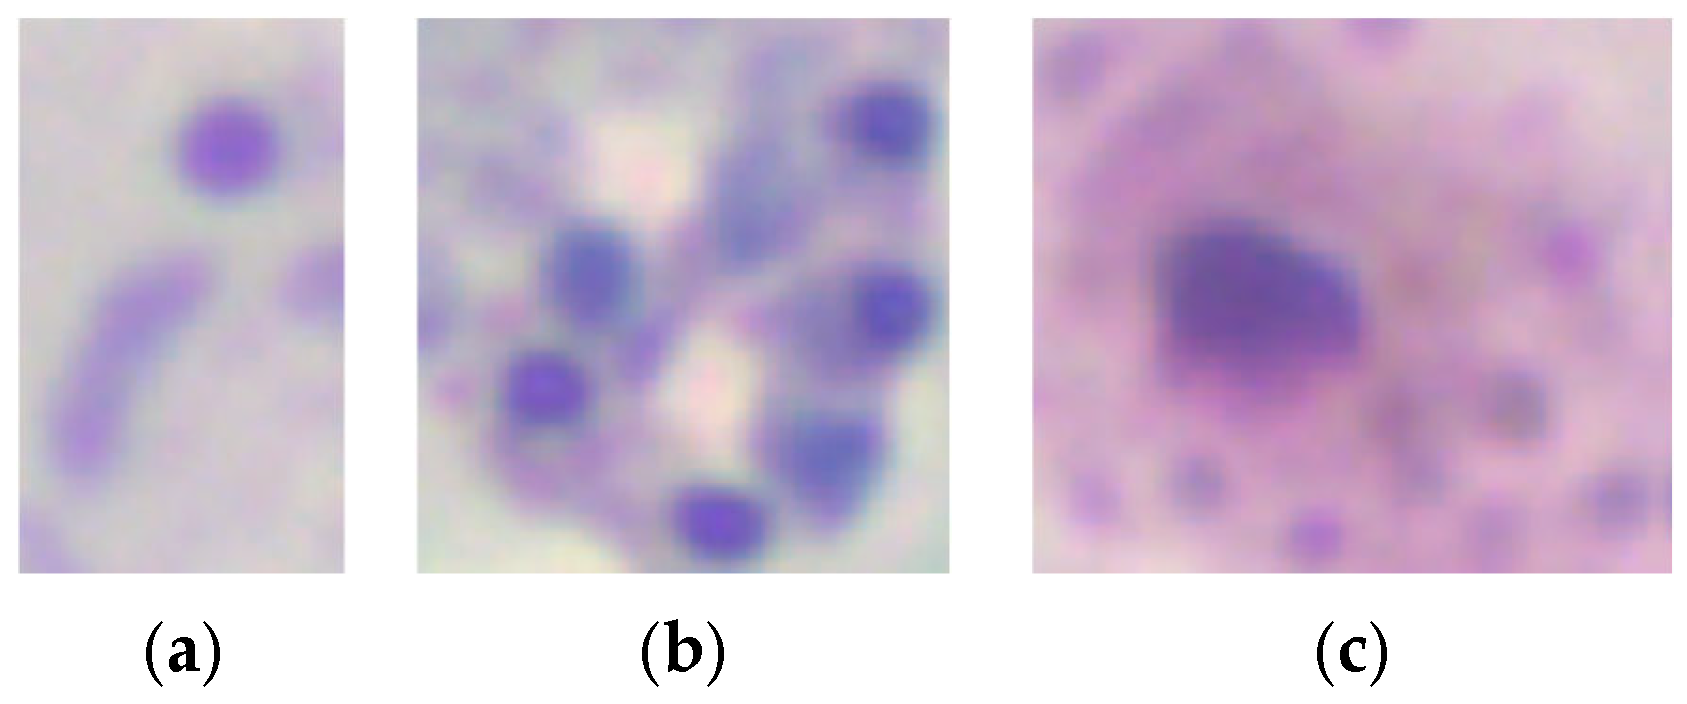
Data augmentation was applied to mitigate class imbalance during model training. For parasite detection, augmentation techniques such as rotations, horizontal and vertical flips, and combinations of flips were applied at the patch level, increasing the dataset size. Similarly, data augmentation was applied to underrepresented classes (schizonts and gametocytes) for parasite stage classification, while subsampling was performed on the trophozoite class.
Figure 3 shows example crops for each parasite stage: (a) trophozoites, (b) schizonts, and (c) gametocytes.
The dataset was split into training, validation, and testing subsets as a hold-out validation approach.
Table 1 summarizes the distribution of the dataset after partitioning.
2.2. Image Quality Analysis
In the literature, red, green, and blue (RGB) have been the color space most frequently used for malaria diagnosis [
5,
12,
17,
18]. Furthermore, hue, saturation, and brightness (HSV) have been used for malaria parasite detection [
5,
19,
20]. This methodology builds upon prior work by Fong et al. [
13], incorporating HSV-based feature extraction and SVM classification to improve image quality assessment. This integration represents an advancement in automating diagnostic processes tailored to Romanowsky-stained thick blood smears. The authors also indicated that background thresholding allowed the separation of foreground elements (leukocytes, platelets, parasites) from the background, explicitly using the H and S components of the HSV color space. Alternatively, the data distribution in the RGB color space did not differentiate the two background quality classes. After visually analyzing the histograms, the usefulness of the H and S components in the HSV color space was confirmed. Therefore, the H and S components were used in an HSV histogram to remove the leukocytes and parasites (foreground elements). Then, the threshold image was applied to the original image as a mask, resulting in an image that retained the background information in the HSV color space, with the foreground elements in black.
Leukocyte and parasite detection were chosen as parameters for assessing image quality due to their importance in ensuring the reliability of malaria diagnoses. Poor staining directly affects the ability to identify these elements, leading to faint or distorted appearances. Leukocytes are particularly valuable for evaluating staining consistency and intensity as they are often the most evident elements in well-stained smears. Parasites provided additional insight by assessing the visibility of their stages (trophozoites, schizonts, gametocytes) and the differentiation from artifacts. These parameters align with established guidelines and previous work [
13].
Subsequently, the SVM method was employed to classify the images into good and bad quality categories using histogram bins for feature extraction. The H and S components from the HSV space were used to create histograms with 16 bins, removing the first bin to exclude noise from foreground elements. This process allowed for the identification of optimal features for quality classification.
2.3. Leukocyte Detection
Previous studies have used various image-processing techniques for leukocyte detection and counting, typically involving a preprocessing stage followed by segmentation. These methods include contrast stretching and adaptive thresholding on channel V [
20], low-pass filtering with contrast stretching and optimal thresholding segmentation utility (OTSU) [
21], and Gaussian low-pass filtering with adaptive histogram equalization and adaptive thresholding [
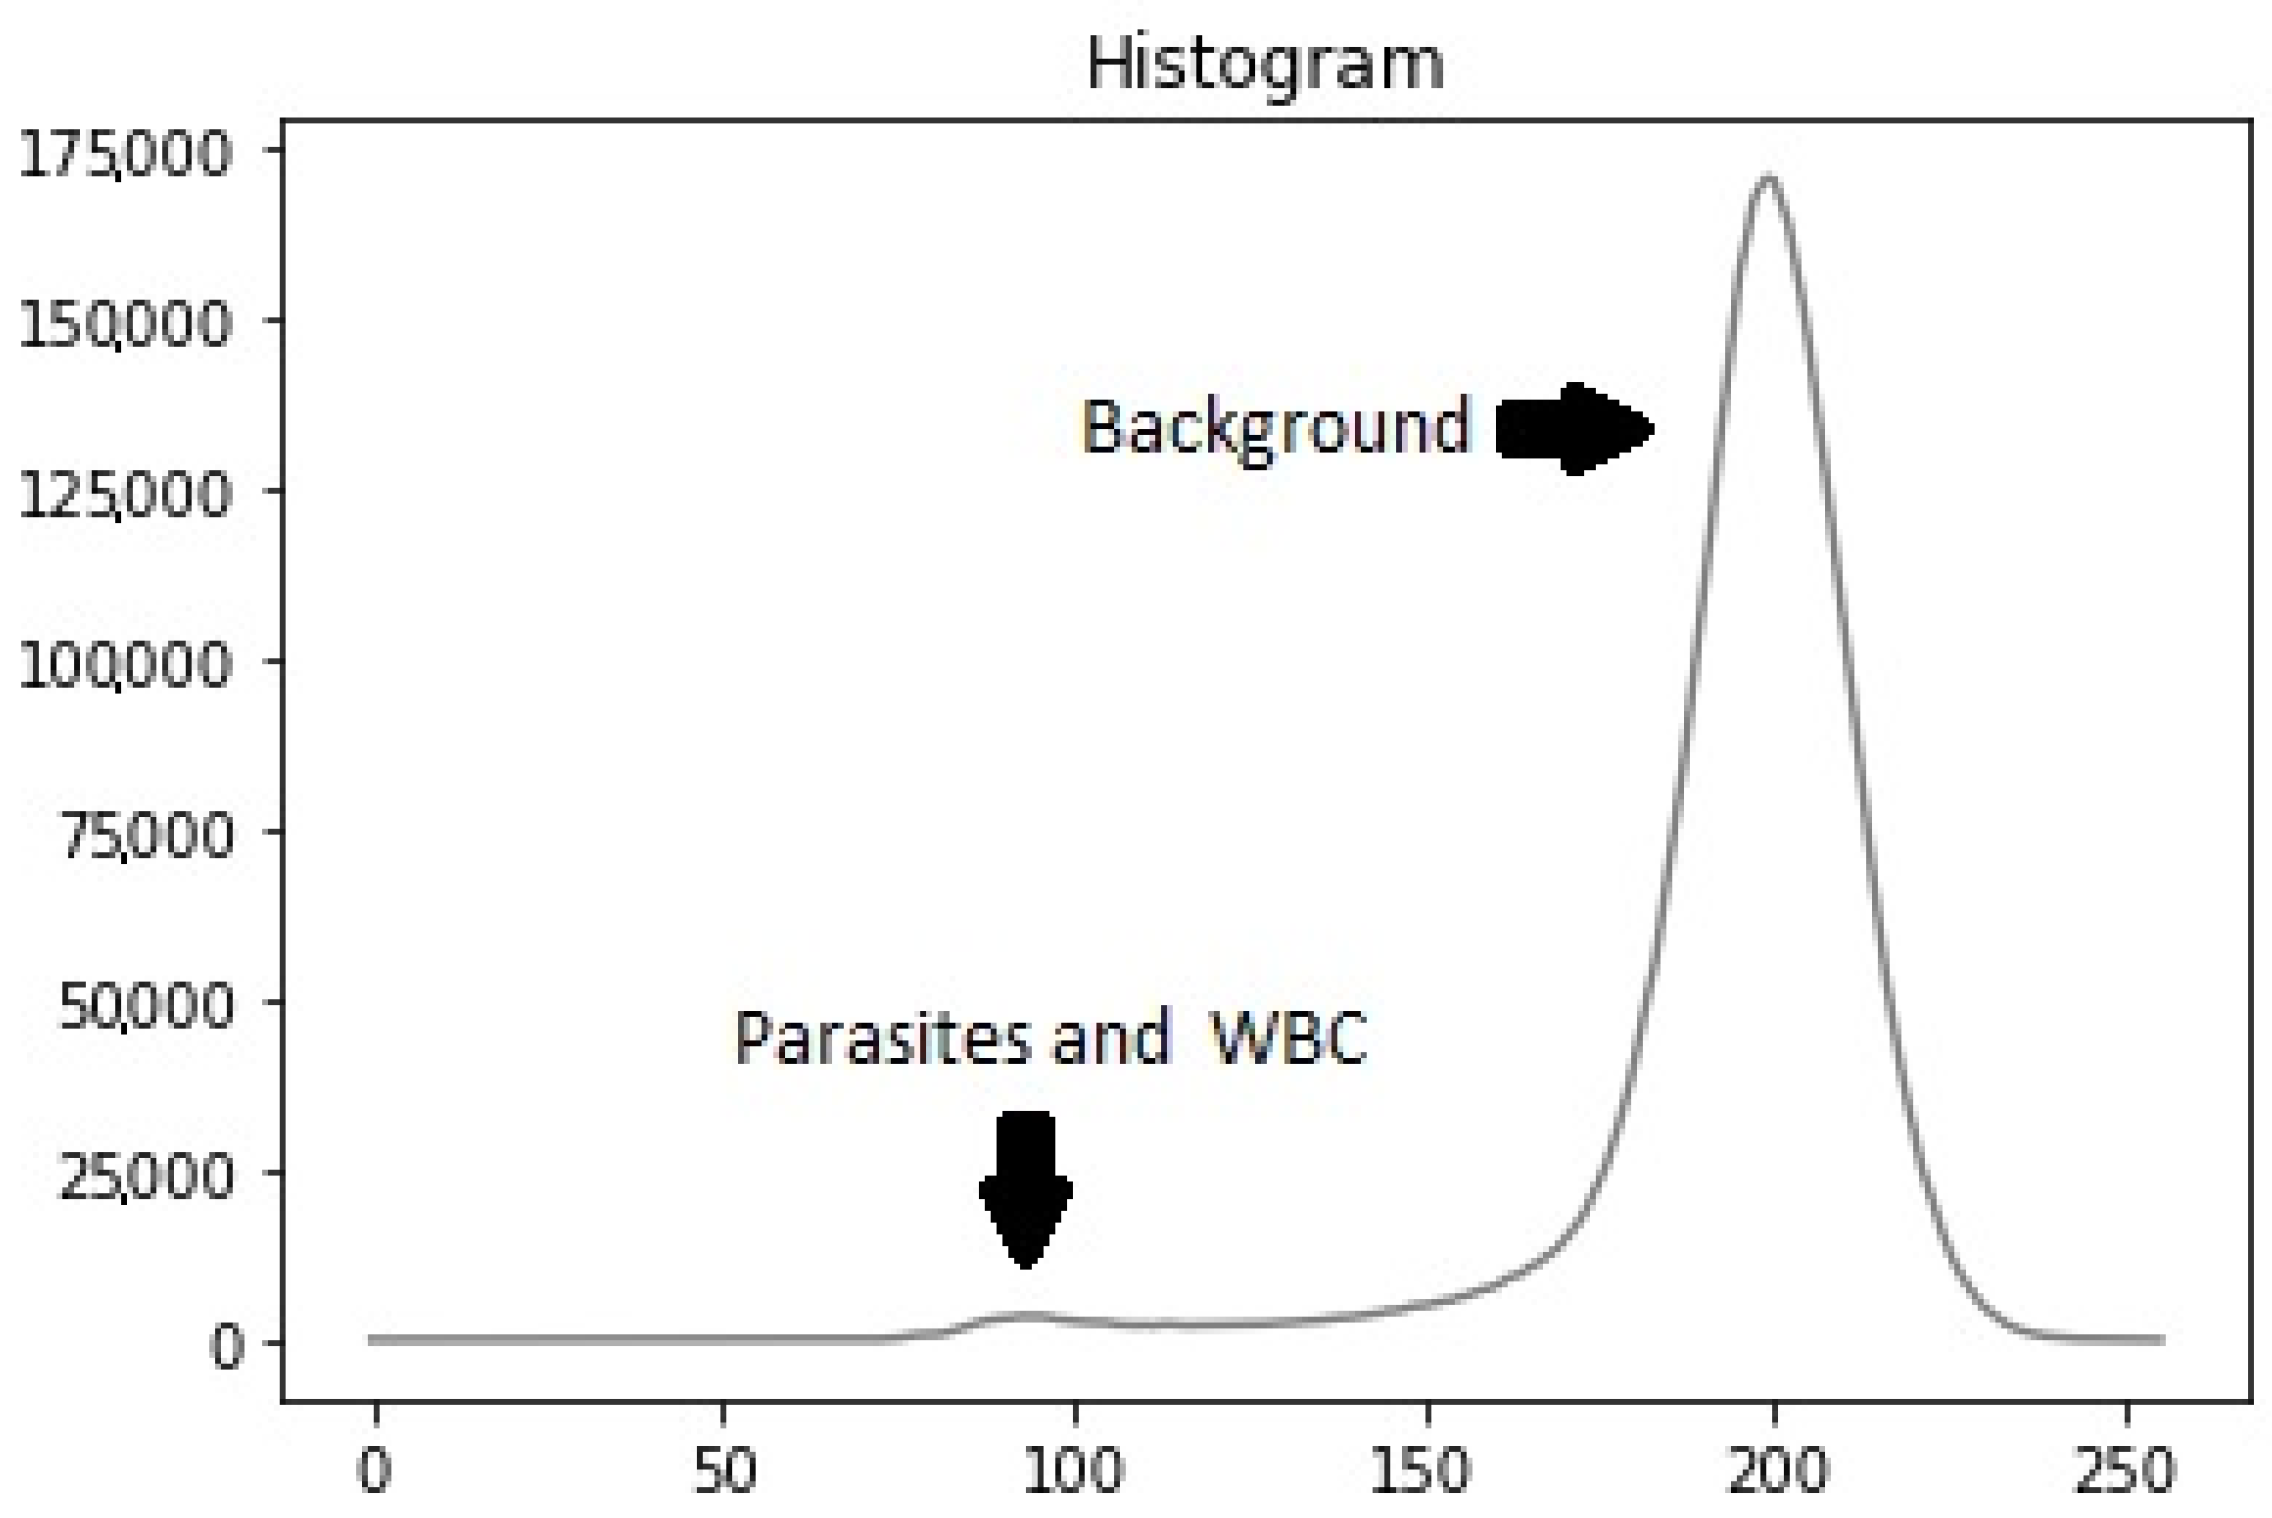
22]. Our dataset’s histogram analysis revealed that particles (leukocytes, parasites, platelets) had low intensity while the background had high intensity, resulting in a bi-modal intensity distribution (
Figure 4). To address this, we used the OTSU method [
23] to generate a binary mask for segmenting stained particles and detecting white blood cells (WBCs), removing the background to simplify the computational process.
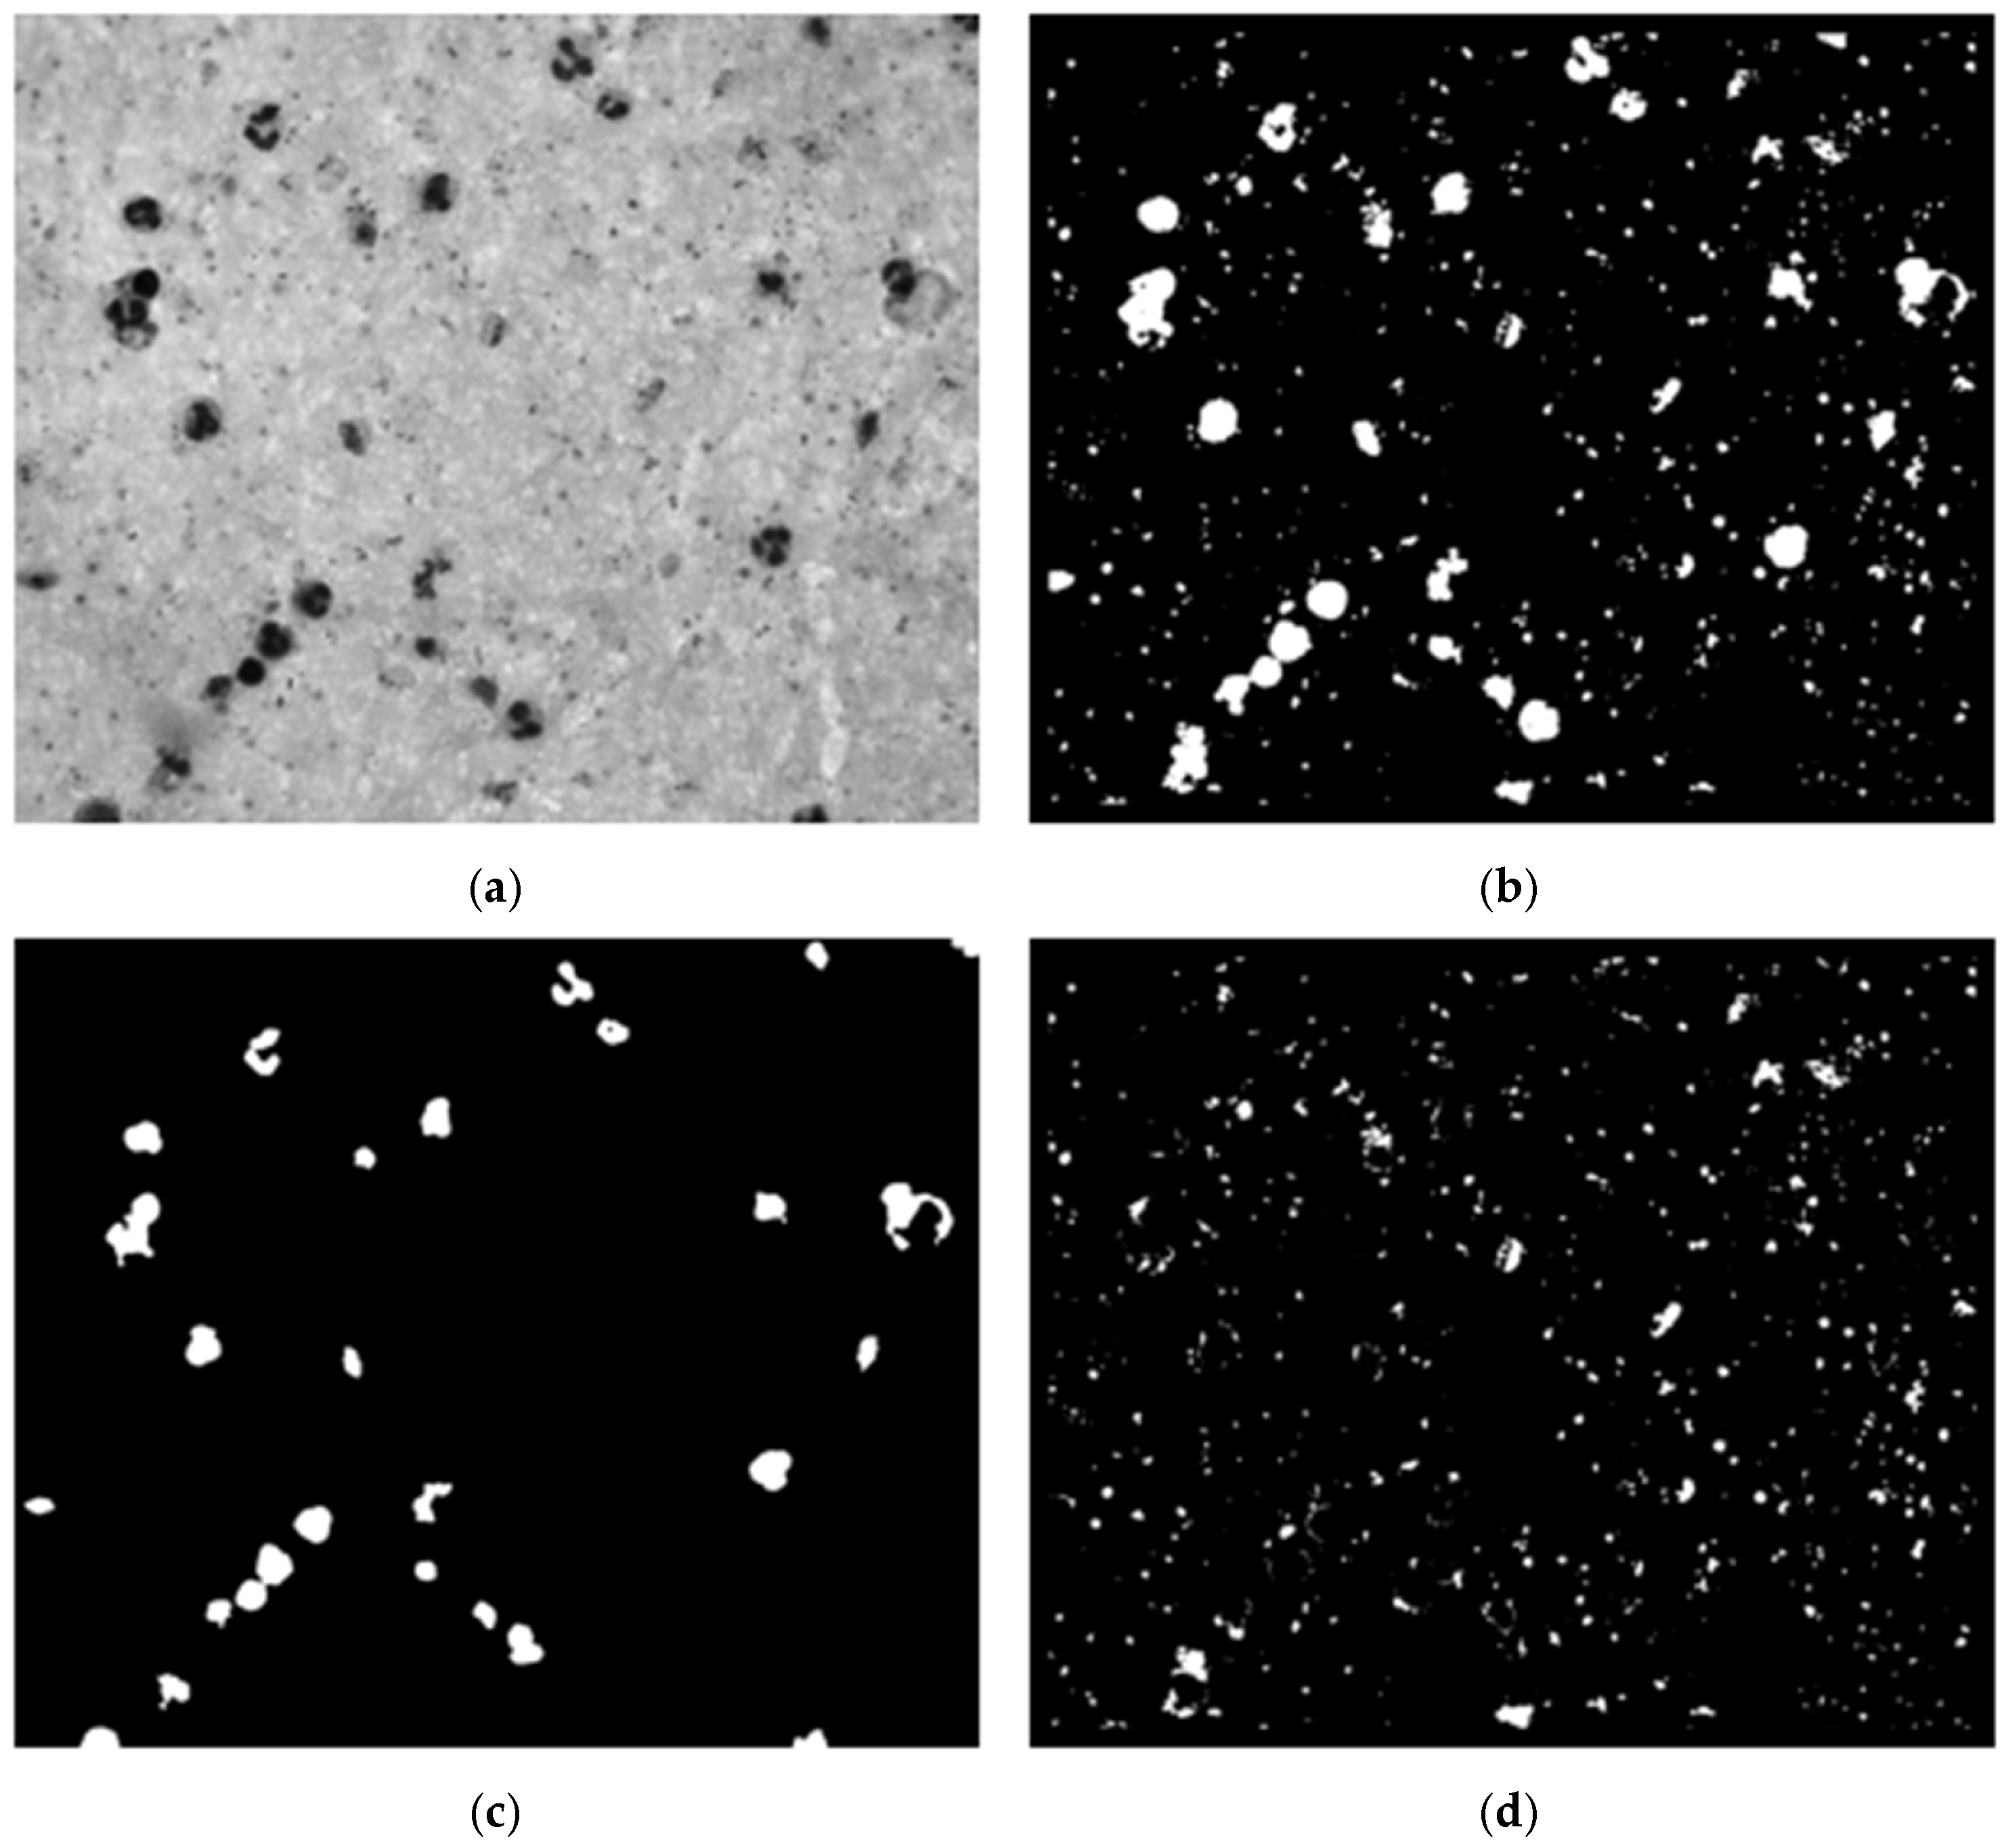
We conducted an experimental design to optimize preprocessing for effective leukocyte segmentation. Various color spaces were evaluated, including grayscale, channels R, G, and B from RGB, and channels S and V from HSV. The filters assessed included low-pass, Gaussian low-pass, median filter, and no filter. The contrast enhancement techniques evaluated were contrast-limited adaptive histogram equalization (CLAHE), contrast stretching, and no contrast enhancement. Using OTSU’s method, a binary mask was generated, followed by noise removal with an erosion function to eliminate small white noises (platelets and parasites) (
Figure 5c). Finally, the connected components algorithm was applied to develop a leukocyte detection and counting algorithm.
Building upon earlier studies focused on thin blood smears, we documented the use of machine learning for leukocyte detection in thick blood smears. The features utilized included geometric [
20,
24,
25,
26,
27], statistical [
20], textural [
20,
28], intensity [
28], and spectrum-based features [
29]. The gray level co-occurrence matrix (GLCM) was used to extract statistical and textural features, while pixel intensity was used to extract intensity features. Three feature groups were created: one with four variations for each GLCM feature, another with twelve variations, and a third consisting of the pixel intensity of a 50 × 50 pixels size image (2500 features vector). Classic machine learning algorithms, including naive Bayes, decision trees, support vector machines (SVM), and k-nearest neighbors (k-NNs), were employed to classify leukocyte candidates as either leukocyte or noise.
2.4. Parasite Detection
We began parasite detection by selecting candidates from high-intensity regions within the image. These candidates were used to train a custom convolutional neural network (CNN) to distinguish parasites from background elements. This approach was computationally efficient as it reduced the data processing size compared with the original image, as outlined by Feng et al. [
30]. Unlike the SVM approach for image quality assessment, CNNs were more suitable for complex tasks such as feature extraction and classification, both essential for parasite detection.
Variations in staining or illumination during blood smear preparation can cause segmentation and classification challenges [
31]. To address these challenges, we optimized preprocessing using an experimental design similar to that for detecting WBCs, minimizing parasite exclusion during segmentation (
Figure 5b). The parameters used were based on prior malaria parasite detection methods to ensure consistency, as documented in review articles [
22,
32].
Using the WBC mask from the previous step, we removed leukocytes from the segmentation mask, retaining candidates predominantly corresponding to parasites, platelets, and some background noise. The segmentation process, illustrated in
Figure 5, included identifying each image segment’s center coordinates. An adaptive bounding box was created around these coordinates, starting at 40 × 40 pixels and dynamically expanding to encompass the entire candidate region until no white pixels were found along the edges. The maximum size of the bounding box was capped at 90 × 90 pixels. Once the bounding box was appropriately sized and positioned, the image was cropped based on the identified contours, retaining only the relevant portion containing the parasite candidate for further analysis.
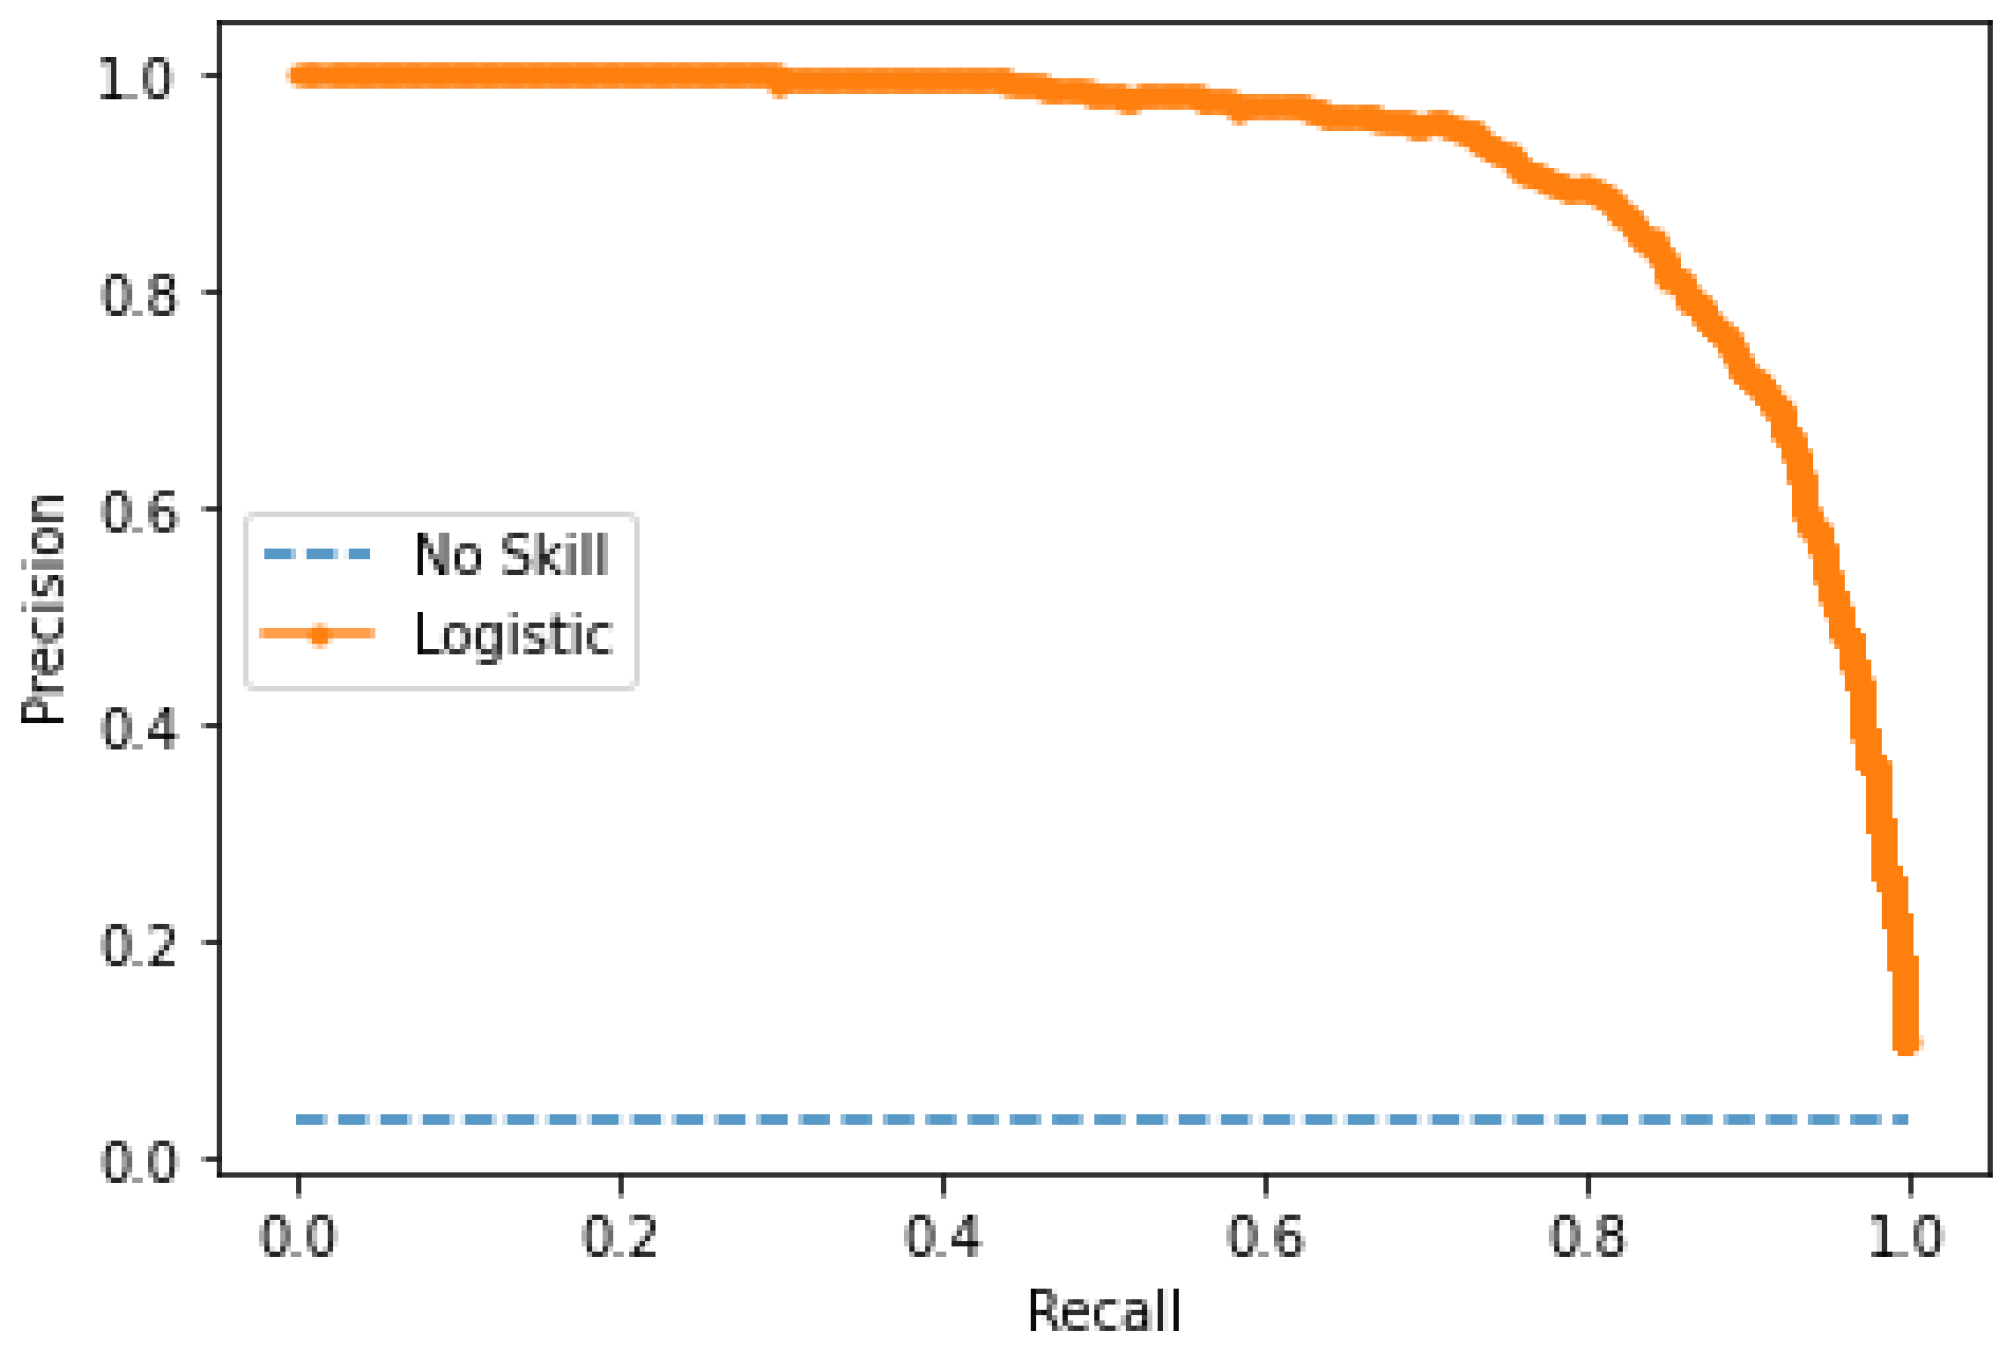
The model’s performance was evaluated using accuracy, precision, recall, and F1-score. These metrics were calculated at multiple stages: image quality assessment, leukocyte detection, and parasite classification. The F1-score was chosen as the primary metric due to its robustness in handling imbalanced datasets. At the same time, precision and recall highlighted the model’s ability to minimize false positives and false negatives.
Training
The model training process involved using the images of parasites within bounding boxes provided by experts. There were 4364 parasites. These parasites were removed from the candidate mask for images with parasites, and the resulting clippings were obtained. Due to class imbalance, data augmentation was applied to the parasite images, including rotations of 90 and 180 degrees, horizontal and vertical flips, and combinations of flips, resulting in 26,184 images. Additionally, subsampling was performed on the non-parasite class to balance the training data.
The CNN model architecture comprised eleven convolutional layers and five max-pooling layers interspersed between each convolutional layer. A normalization batch layer was utilized to facilitate a higher learning rate [
33], followed by rectified linear units (ReLUs) as the activation function [
34]. Subsequently, three fully connected layers were included, with 1024, 512, and 2 hidden units, respectively, followed by a SoftMax layer. Two dropout layers with a dropout ratio of 0.5 were inserted between the fully connected layers to mitigate overfitting [
35]. The output of the CNN model was a vector indicating the likelihood of the input image patch being a parasite or non-parasite.
Furthermore, pre-trained networks such as VGG-19 [
36], MobileNetV2 [
37], and ResNet-50 [
38] were utilized to compare the developed model’s performance.
2.5. Parasite Stage Classification
The CN For the SVM model design, features extracted from histograms in the red and saturation channels were found to be more variable across different parasite stages. Sixteen bins were chosen for each histogram to reduce the dimensionality of the feature vector. Additionally, the number of nuclei was included as a feature, particularly since it exhibits significant variation in schizonts. The presence of parasites and coloration quality were also considered during feature selection. A factorial experiment was conducted to determine the optimal SVM classifier based on factors such as kernel type, gamma, and learning ratio.
Subsequently, various neural network configurations were evaluated for CNN. Initially, different image sizes were evaluated, including [25 × 25], [50 × 50], [100 × 100], and [150 × 150]. After identifying the most suitable layer and convolution distribution, a factorial experiment was conducted, varying parameters such as image scale, learning ratio (ranging from 1 × 10⁻⁴ to 1), batch size (ranging from 20 to 100), and the number of epochs (ranging from 50 to 150). Multiple networks were implemented, including VGG-16, MobileNetV2, and ResNet-50 architectures, with fixed batch sizes of either 50 or 100 and a number of epochs set to either 50 or 100. No frozen layers were utilized for these networks, and an image size of [50 × 50] was employed for evaluation. The evaluation of these models aimed to determine the best-performing network for classifying parasite stages based on their size, shape, and internal structures.
4. Conclusions
In this paper, we presented an automated system for assessing image quality, detecting leukocytes, and detecting and classifying malaria parasites in Romanowsky-stained thick blood smears of Plasmodium vivax. The proposed pipeline integrates feature extraction techniques based on HSV color space and support vector machines (SVMs) for image quality assessment and a custom convolutional neural network (CNN) for parasite detection and classification. These components collectively address key aspects of the malaria diagnostic process.
This study introduces a novel approach by automating image quality estimation and parasite stage classification, areas that have been insufficiently explored in previous research. Integrating image quality analysis in the diagnostic pipeline significantly enhances the accuracy and reliability of malaria detection, even in cases where images may have varied quality.
The results indicate that the SVM achieved a precision of 95% for image quality assessment, while the leukocyte detection yielded an accuracy of 88.92%. For malaria parasite detection, the custom CNN model attained an accuracy of 98.65% and effectively classified parasite stages, with F1-scores of 85% for trophozoites, 88% for schizonts, and 83% for gametocytes.
These findings demonstrate the effectiveness of our system in automating various stages of the malaria diagnostic process, even when working with images of heterogeneous quality. The balance between accuracy and computational efficiency makes it particularly suitable for deployment in resource-constrained environments, where access to advanced computational infrastructure may be limited. This work could reduce the diagnostic burden in malaria-endemic regions, streamline laboratory workflows, and minimize human error in detecting and classifying malaria parasites.
Future work will refine the system to automate all diagnostic steps, enabling more accurate and scalable malaria diagnosis in low-resource settings. This includes integrating smartphone imaging technologies to enhance accessibility in remote areas, expanding the dataset to cover additional Plasmodium species, and improving generalizability across varying staining protocols to further broaden the system’s applicability.


 ,
, 
