

AFN-Net: Adaptive Fusion Nucleus Segmentation Network Based on Multi-Level U-Net


Abstract
1. Introduction
2. Related Work
2.1. Feature Fusion
2.2. Deep Convolution
3. Method
3.1. Network Design
3.2. Weighted Feature Enhancement Unit (WFEU)
3.2.1. Weighted Feature Interaction Unit (WFIU)
3.2.2. Feature Enhancement Unit (FEU)
3.3. Double-Stage Channel Optimization Module (DSCOM)
3.4. Adaptive Fusion Loss Module (AFLM)
4. Experimental Results and Analysis
4.1. Datasets
4.2. Implementations Setting
4.3. Evaluation Metrics
5. Discussion
5.1. Ablation Experiments
5.2. AFLM Weight Coefficient Analysis Experiment
6. Conclusions
Author Contributions
Funding
Institutional Review Board Statement
Informed Consent Statement
Data Availability Statement
Conflicts of Interest
References
- Litjens:, G.; Kooi, T.; Bejnordi, B.E.; Setio, A.A.A.; Ciompi, F.; Ghafoorian, M.; van der Laak, J.A.W.M.; van Ginneken, B.; Sánchez, C.I. A survey on deep learning in medical image analysis. Med. Image Anal. 2017, 42, 60–88. [Google Scholar] [CrossRef] [PubMed]
- Ronneberger, O.; Fischer, P.; Brox, T. U-net: Convolutional networks for biomedical image segmentation. In Proceedings of the Medical Image Computing and Computer- Assisted Intervention-MICCAI 2015: 18th International Conference, Munich, Germany, 5–9 October 2015; Proceedings, Part III 18. Springer International Publishing: Berlin/Heidelberg, Germany, 2015; pp. 234–241. [Google Scholar]
- Isensee, F.; Jäger, P.F.; Full, P.M.; Vollmuth, P.; Maier-Hein, K.H. nnU-Net for brain tumor segmentation. In Proceedings of the Brainlesion: Glioma, Multiple Sclerosis, Stroke and Traumatic Brain Injuries: 6th International Workshop, BrainLes 2020, Held in Conjunction with MICCAI 2020, Lima, Peru, 4 October 2020; Revised Selected Papers, Part. Springer International Publishing: Berlin/Heidelberg, Germany, 2021; pp. 118–132. [Google Scholar]
- Song, A.; Xu, L.; Wang, L.; Wang, B.; Yang, X.; Xu, B.; Yang, B.; Greenwald, S.E. Automatic coronary artery segmentation of CCTA images with an efficient feature-fusion-and-rectification 3D-UNet. IEEE J. Biomed. Health Inform. 2022, 26, 4044–4055. [Google Scholar] [CrossRef] [PubMed]
- Liao, F.; Liang, M.; Li, Z.; Hu, X.; Song, S. Evaluate the malignancy of pulmonary nodules using the 3-d deep leaky noisy-or network. IEEE Trans. Neural Netw. Learn. Syst. 2019, 30, 3484–3495. [Google Scholar] [CrossRef] [PubMed]
- Xing, Z.; Yu, L.; Wan, L.; Han, T.; Zhu, L. NestedFormer: Nested modality-aware transformer for brain tumor segmentation. In Proceedings of the International Conference on Medical NestedFormer: Nested modality-aware transformer for brain tumor segmentation. In Proceedings of the International Conference on Medical Image Computing and Computer-Assisted Intervention, Singapore, 18–22 September 2022; Springer Nature: Cham, Switzerland, 2022; pp. 140–150. [Google Scholar]
- Wang, W.; Chen, C.; Meng, D.; Hong, Y.; Sen, Z.; Li, J. Transbts: Multimodal brain tumor segmentation using transformer. In Proceedings of the International Conference on Medical Image Computing and Computer-Assisted Intervention, Strasbourg, France, 27 September–1 October 2021; Springer: Berlin/Heidelberg, Germany, 2021; pp. 109–119. [Google Scholar]
- Tragakis, A.; Kaul, C.; Murray-Smith, R.; Husmeier, D. The fully convolutional transformer for medical image segmentation. In Proceedings of the IEEE/CVF Winter Conference on Applications of Computer Vision, Waikoloa, HI, USA, 2–7 January 2023; pp. 3660–3669. [Google Scholar]
- Lin, A.; Chen, B.; Xu, J.; Zhang, Z.; Lu, G.; Zhang, D. Ds-transunet: Dual swin transformer u-net for medical image segmentation. IEEE Trans. Instrum. Meas. 2022, 71, 4005615. [Google Scholar] [CrossRef]
- Zhang, Y.; Liu, H.; Hu, Q. Transfuse: Fusing transformers and cnns for medical image segmentation. In Proceedings of the Medical Image Computing and Computer Assisted Intervention-MICCAI 2021: 24th International Conference, Strasbourg, France, 27 September–1 October 2021; Proceedings, Part I 24. Springer International Publishing: Berlin/Heidelberg, Germany, 2021; pp. 14–24. [Google Scholar]
- Ibtehaz, N.; Kihara, D. Acc-unet: A completely convolutional unet model for the 2020s. In Proceedings of the International Conference on Medical Image Computing and Computer-Assisted Intervention, Vancouver, BC, Canada, 8–12 October 2023; Springer Nature: Cham, Switzerland, 2023; pp. 692–702. [Google Scholar]
- Vaswani, A. Attention is all you need. Adv. Neural Inf. Process. Syst. 2017, 30, 6000–6010. [Google Scholar]
- Dosovitskiy, A. An image is worth 16×16 words: Transformers for image recognition at scale. arXiv 2020, arXiv:2010.11929. [Google Scholar]
- Chen, J.; Lu, Y.; Yu, Q.; Luo, X.; Adeli, E.; Wang, Y.; Lu, L.; Yuille, A.L.; Zhou, Y. Transunet: Transformers make strong encoders for medical image segmentation. arXiv 2021, arXiv:2102.04306. [Google Scholar]
- Cao, H.; Wang, Y.; Chen, J.; Jiang, D.; Zhang, X.; Tian, Q.; Wang, M. Swin-unet: Unet-like pure transformer for medical image segmentation. In Proceedings of the European Conference on Computer Vision, Tel Aviv, Israel, 23–27 October 2022; Springer Nature: Cham, Switzerland, 2022; pp. 205–218. [Google Scholar]
- Azad, R.; Heidari, M.; Shariatnia, M.; Aghdam, E.K.; Karimijafarbigloo, S.; Adeli, E.; Merhof, D. Transdeeplab: Convolution-free transformer-based deeplab v3+ for medical image segmentation. In Proceedings of the International Workshop on PRedictive Intelligence in Medicine, Vancouver, BC, Canada, 8 October 2022; Springer Nature: Cham, Switzerland, 2022; pp. 91–102. [Google Scholar]
- Naylor, P.; Laé, M.; Reyal, F.; Walter, T. Segmentation of nuclei in histopathology images by deep regression of the distance map. IEEE Trans. Med. Imaging 2018, 38, 448–459. [Google Scholar] [CrossRef]
- Yu, X.; Li, G.; Lou, W.; Liu, S.; Wan, X.; Chen, Y.; Li, H. Diffusion-based data augmentation for nuclei image segmentation. In Proceedings of the International Conference on Medical Image Computing and Computer-Assisted Intervention, Vancouver, BC, Canada, 8–12 October 2023; Springer Nature: Cham, Switzerland, 2023; pp. 592–602. [Google Scholar]
- Otsu, N. A threshold selection method from gray-level histograms. Automatica 1975, 11, 23–27. [Google Scholar] [CrossRef]
- Canny, J. A computational approach to edge detection. IEEE Trans. Pattern Anal. Mach. Intell. 1986, 8, 679–698. [Google Scholar] [CrossRef]
- He, H.; Zhang, C.; Chen, J.; Geng, R.; Chen, L.; Liang, Y.; Lu, Y.; Wu, J.; Xu, Y. A hybrid-attention nested UNet for nuclear segmentation in histopathological images. Front. Mol. Biosci. 2021, 8, 614174. [Google Scholar] [CrossRef]
- Ahmad, I.; Xia, Y.; Cui, H.; Islam, Z.U. DAN-NucNet: A dual attention based framework for nuclei segmentation in cancer histology images under wild clinical conditions. Expert Syst. Appl. 2023, 213, 118945. [Google Scholar] [CrossRef]
- Vahadane, A.; Atheeth, B.; Majumdar, S. Dual encoder attention u-net for nuclei segmentation. In Proceedings of the 2021 43rd Annual International Conference of the IEEE Engineering in Medicine & Biology Society (EMBC), Virtual, 1–5 November 2021; pp. 3205–3208. [Google Scholar]
- He, Z.; Unberath, M.; Ke, J.; Shen, Y. Transnuseg: A lightweight multi-task transformer for nuclei segmentation. In Proceedings of the International Conference on Medical Image Computing and Computer-Assisted Intervention, Vancouver, BC, Canada, 8–12 October 2023; Springer Nature: Cham, Switzerland, 2023; pp. 206–215. [Google Scholar]
- Ilyas, T.; Mannan, Z.I.; Khan, A.; Azam, S.; Kim, H.; De Boer, F. TSFD-Net: Tissue specific feature distillation network for nuclei segmentation and classification. Neural Netw. 2022, 151, 1–15. [Google Scholar] [CrossRef]
- Zhang, Y.; Higashita, R.; Fu, H.; Xu, Y.; Zhang, Y.; Liu, H.; Zhang, J.; Liu, J. A multi-branch hybrid transformer network for corneal endothelial cell segmentation. In Proceedings of the Medical Image Computing and Computer Assisted Intervention-MICCAI 2021: 24th International Conference, Strasbourg, France, 27 September–1 October 2021; Proceedings, Part I 24. Springer International Publishing: Berlin/Heidelberg, Germany, 2021; pp. 99–108. [Google Scholar]
- Mei, M.; Wei, Z.; Hu, B.; Wang, M.; Mei, L.; Ye, Z. DAT-Net: Deep Aggregation Transformer Network for automatic nuclear segmentation. Biomed. Signal Process. Control. 2024, 98, 106764. [Google Scholar] [CrossRef]
- Ye, Z.; Hu, B.; Sui, H.; Mei, M.; Mei, L.; Zhou, R. DSCA-Net: Double-stage Codec Attention Network for automatic nuclear segmentation. Biomed. Signal Process. Control. 2024, 88, 105569. [Google Scholar] [CrossRef]
- Zhou, Z.; Rahman Siddiquee, M.M.; Tajbakhsh, N.; Liang, J. Unet++: A nested u-net architecture for medical image segmentation. In Proceedings of the Deep Learning in Medical Image Analysis and Multimodal Learning for Clinical Decision Support: 4th International Workshop, DLMIA 2018, and 8th International Workshop, ML-CDS 2018, Held in Conjunction with MICCAI 2018, Granada, Spain, 20 September 2018; Proceedings 4. Springer International Publishing: Berlin/Heidelberg, Germany, 2018; pp. 3–11. [Google Scholar]
- Oktay, O. Attention u-net: Learning where to look for the Pancreas. arXiv 2018, arXiv:1804.03999. [Google Scholar]
- Valanarasu, J.M.J.; Patel, V.M. Unext: Mlp-based rapid medical image segmentation network. In Proceedings of the International Conference on Medical Image Computing, Singapore, 18–22 September 2022; Springer Nature: Cham, Switzerland, 2022; pp. 23–33. [Google Scholar]
- Ates, G.C.; Mohan, P.; Celik, E. Dual cross-attention for medical image segmentation. Eng. Appl. Artif. Intell. 2023, 126, 107139. [Google Scholar] [CrossRef]
- Zhao, X.; Jia, H.; Pang, Y.; Lv, L.; Tian, F.; Zhang, L.; Sun, W.; Lu, H. M2 SNet: Multi-scale in multi-scale subtraction network for medical image segmentation. arXiv 2023, arXiv:2303.10894. [Google Scholar]
- Chollet, F. Xception: Deep learning with depthwise separable convolutions. In Proceedings of the IEEE Conference on Computer Vision and Pattern Recognition, Honolulu, HI, USA, 21–26 July 2017; pp. 1251–1258. [Google Scholar]
- Howard, A.; Sandler, M.; Chu, G.; Chen, L.C.; Chen, B.; Tan, M.; Wang, W.; Zhu, Y.; Pang, R.; Vasudevan, V.; et al. Searching for mobilenetv3. In Proceedings of the IEEE/CVF International Conference on Computer Vision, Seoul, Republic of Korea, 27 October–2 November 2019; pp. 1314–1324. [Google Scholar]
- Tan, M.; Le, Q. Efficientnetv2: Smaller models and faster training. In Proceedings of the International Conference on Machine Learning, Virtual, 18–24 July 2021; pp. 10096–10106. [Google Scholar]
- Magadza, T.; Viriri, S. Brain tumor segmentation using partial depthwise separable convolutions. IEEE Access 2022, 10, 124206–124216. [Google Scholar] [CrossRef]
- Dutande, P.; Baid, U.; Talbar, S. Deep residual separable convolutional neural network for lung tumor segmentation. Comput. Biol. Med. 2022, 141, 105161. [Google Scholar] [CrossRef] [PubMed]
- Huang, Z.; Zhou, P.; Yan, S.; Lin, L. Scalelong: Towards more stable training of diffusion model via scaling network long skip connection. Adv. Neural Inf. Process. Syst. 2023, 36, 70376–70401. [Google Scholar]
- Ma, J.; Chen, J.; Ng, M.; Huang, R.; Li, Y.; Li, C.; Yang, X.; Martel, A.L. Loss odyssey in medical image segmentation. Med. Image Anal. 2021, 71, 102035. [Google Scholar] [CrossRef] [PubMed]


| Model | Params | GMac | IOU | Dice | Precision | Recall |
|---|---|---|---|---|---|---|
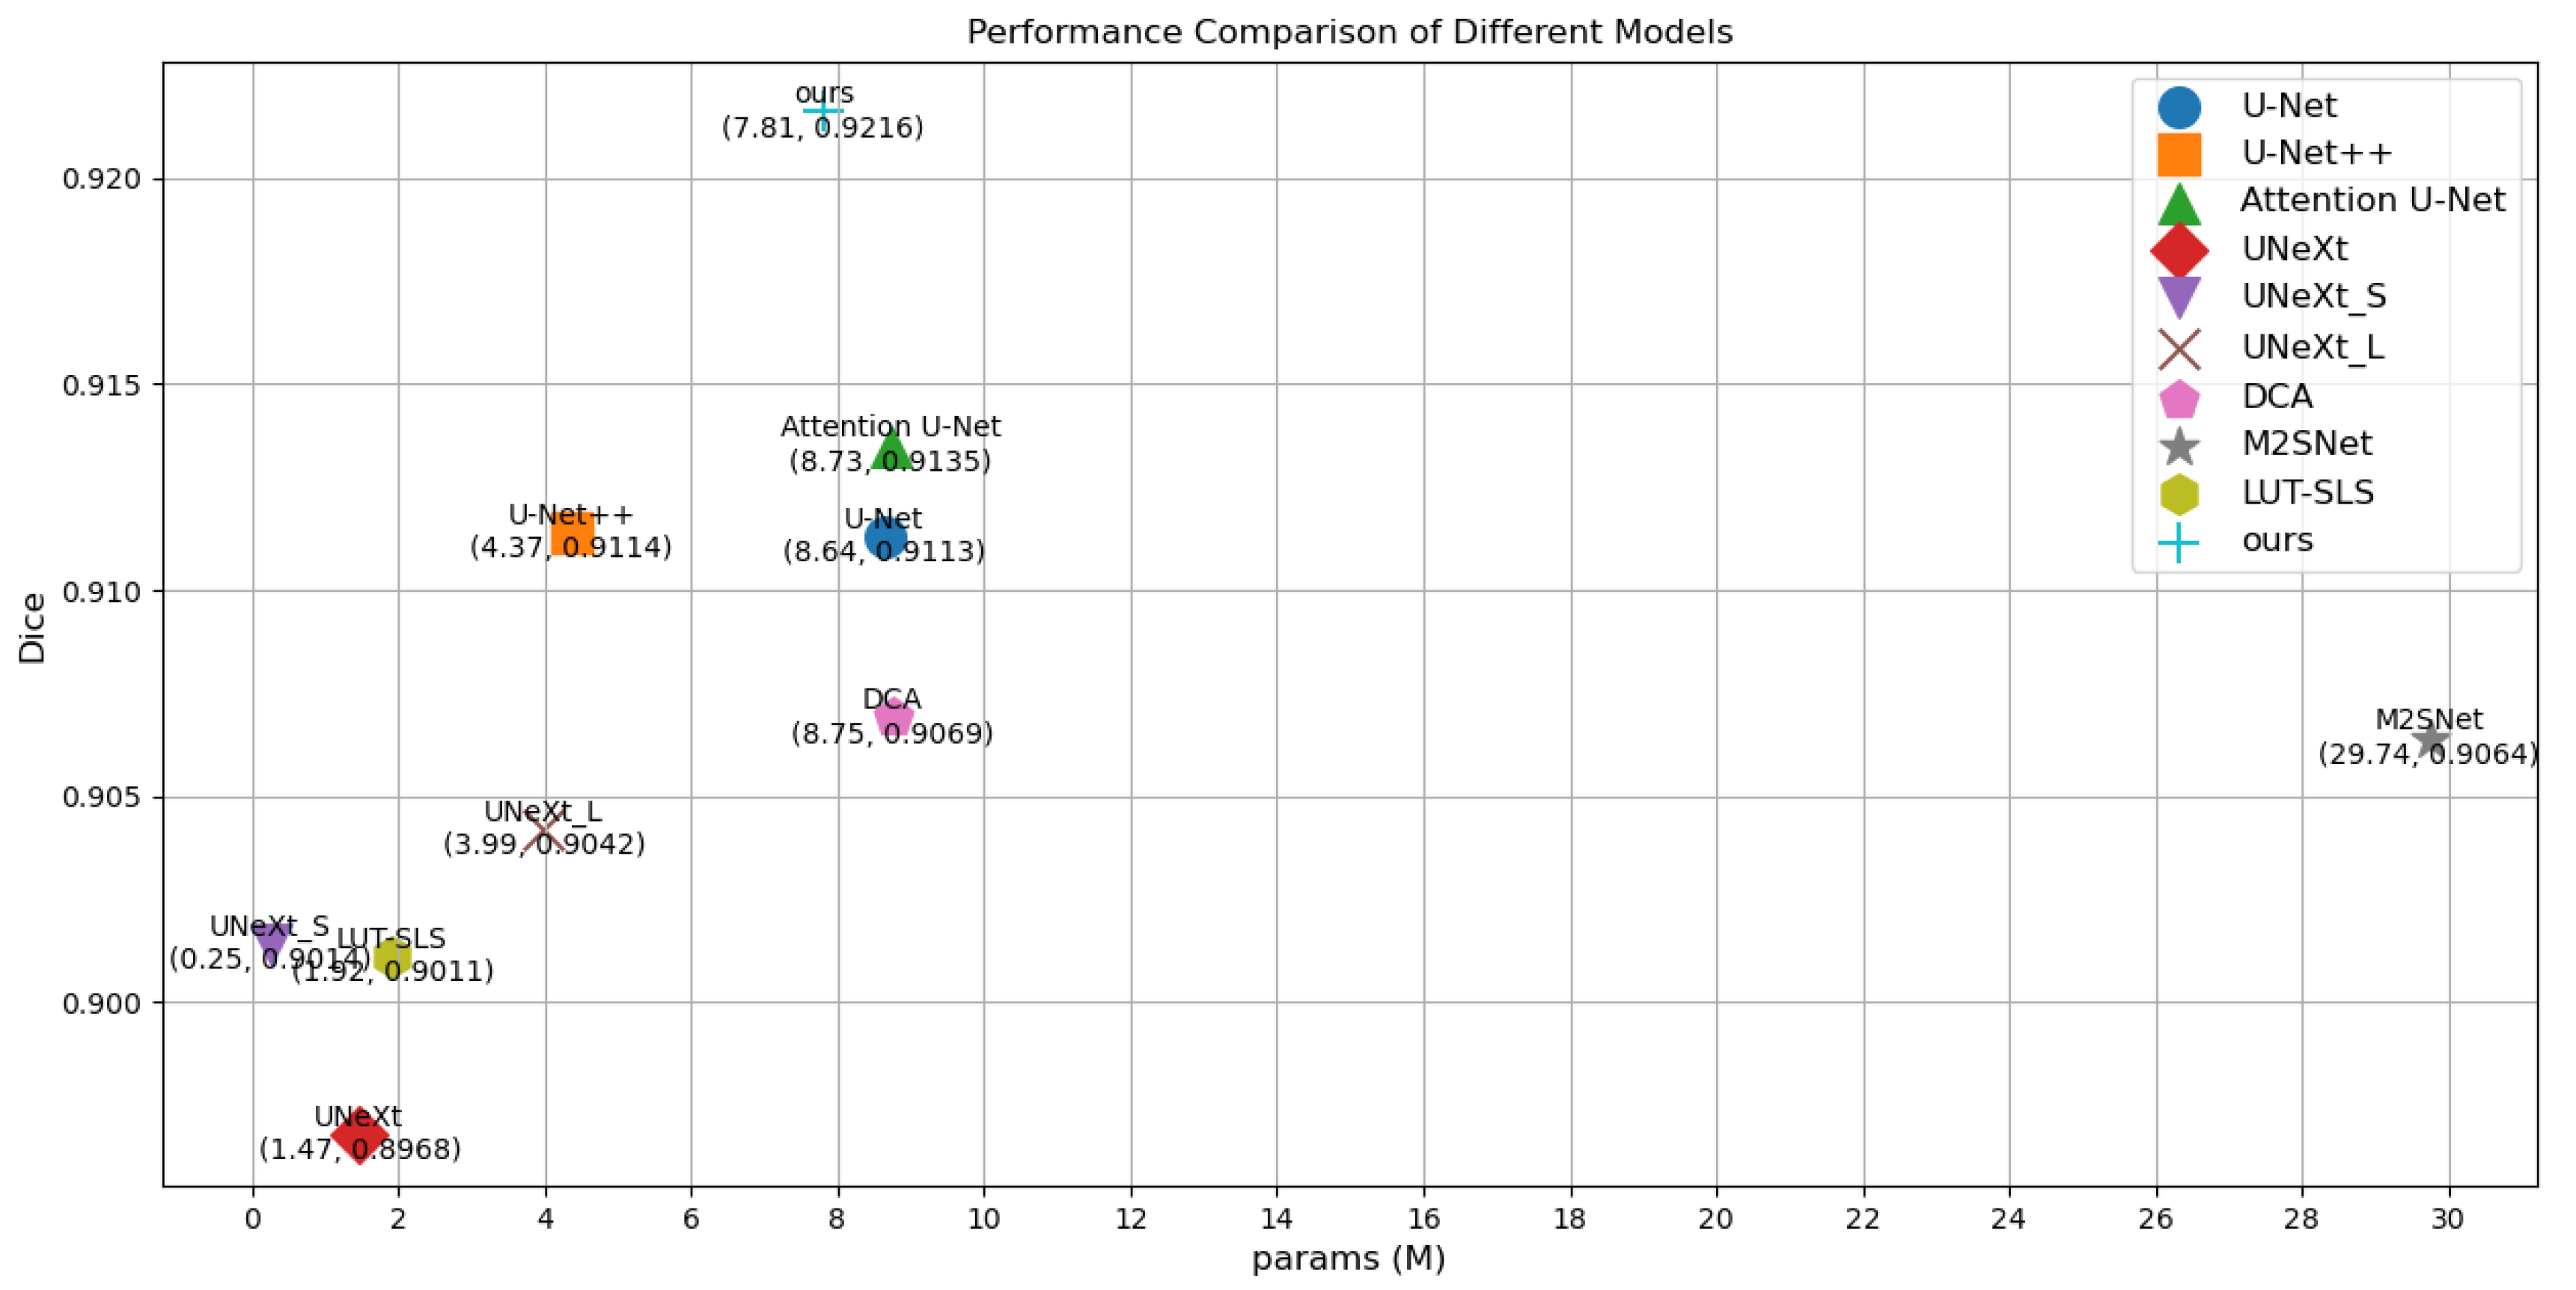
| U-Net (2015) | 8.64 | 16.46 | 0.8572 | 0.9113 | 0.9204 | 0.9258 |
| U-Net++ (2018) | 4.36 | 31.03 | 0.8572 | 0.9114 | 0.9132 | 0.9332 |
| Attention U-Net (2018) | 8.73 | 16.74 | 0.8614 | 0.9135 | 0.9204 | 0.9306 |
| UNeXt_S (2022) | 0.25 | 0.10 | 0.8318 | 0.8968 | 0.8999 | 0.9164 |
| UneXt (2022) | 1.47 | 0.57 | 0.8399 | 0.9014 | 0.9004 | 0.9255 |
| UNeXt_L (2022) | 3.99 | 1.42 | 0.8432 | 0.9042 | 0.9031 | 0.9272 |
| DCA (2023) | 8.75 | 16.77 | 0.8555 | 0.9069 | 0.9144 | 0.9299 |
| M2Snet (2023) | 29.74 | 9.0 | 0.8478 | 0.9064 | 0.9072 | 0.9282 |
| LUT-SLS (2024) | 1.92 | 0.74 | 0.8449 | 0.9011 | 0.9011 | 0.9308 |
| Ours | 7.81 | 15.04 | 0.8660 | 0.9216 | 0.9223 | 0.9342 |
| Model | Params | GMac | IOU | Dice |
|---|---|---|---|---|
| U-Net (2015) | 8.64 | 12.60 | 0.6422 | 0.7731 |
| U-Net++ (2018) | 4.36 | 23.76 | 0.6402 | 0.7762 |
| Attention U-Net (2018) | 8.73 | 12.82 | 0.5228 | 0.6689 |
| BiO-Net (2020) | 14.97 | 27.44 | 0.6121 | 0.7483 |
| UNeXt_S (2022) | 0.25 | 0.08 | 0.5621 | 0.7107 |
| UneXt (2022) | 1.47 | 0.44 | 0.5659 | 0.7176 |
| UNeXt_L (2022) | 3.99 | 1.09 | 0.5897 | 0.7322 |
| MALUNet (2022) | 0.18 | 0.67 | 0.5069 | 0.6693 |
| UCTransNet (2022) | 66.43 | 32.93 | 0.6093 | 0.7497 |
| ACC-Unet (2023) | 16.77 | 45.25 | 0.6172 | 0.7519 |
| LUT-SLS (2024) | 2.06 | 0.57 | 0.5819 | 0.7285 |
| Ours | 7.81 | 11.52 | 0.6538 | 0.7852 |
| Model | IOU | Dice | SPE |
|---|---|---|---|
| WFEU | 0.8614 | 0.9138 | 0.9841 |
| DSCOM | 0.8655 | 0.9158 | 0.9857 |
| AFLM | 0.8660 | 0.9216 | 0.9859 |
| Proportion of Weight Coefficient (BCE:Dice:Boundary) | IOU | Dice | Precision | Recall | SPE |
|---|---|---|---|---|---|
| 1:1:0 | 0.8655 | 0.9158 | 0.9205 | 0.9352 | 0.9857 |
| 1:0:1 | 0.8623 | 0.9074 | 0.9245 | 0.9272 | 0.9866 |
| 0:1:1 | 0.8607 | 0.9226 | 0.9192 | 0.9311 | 0.9856 |
| 1:1:1 | 0.8647 | 0.9170 | 0.9216 | 0.9335 | 0.9858 |
| 0.5:1:1 | 0.8634 | 0.9188 | 0.9128 | 0.9411 | 0.9841 |
| 1:1:0.5 | 0.8621 | 0.9152 | 0.9144 | 0.9377 | 0.9844 |
| 0.5:1:0.5 | 0.8617 | 0.9177 | 0.9083 | 0.9436 | 0.9830 |
| 0.5:2:2 | 0.8635 | 0.9216 | 0.9175 | 0.9362 | 0.9851 |
| :: | 0.8660 | 0.9216 | 0.9223 | 0.9342 | 0.9859 |
Disclaimer/Publisher’s Note: The statements, opinions and data contained in all publications are solely those of the individual author(s) and contributor(s) and not of MDPI and/or the editor(s). MDPI and/or the editor(s) disclaim responsibility for any injury to people or property resulting from any ideas, methods, instructions or products referred to in the content. |
© 2025 by the authors. Licensee MDPI, Basel, Switzerland. This article is an open access article distributed under the terms and conditions of the Creative Commons Attribution (CC BY) license (https://creativecommons.org/licenses/by/4.0/).
Share and Cite
Zhao, M.; Yang, Y.; Zhou, B.; Wang, Q.; Li, F. AFN-Net: Adaptive Fusion Nucleus Segmentation Network Based on Multi-Level U-Net. Sensors 2025, 25, 300. https://doi.org/10.3390/s25020300
Zhao M, Yang Y, Zhou B, Wang Q, Li F. AFN-Net: Adaptive Fusion Nucleus Segmentation Network Based on Multi-Level U-Net. Sensors. 2025; 25(2):300. https://doi.org/10.3390/s25020300
Chicago/Turabian StyleZhao, Ming, Yimin Yang, Bingxue Zhou, Quan Wang, and Fu Li. 2025. "AFN-Net: Adaptive Fusion Nucleus Segmentation Network Based on Multi-Level U-Net" Sensors 25, no. 2: 300. https://doi.org/10.3390/s25020300
APA StyleZhao, M., Yang, Y., Zhou, B., Wang, Q., & Li, F. (2025). AFN-Net: Adaptive Fusion Nucleus Segmentation Network Based on Multi-Level U-Net. Sensors, 25(2), 300. https://doi.org/10.3390/s25020300