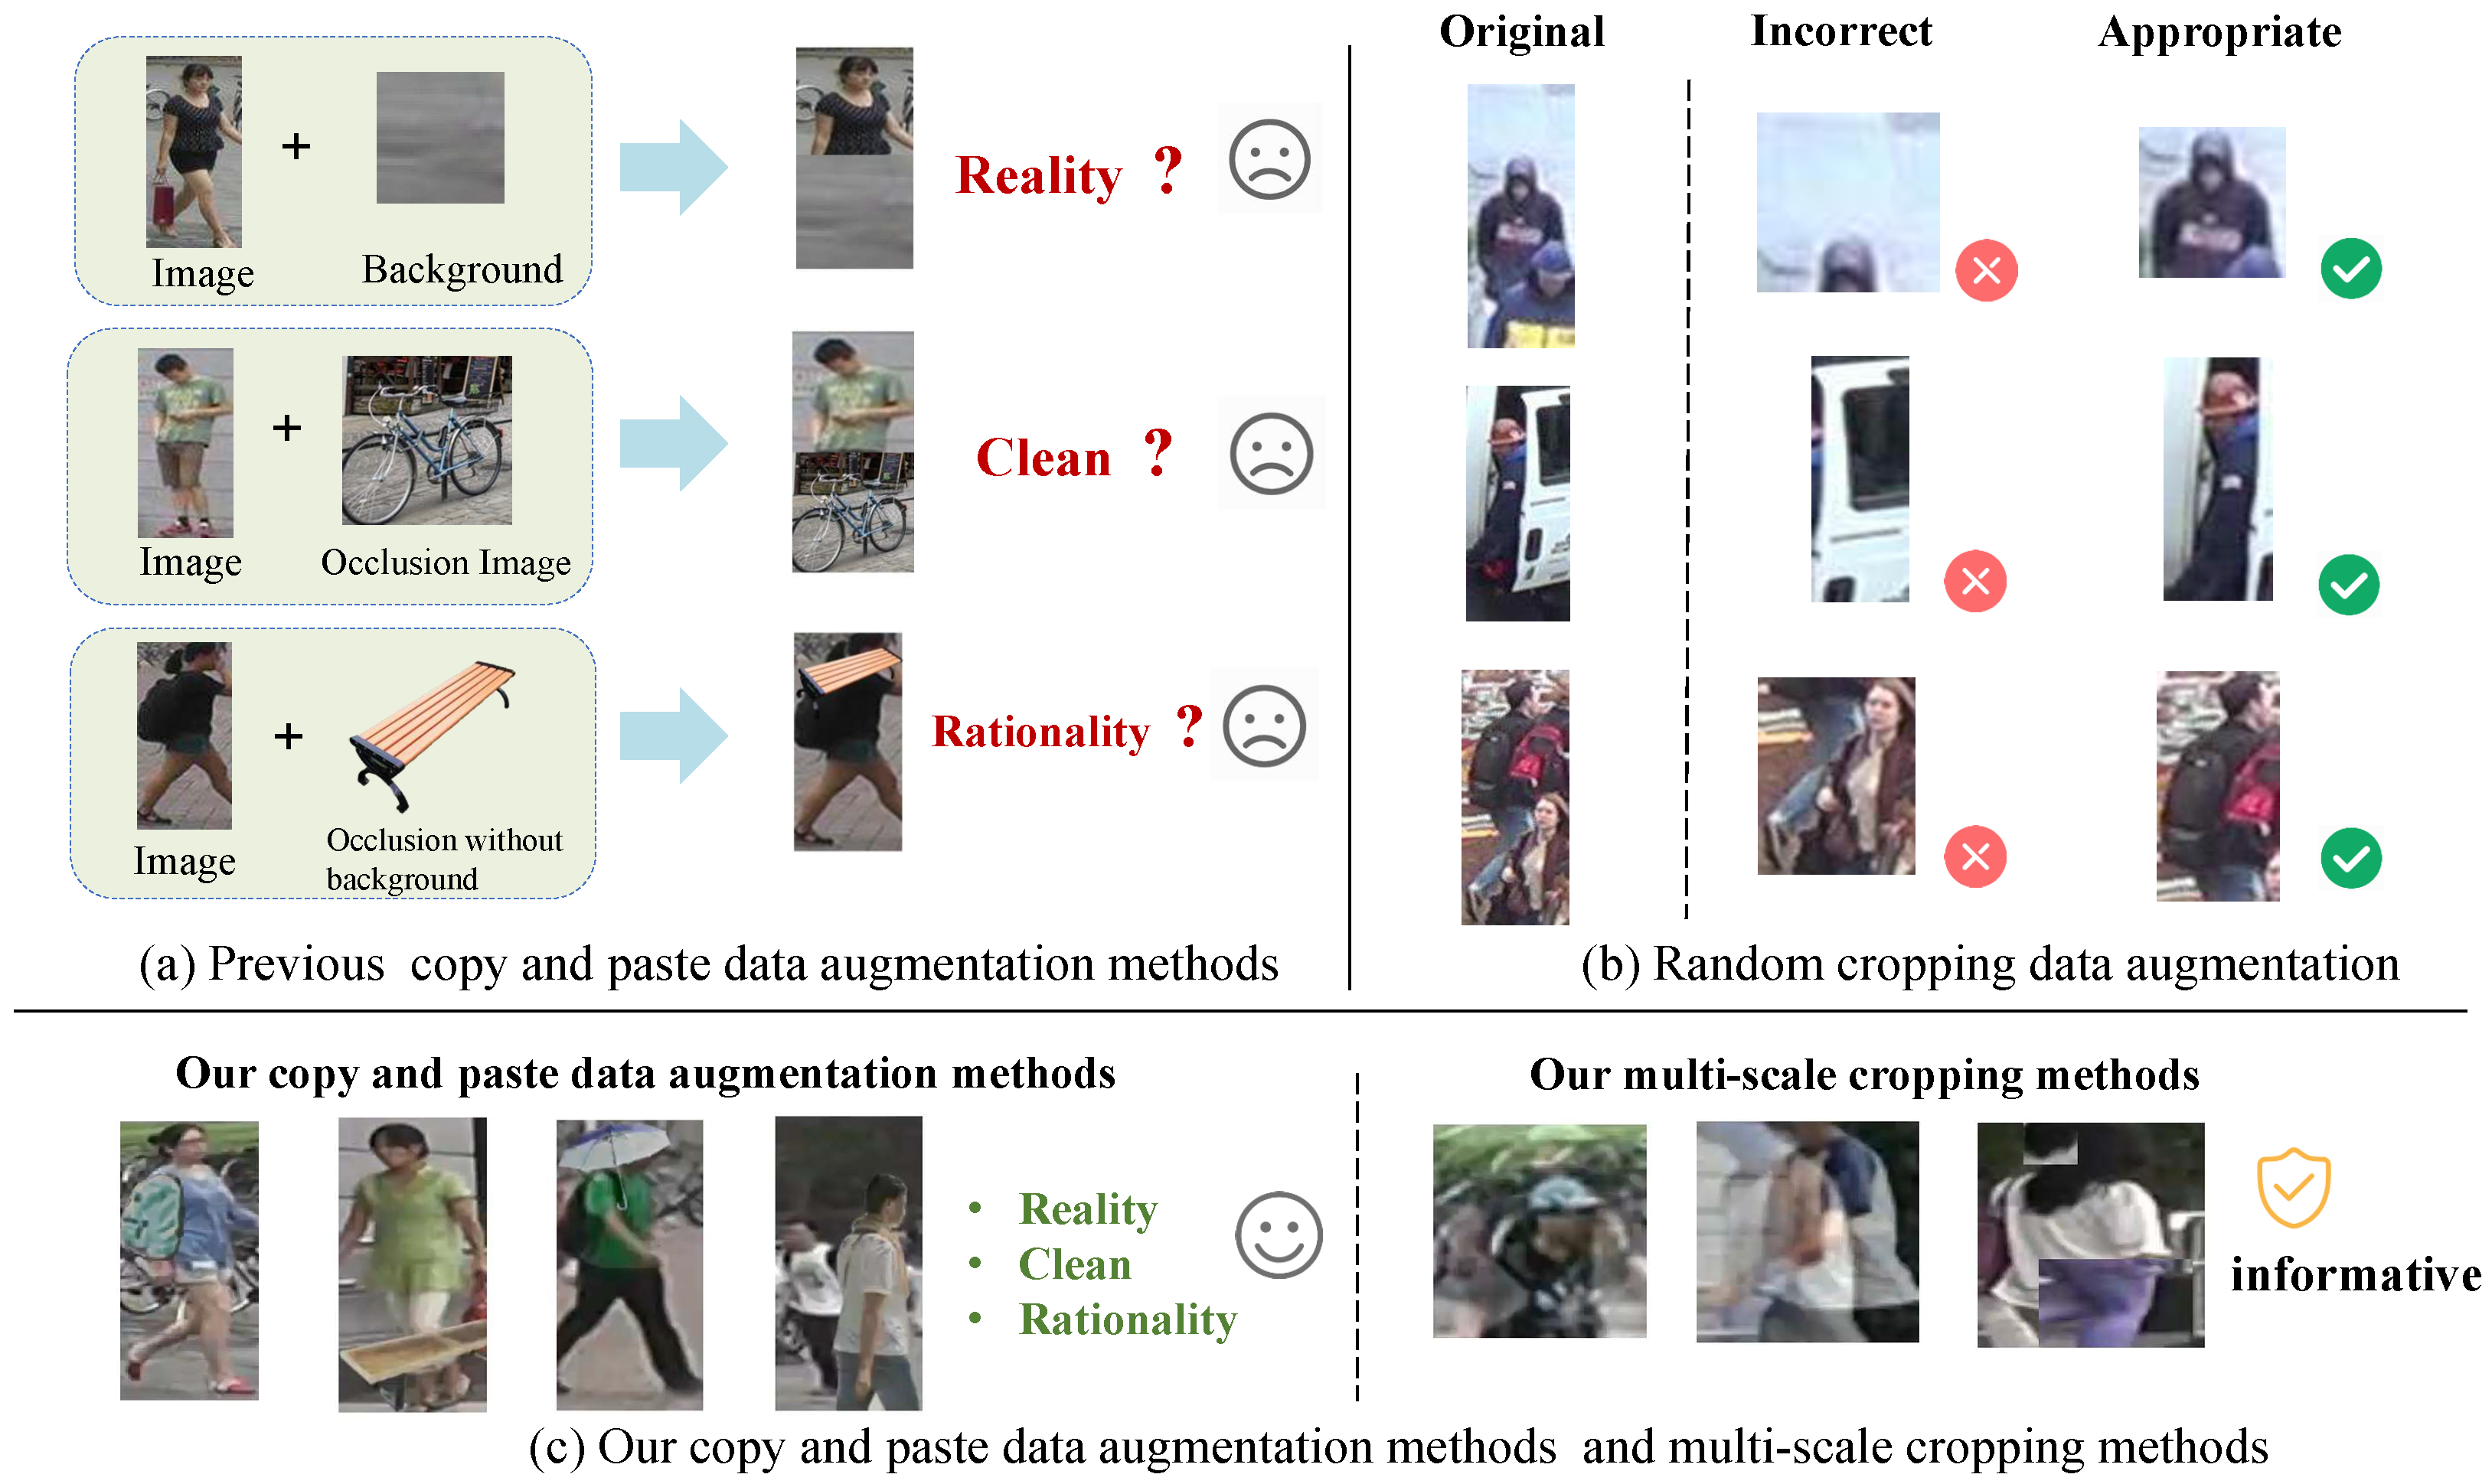
One of the challenges of person Re-ID tasks is that there are various occlusions in real-world scenes. Unlike previous occlusion enhancement methods, our method can simulate more realistic occlusion. As shown in
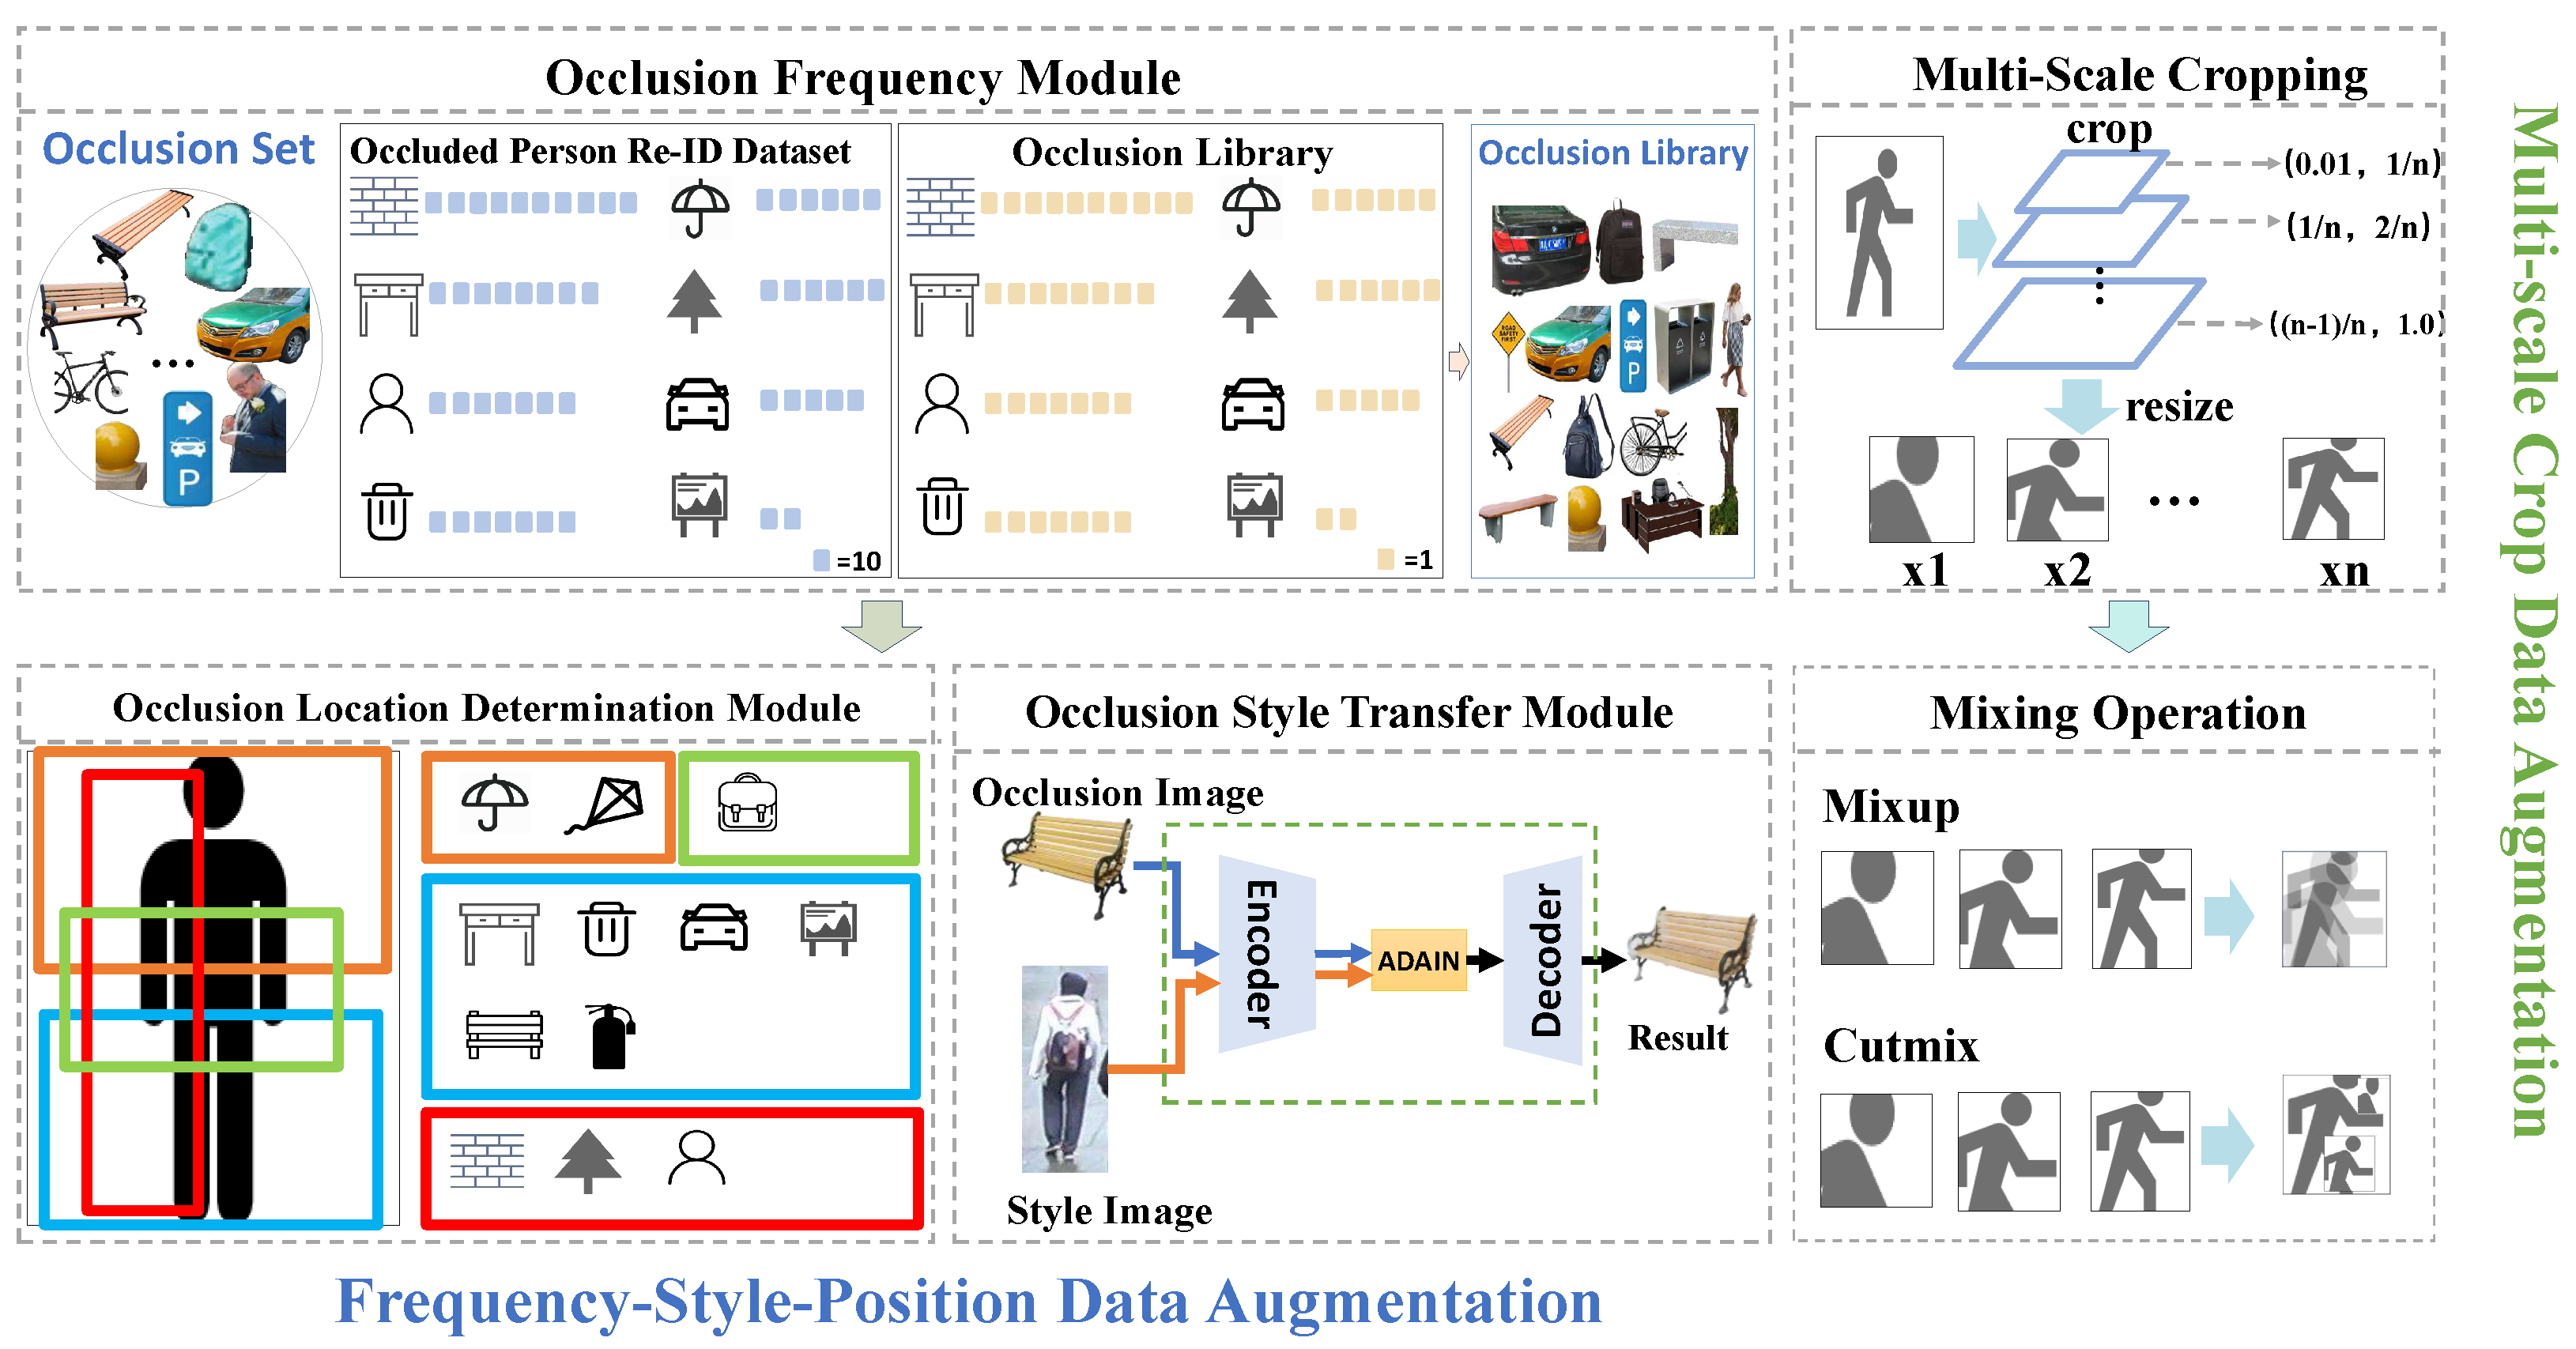
Figure 3, our data augmentation scheme consists of two main parts. One is the Frequency–Style–Position Data Augmentation (FSPDA) mechanism based on real-world scene distributions, which is further divided into frequency setting, style setting, and location setting. The other is a two-stage Multi-Scale Crop Data Augmentation Data Augmentation (MSCDA), which [
34] includes two main parts: multi-scale cropping and image mixing.
3.1. Occlusion Frequency Setting
Occlusion Library: To simulate occlusions in the real world, we have established an occlusion set. First, by integrating the distribution patterns and occurrence frequencies of occluders in real-world scenarios, we identified 19 high-frequency common object categories as the core screening criteria through manual statistics and filtering. These categories cover key occluder types, such as pedestrians, various motor vehicles and non-motor vehicles, umbrellas, and backpacks. Based on the aforementioned identified object categories, we performed precise screening and fusion of the base datasets: we extracted samples containing these 19 categories of objects from the training set of the Occluded-Duke [
35] dataset and simultaneously selected images covering these object categories from the training set of the COCO [
34] dataset. The two types of screened data were integrated to form the base data pool for dataset construction.
Subsequently, the Mask RCNN [
36] algorithm was adopted for targeted processing of the object instances in the fused dataset. The core objective was to strip the image background, accurately extract the occluder entities corresponding to the 19 object categories, and synchronously obtain the bounding box information of each occluder. To further improve data quality, manual supplementary correction was additionally conducted on images with suboptimal processing results from the Mask RCNN algorithm (e.g., blurred edges of occluders or incomplete entity extraction), ensuring the extraction accuracy of each occluder entity.
Meanwhile, unlike previous studies that randomly set the proportions of various occluders in the occluder set, we have designed an Occlusion Frequency Module to adjust the occurrence frequency of different types of occluders.
Figure 3 illustrates how it adjusts the occlusion set into the occlusion library based on the frequency of occluders.
Occlusion Frequency Module: Let there be n = 19 different categories of occluders in the dataset. Suppose the frequency of the i-th category of occluder appearing in the dataset is
(i = 1, 2, …, m). In our occluder library, we adjust the quantity
of the i-th category of occluder according to these frequencies
. Specifically, let the total quantity of the occluder library be
. The formula can be expressed as
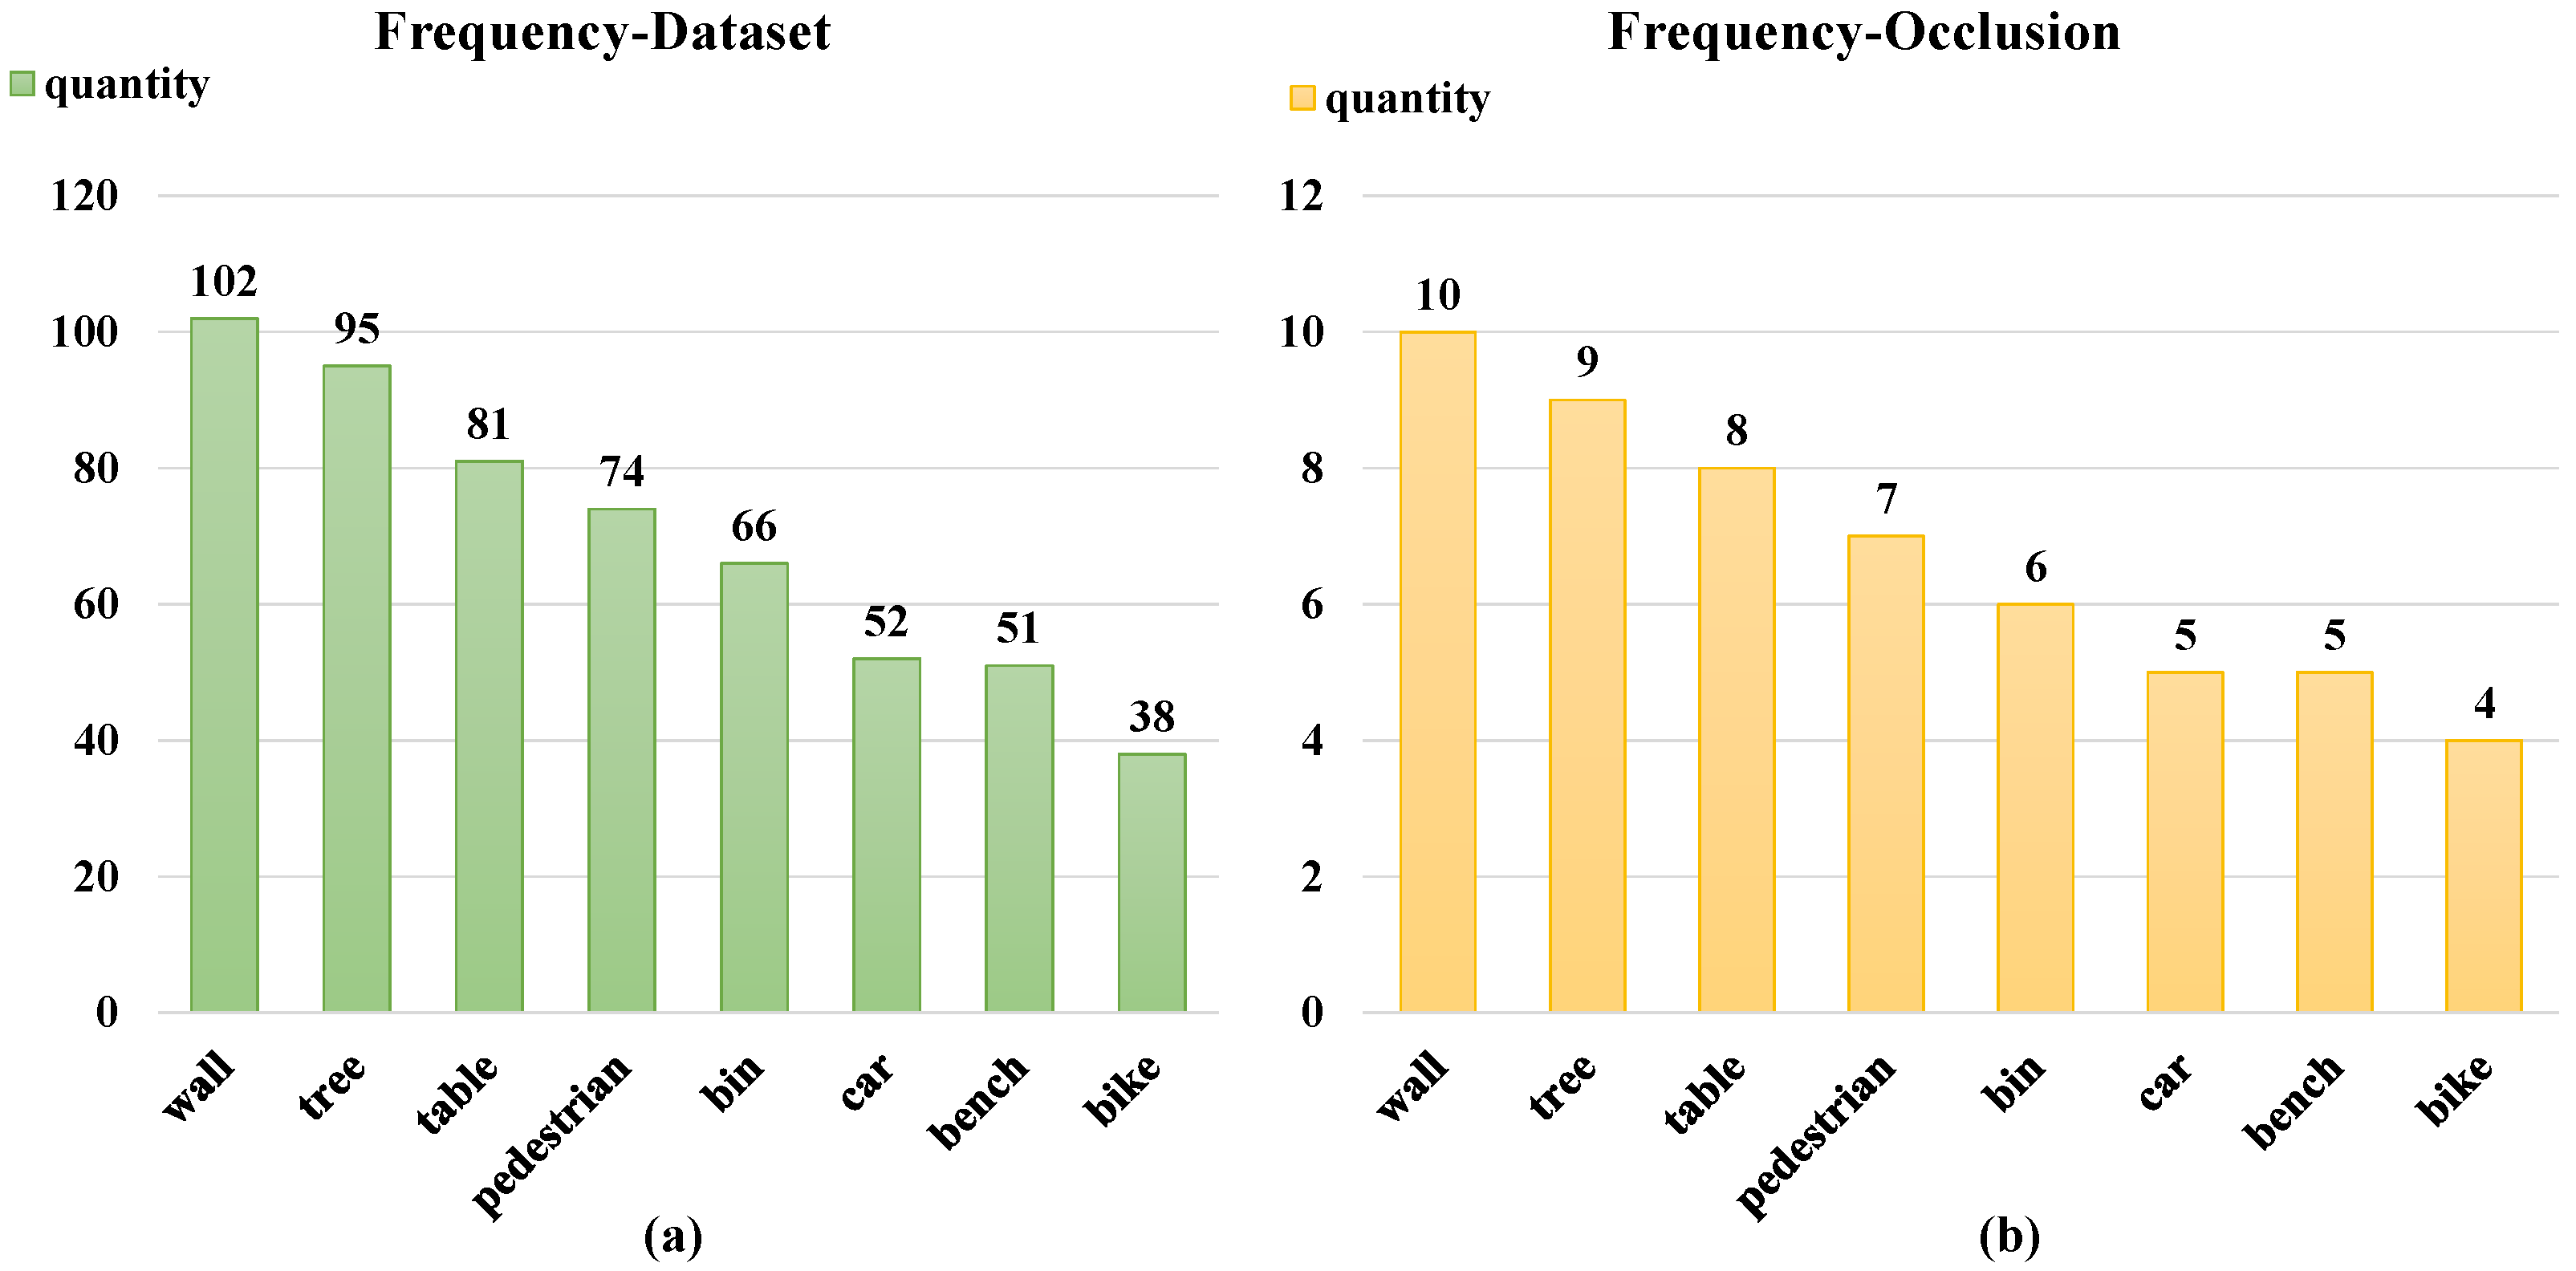
Figure 4 shows the frequency settings of the highest 8 occluder categories in terms of occurrence frequencies. This method can more realistically reflect the distribution of occluders in real-world application scenarios, thereby improving the generalization ability and practicality of the model. Through this frequency adjustment, our model can better adapt to various occlusion situations, providing a more robust foundation for the subsequent matching steps.
3.2. Occlusion Style Setting
Current data augmentation methods predominantly focus on generating diverse samples to boost data diversity. However, these methods overlook the fact that authenticity is also of great importance while ensuring diversity. Authenticity is an indispensable element in data augmentation as it directly impacts the accuracy and applicability of the features learned by the model. If the augmented data significantly deviates from the actual situation, the model may capture some unrealistic or irrelevant features. This limitation is particularly crucial, especially when the objective is to train the model for real-world scenarios. Therefore, we need to carefully consider and validate data augmentation techniques to ensure that the generated data aligns with the natural distribution of real-world images, thereby minimizing the risk of the model learning false patterns that may not generalize well to real-world scenarios.
As shown in
Figure 3, our Occlusion Style Transfer Module is as follows: First, input the occlusion image (such as a bench, providing content) and the style image (such as a pedestrian, providing style). An encoder first extracts the content and style features, respectively. Then, ADAIN (adaptive instance normalization) adapts the style features of the style image to the content features of the occlusion image. Finally, a decoder restores and outputs a result image that retains the content of the occlusion and incorporates the target style, achieving content preservation and style transfer.
More specifically, our process is as shown in Algorithm 1. The entire process helps to enhance the authenticity of the augmented data. Since the generated occluder images now conform more closely to the visual style characteristics present in the training set, our model can better learn and adapt to real-world scenarios when dealing with occlusions in the person Re-ID task.
| Algorithm 1 AdaIN-based Image Style Transfer Algorithm |
- Require:
Occlusion image x (providing content information) - 1:
Style image y (providing style information) - 2:
Pre-trained encoder e, Decoder d - Ensure:
Style-transferred output image z - 3:
Step 1. Extract feature maps using the encoder - 4:
Feature extraction result of occlusion image x via encoder e (content features) - 5:
Feature extraction result of style image y via encoder e (style features) - 6:
Step 2. Perform adaptive instance normalization - 7:
Calculate mean and standard deviation of feature maps: - 8:
Channel-wise mean of feature map - 9:
Channel-wise standard deviation of feature map - 10:
Channel-wise mean of feature map - 11:
Channel-wise standard deviation of feature map - 12:
Execute AdaIN operation: - 13:
- 14:
Step 3. Generate final image through decoder - 15:
Decoding result of via decoder d - 16:
return
z
|
3.3. Occlusion Location Setting
Through a systematic analysis of a large amount of real-scene image data, we found that the locations of common occluders such as cars, bicycles, and pedestrians in the image space exhibit significant distribution patterns. Based on this observation with statistical significance, we designed and constructed the Occlusion Location Determination Module, as shown in
Figure 3. For the occluded image library, we divided it into two subsets—the horizontal instance set and the vertical instance set. These two subsets have different preferences for occlusion positions, aiming to more accurately simulate occlusion scenarios in the real world.
(1) Horizontal Instance Set
Bottom Instance Set: This subset is specifically used to collect occluder instances that frequently appear in the bottom area of the image in real-world scenarios, such as stationary bicycles, street benches, and other typical objects. Let the bottom boundary of the image be represented in the image coordinate system as
where
and
define the horizontal and vertical boundary ranges of the image, respectively. For each occluder in the subset, the position of its bottom boundary
in the image space is ensured to be precisely aligned with the bottom of the image through the constraint
. In the horizontal direction, to simulate the random distribution characteristics of occluders in the actual scene, we introduce a random variable
X based on a uniform distribution,
, where
. By setting the horizontal position coordinate of the occluder as
, on the basis of maintaining the bottom alignment, the random adjustment of the horizontal position is achieved, thereby highly restoring the diverse position states that occluders may appear in at the bottom of the image in the real world.
Upper Instance Set: This subset mainly focuses on occluder categories that usually appear in the upper area of the image. Umbrellas are typical representatives. Similarly, we define the top boundary of the image in the image coordinate system as
For the occluders in this subset, their top boundary satisfies the constraint to ensure precise alignment with the top of the image. In terms of the randomization of the horizontal position, we also introduce a random variable that follows a uniform distribution, , and set the horizontal position coordinate of the occluder as , where the definition of is the same as the horizontal range of the bottom instance set. In this way, the actual situations of occluders appearing in different positions in the upper area of the image are effectively simulated.
Middle Instance Set: This subset is designed to simulate occluder instances that typically appear in the middle area of the image. Common examples include bags and suitcases. We first define the vertical middle boundary range of the image in the image coordinate system.
Let the vertical middle range of the image be determined by two key lines. The lower boundary of the middle area and the upper boundary of the middle area divide the image vertically. The middle area in the vertical direction can be defined as , where and (the specific division ratio can be adjusted according to actual scene characteristics).
The middle boundary constraint of the image for occluders is defined as
For each occluder in this subset, its vertical coverage range (e.g., the vertical span of a pedestrian group) must satisfy the constraint that its main body lies within
. To simulate the random horizontal distribution of occluders in the middle area, similar to the bottom and upper sets, we introduce a random variable
following a uniform distribution,
where
. By setting the horizontal position coordinate of the occluder as
, we maintain the vertical middle-area alignment while randomly adjusting the horizontal position. This highly restores the diverse states of occluders that may appear in the middle of the image in real-world scenarios, such as pedestrians randomly distributed horizontally in the middle of a street-view image, helping to comprehensively test and improve the adaptability of image recognition systems to occlusions in different vertical regions.
(2) Vertical Instance Set
In this subset, a series of occluder objects appearing in the vertical direction are included, such as tall trees, street billboards, street lamps, etc. Unlike other subsets, the positions of occluders in the horizontal direction of the image are no longer subject to specific restrictions in this subset. However, to ensure the vertical morphological characteristics of the vertical occluder set, it is necessary to process the height of the occluder images. First, based on the total height y of the input image, the height threshold is calculated using the following formula:
Then, the occluders are screened or adjusted one by one. If their original height is lower than this threshold, they are processed by means of proportional stretching until their height is not lower than so as to ensure that these occluders can occupy sufficient vertical space in the image and fully reflect the core characteristics of the vertical morphology.
Meanwhile, a random variable following a uniform distribution is introduced to generate horizontal coordinates, and the occluders that meet the height constraint are randomly placed in the left and right regions of the image. This ensures that these occluders can occupy sufficient vertical space in the image, fully reflecting the core characteristics of the vertical morphology and making the occlusion scene closer to the real situation.
3.4. Multi-Scale Crop Data Augmentation
In the field of person Re-ID, especially when dealing with occlusion situations, how to effectively augment data to improve the model’s ability to capture features at different scales is a key challenge. The existing single random cropping method has limitations. Due to randomness, it may capture limited or irrelevant information, such as pure backgrounds or unrelated objects. To address this issue, we propose an innovative data augmentation method that combines multi-scale cropping and flexible image mixing strategies.
As shown in
Figure 3, our Multi-Scale Crop Data Augmentation follows a two-stage process, including the multi-scale cropping stage and the image mixing stage. Through these two stages, we can fully explore the multi-scale information in the images and effectively fuse it, thereby enhancing the model’s performance in occlusion scenarios.
(1) Multi-Scale Cropping Stage
To address the issue that existing single random cropping methods may capture limited or irrelevant information due to randomness, we design multi-scale cropping operations to fully explore multi-scale information in images for multi-scale crop data augmentation.
Definition of the Cropping Operation Set: We define a set containing M cropping operations. The scales of these cropping operations range from an extremely small proportion to covering the entire image, and the scales of each operation do not overlap. Let the size of the original image I be (height × width). The cropping ratio corresponding to the m-th cropping operation is , so the size of the cropped image is and , where satisfies .
To clearly present the “non-overlapping” scale division rule, we set the lower bound of the cropping ratio (minimum cropping ratio) to 0.01 and the upper bound to 1 (corresponding to the scale of the full image). When the number of cropping operations (this setting is to match the feature hierarchy of “local details–half-body features–global context” in the occluded person re-identification task and achieve hierarchical capture of key information), the total scale range of is evenly divided into 3 non-overlapping sub-ranges. The scale range of each cropping operation is as follows: (0.01, 0.34) (0.34, 0.67) (0.67, 1).
This division method not only ensures “non-overlapping property” (i.e., the start of each sub-range completely coincides with the end of the previous sub-range; for example, 0.34 is both the end of the 1st cropping and the start of the 2nd cropping), avoiding redundant capture of the same scale information by different cropping operations, but also ensures “effective coverage” (i.e., the 3 sub-ranges fully cover the total scale interval of [0.01, 1] and are distributed in a gradient from low to high scales, enabling comprehensive extraction of local and global features of the image).
Implementation of Multi-Scale Cropping: For a given image I, we sequentially apply the cropping operations in the set to obtain a set containing M cropped views. Among them, is a resizing operation used to adjust all cropped images to a fixed size to meet the input requirements of subsequent models. Small-scale cropping operations can focus on the fine details of the image, which helps to capture the subtle features around the occluded parts of pedestrians in occluded person re-identification; large-scale cropping operations can retain more overall information of the image, which helps to grasp the overall context features of pedestrians.
(2) Image Mixing Stage
In this stage, we mix the multiple image views obtained in the multi-scale cropping stage according to specific rules to fuse the image information at different scales. We provide two optional mixing strategies: the linear fusion strategy and the region-replacement fusion strategy.
Linear Fusion Strategy For two cropped views
and
of the same size, we generate a mixed view
through linear interpolation. The formula is as follows:
where
is the mixing weight, which is randomly sampled from the Beta distribution
, and
is an adjustable hyperparameter. This linear fusion method can smoothly merge the information of the two views, enabling the training samples to contain features from cropped views at different scales and enhancing the generalization ability of the model.
Region-Replacement Fusion Strategy Given two cropped views
and
of the same size, we first randomly generate a binary mask
b for a rectangular region. Then, we generate a mixed view
according to the following formula:
where ⊙ represents element-wise multiplication. The values of the mask
b are either 0 or 1, which are used to indicate the positions where the corresponding regions in
should be replaced into
. Specifically, we first randomly select a rectangular region in
. Let the coordinates of the top-left corner be
and the coordinates of the bottom-right corner be
. The area of this region is
, and it satisfies
, where
is a probability value randomly sampled from the Beta distribution
. This region-replacement fusion strategy simulates the changes in local regions of the image, which helps the model to enhance its ability to recognize local features and better handle local occlusion problems in occluded Re-ID.
Through the above multi-scale cropping and flexible image mixing strategies, we construct a new input distribution, which is used as training data. It is expected to significantly improve the performance and robustness of the occluded Re-ID model.
3.5. Parallel Integration Mechanism
In existing research, traditional data augmentation methods mostly adopt a serial execution logic: that is, raw samples are processed sequentially according to a preset augmentation pipeline (such as operations like random cropping, brightness adjustment, and rotation) to generate a single augmented sample. Although this serial mode achieves the basic function of data expansion, it has obvious limitations. On the one hand, it can only generate one type of augmented sample at a time, making it difficult to fully cover the diversity of data distribution, which limits the model’s adaptability to different data variants. On the other hand, the temporal dependence of serial operations leads to low overall data processing efficiency. Especially in the scenario of large-scale datasets, it is likely to become a performance bottleneck in the model training process.
Our Parallel Integration Mechanism comprises two independent parallel data augmentation branches: the aforementioned Frequency–Style–Position Data Augmentation (FSPDA) mechanism and Multi-Scale Crop Data Augmentation (MSCDA). These two branches perform simultaneous enhancement on each original input image P, thereby generating two distinct augmented image results in a single processing cycle. This process can be formulated as
Subsequently, these two augmented images, along with the original input image P, are fed into a shared-parameter network for feature extraction. Specifically, the shared-parameter network processes P, , and , respectively, to generate three sets of feature maps. After undergoing the same series of convolutional operations and global pooling, these feature maps are transformed into three independent global feature vectors, denoted as , , . These three global features, each preserving distinct characteristics derived from the original and augmented inputs, are subsequently concatenated or processed as separate entities to participate in the subsequent stages of the network.


