4.1. Evaluation of NAS
This section reports the best 1D-CNN architectures obtained through NAS along with their classification results for the three datasets:
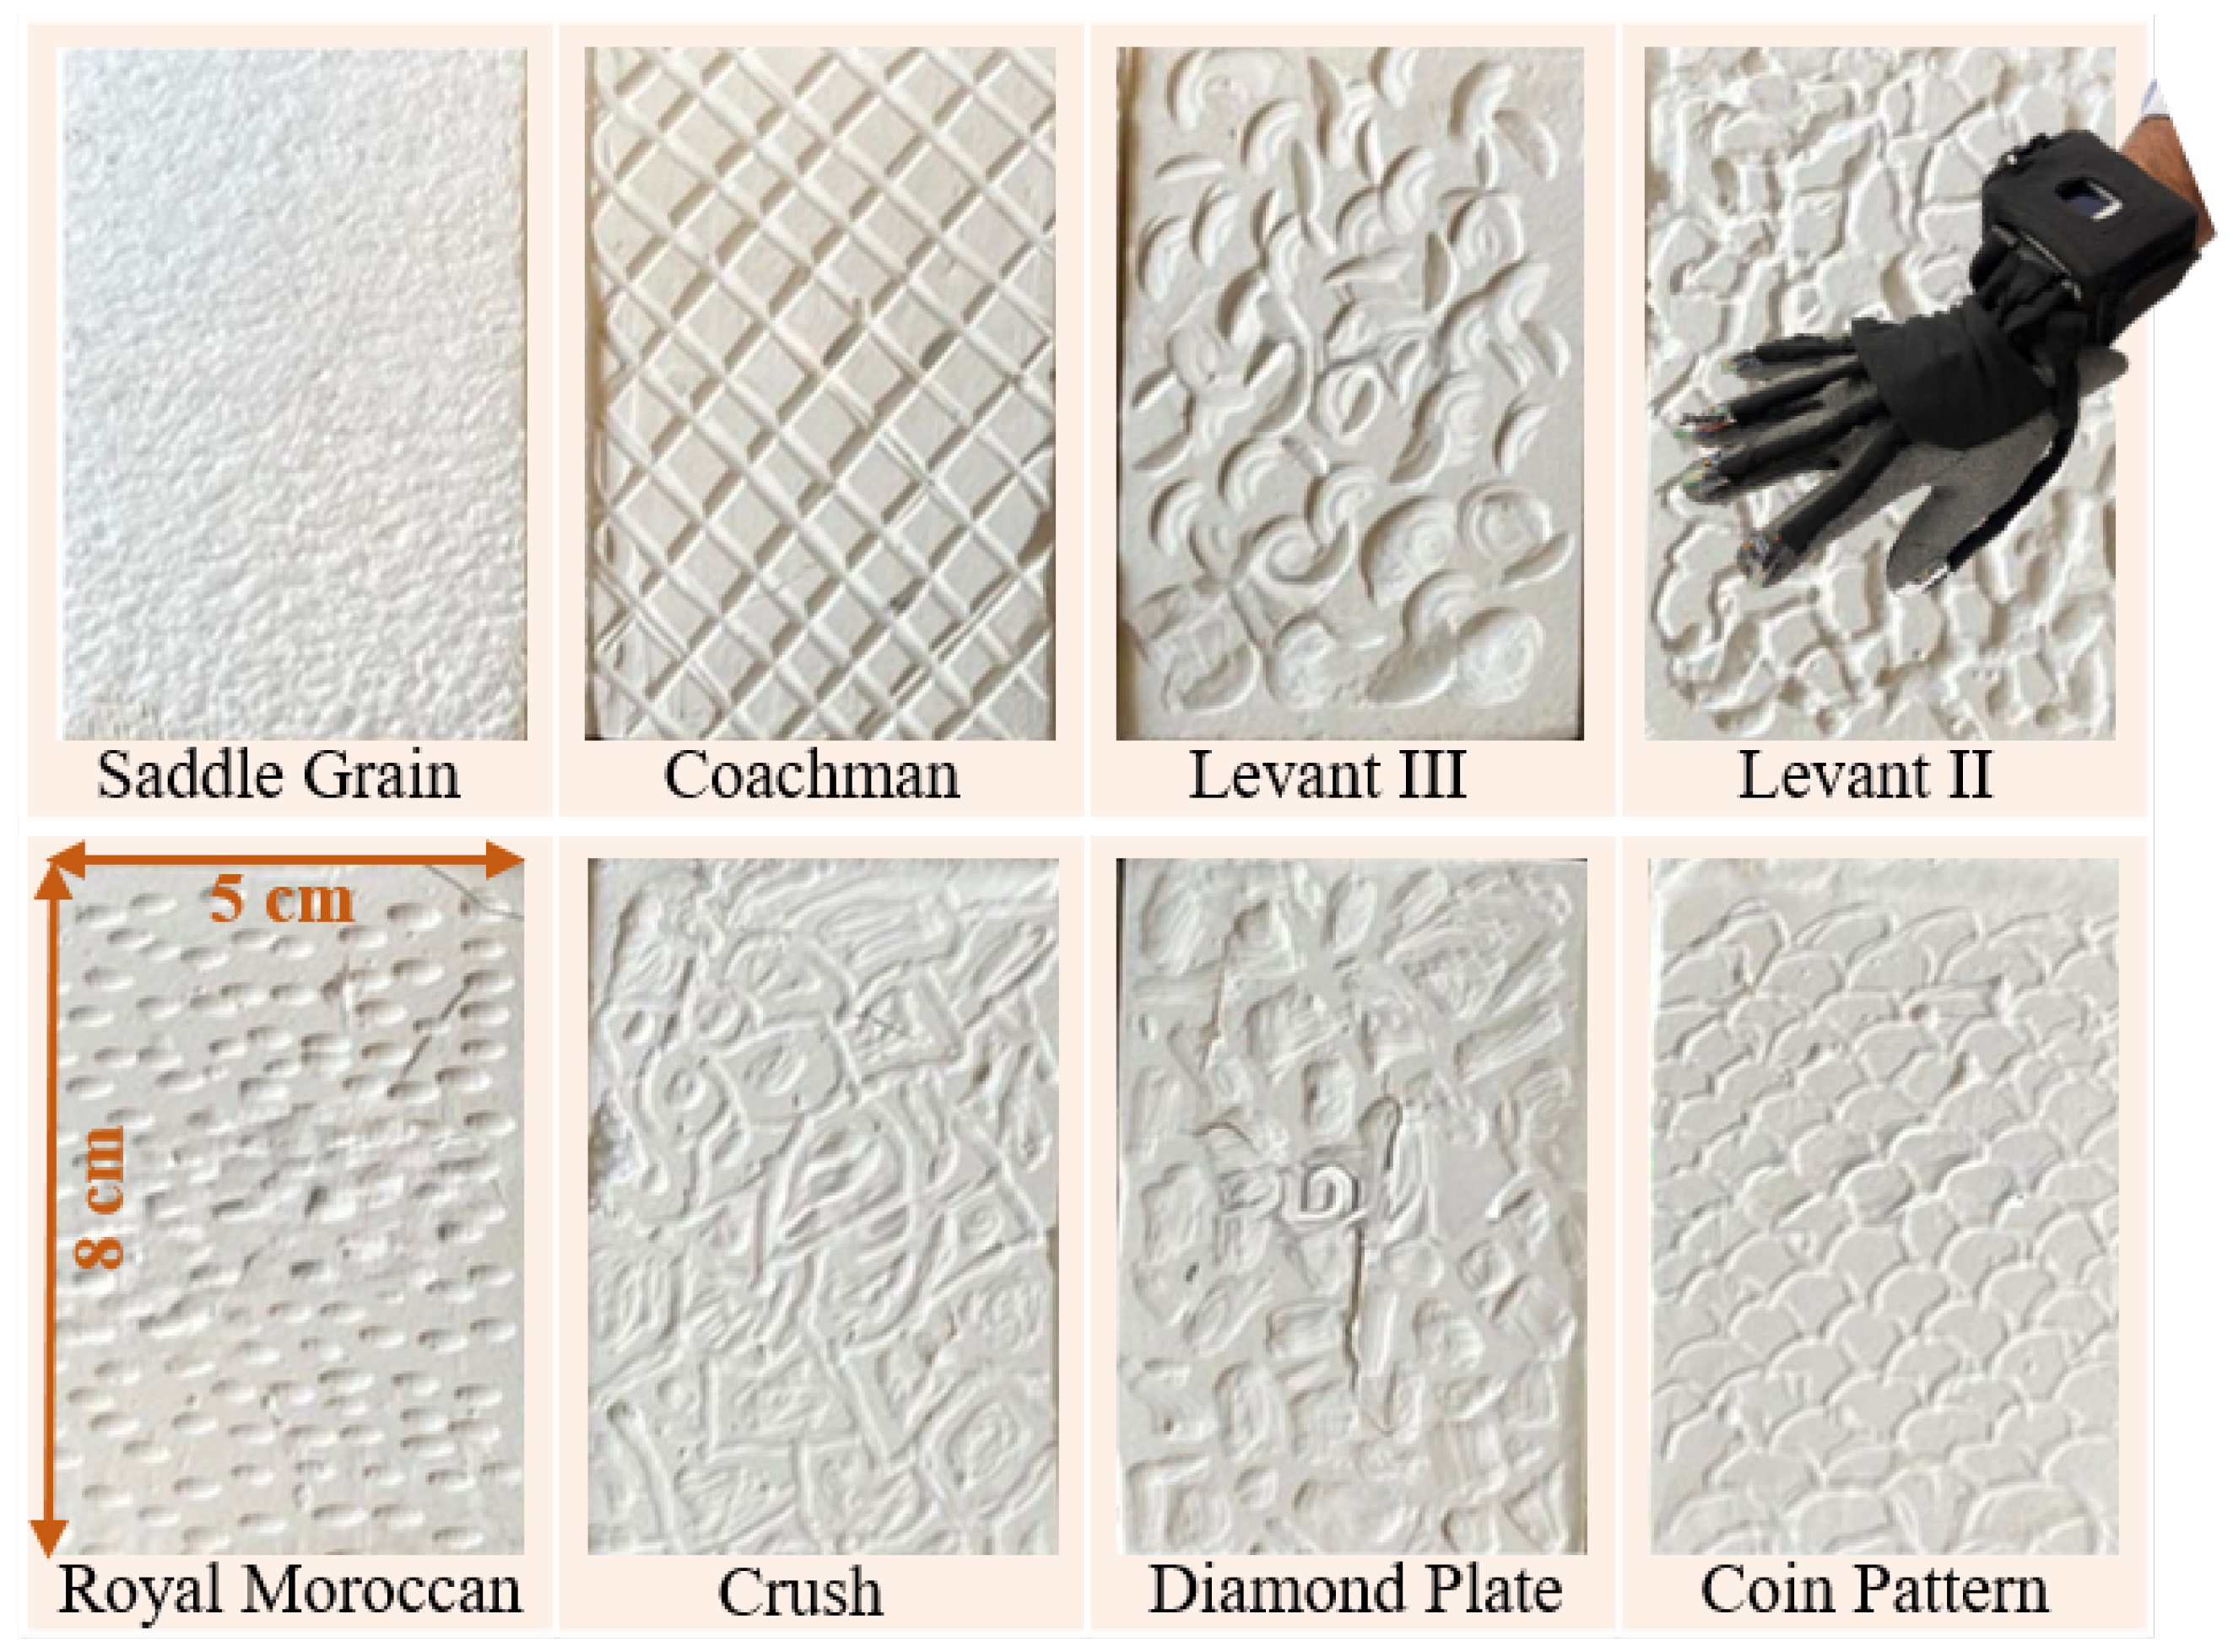
Textures,
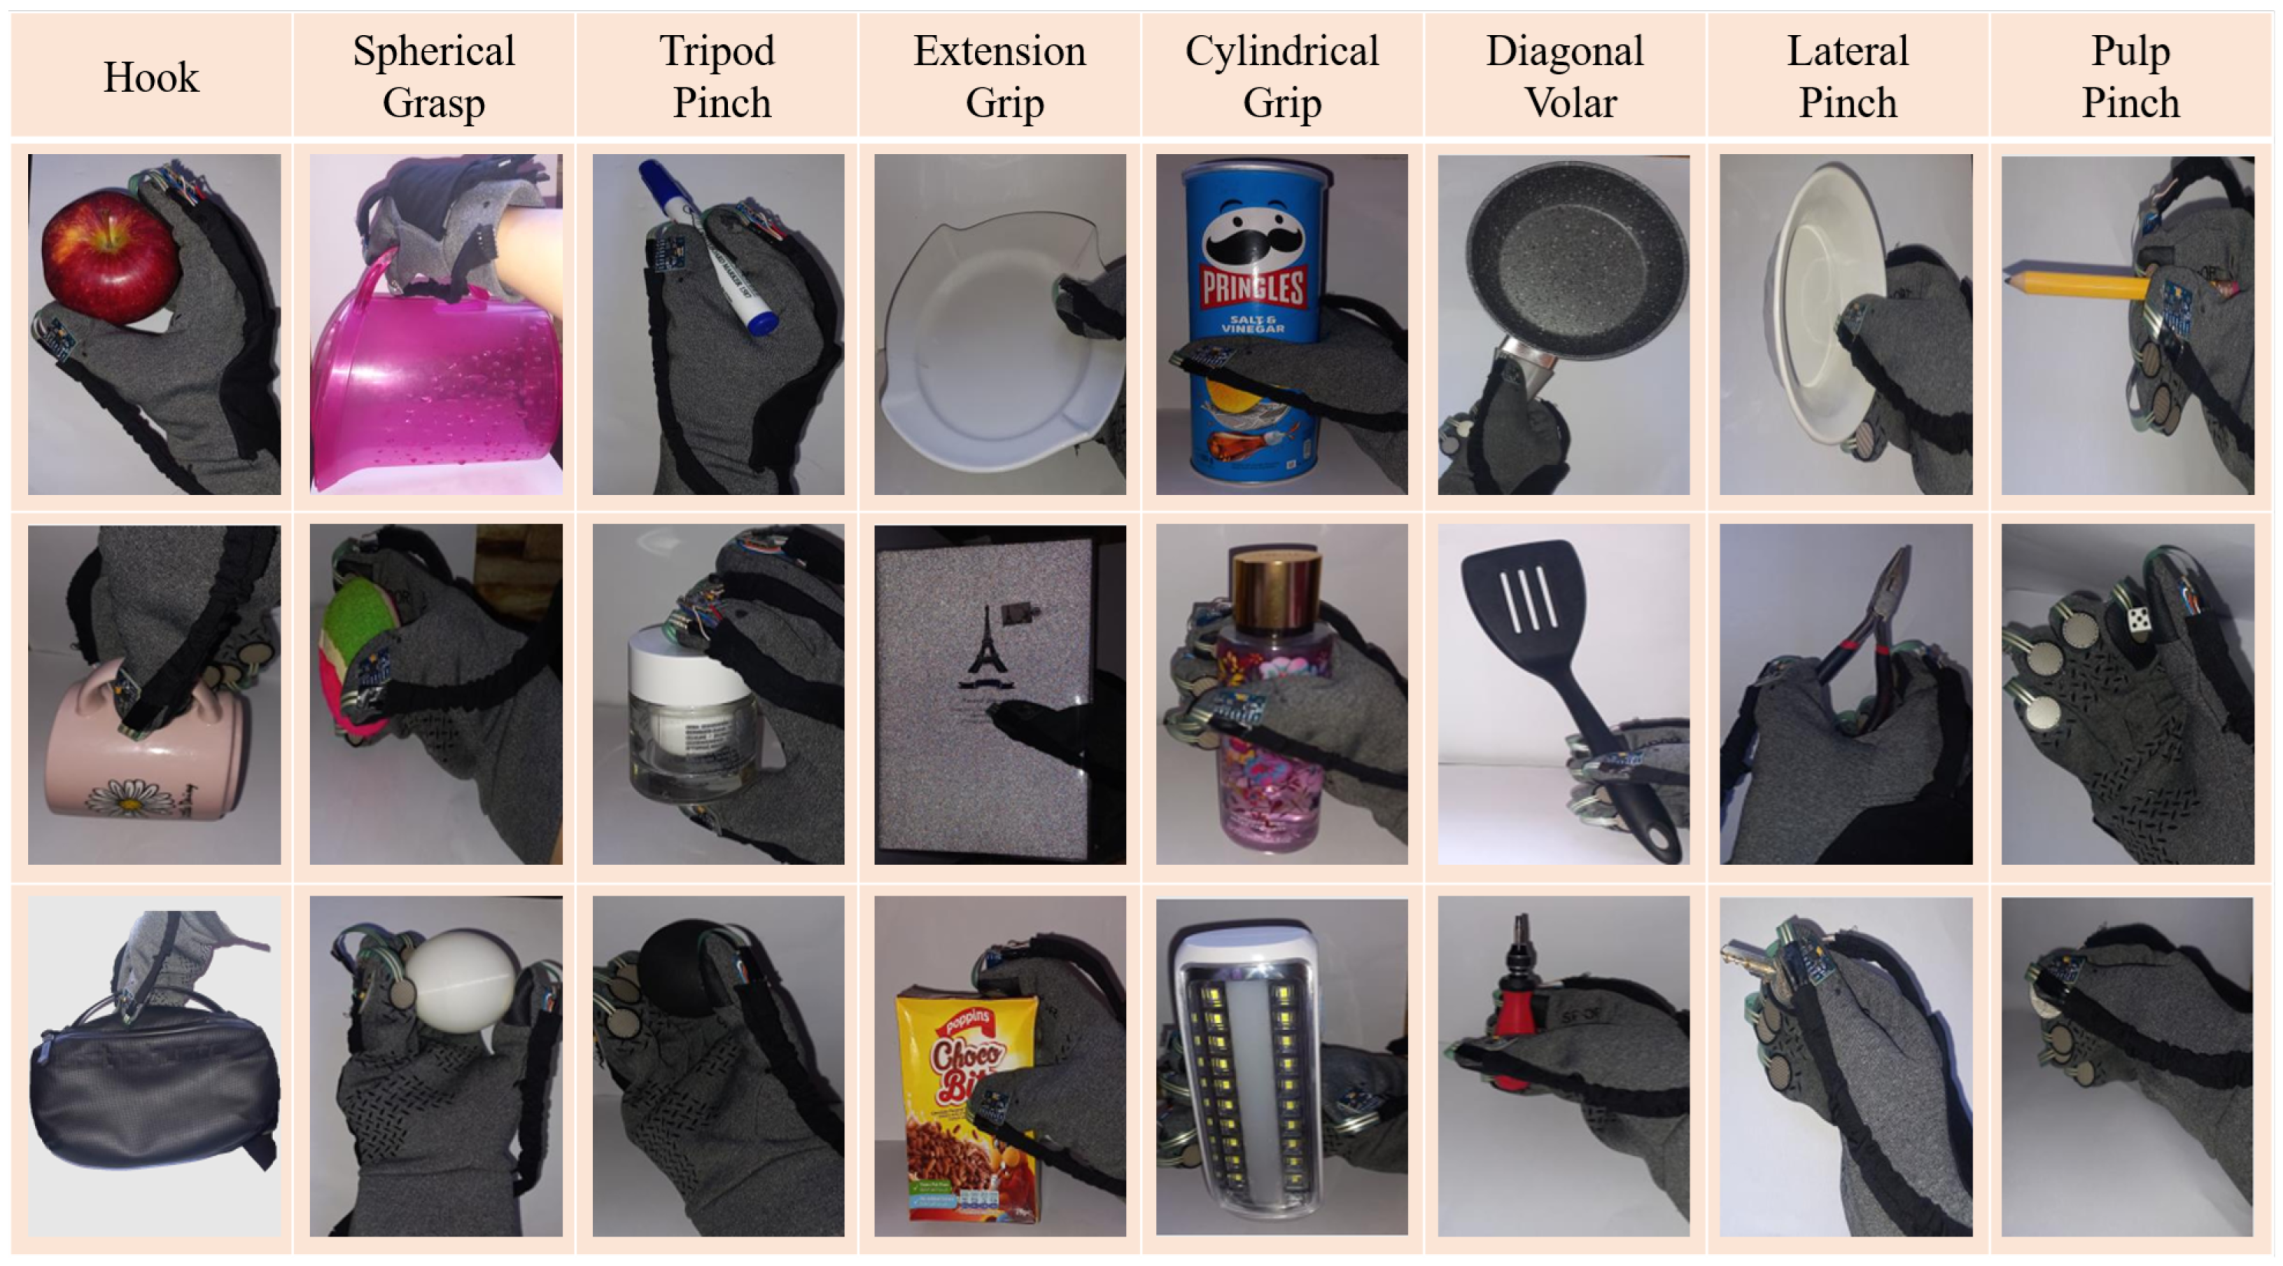
Grasp, and
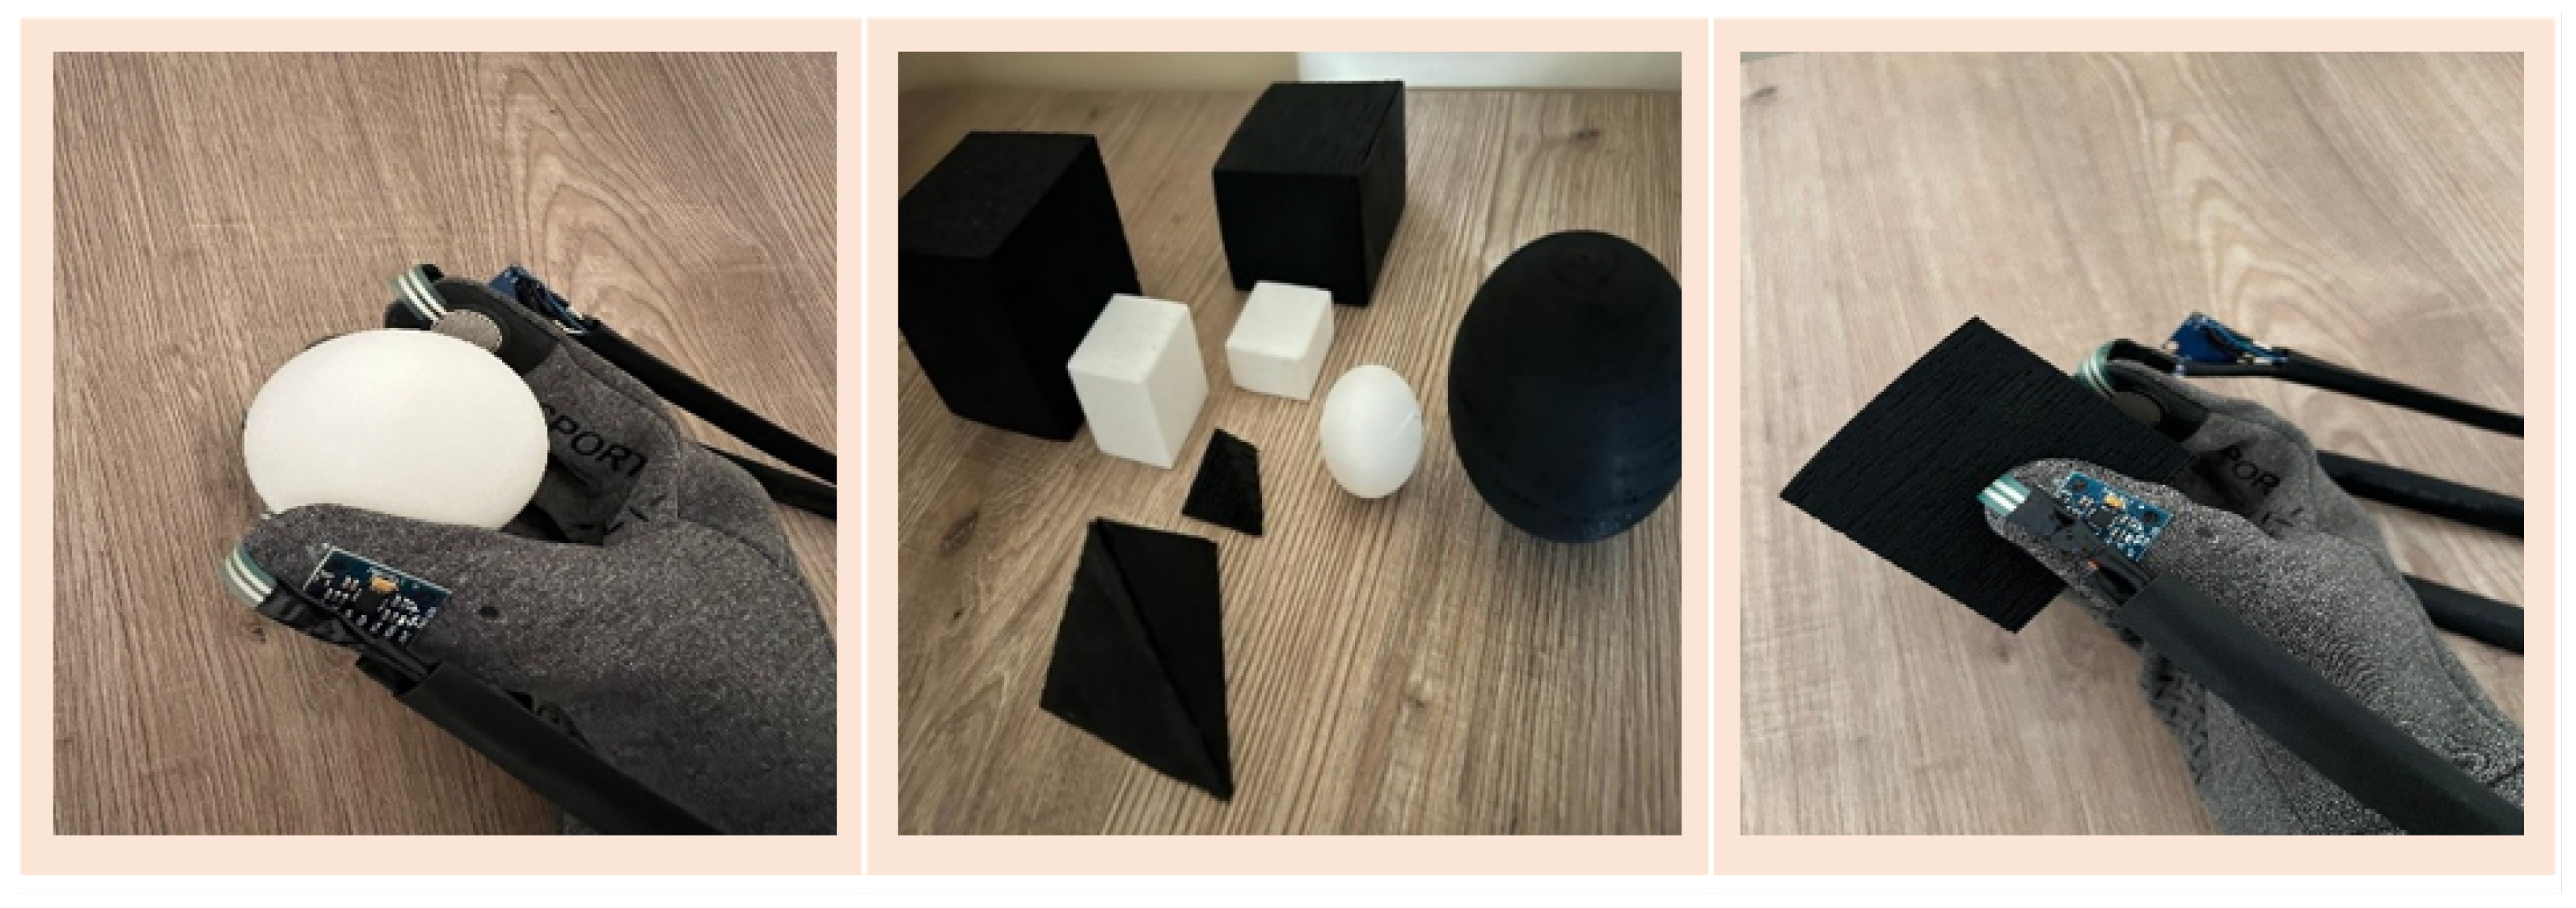
Printed Shapes. For each dataset, the NAS process evaluated multiple candidate architectures and selected the top five models with the highest validation performance while taking hardware constraints into account.
Table 2 presents the architecture of the best model among these five for each dataset. For the
Textures dataset, the best model employs two convolution layers with 128 filters and a kernel size of 2, without any dense layers. The network uses ReLU activation and a very small L2 regularization. In contrast, for both the
Grasp and
Printed Shapes datasets, the NAS process converged to the same architecture, consisting of two convolution layers with 64 filters each, a kernel size of 4, average pooling, and Tanh activation, also without dense layers. This outcome indicates that these tasks can be effectively addressed through convolution feature extraction alone. The observed differences in filter size, pooling strategy, and activation function highlight how NAS tailors the architecture to the specific demands of each dataset.
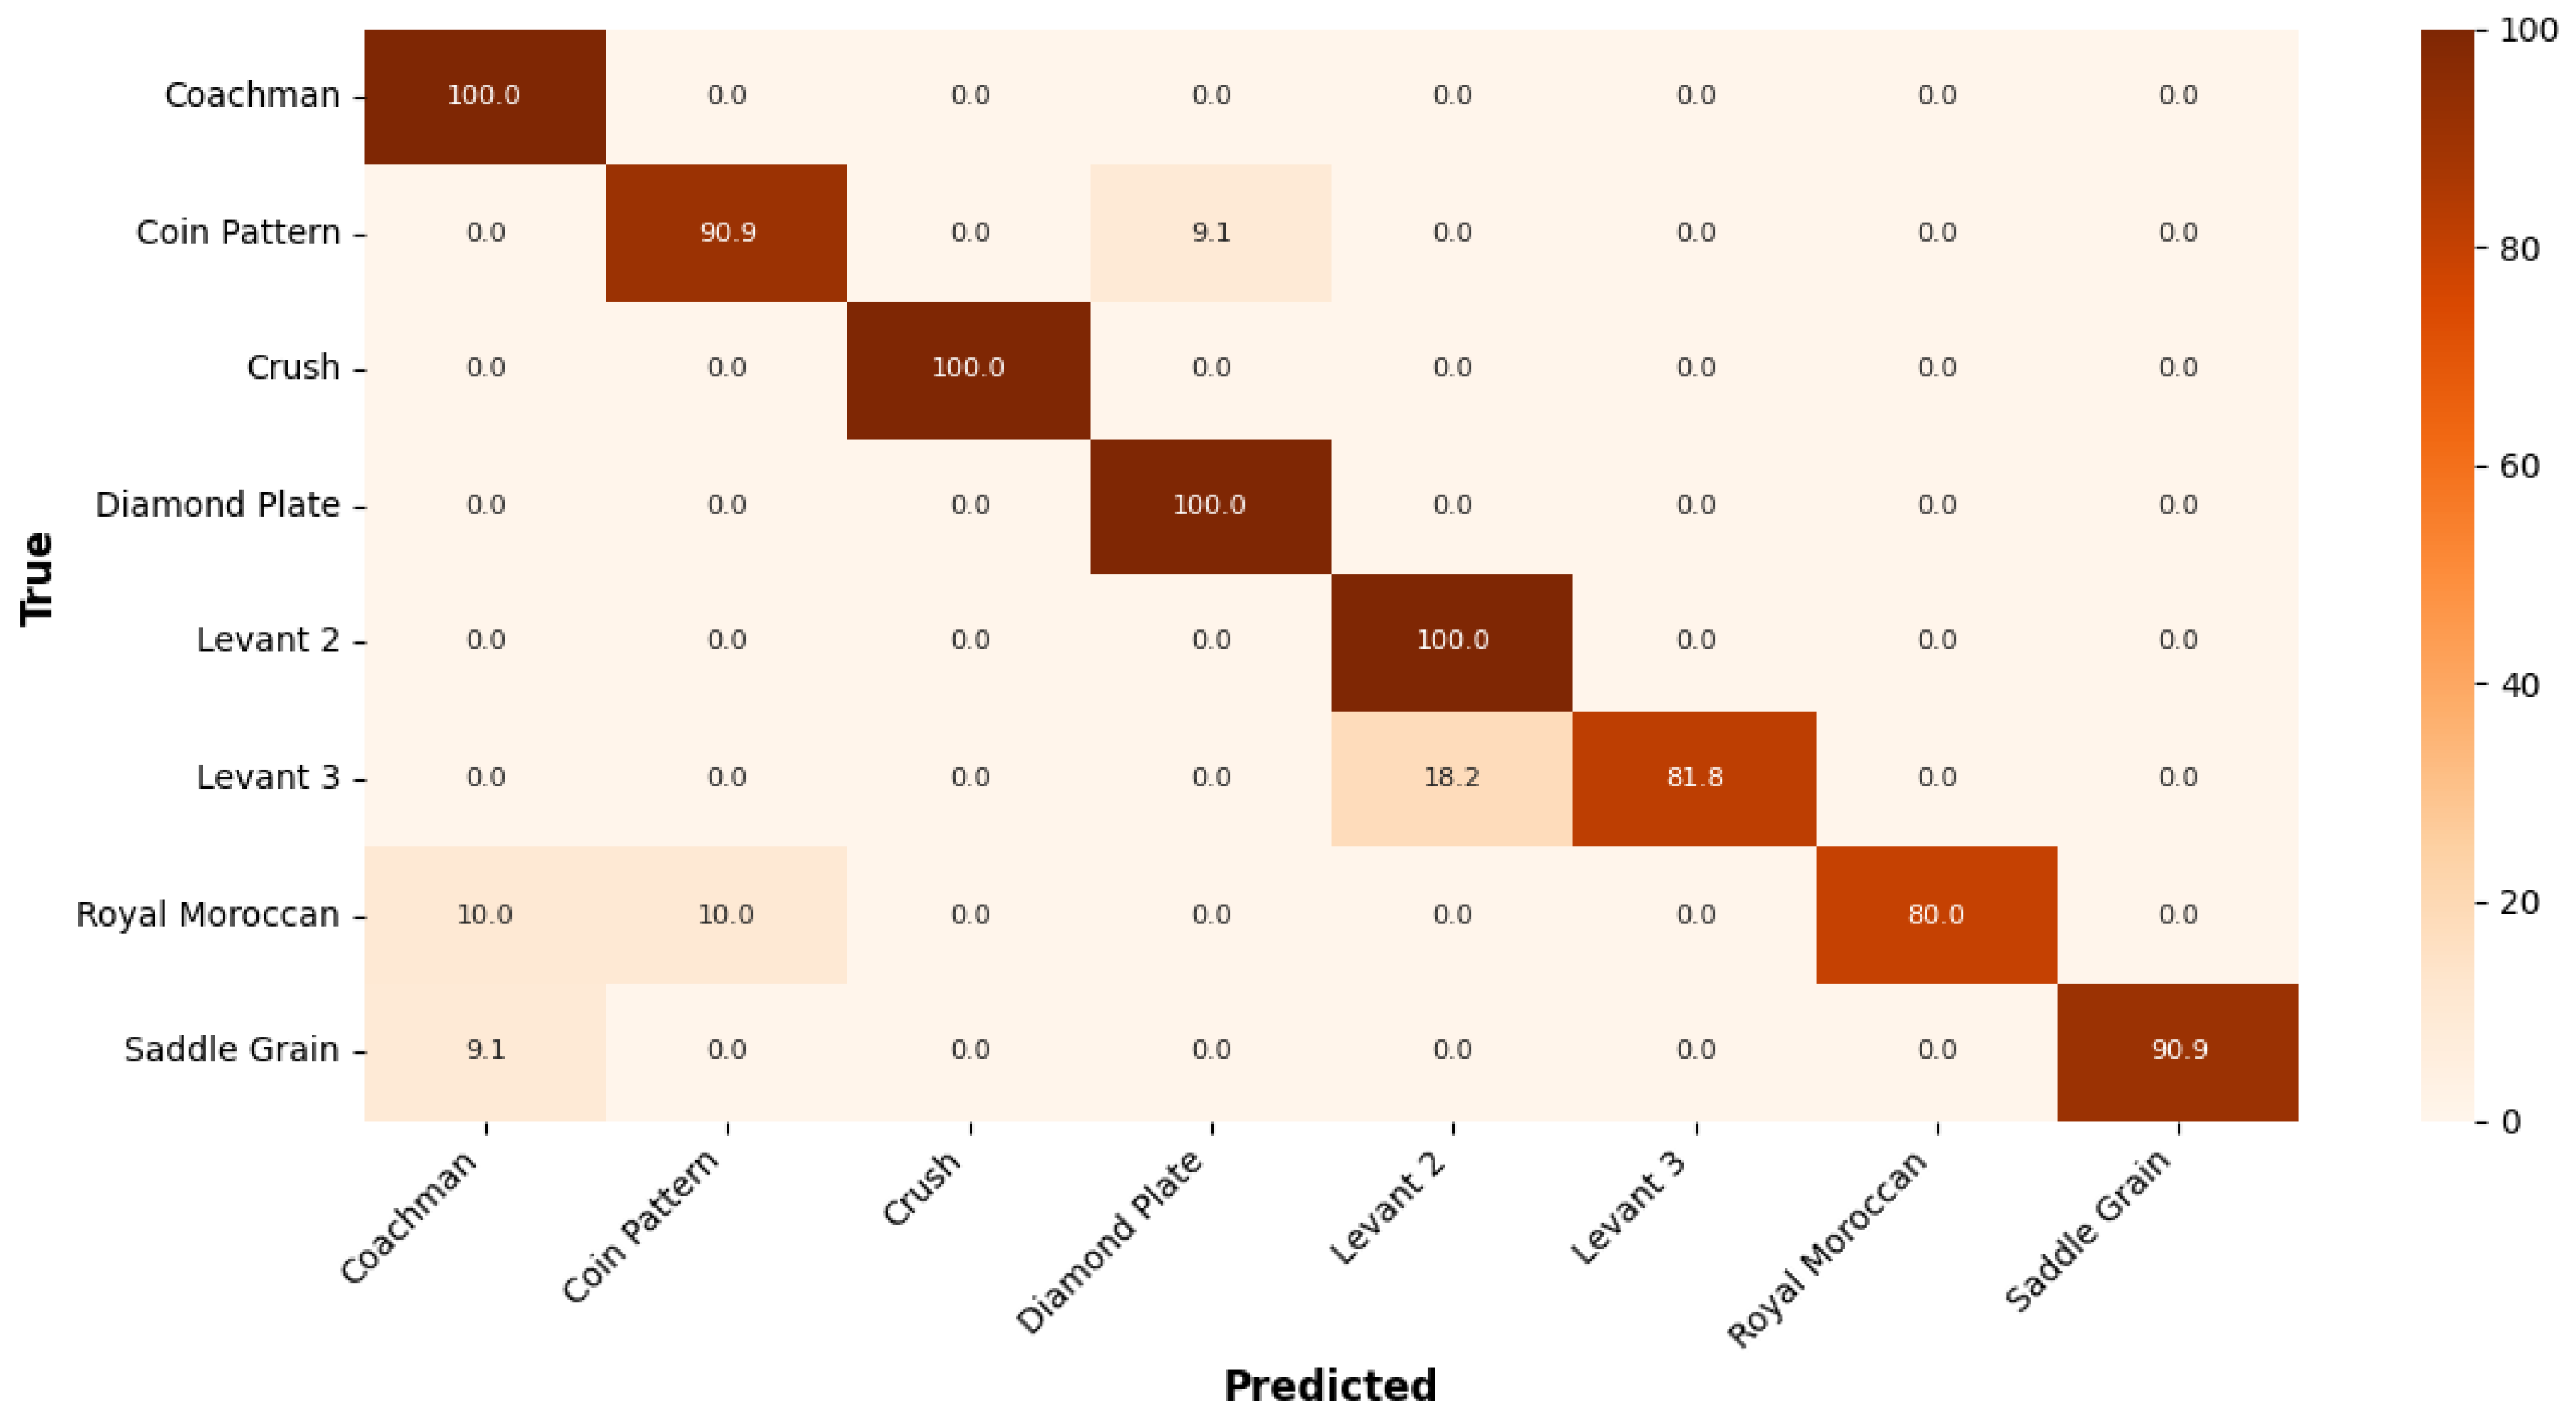
The classification performance is illustrated using confusion matrices. For the
Textures dataset, as shown in
Figure 7, the NAS selected architecture achieved its highest classification accuracy of 100% for several classes, indicating a strong ability to distinguish those texture patterns. The lowest accuracy was 80%, observed for the
Royal Moroccan class. Overall, the model demonstrates high recognition capability with only minor confusion between certain texture types.
Figure 8 presents the confusion matrix for the
Grasp dataset, illustrating that the model achieves high accuracy of 100%. However, the
Led Light shows the lowest accuracy at 90.0%, often being misclassified as
Perfume Bottle highlighting challenges in distinguishing objects with similar shapes and sizes.
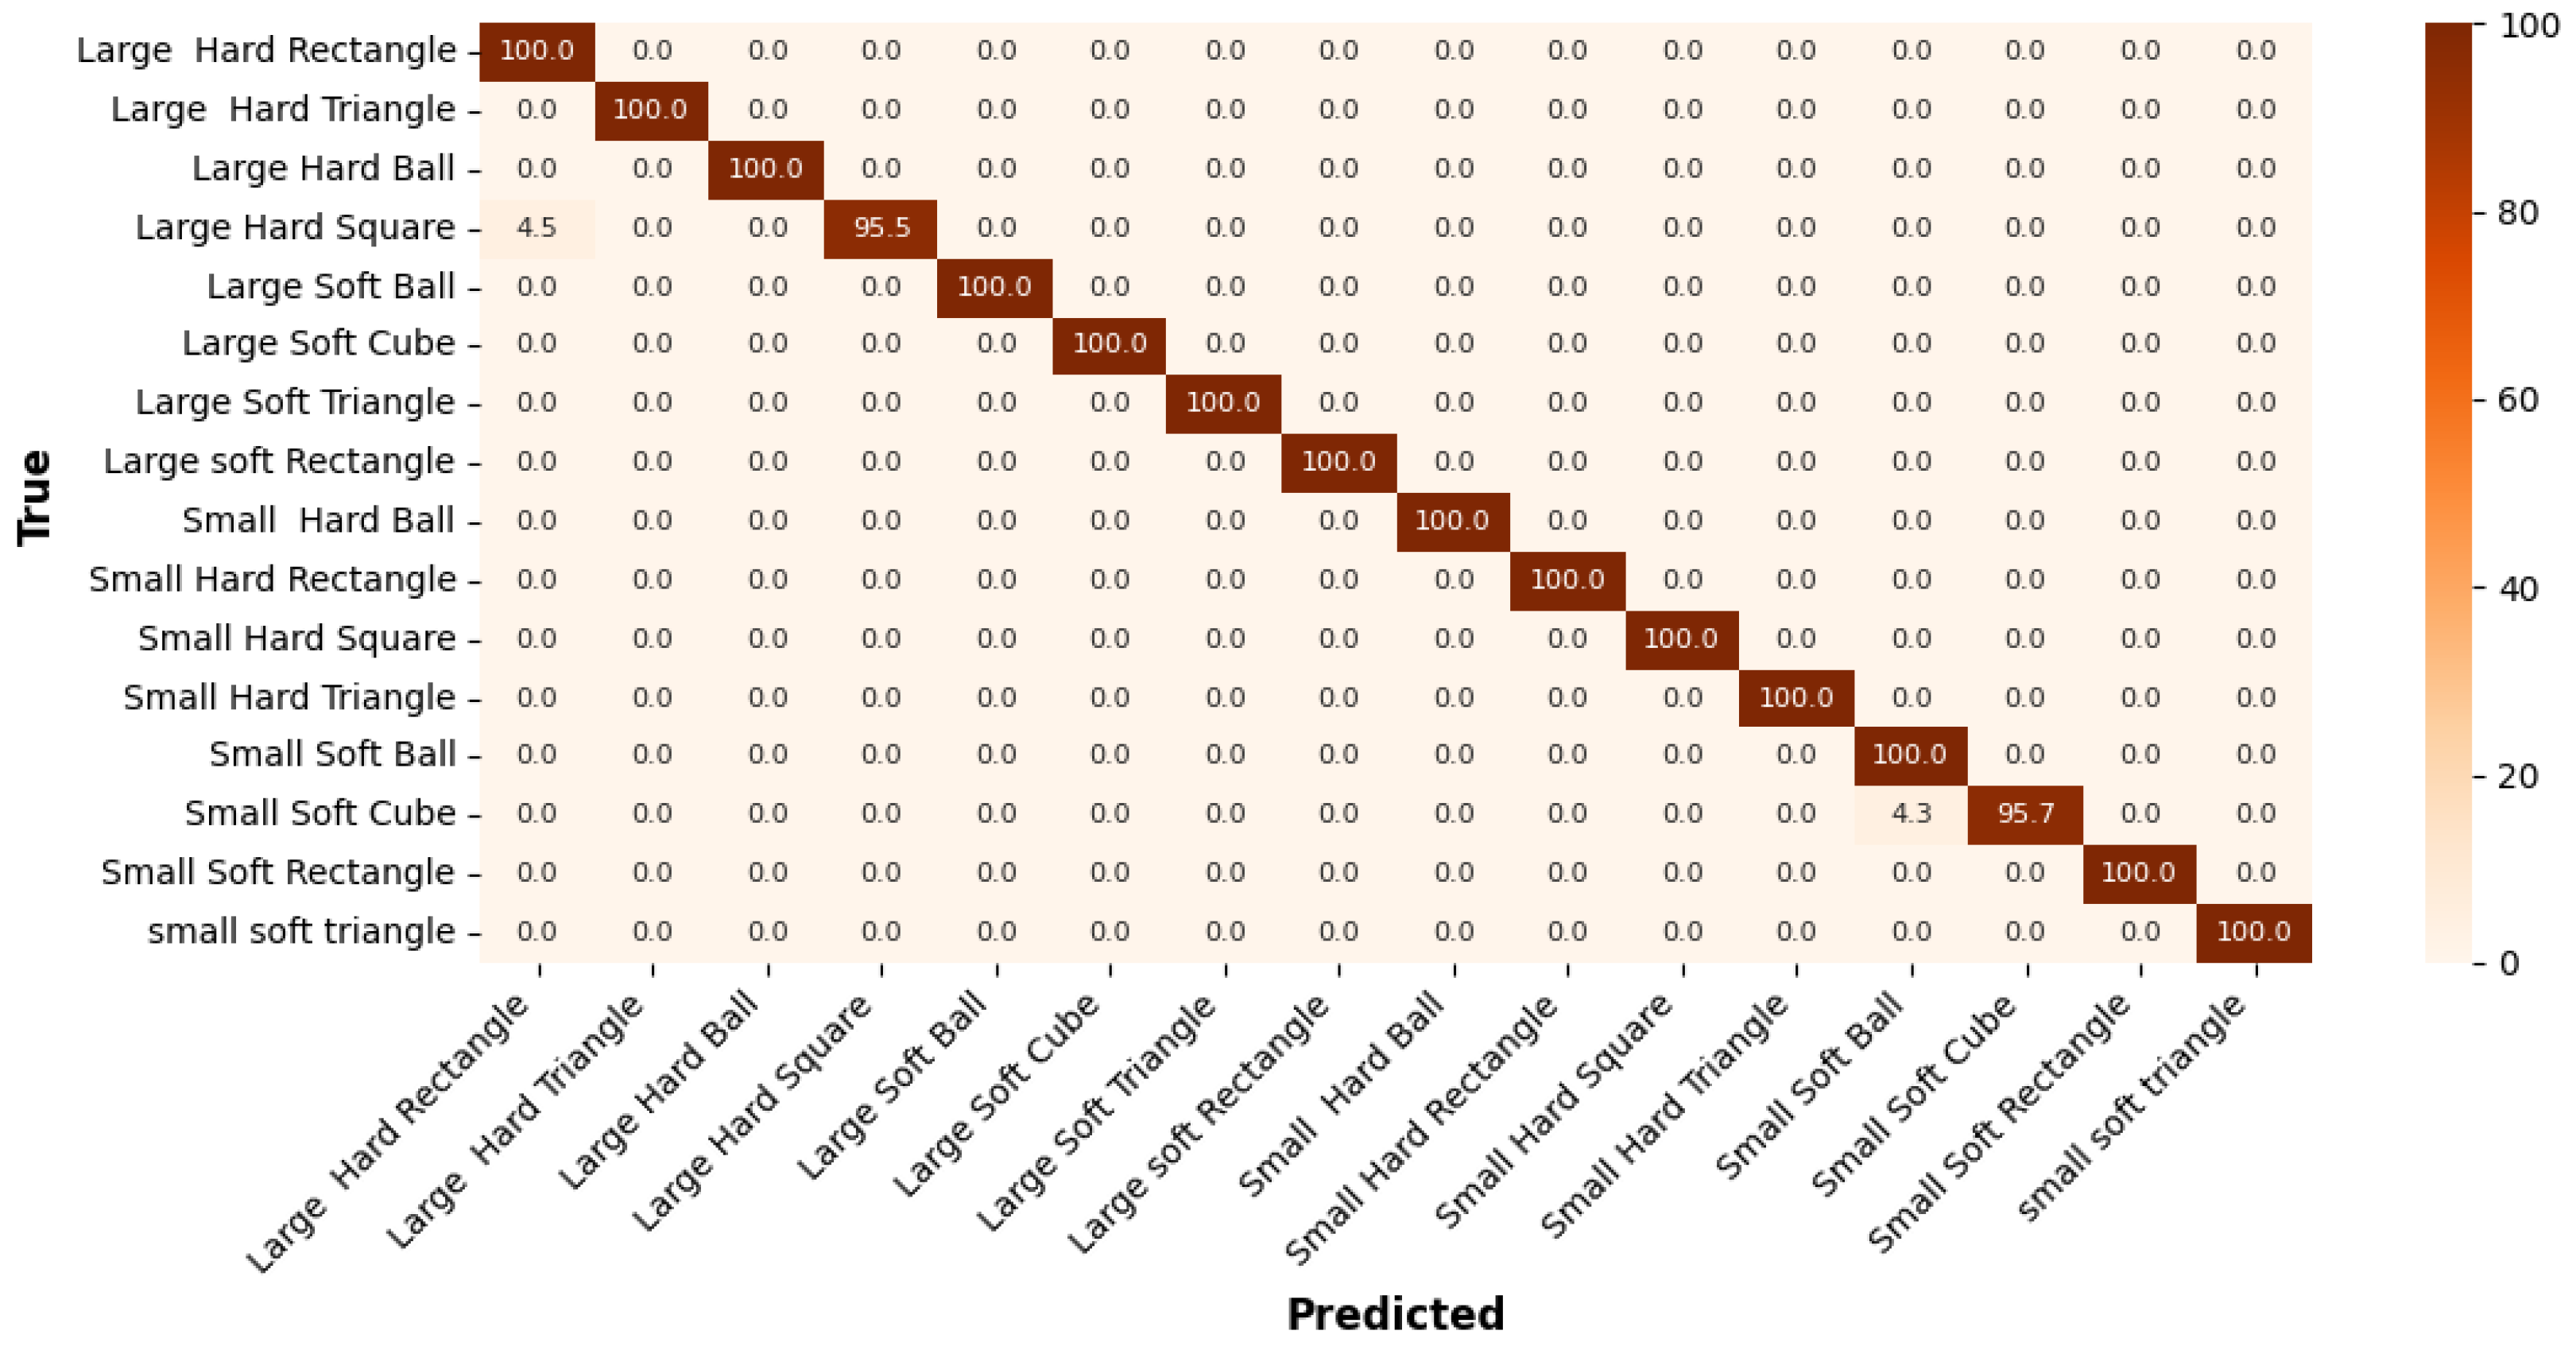
The confusion matrix for the
Printed Shapes dataset in
Figure 9 shows that the model performs with very high accuracy overall. Most classes achieved 100% accuracy, indicating perfect classification. The lowest performance is observed for the
Large Hard Square class with an accuracy of 95.5%, due to a few instances being misclassified as Large hard rectangle. This highlights a slight confusion between square and rectangle shapes, particularly when size and material differ.
4.2. Evaluation of Optimized Neural Network Models
This section presents a comprehensive evaluation of the optimized 1D-CNN models, focusing on both predictive performance and on-device efficiency across multiple datasets to demonstrate the robustness and generalizability of the proposed approach.
To ensure robustness and statistical relevance, the top five NAS-selected models for each dataset were evaluated. Each model underwent the proposed optimization techniques, Weight Reshaping, Quantization, and the Combined method, where the average testing accuracy (Avg Acc) across these models was calculated. The results of these evaluations are summarized in
Table 3,
Table 4 and
Table 5, corresponding to the
Textures,
Grasp, and
Printed Shapes datasets.
For the Textures dataset, the NAS baseline models achieved an average accuracy of 91.67%, with Weight Reshaping slightly improving this to 91.91%, Quantized NAS slightly lower at 90.96%, and the Combined method aligning with the baseline at 91.67%, reflecting stable performance across the candidate models. In the Grasp dataset, the NAS baseline averaged 94.44%, while Weight Reshaping reached 94.72%, Quantized NAS dropped to 90.47%. The Combined method closely matched Weight Reshaping at 94.56%, indicating consistent trends with minor variations. For the Printed Shapes dataset, the NAS baseline achieved 98.89% accuracy, with Weight Reshaping reaching 98.78%, Quantized NAS slightly lower at 97.72%, and the Combined method at 98.72%, showing that performance remained robust across all optimization strategies.
Overall, these results indicate that the Combined optimization technique maintains high accuracy across multiple candidate NAS models, consistently reflecting the trends observed in the top-performing model for each dataset. The patterns observed across Textures, Grasp, and Printed Shapes datasets confirm the robustness and generalizability of the proposed approach, demonstrating its effectiveness across different models and data conditions.
Following the evaluation of average accuracies, the top NAS-selected model for each dataset was deployed on a NUCLEO-F401RE board for on-device performance assessment. All models were converted to TensorFlow Lite format [
48] and deployed via the ST Edge Developer Cloud platform [
49]. Energy consumption was calculated by multiplying the power, obtained using the STM32 Nucleo Power Shield Board [
50] and the STM32 Power Monitor Software (version 1.1.1) [
51], by the inference time.
Before deployment, the Weight Reshape models in each dataset underwent hyperparameter tuning to recover any accuracy loss after optimization. Across all datasets, training consistently employed a batch size of 32, the Sparse Categorical Crossentropy loss function, and the Adam optimizer. The Textures and Grasp dataset models were trained with a learning rate of 0.003, whereas the Printed Shapes model used a learning rate of 0.001. To enhance training stability and prevent overfitting, all models incorporated early stopping based on validation loss, with a patience of 10 epochs.
The results summarized in
Table 6 compare a NAS baseline model with three optimized variants across the
Textures,
Grasp, and
Printed Shapes datasets. The baseline models achieved accuracies of 92.86% (
Textures), 95.63% (
Grasp), and 99.44% (
Printed Shapes). Weight Reshape consistently improved these results, reaching 94.05%, 96.06% on the
Textures and
Grasp datasets while preserving a comparable accuracy of 99.17% on the
Printed Shapes dataset. The Combined optimization techniques maintained the same improvements on the
Textures,
Grasp, and
Printed Shapes datasets, achieving 94.05%, 96.06%, and 99.17%, respectively. In contrast, Quantized NAS showed slightly lower accuracy across all datasets, achieving 91.67% on
Textures, 94.09% on
Grasp, and 98.61% on
Printed Shapes.
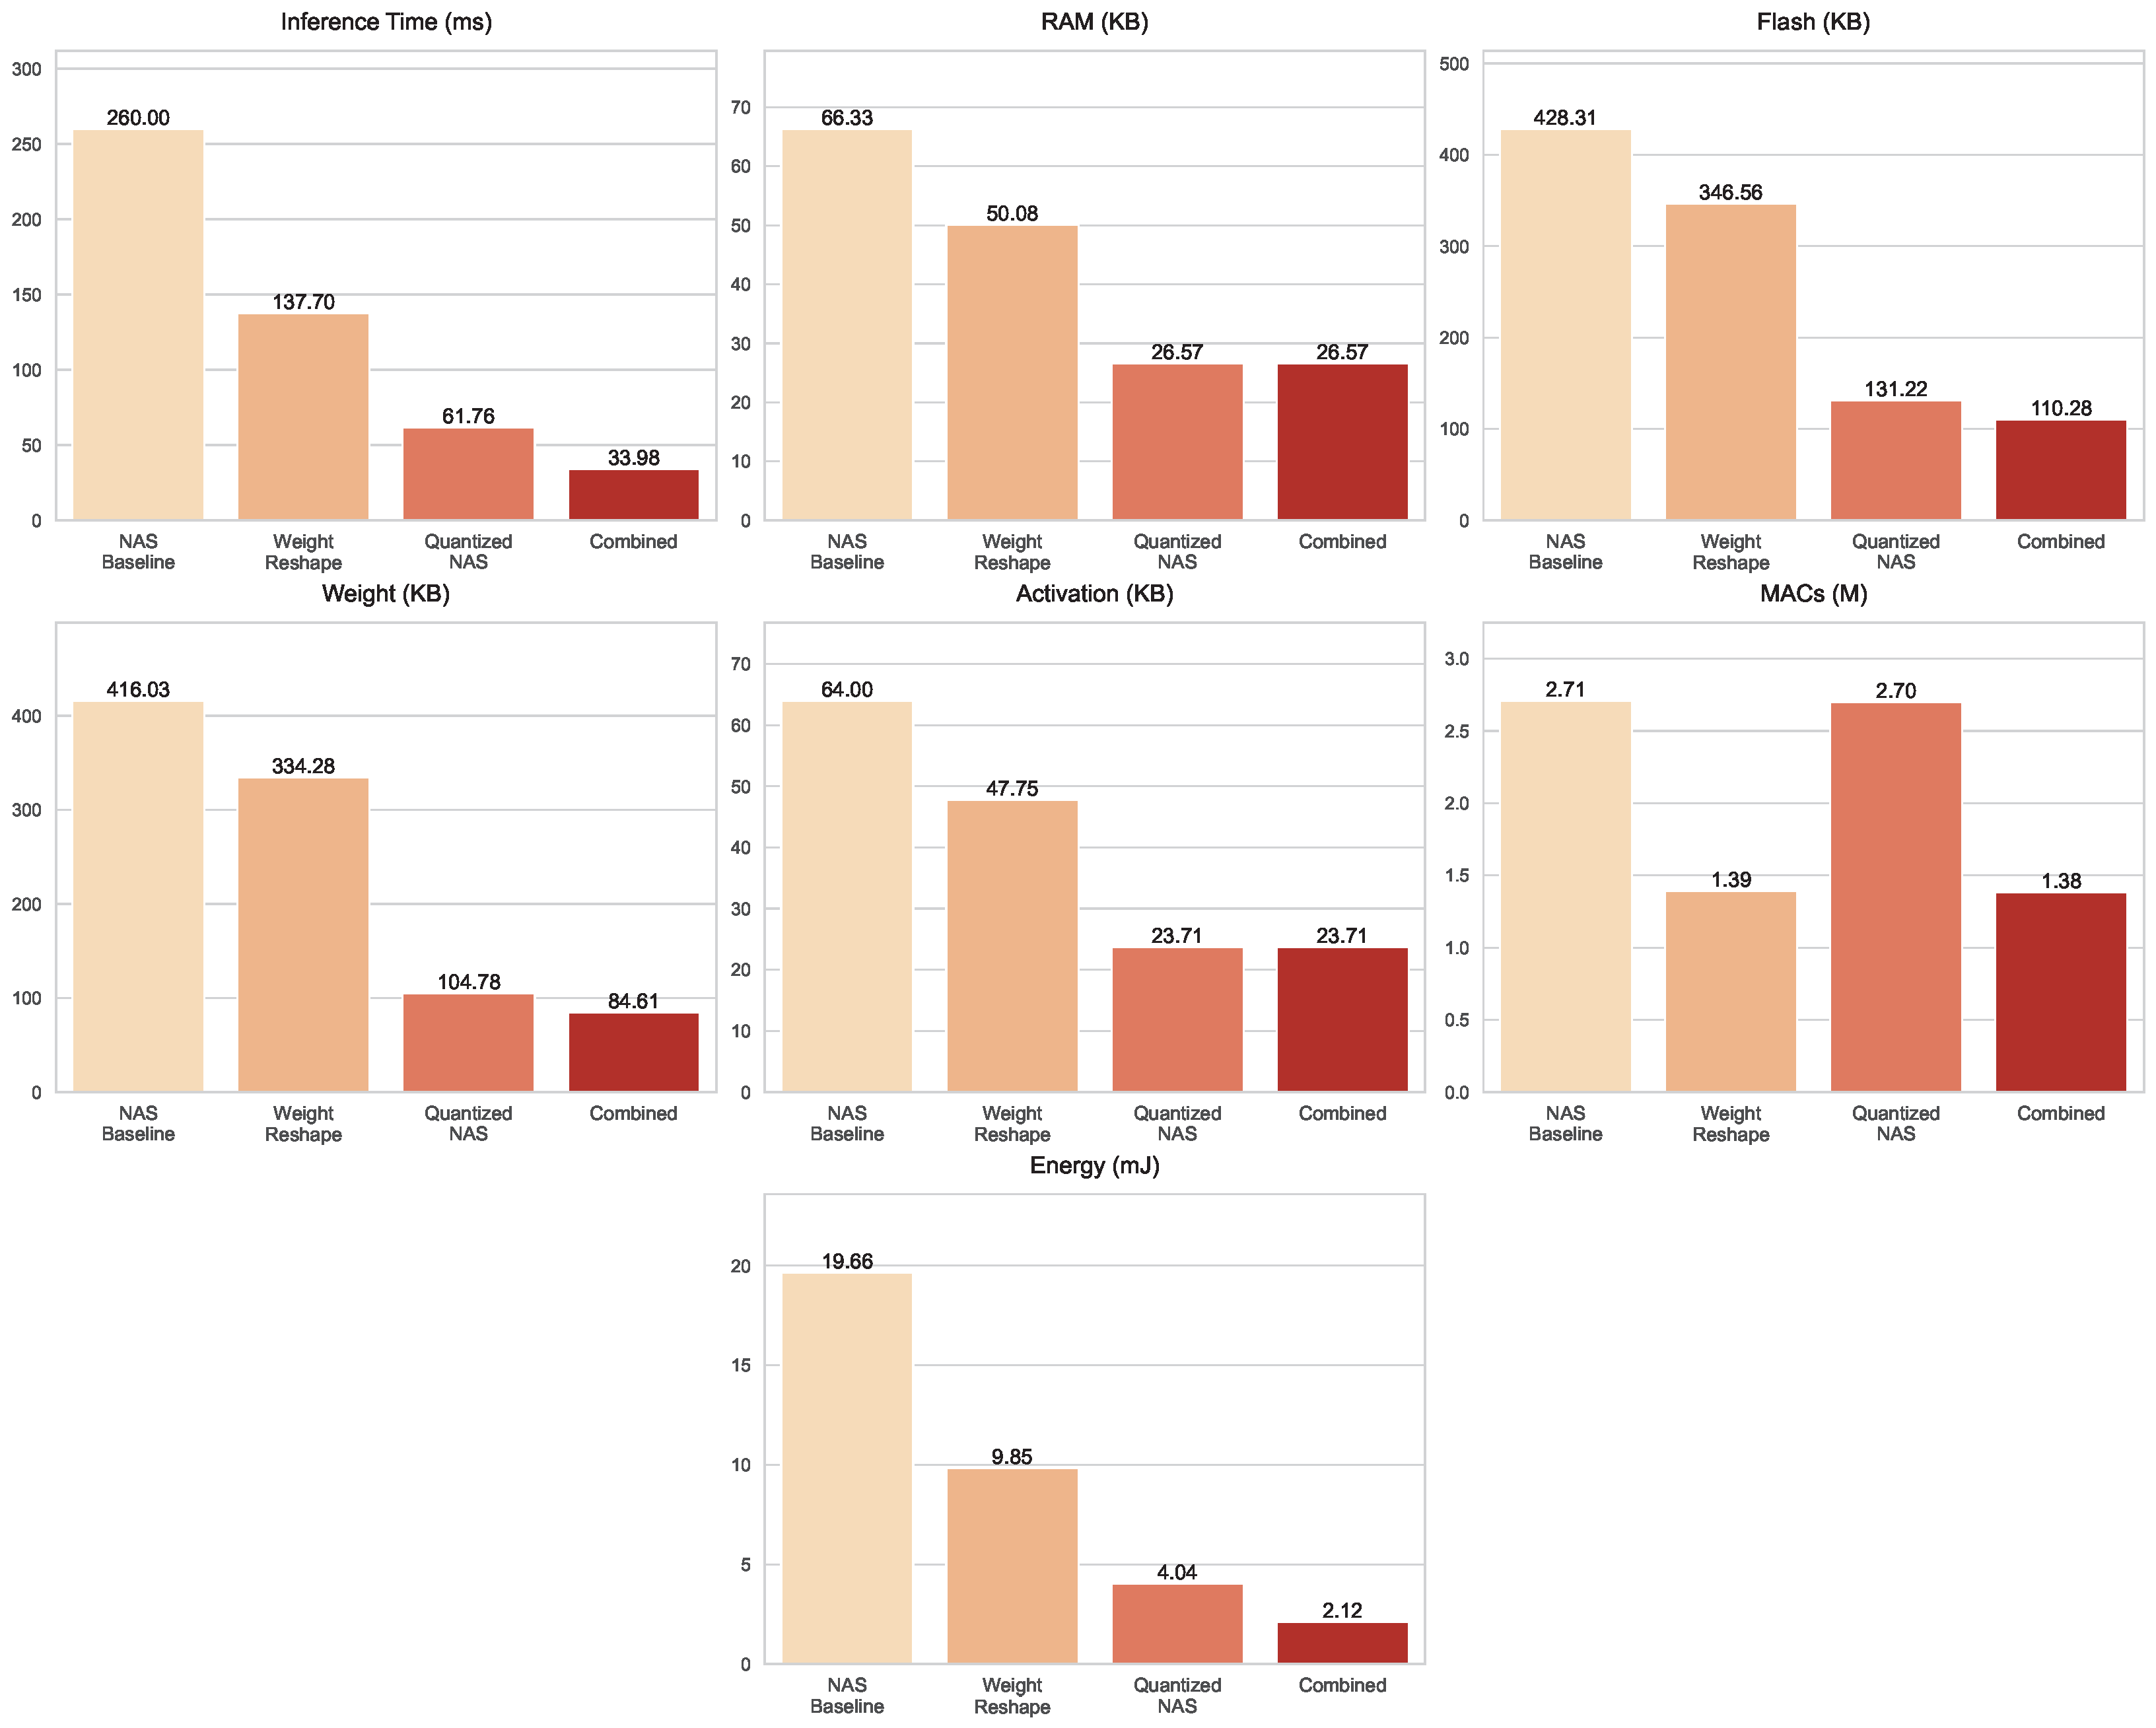
On the
Textures dataset, the efficiency trade-offs of each optimization strategy are summarized in
Figure 10. The baseline model was the most computationally demanding, requiring 260 ms per inference, 2.709 million MACs, and 19.66 mJ of energy, with a Flash footprint of 428.31 KB. The Weight Reshape strategy substantially reduced the computational burden, halving MACs to 1.391 million, cutting latency to 137.7 ms, and lowering energy consumption to 9.848 mJ. The Quantized NAS model achieved the most aggressive storage compression, reducing Flash to 131.22 KB and weight size to 104.78 KB, while its computational demand remained relatively high at 2.698 million MACs, while energy per inference dropped to 4.037 mJ. The Combined optimization approach balanced these benefits, achieving the lowest latency at 33.98 ms, minimal storage (110.28 KB Flash, 84.61 KB weights), reduced complexity at 1.384 million MACs, and the lowest energy consumption of 2.118 mJ, making it the most practical choice for deployment.
The
Grasp dataset, illustrated in
Figure 11, follows a similar trajectory but reveals the distinctive strengths of the optimizations. Inference time decreased progressively across the models, from 133.9 ms in the NAS baseline to 73.3 ms with Weight Reshape, 47.7 ms under Quantized NAS, and just 28.4 ms in the Combined optimization techniques. Storage demands shrank considerably as well, with Flash size reduced from 223.46 KB to 77.03 KB in the Combined variant, alongside a compact weight size of 40.03 KB. RAM usage also decreased steadily from 30.79 KB in the baseline to 15.39 KB in the Combined model. Computationally, Weight Reshape proved highly effective, cutting MACs to 0.682 million, Quantized NAS remained slightly higher at 1.251 million, while the Combined optimization techniques reached an even lower 0.647 million. Energy consumption declined in line with these improvements, dropping from 9.924 mJ in the baseline to just 1.99 mJ in the Combined model.
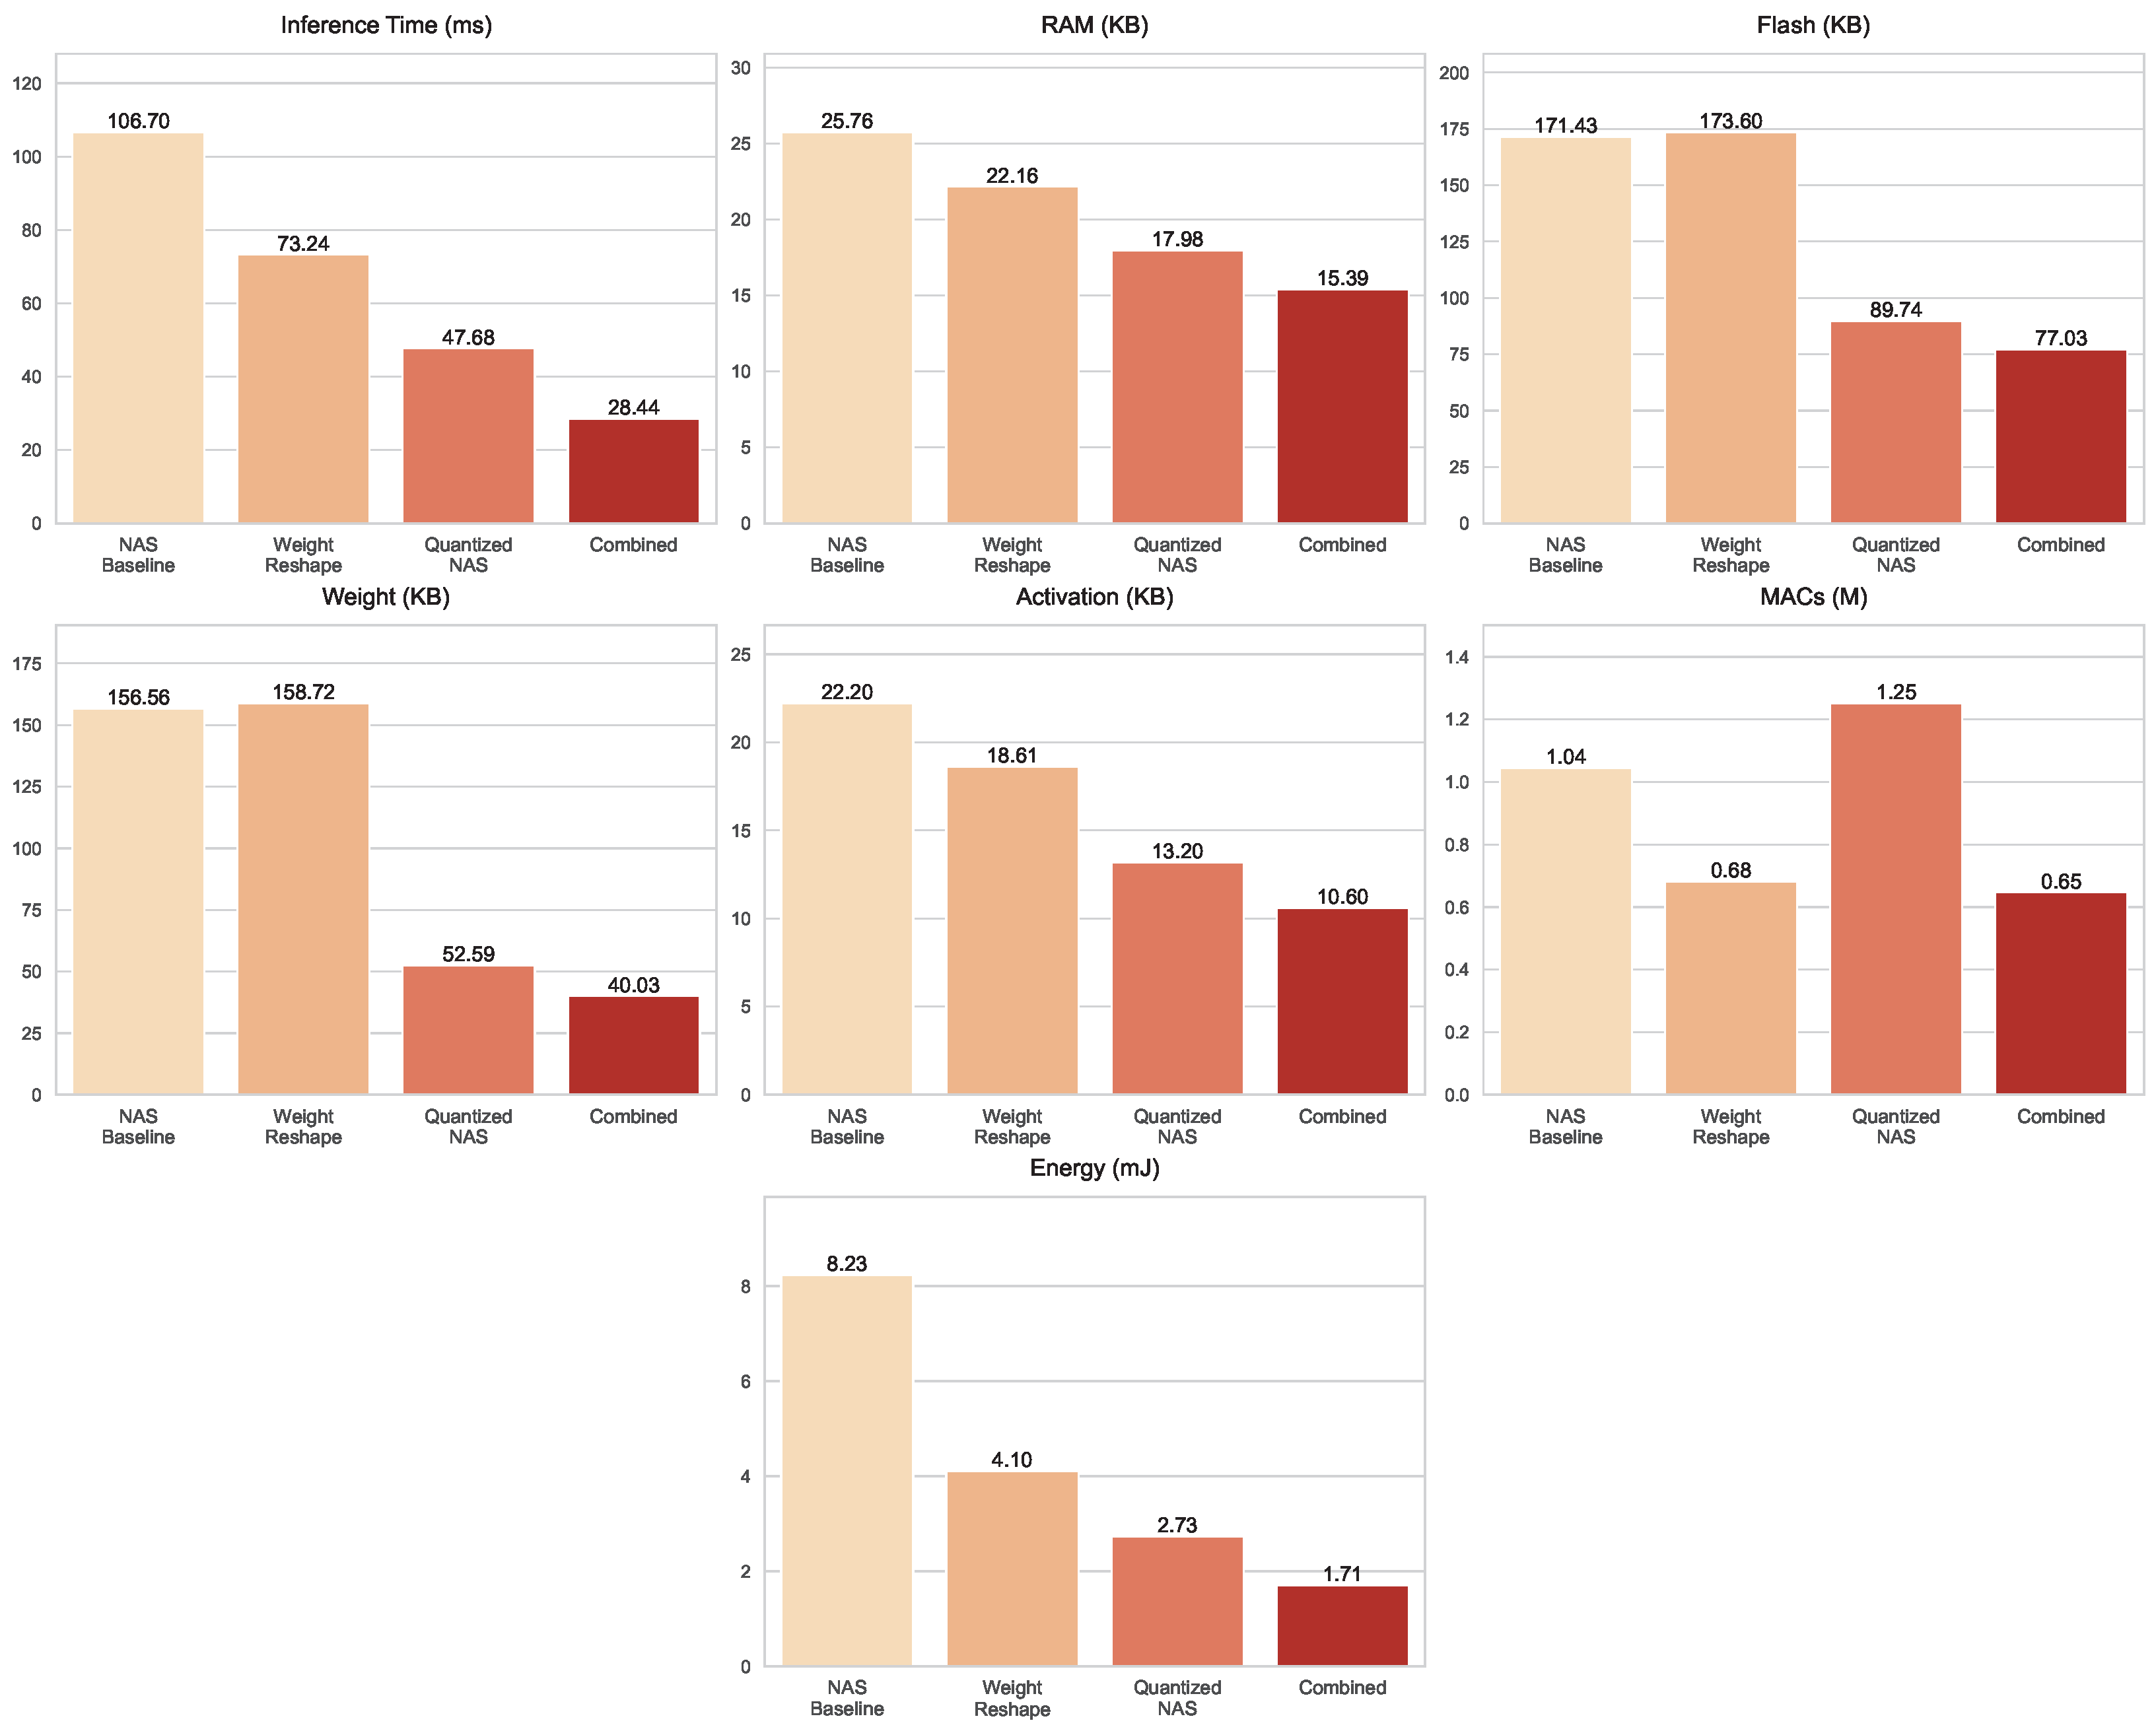
On the
Printed Shapes dataset, shown in
Figure 12, optimization gains are most pronounced in latency and storage. The baseline inference time of 106.7 ms was reduced with Weight Reshape (73.24 ms), further dropped with Quantized NAS (47.68 ms), and was ultimately minimized in the Combined optimization techniques (28.44 ms). Memory usage followed a steady decline, with the Combined optimization techniques requiring only 15.39 KB of RAM and 10.6 KB of activations. Storage efficiency was particularly striking: while Quantized NAS already reduced Flash and weight sizes to 89.74 KB and 52.59 KB, respectively, the Combined optimization techniques compressed them further to just 77.03 KB Flash and 40.03 KB weights. For computation, Weight Reshape lowered MACs to about 0.682 million, Quantized NAS remained higher at 1.251 million, whereas the Combined optimization techniques offered the most efficient configuration at 0.647 million MACs. Energy consumption decreased progressively, from 8.231 mJ in the baseline to 4.102 mJ with Weight Reshape, 2.728 mJ with Quantized NAS, and 1.707 mJ in the Combined model.
In summary, these results demonstrate that NAS-derived 1D-CNNs can be effectively optimized for embedded deployment through strategies that balance accuracy, computational efficiency, and resource usage. Weight reshaping consistently improved or preserved both accuracy and inference performance, while quantization significantly reduced storage requirements. Although quantization can slightly increase MAC operations due to element-wise scaling, such as applying scale factors and zero points to convert between integer and floating point representations, these operations are lightweight and do not meaningfully impact inference performance. Given that power consumption is closely tied to the number and type of MAC operations, using 8-bit integer arithmetic in our quantized models drastically reduces energy compared to full-precision floating-point MACs. Consequently, even with minor increases in MACs, overall energy usage remains low. By combining weight reshaping and quantization, the models achieved the most favorable trade-offs across all datasets, reducing latency, memory usage, storage footprint, and energy consumption simultaneously. These findings illustrate a practical and cohesive approach to deploying high-performance, energy-efficient, and resource-conscious 1D-CNNs for real-world embedded AI applications.
4.3. Discussion
Table 7 summarizes the percentage reduction of key performance metrics achieved by the Combined optimization techniques relative to the NAS baseline across the
Textures,
Grasp, and
Printed Shapes datasets. The results demonstrate that the proposed approach substantially reduces computational and memory requirements while maintaining the quality of results represented by the accuracy. Across datasets, the Combined optimization techniques show modest improvements in testing accuracy (Acc), with gains of 1.28% for the
Textures dataset and 0.45% for the
Grasp dataset, while the
Printed Shapes dataset shows a slight decrease of 0.27%. This indicates that the optimization process preserves model performance and, in some cases, slightly enhances it. These findings underscore the effectiveness of integrating weight reshaping and quantization strategies with NAS, which identifies high-performing architectures and enables targeted optimization to balance efficiency and accuracy.
The computational and memory efficiency metrics show the most significant improvements. Inference time () is reduced by 73.3–86.9%, enabling faster predictions, while the number of MAC operations is nearly halved, reflecting a substantial decrease in computational complexity. Memory usage is also significantly reduced, with RAM requirements decreasing by up to 49.06%, and Flash memory by as much as 74.3% in the Textures dataset. These savings are complemented by large reductions in weight size (W), which exceed 80%, and activation size (Act), which is reduced by more than 60%. Energy consumption is also substantially lowered, with reductions of up to 89.2% in the Textures dataset. Together, these improvements highlight the efficiency of the Combined optimization techniques without compromising predictive performance. This performance analysis demonstrates that the Combined optimization techniques effectively leverage NAS in conjunction with weight reshaping and quantization to produce a network that is both highly efficient and accurate. The approach drastically reduces inference time, memory footprint, computational load, and energy consumption, while maintaining predictive accuracy.
This highlights the potential of the method for deployment on resource-constrained devices, providing a robust framework for designing neural networks that achieve an optimal balance between accuracy, computational efficiency, and energy usage. In addition, the consistency of efficiency improvements across various datasets underscores the generalization of the proposed optimization framework.
To assess the suitability of the proposed HW-NAS and the optimization pipeline for MCU deployment, the complexity of our NAS-derived 1D-CNN models and the combined optimized version was compared with representative mobile CNNs reported in the literature. The NAS baseline on the Textures dataset, for example, requires 2.7 M MAC operations, 428.31 KB Flash and 260 ms per inference while the combined optimized model reduces this to 1.384 M MACs, 110.28 KB Flash and 33.98 ms per inference. In contrast, even reduced MobileNetV2 variants with a width multiplier of 0.35 reported in literature still demand tens of millions of MACs (59.2 M) [
52]. In addition, the lightweight blade damage detection model LSSD developed in [
53] requires 3.541 G MACs. While a lightweight remote sensing-image-dehazing network, named LRSDN proposed in [
54] requires 5.209 G MACs. Moreover, the ultra-lightweight Tiny YOLOv3 variant reported for embedded object detection demands over 1.2 G MACs [
55]. These comparisons highlight the much larger computational burden of even lightweight models in the literature compared to the optimized NAS model achieved in this work, demonstrating its efficiency and suitability for MCU deployment.
Finally, the achieved results establish that the integration of NAS-derived architectures with targeted optimization strategies offers a promising pathway for deploying high-performance models in resource-constrained environments.

