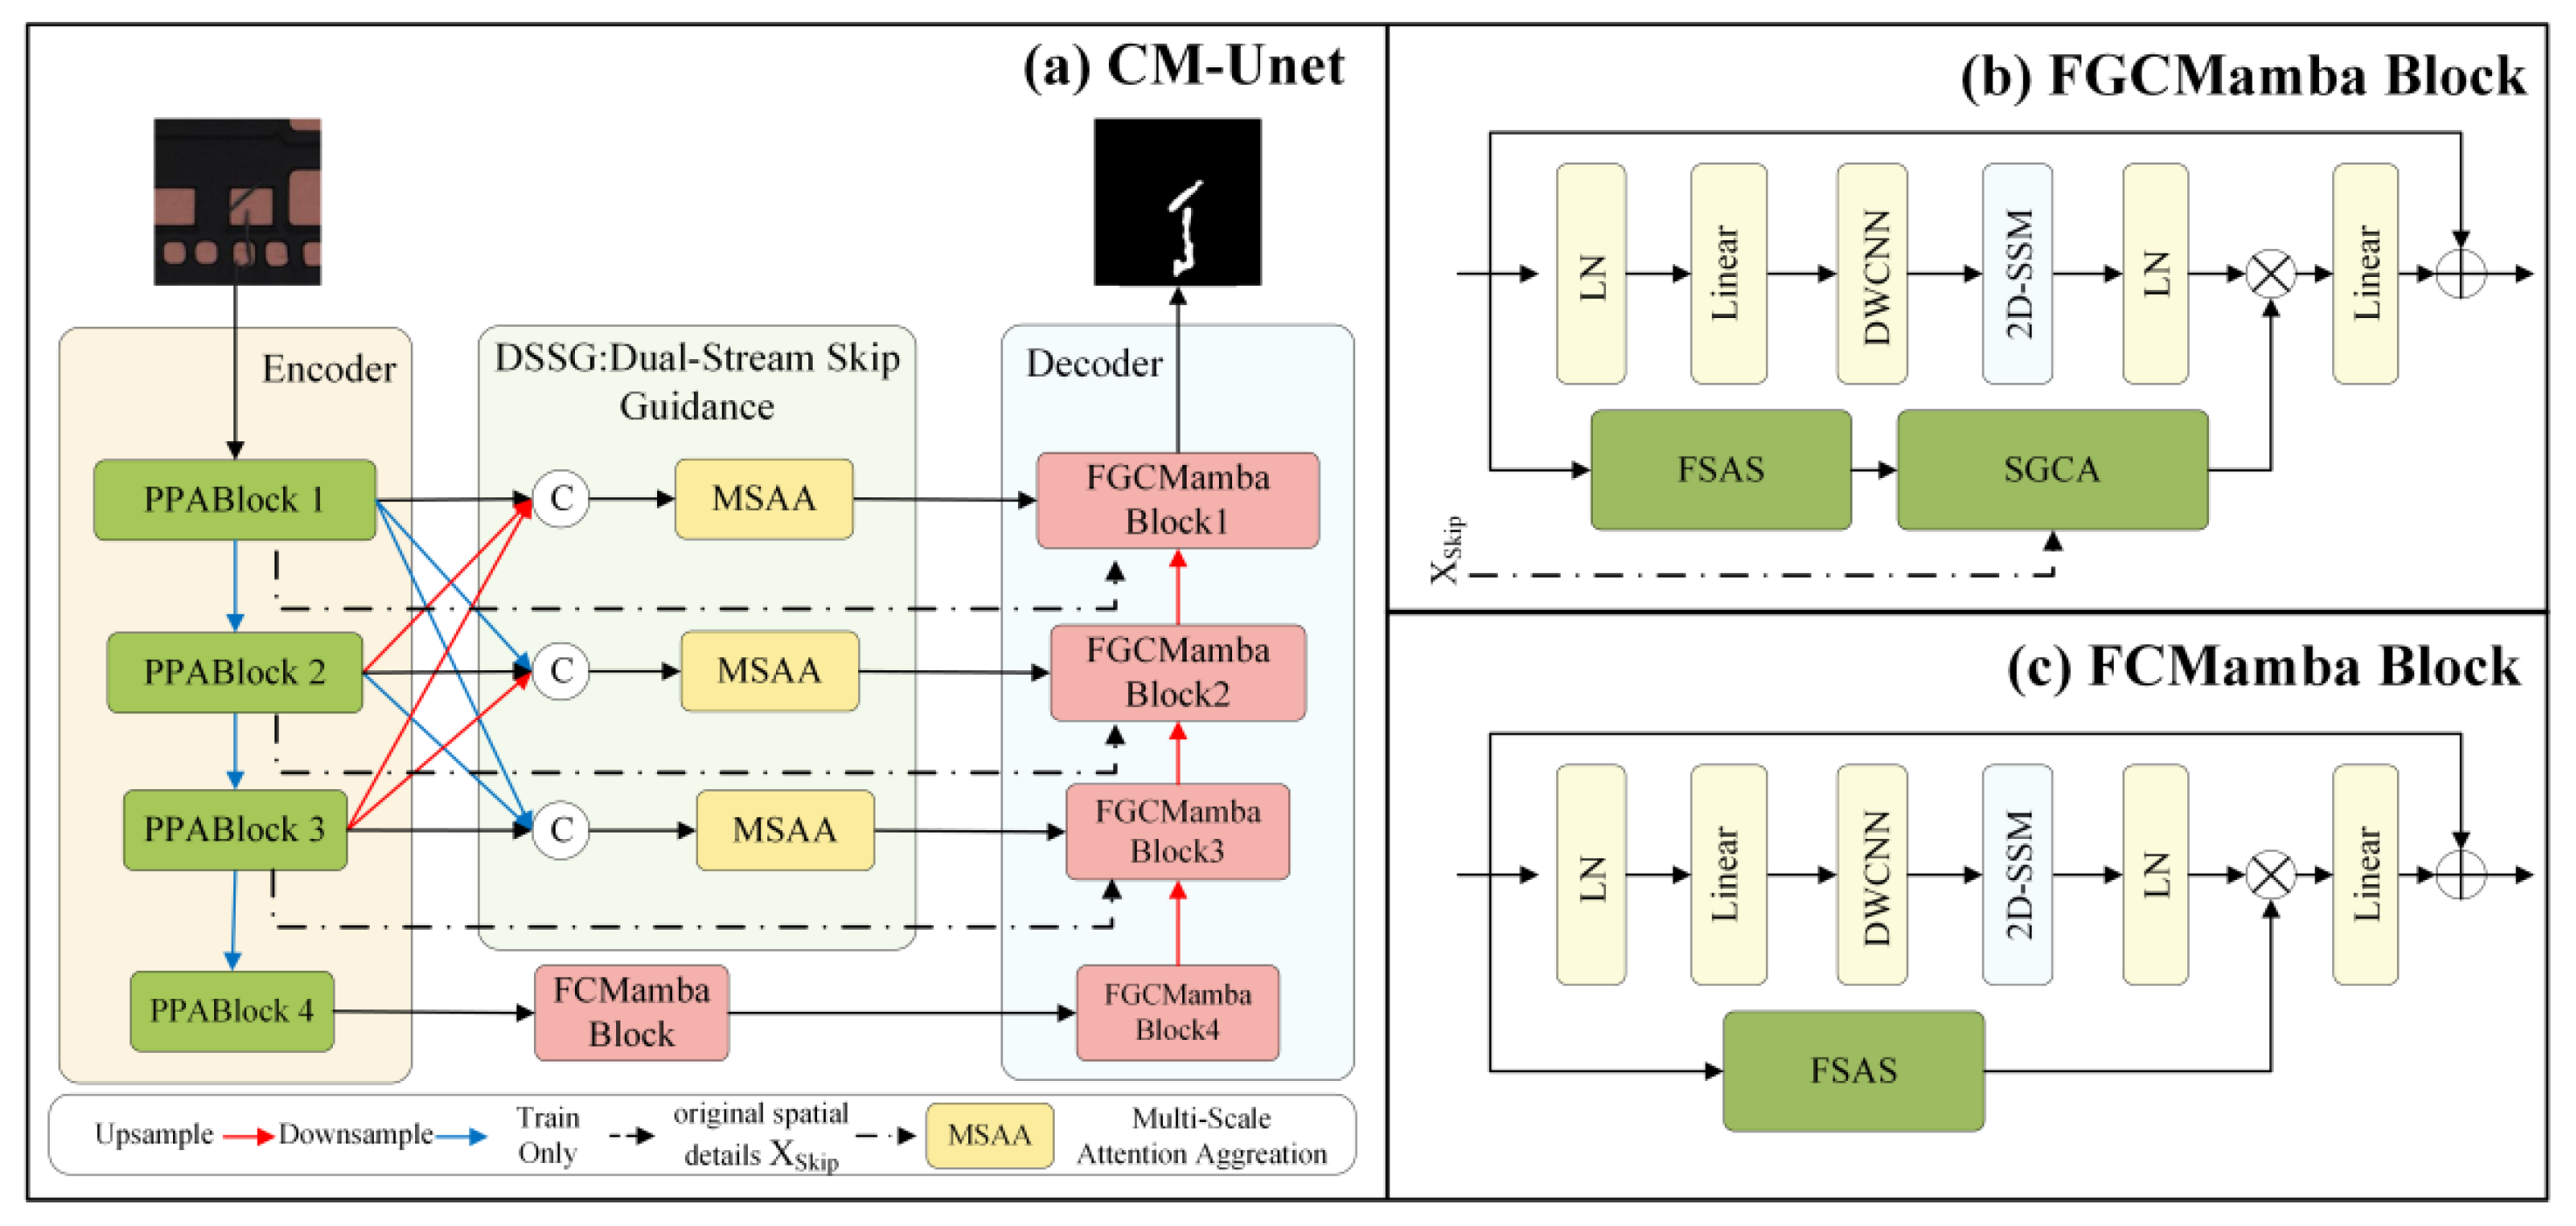
Figure 1.
The structure of the proposed CM-UNetv2 network.
Figure 1.
The structure of the proposed CM-UNetv2 network.
Figure 2.
The module consists of two main components: a multi-branch feature fusion mechanism and a sequential attention refinement. The fusion stage combines patch-aware branches (with patch sizes and for local and global context) with a serial convolutional branch to enhance multi-scale representation. The aggregated features are further refined using channel and spatial attention modules. The output is split into three pathways for progressive encoding, semantic refinement, and spatial skip connection, as illustrated.
Figure 3.
The proposed FSAS module. Q (query), K (key), and V (value) are derived from the input feature via 1 × 1 and 3 × 3 convolutions. Q and K are processed in the frequency domain to compute attention, and V is used to aggregate contextual information.
Figure 3.
The proposed FSAS module. Q (query), K (key), and V (value) are derived from the input feature via 1 × 1 and 3 × 3 convolutions. Q and K are processed in the frequency domain to compute attention, and V is used to aggregate contextual information.
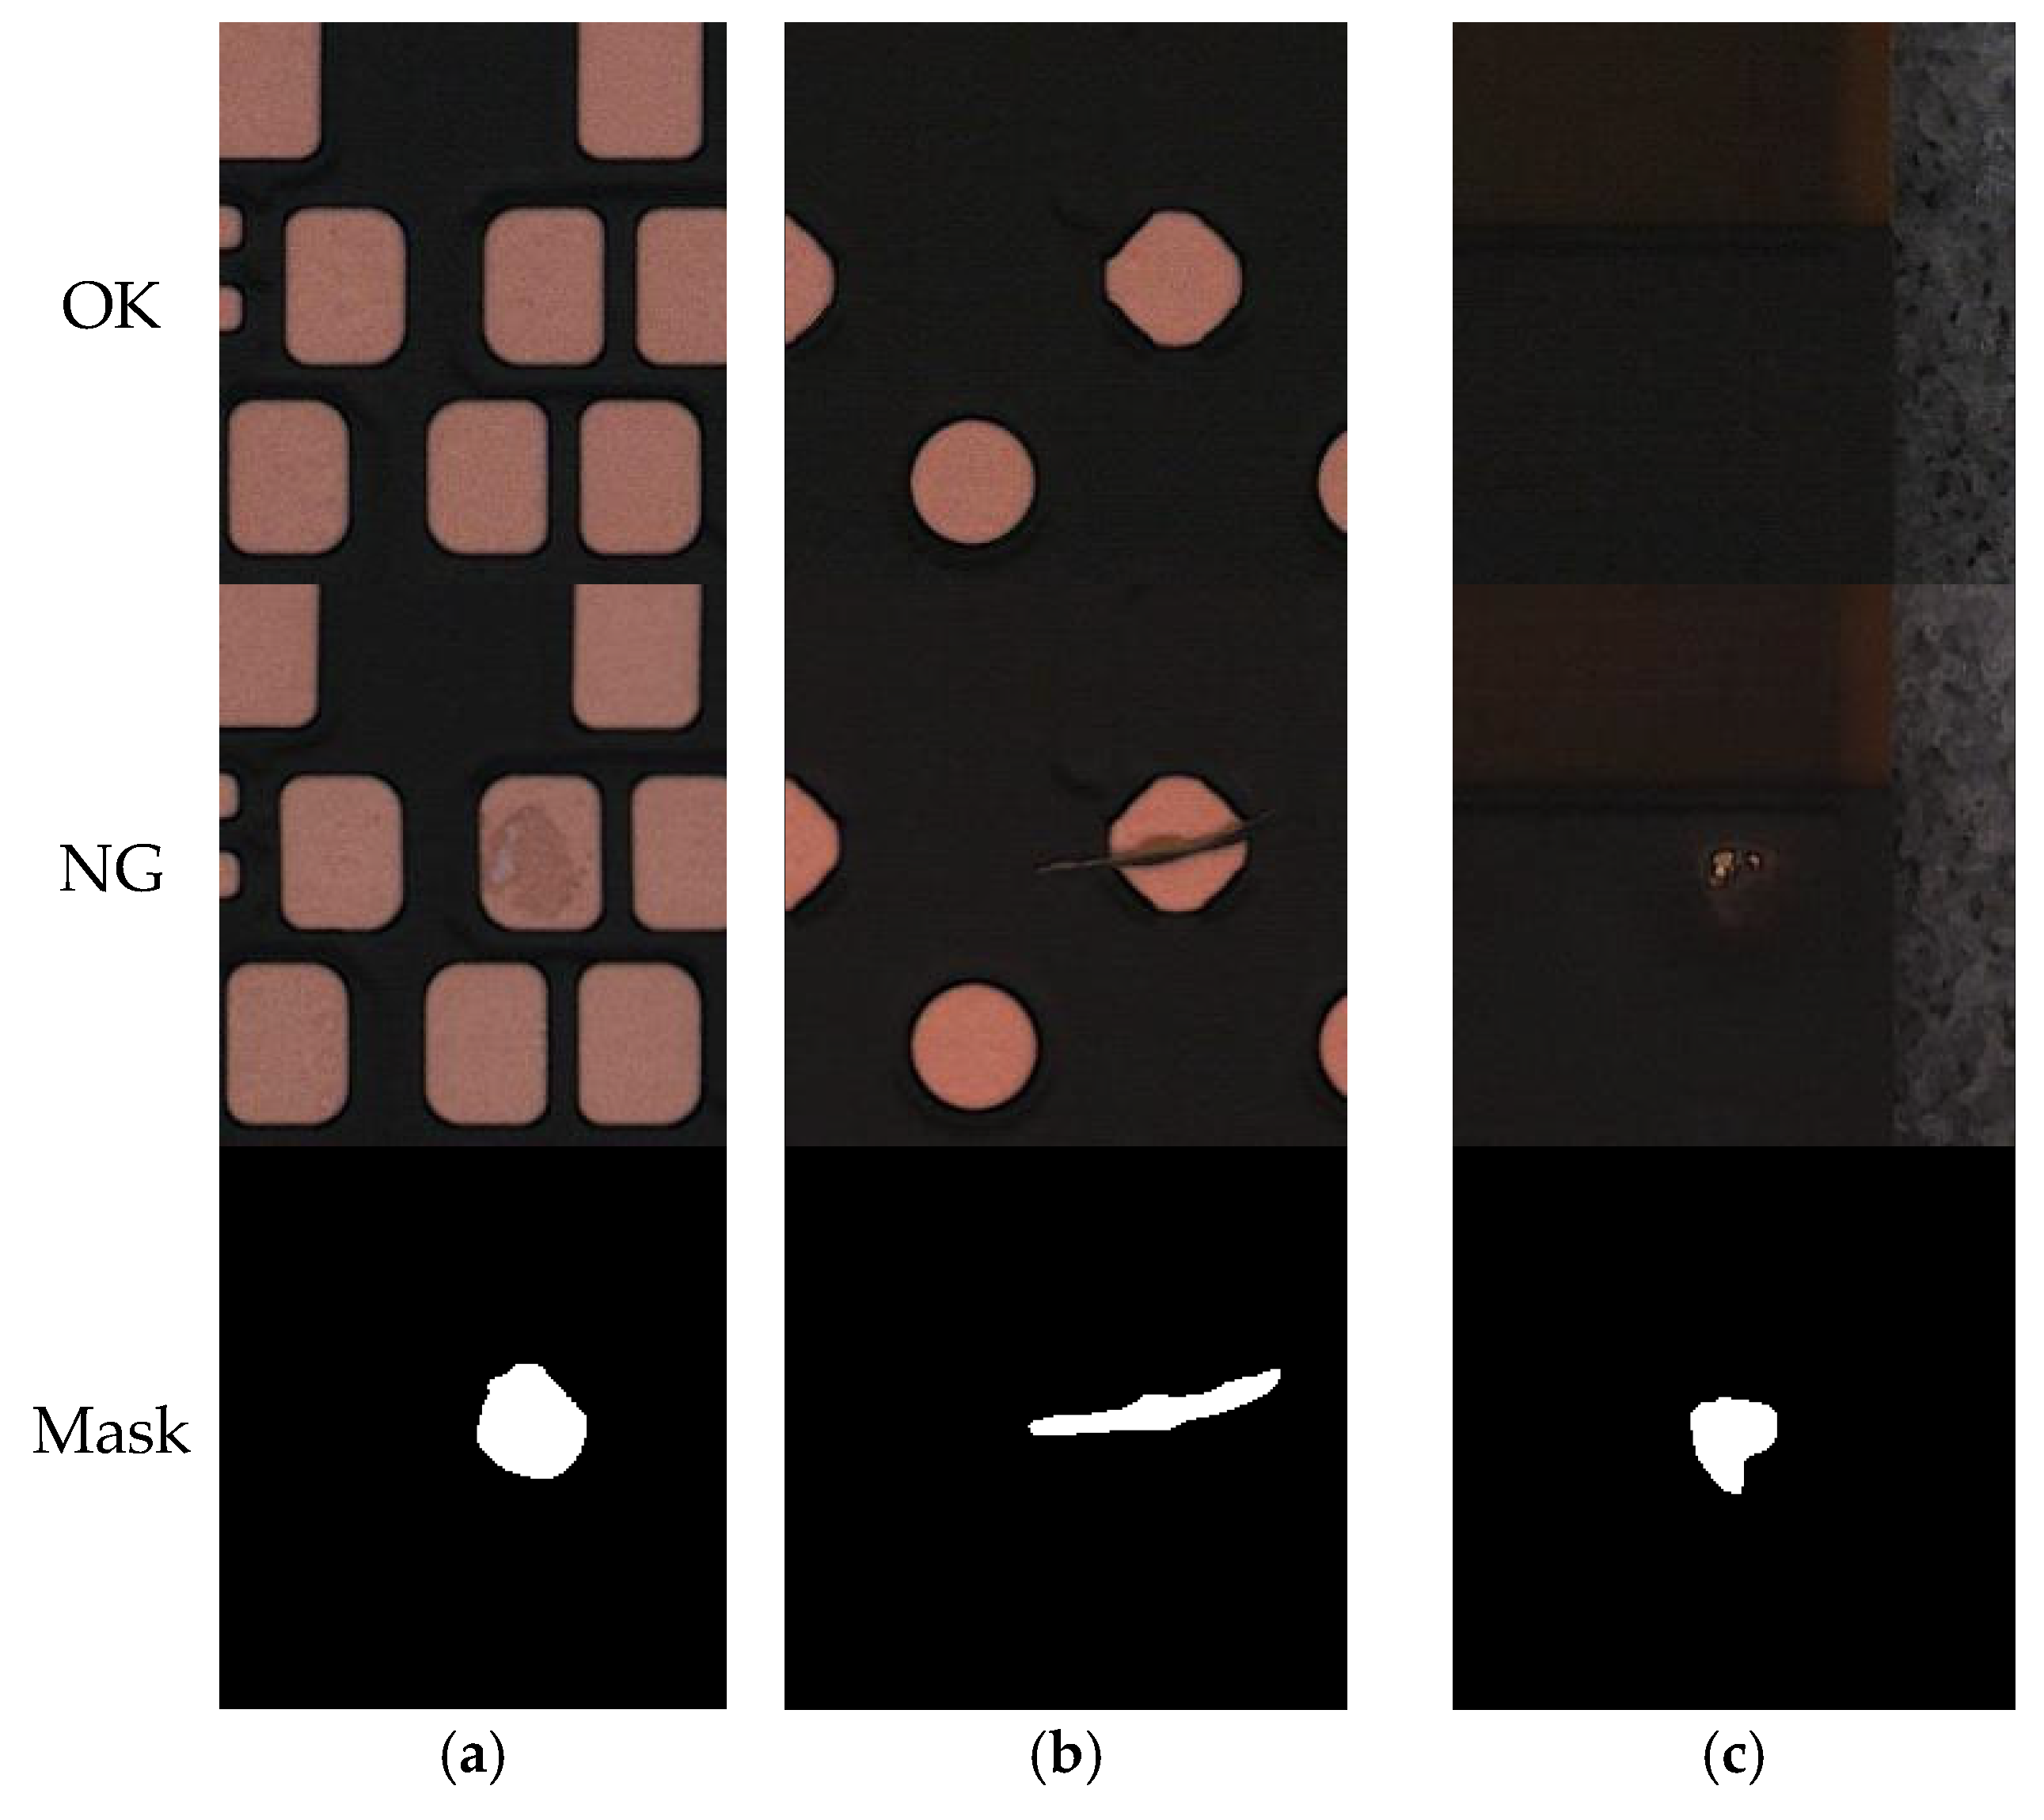
Figure 4.
Visualization examples of the MeiweiPCB dataset: (a) surface contamination: normal image, defect image, and mask; (b) scratch defect: normal image, defect image, and mask; and (c) foreign object intrusion: normal image, defect image, and mask.
Figure 4.
Visualization examples of the MeiweiPCB dataset: (a) surface contamination: normal image, defect image, and mask; (b) scratch defect: normal image, defect image, and mask; and (c) foreign object intrusion: normal image, defect image, and mask.
Figure 5.
Visualization examples of the KWSD2 dataset: (a) water bodies near roads; (b) water bodies near residential areas; and (c) small ponds in urban areas.
Figure 5.
Visualization examples of the KWSD2 dataset: (a) water bodies near roads; (b) water bodies near residential areas; and (c) small ponds in urban areas.
Figure 6.
Examples of defect segmentation results of CM-UNetv2 on the MeiweiPCB dataset: (a) small defect at the center of a via; (b) two independent defects distributed separately; (c) small defect with blurred edges and interference from approximate circles; and (d) longitudinal strip-shaped defect in the edge region of the image.
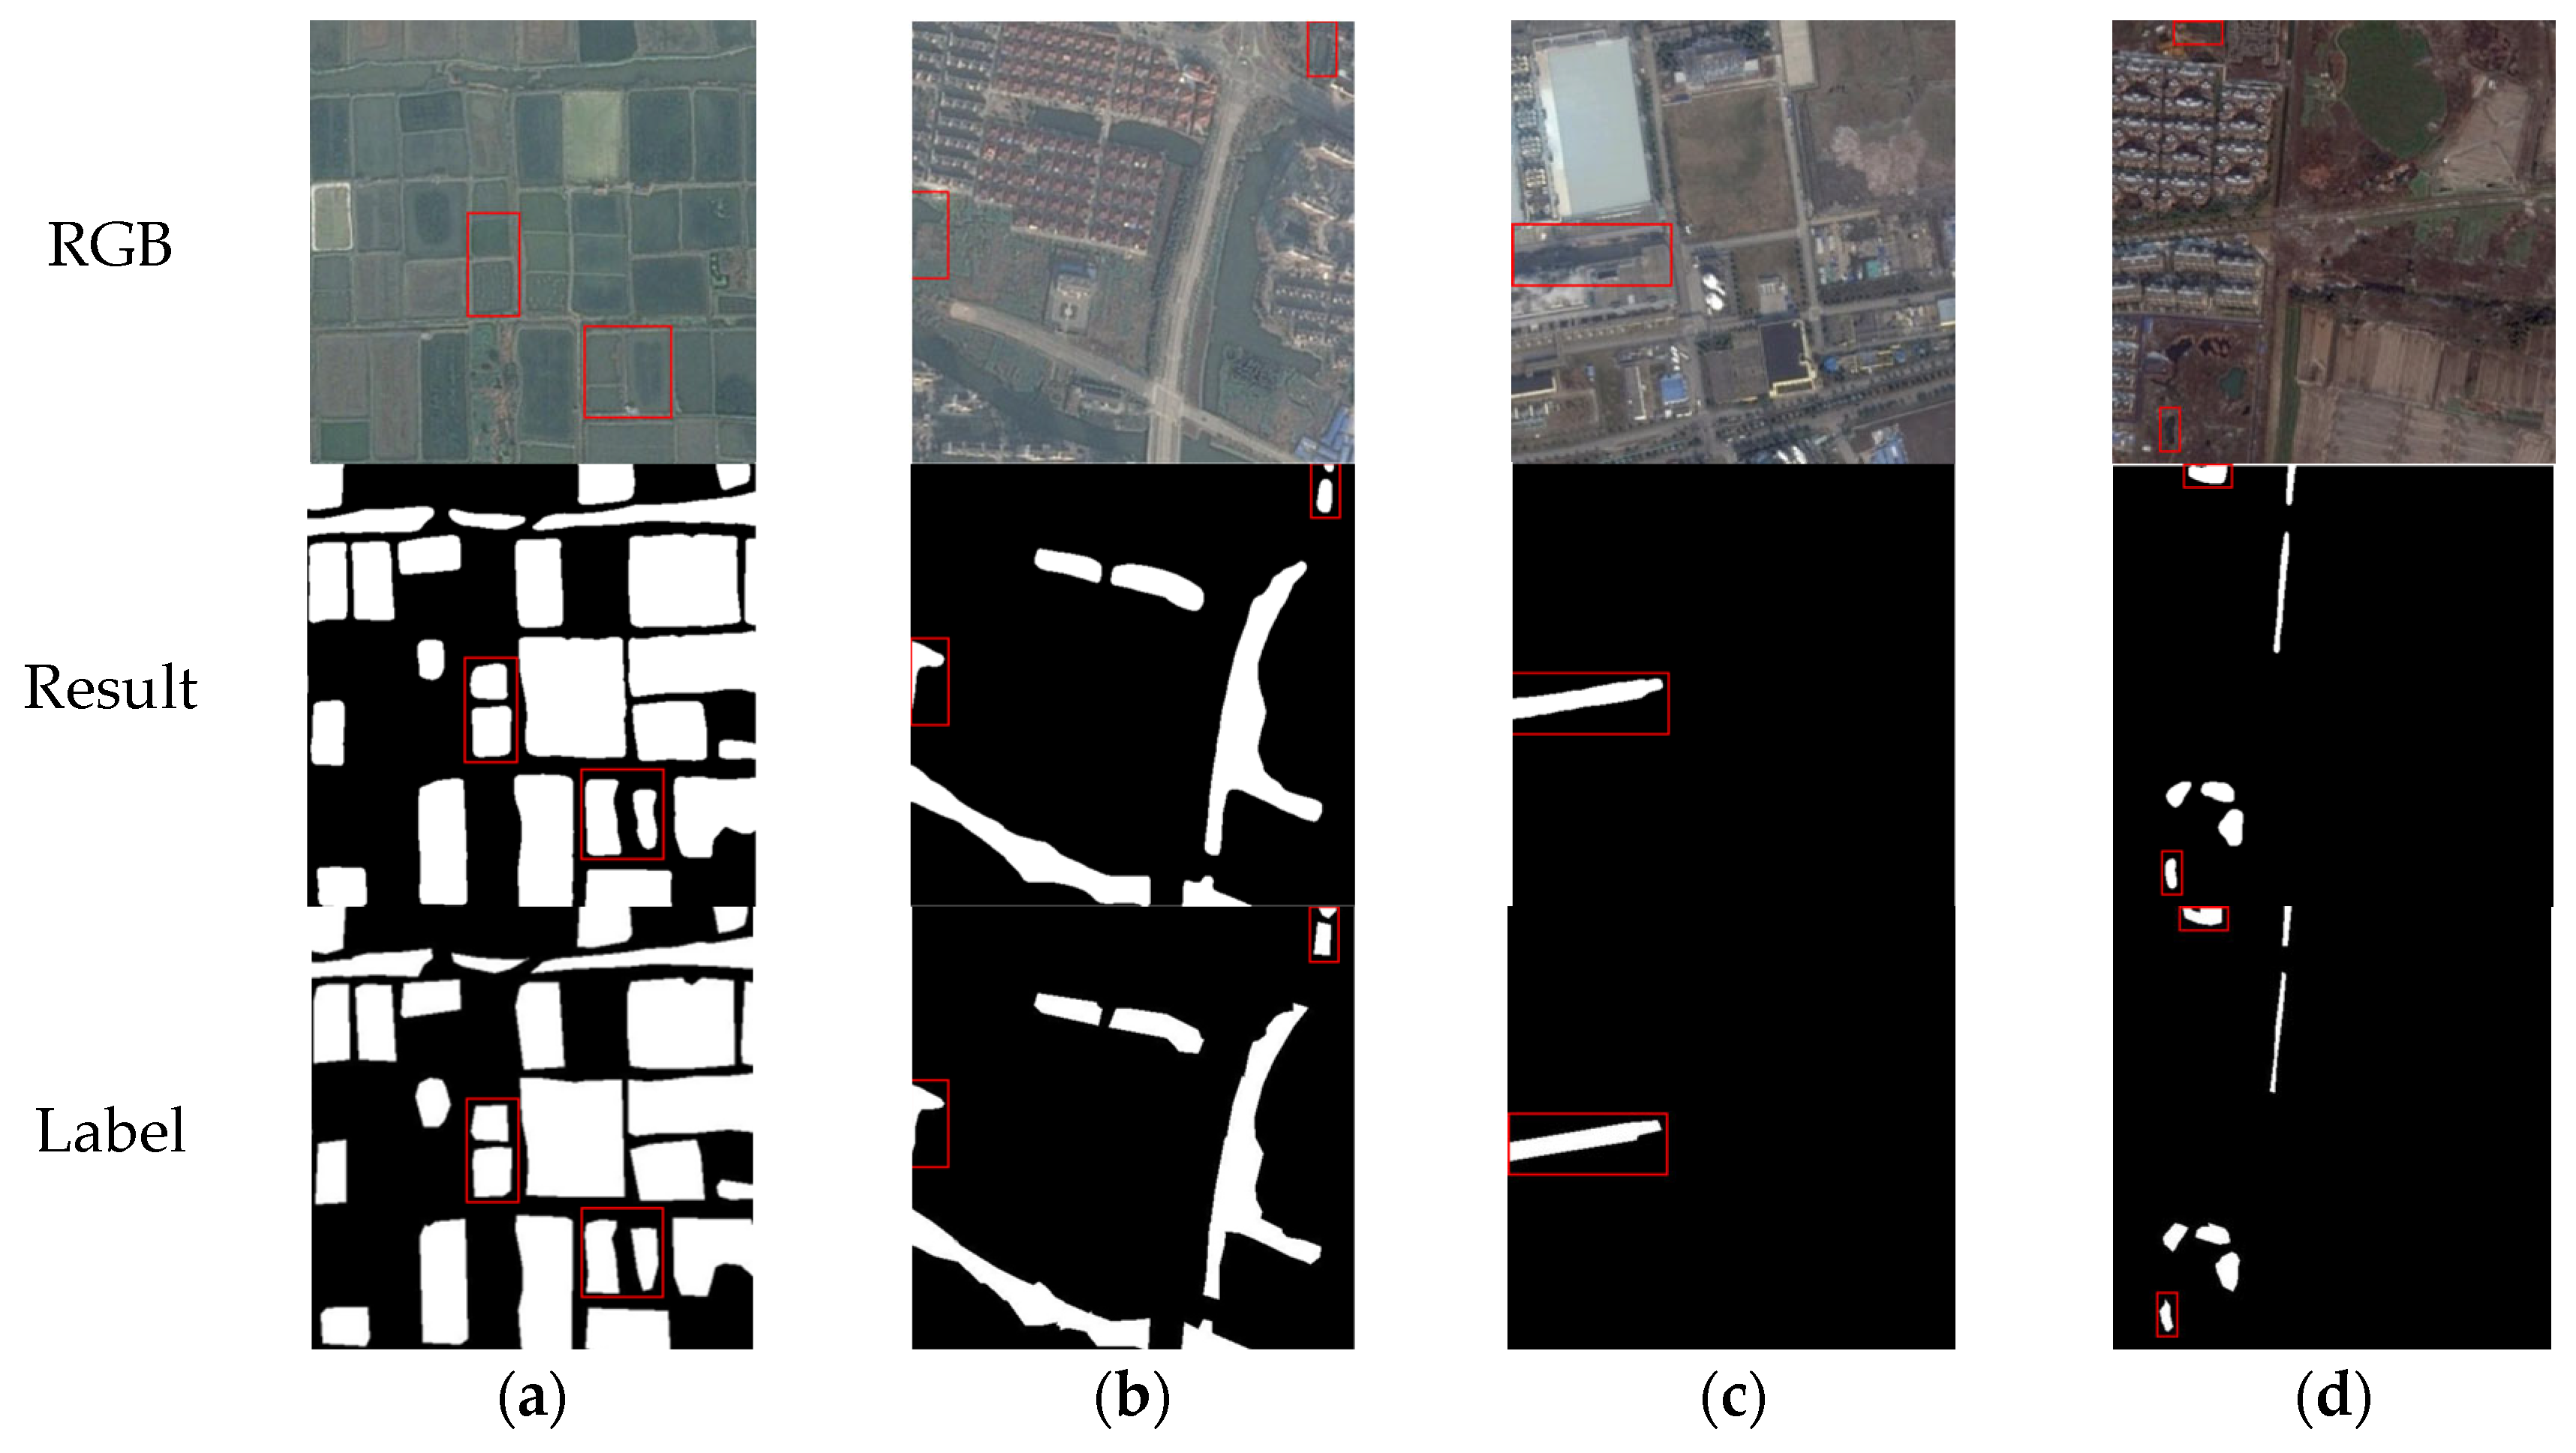
Figure 7.
Examples of water body segmentation results of CM-UNetv2 on the KWSD2 dataset: (a) agricultural area. The red boxes clearly demonstrate the model’s ability to distinctly segment adjacent water bodies; (b) urban region. Despite complex surroundings and blurred boundaries, the red boxes show that the model accurately delineates water edges and preserves continuity; (c) industrial zone. The long and narrow water structures are successfully segmented with smooth contours, demonstrating strong shape preservation ability; and (d) suburban environment. The model accurately detects scattered water patches and narrow streams under cluttered backgrounds, as shown in the highlighted areas.
Figure 8.
Examples of results from the ablation study on network structure on the MeiweiPCB dataset: (a) the PPA module enhances the perception of elongated scratches, reconnecting fragmented regions and improving continuity; (b) DSSG further improves the detection of small-scale defects in cluttered areas by preserving spatial detail and suppressing noise; and (c) with all three modules integrated, the model achieves the most accurate segmentation, successfully recovering long and narrow regions with high boundary fidelity.
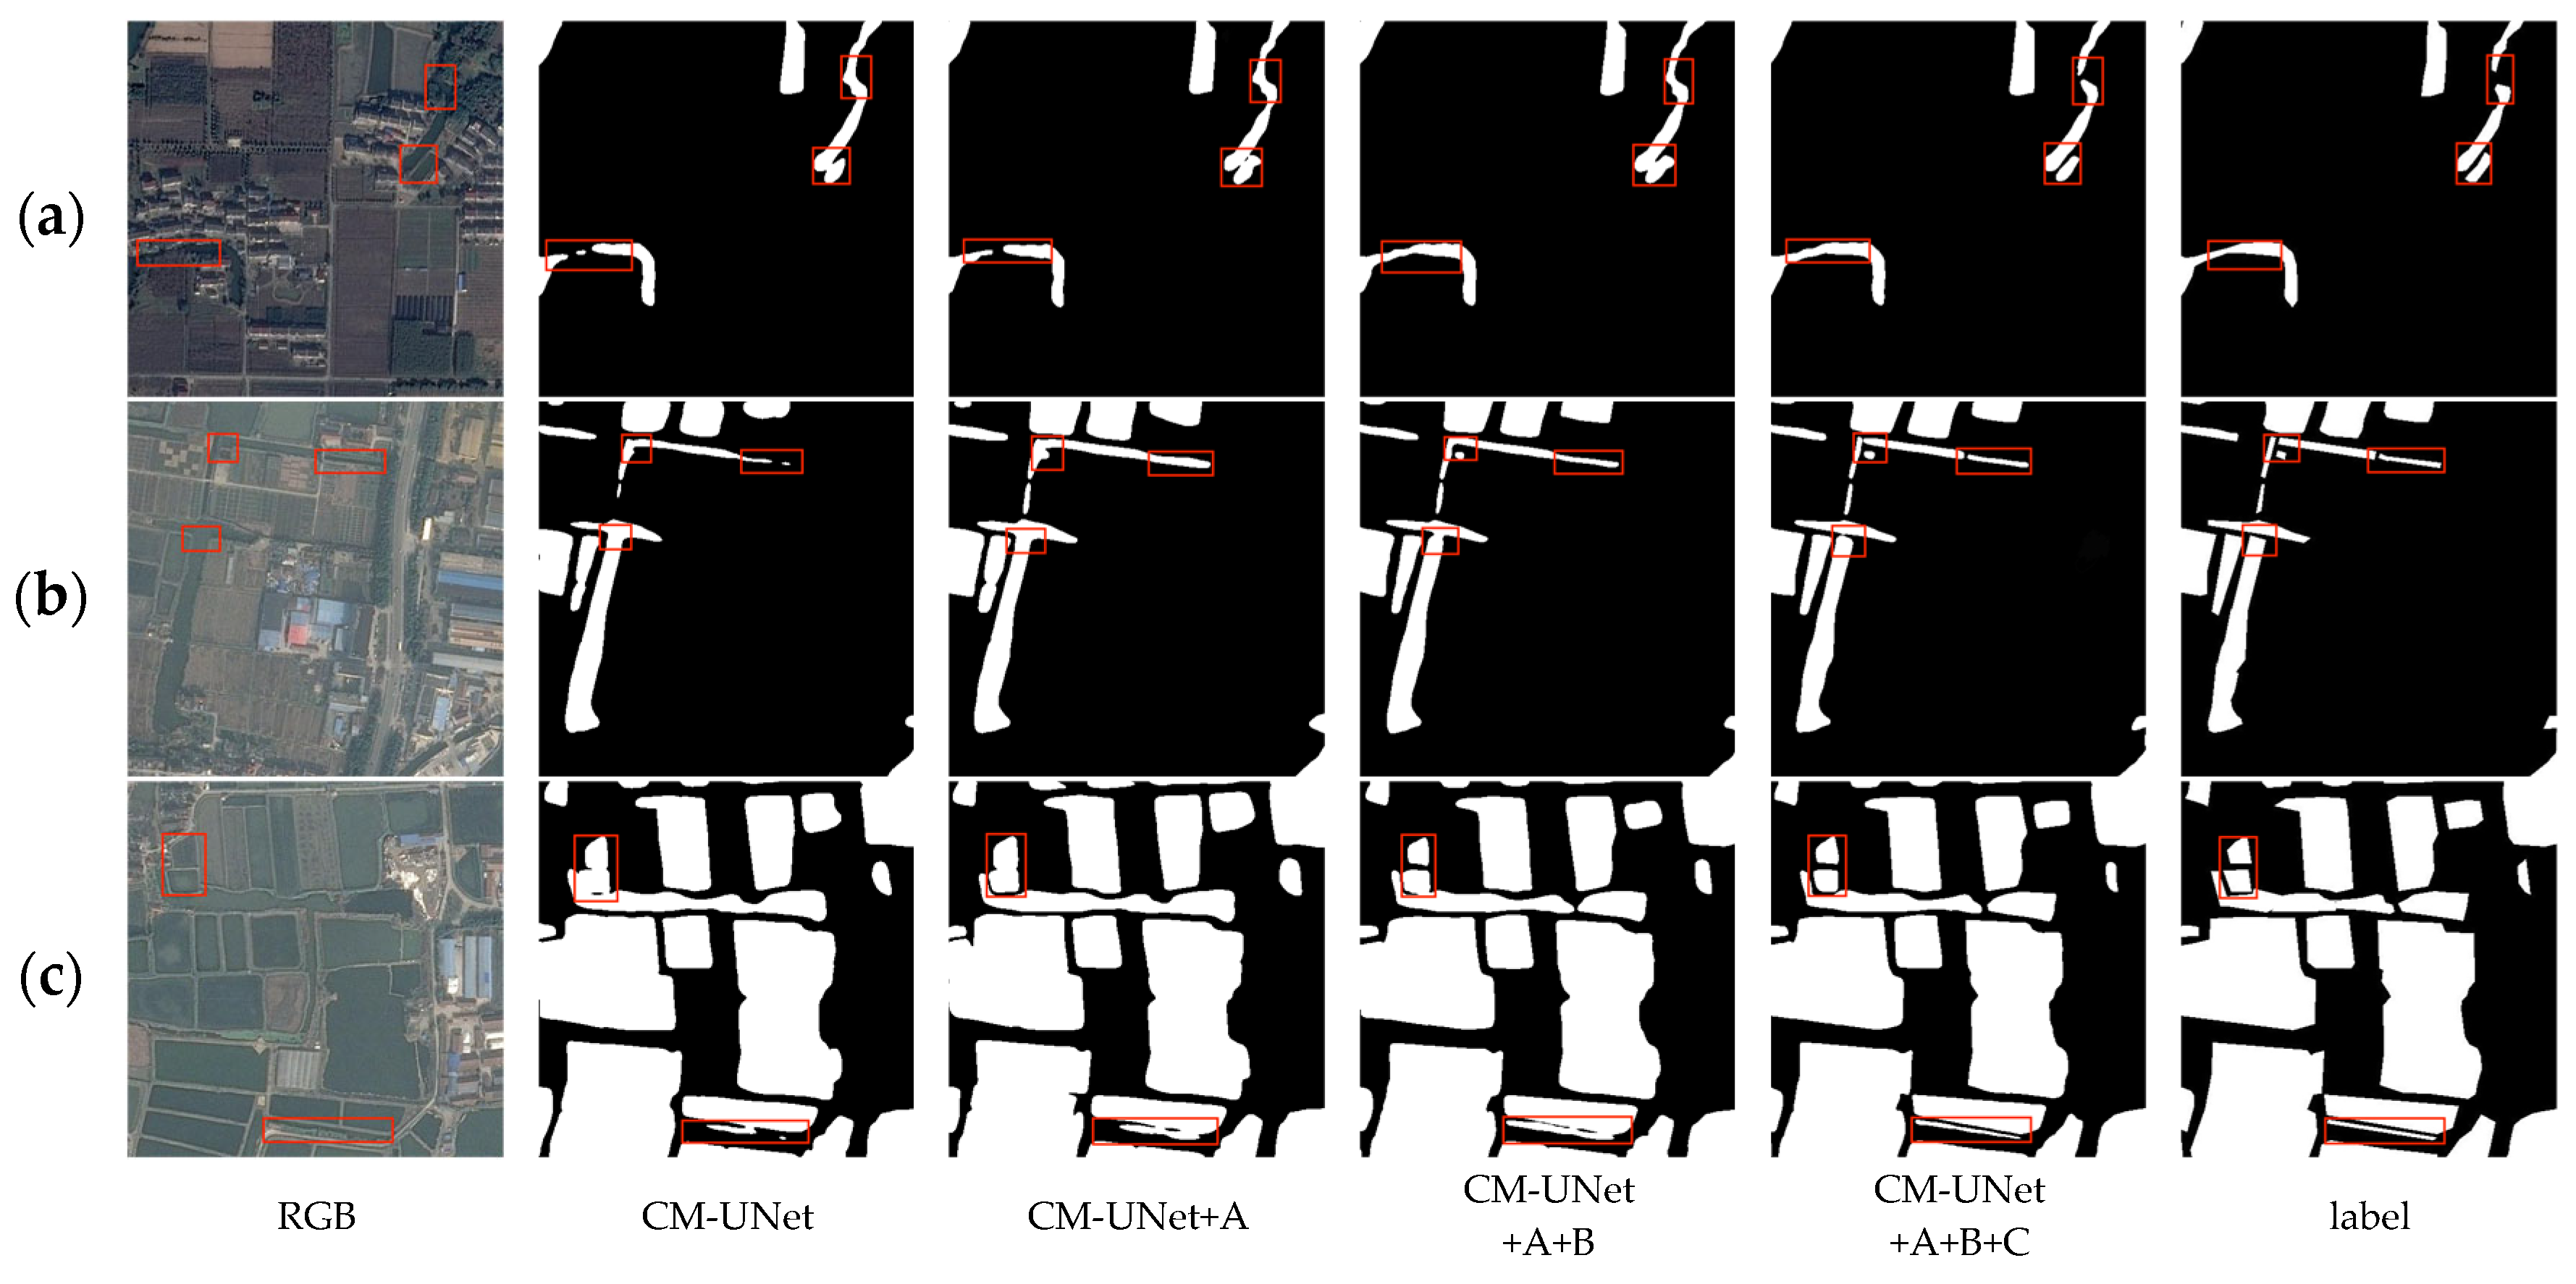
Figure 9.
Examples of ablation study results on network structure using the KWSD2 dataset. (a) The red boxes in the first example highlight adjacent narrow rivers; only with the complete model does the segmentation maintain clear separation, indicating that the PPA module is essential for distinguishing fine-grained structures. (b) In the second example, the red boxes show regions with boundary ambiguity and interference, where the inclusion of the DSSG module helps refine object contours and reduce over-segmentation. (c) In the third case, the addition of the FSAS module enables better recovery of long and fragmented water bodies, enhancing global consistency and restoring overall structural completeness.
Figure 10.
Examples of comparative results with other semantic segmentation methods on the MeiweiPCB dataset: (a) in low-contrast scenarios where defects are close in color to the background, have blurred edges, and obvious texture interference, CM-UNetv2 demonstrates stronger detail recognition capabilities; (b) in scenarios with clear defect boundaries and high contrast, CM-UNetv2 still maintains the optimal overall restoration effect, with scratch shapes highly consistent with ground-truth labels; and (c) under complex background interference where subtle scratches are obscured by dense structures, CM-UNetv2 successfully extracts complete defect regions by virtue of its good anti-interference ability.
Figure 11.
Examples of comparative results with other semantic segmentation methods on the KWSD2 dataset: (a) in scenarios where the texture difference between water bodies and the background is small and multiple adjacent water areas exist, CM-UNet++ can extract water structures more accurately; and (b) when there are multiple narrow water bodies affected by occlusion in urban areas, CM-UNetv2 outperforms other methods in segmentation, enabling more complete extraction of water structures; (c) in scenes where the contrast between irrigation canals and background fields is indistinct and water bodies are narrow, CM-UNetv2 better maintains the integrity of water structures compared to other methods, with segmentation results closer to ground truth labels.
Table 1.
Results of CM-UNetv2 on the MeiweiPCB dataset and KWSD2 dataset.
Table 1.
Results of CM-UNetv2 on the MeiweiPCB dataset and KWSD2 dataset.
| Dataset | Precision | Recall | F1 | mIOU |
|---|
| MeiweiPCB | 0.8970 | 0.8882 | 0.8925 | 0.8224 |
| KWSD2 | 0.9690 | 0.9822 | 0.9750 | 0.9516 |
Table 2.
Results from the ablation study on network structure using the MeiweiPCB dataset.
Table 2.
Results from the ablation study on network structure using the MeiweiPCB dataset.
| Method | Precision | Recall | F1 | mIOU |
|---|
| CM-UNet | 0.8640 | 0.8580 | 0.8615 | 0.7932 |
| CM-UNet+A | 0.8680 | 0.8650 | 0.8645 | 0.8061 |
| CM-UNet+B | 0.8750 | 0.8755 | 0.8752 | 0.8099 |
| CM-UNet+C | 0.8685 | 0.8605 | 0.8620 | 0.7978 |
| CM-UNet+A+B | 0.8905 | 0.8800 | 0.8851 | 0.8125 |
| CM-UNet+A+C | 0.8845 | 0.8855 | 0.8850 | 0.8168 |
| CM-UNet+A+B+C | 0.8970 | 0.8882 | 0.8925 | 0.8224 |
Table 3.
Results from the ablation study on network structure using the KWSD2 dataset.
Table 3.
Results from the ablation study on network structure using the KWSD2 dataset.
| Method | Precision | Recall | F1 | mIOU |
|---|
| CM-UNet | 0.9489 | 0.9412 | 0.9450 | 0.9205 |
| CM-UNet+A | 0.9540 | 0.9621 | 0.9580 | 0.9298 |
| CM-UNet+B | 0.9572 | 0.9604 | 0.9588 | 0.9336 |
| CM-UNet+C | 0.9510 | 0.9645 | 0.9577 | 0.9250 |
| CM-UNet+A+B | 0.9615 | 0.9695 | 0.9655 | 0.9388 |
| CM-UNet+A+C | 0.9624 | 0.9705 | 0.9665 | 0.9405 |
| CM-UNet+A+B+C | 0.9632 | 0.9720 | 0.9676 | 0.9516 |
Table 4.
Results from the ablation study on Embedding–Depth Architecture using the MeiweiPCB dataset.
Table 4.
Results from the ablation study on Embedding–Depth Architecture using the MeiweiPCB dataset.
| Embed Dim | Depths | Precision | Recall | F1 | mIOU |
|---|
| 4 | 64 | 0.8886 | 0.8840 | 0.8863 | 0.8178 |
| 3 | 128 | 0.8944 | 0.8850 | 0.8897 | 0.8199 |
| 2 | 96 | 0.8970 | 0.8882 | 0.8925 | 0.8224 |
Table 5.
Results from the ablation study on Embedding–Depth Architecture using the KWSD2 dataset.
Table 5.
Results from the ablation study on Embedding–Depth Architecture using the KWSD2 dataset.
| Embed Dim | Depths | Precision | Recall | F1 | mIOU |
|---|
| 4 | 64 | 0.9602 | 0.9690 | 0.9645 | 0.9495 |
| 3 | 128 | 0.9618 | 0.9705 | 0.9661 | 0.9505 |
| 2 | 96 | 0.9632 | 0.9720 | 0.9676 | 0.9516 |
Table 6.
Comparative results with other semantic segmentation methods on the MeiweiPCB dataset.
Table 6.
Comparative results with other semantic segmentation methods on the MeiweiPCB dataset.
| Method | Precision | Recall | F1 | mIOU |
|---|
| Deeplabv3+ | 0.8712 | 0.8576 | 0.8643 | 0.7855 |
| SegFormer | 0.8560 | 0.8415 | 0.8487 | 0.7730 |
| TransUnet | 0.8890 | 0.8785 | 0.8837 | 0.8115 |
| Swinunet | 0.8615 | 0.8470 | 0.8542 | 0.7783 |
| CM-UNet | 0.8640 | 0.8580 | 0.8615 | 0.7932 |
| CM-UNet++ | 0.8732 | 0.8610 | 0.8670 | 0.8084 |
| CM-UNetv2 | 0.8970 | 0.8882 | 0.8925 | 0.8224 |
Table 7.
Comparative results with other semantic segmentation methods on the KWSD2 dataset.
Table 7.
Comparative results with other semantic segmentation methods on the KWSD2 dataset.
| Method | Precision | Recall | F1 | mIOU |
|---|
| Deeplabv3+ | 0.9450 | 0.9410 | 0.9430 | 0.9320 |
| SegFormer | 0.9368 | 0.9491 | 0.9429 | 0.9158 |
| TransUnet | 0.9377 | 0.9432 | 0.9404 | 0.9223 |
| Swinunet | 0.9342 | 0.9481 | 0.9411 | 0.9186 |
| CM-UNet | 0.9489 | 0.9412 | 0.9450 | 0.9205 |
| CM-UNet++ | 0.9549 | 0.9571 | 0.9560 | 0.9425 |
| CM-UNetv2 | 0.9632 | 0.9720 | 0.9676 | 0.9516 |
Table 8.
Computational complexity analysis measured on 256 × 256 inputs using a single NVIDIA 4090 GPU, with mIOU evaluated on the MeiweiPCB dataset.
Table 8.
Computational complexity analysis measured on 256 × 256 inputs using a single NVIDIA 4090 GPU, with mIOU evaluated on the MeiweiPCB dataset.
| Method | FLOPs (G) | Param. (M) | FPS | mIOU |
|---|
| Deeplabv3+ | 82.95 | 60.99 | 58.32 | 0.7855 |
| SegFormer | 17.84 | 47.22 | 43.31 | 0.7730 |
| TransUnet | 37.23 | 93.23 | 53.47 | 0.8115 |
| Swinunet | 46.52 | 149.10 | 31.29 | 0.7783 |
| CM-UNet | 13.28 | 13.11 | 60.74 | 0.7932 |
| CM-UNet++ | 71.65 | 8.71 | 36.43 | 0.8084 |
| CM-UNetv2 | 21.63 | 22.02 | 47.32 | 0.8224 |
Table 9.
Complexity and inference speed of ablated CM-UNetv2 variants on MeiweiPCB (256 × 256, 4090 GPU).
Table 9.
Complexity and inference speed of ablated CM-UNetv2 variants on MeiweiPCB (256 × 256, 4090 GPU).
| Method | FLOPs (G) | Param. (M) | FPS |
|---|
| CM-UNetv2 | 21.63 | 22.02 | 47.32 |
| w/o DSSG | 20.54 | 21.28 | 50.12 |
| w/o PPA | 15.19 | 14.31 | 56.12 |
| w/o FSAS | 20.31 | 20.70 | 49.88 |
Table 10.
Complexity and inference speed of ablated CM-UNetv2 variants on KWSD2 (256 × 256, 4090 GPU).
Table 10.
Complexity and inference speed of ablated CM-UNetv2 variants on KWSD2 (256 × 256, 4090 GPU).
| Method | FLOPs (G) | Param. (M) | FPS |
|---|
| CM-UNetv2 | 86.53 | 22.02 | 36.91 |
| w/o DSSG | 83.15 | 21.28 | 39.04 |
| w/o PPA | 57.97 | 14.31 | 44.27 |
| w/o FSAS | 81.25 | 20.70 | 38.73 |


