1. Introduction
As a core component of many offshore wind turbine generator systems, the main bearing typically employs a large single-row tapered roller bearing to meet the demands of its complex operating conditions. Within the bearing’s internal structure, the contact area between the tapered rollers and the raceways constitutes a critical region characterized by highly concentrated stress and the highest risk of failure. During bearing operation, significant contact loads are generated between the rollers and the inner and outer rings [
1]. The magnitude of these loads profoundly influences the bearing’s overall performance and service life [
2,
3]. Consequently, accurately acquiring the contact loads at the roller–raceway interface is of paramount importance for in-depth studies of bearing mechanical behavior, fatigue life prediction, structural design optimization, and enhancing overall reliability [
4,
5].
Due to the difficulty of directly measuring roller contact load, major international wind turbine bearing manufacturers such as SKF and FAG have developed methods to measure internal strain within the rollers to indirectly acquire the contact load [
6,
7,
8,
9,
10]. Within this technical framework, investigating the mapping relationship between contact load and bore strain, as well as the sensitivity of measurement points, becomes two critical issues for accurately obtaining the roller contact load in wind turbine generators. Regarding research on the roller load and strain, Chen et al. [
11] have comprehensively elucidated the analytical methods for the elastic approach in line contact problems, solving and comparatively analyzing them using different methods. Tong and Hong [
12] analyzed the effect of angular misalignment on the operating torque of tapered roller bearings and proposed a method for estimating the contact load on a single tapered roller. Kabus [
13] employed the elastic half-space theory to derive and calculate the contact stress on tapered roller surfaces and subsequently calculated the fatigue life of tapered roller bearings. Yang et al. [
14] analyzed the contact between the roller and raceway based on the finite length contact theory and determined the maximum contact stress of the bearing via an iterative solution. Warda [
15] utilized a three-dimensional elastic body contact method to compute roller contact stress and verified the results via ANSYS simulation. Wei et al. [
16] applied VB programming to calculate the load distribution in tapered roller bearings and simulated the contact load on tapered rollers under various operating conditions. Chen et al. [
17] derived the equilibrium equations for a single tapered roller bearing under load, established a mathematical model for overall contact analysis, and solved the model using MATLAB programming. Ju et al. [
18] focused on tapered roller bearings, employing central control and Hertz contact theory to study the contact stress on their surfaces. Tie et al. [
19] calculated the contact load of tapered roller bearings based on Hertz contact theory and achieved consistency between Romax Designer simulation results and theoretical calculations. Li et al. [
20] used an equivalent substitution approach to establish three mathematical models for calculating roller contact load and deformation. Their proposed new method enables rapid calculation of roller contact deformation at different time points. D. V. Raju [
21] provided theoretical methods for calculating roller contact stress under different operating conditions, enabling accurate prediction. The accuracy of the method was verified through finite element analysis using ABAQUS. Cheng et al. [
22] investigated the load distribution within tapered roller bearings using numerical analysis and simulated the contact stress state using Abaqus software, serving as the basis for bearing design and life assessment. To address the computational efficiency of the finite element method and resolve non-convergence issues, Chen et al. [
23] proposed a finite element contact behavior calculation method using a spring substitution technique, effectively obtaining the contact stress between rollers and raceways. Wang et al. [
24] established a calculation model for roller–raceway contact stress and contact load based on Hertz contact theory and the roller slice theory. Luo et al. [
25], based on the fundamental equations of elastic contact problems and considering curvature variations in tapered roller cross-sections, proposed a simplified calculation method and procedure for tapered roller contact stress, demonstrating its validity through programmed examples. Li et al. [
26] conducted a global analysis of tapered roller bearings in wind turbines using PERMAS, studying the influence of axial clearance on roller load distribution. Liu et al. [
27] investigated the influence of mesh precision on contact calculations in finite element analysis, providing guidance for the precise finite element modeling and analysis of roller bearings. Wei et al. [
28] applied the finite element method to study the internal loads and stresses in tapered roller bearings during loading.
Although the aforementioned research has laid the foundation for establishing the relationship between contact load and roller strain, it lacks an in-depth investigation specifically targeting wind turbine main bearings. Furthermore, research on the mapping relationship for bore strain is notably absent. Regarding studies on strain measurement sensitivity, Shi et al. [
29] designed a structure for high-precision acquisition of minute strains. Characterized by a dumbbell-shaped form (thick ends and a thin middle section), this structure functions to transfer and amplify small strains. Li et al. [
30] combined the lever amplification principle to design an amplification structure capable of increasing the axial strain of fiber Bragg gratings (FBG), thereby enhancing sensor response sensitivity. Zheng et al. [
31] effectively captured the dynamic variations of strain using a rhombic displacement amplification mechanism. Additionally, strain measurement structures such as variable-section ring shapes [
32], among others, have been employed, all contributing to improved strain measurement sensitivity. Wang et al. [
33] arranged multiple load sensors along the roller’s radial direction. While increasing the number of sensors mitigated the influence of roller rotation on contact load measurement, this approach also increased system complexity and elevated circuit power consumption. FAG Corporation [
34] has developed an externally mounted smart bearing that integrates multiple sensors such as temperature, rotational speed, and vibration. The sensors are installed within the sealing groove of the bearing’s outer ring, which increases the structural complexity of the bearing. Based on the existing literature, the research mentioned above has yielded initial achievements in acquiring bearing contact loads, reaching the stage of functional realization. However, research concerning strain measurement sensitivity remains in its nascent stage, with the underlying theories and technical solutions requiring further significant development.
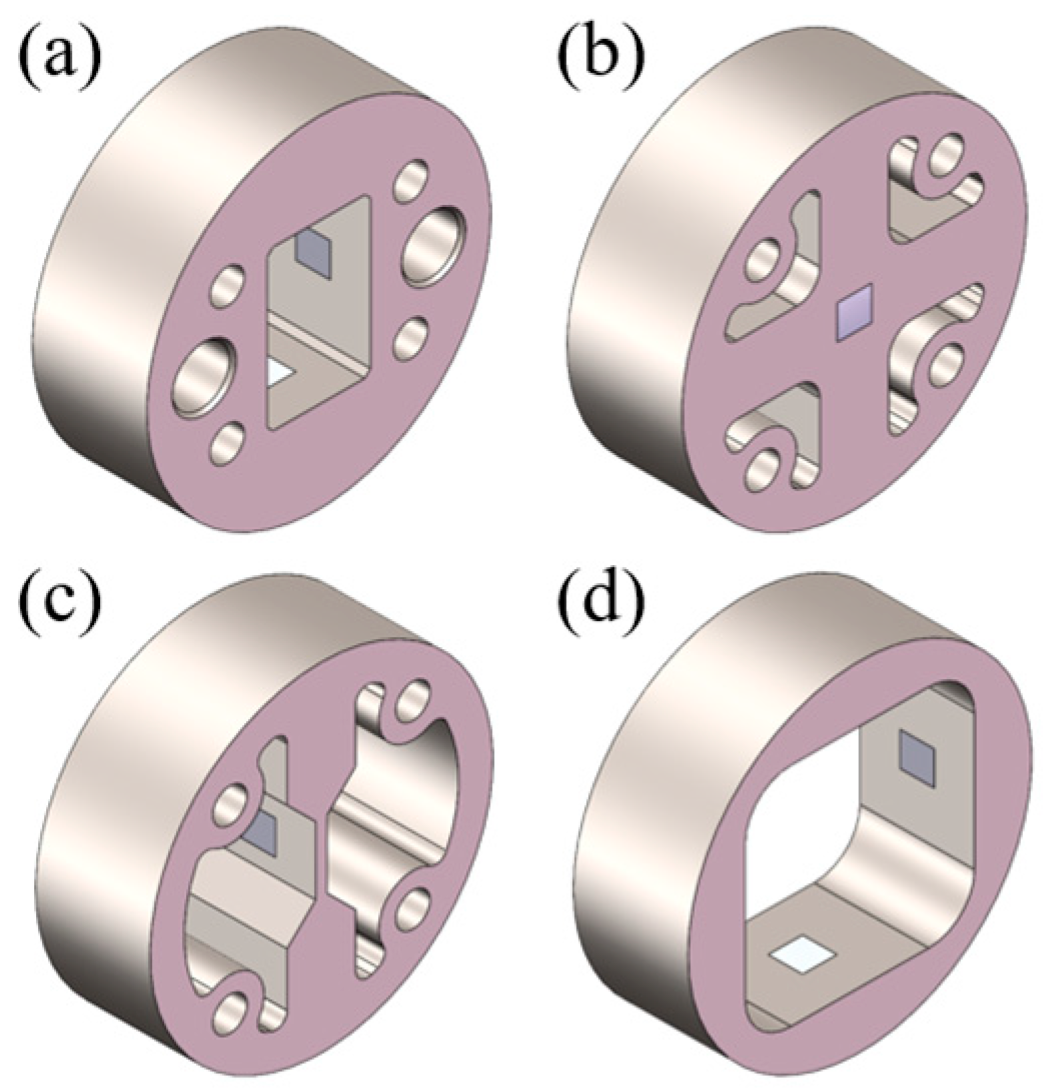
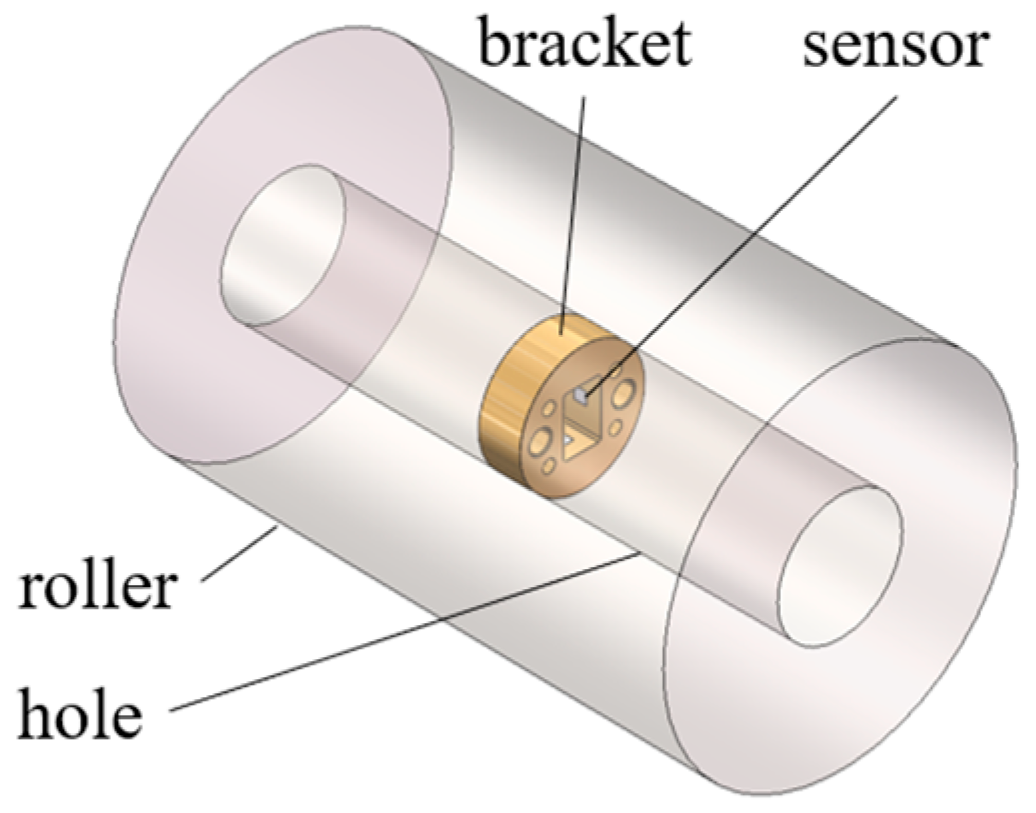
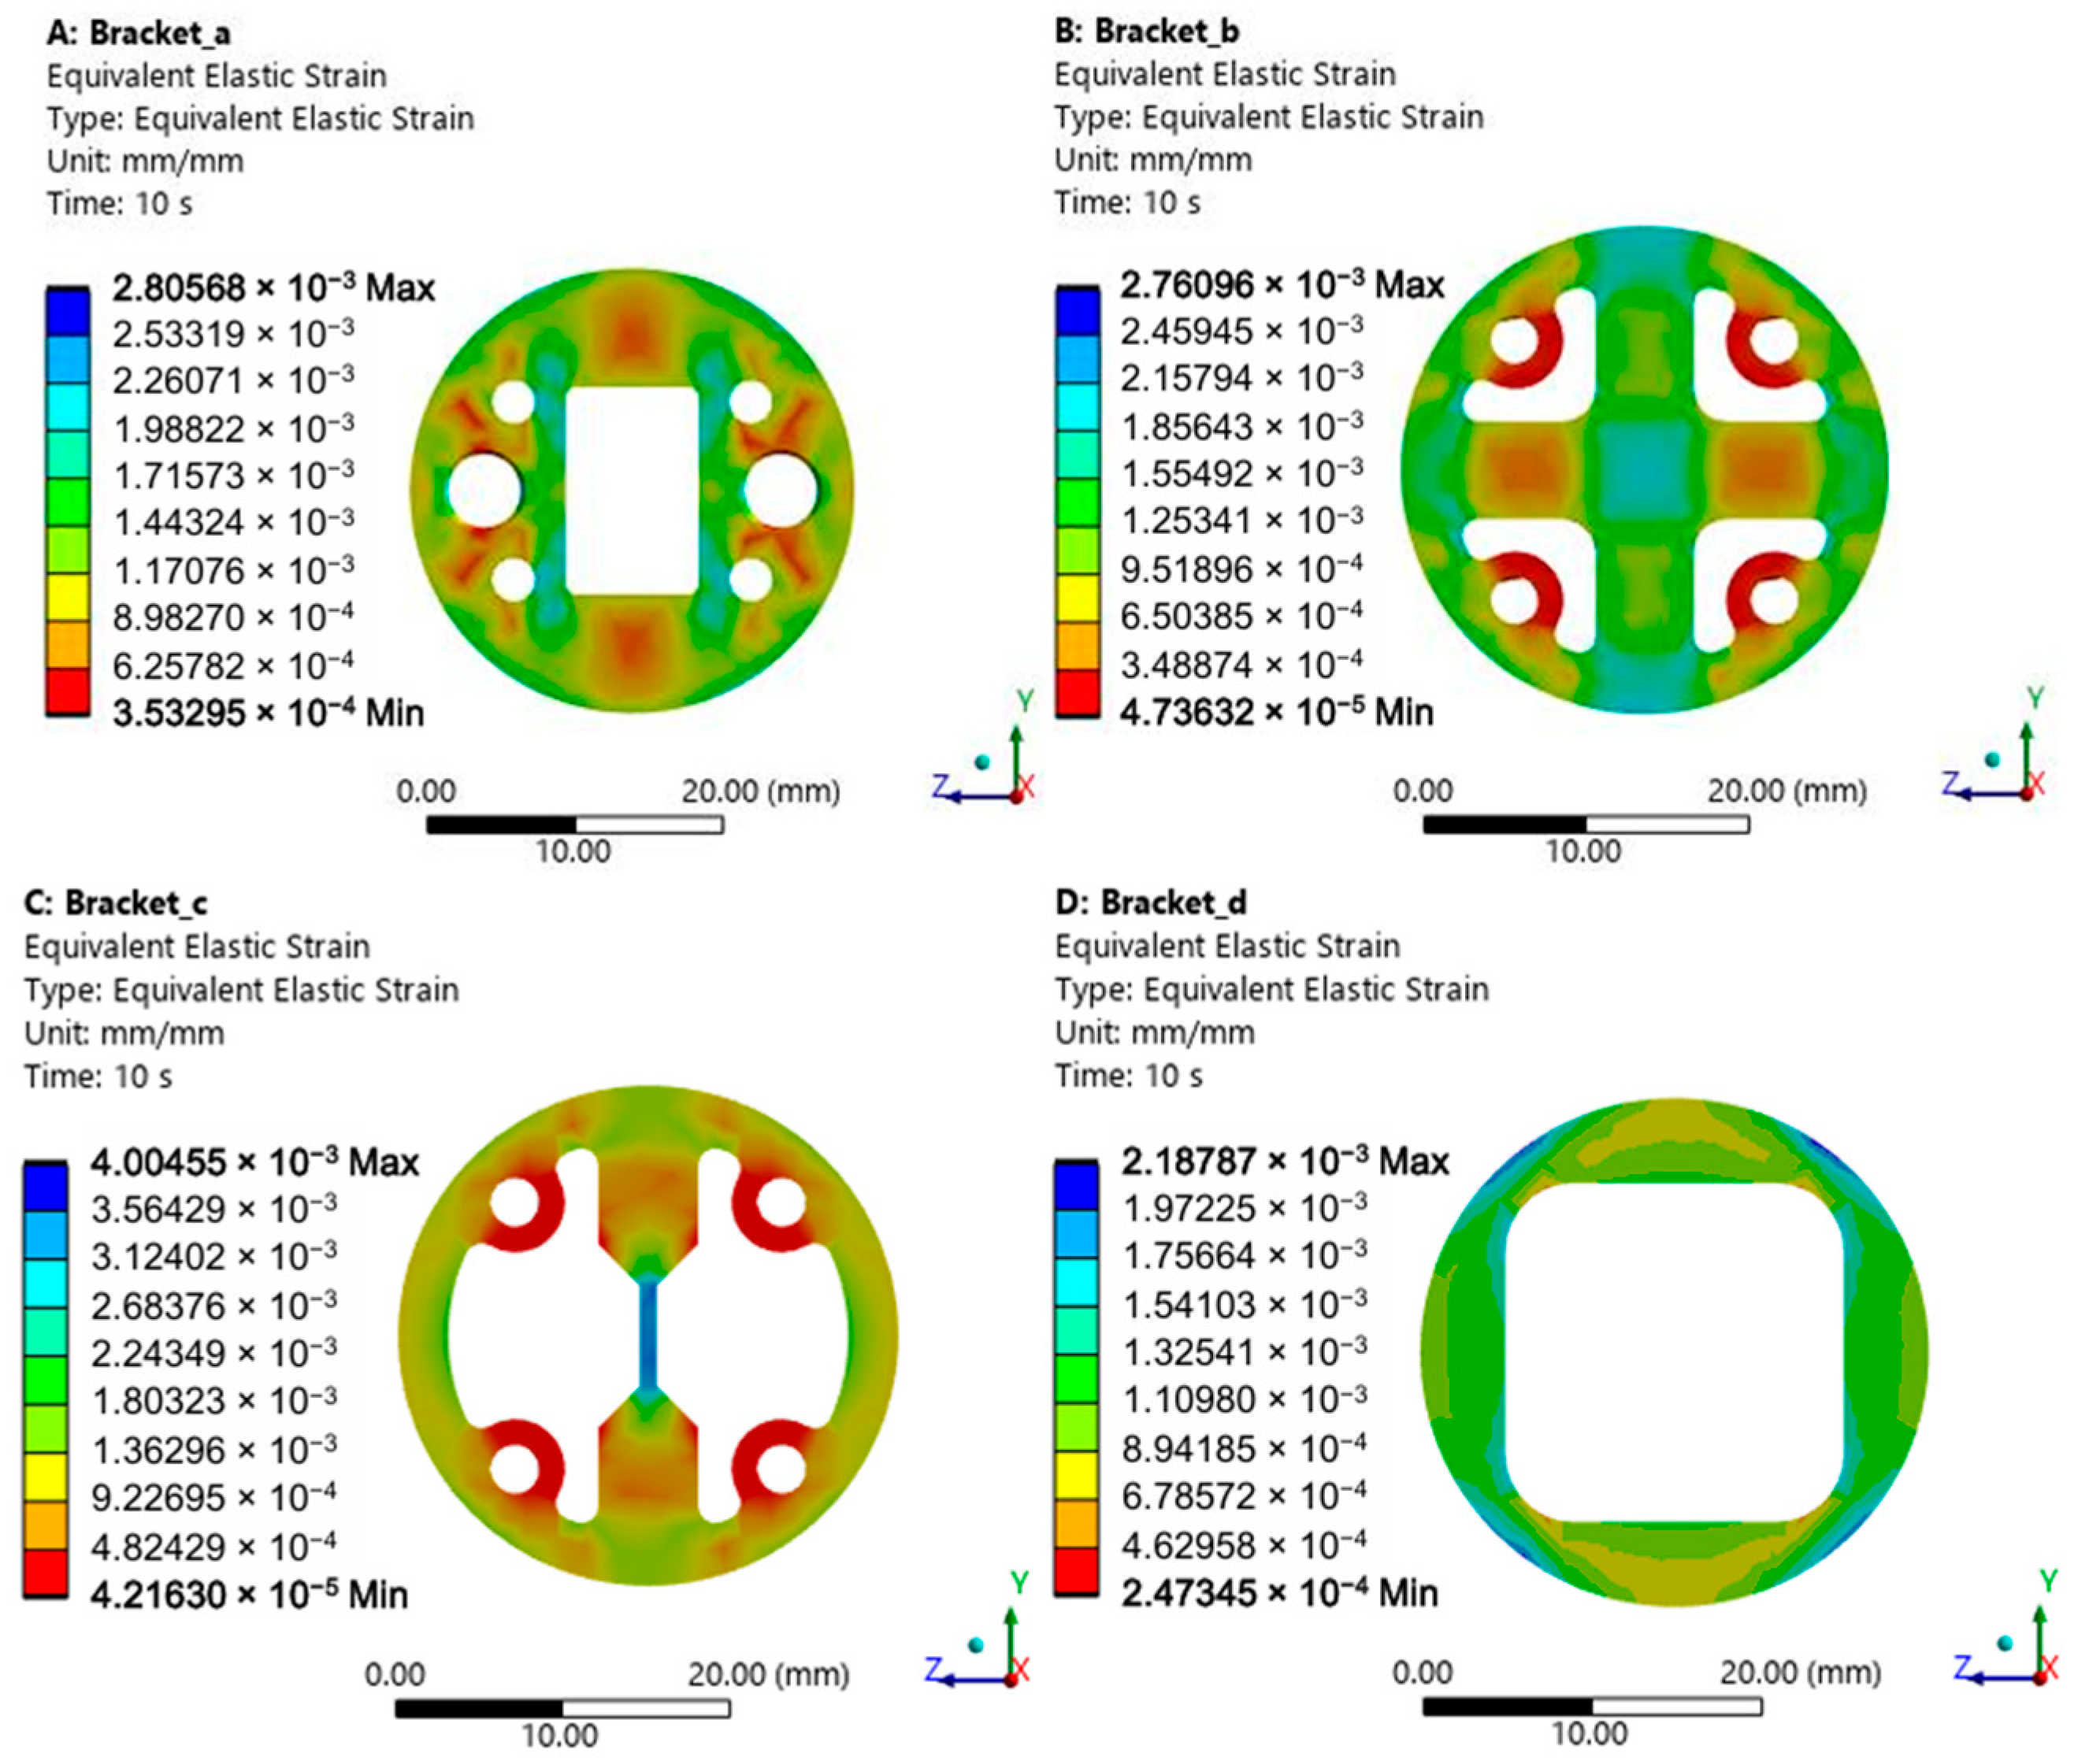
To address the aforementioned issues, this study constructs a contact load–strain analytical model, revealing the mapping relationship between contact load and bearing bore strain. Through simulation analysis, the optimal layout scheme for sensor brackets and the distribution regions of high-sensitivity measurement points are determined under given bore strain conditions. Sensor brackets are strain amplification structures installed within the roller bore, serving as a bridge between strain gauges and the roller. They transmit and amplify deformation of the roller bore. Mounting sensors on these brackets enhances the sensitivity of strain signal measurements. Sensor brackets are strain amplification structures installed within the roller bore, serving as a bridge between strain gauges and the roller. They transmit and amplify deformation of the roller bore. Mounting sensors on these brackets enhances the sensitivity of strain signal measurements. Based on this, a strain–phase–load calculation method incorporating roller rotation phase factors is further established, enabling the accurate extraction of contact load. This method was validated through experimental testing. Both theoretical and experimental results demonstrate that the proposed strain–phase–load calculation method can acquire the contact load on main bearing rollers in wind turbine generator systems in real time and with high precision. This, thereby, provides effective technical support for in-depth research on bearing mechanical characteristics, fatigue life prediction, and structural design optimization.
2. Contact Load–Bore Strain Mapping
Due to the extremely high contact stress experienced at the tapered roller–raceway contact interface, it is impractical to directly deploy sensors on the contact surface for load measurement. Consequently, in engineering practice, machining a bore within the roller can be adopted. Contact load is then indirectly acquired by measuring the strain on the inner wall of this bore. Therefore, an in-depth investigation into the quantitative mapping relationship between the strain on the roller bore wall and the contact load is essential. Furthermore, tapered roller bearings possess inherently complex geometric parameters, leading to a particularly complex stress distribution state under load [
35]. To address these challenges, this chapter focuses on the mechanical analysis of the deformation behavior of loaded rollers. A relationship model between the surface strain of a solid roller (without a bore) and the contact load is established. Building upon this model, analytical calculation formulas for the bore surface strain of a hollowed tapered roller and its relationship to the contact load are derived. This provides a solid theoretical foundation for acquiring contact load through bore strain measurement.
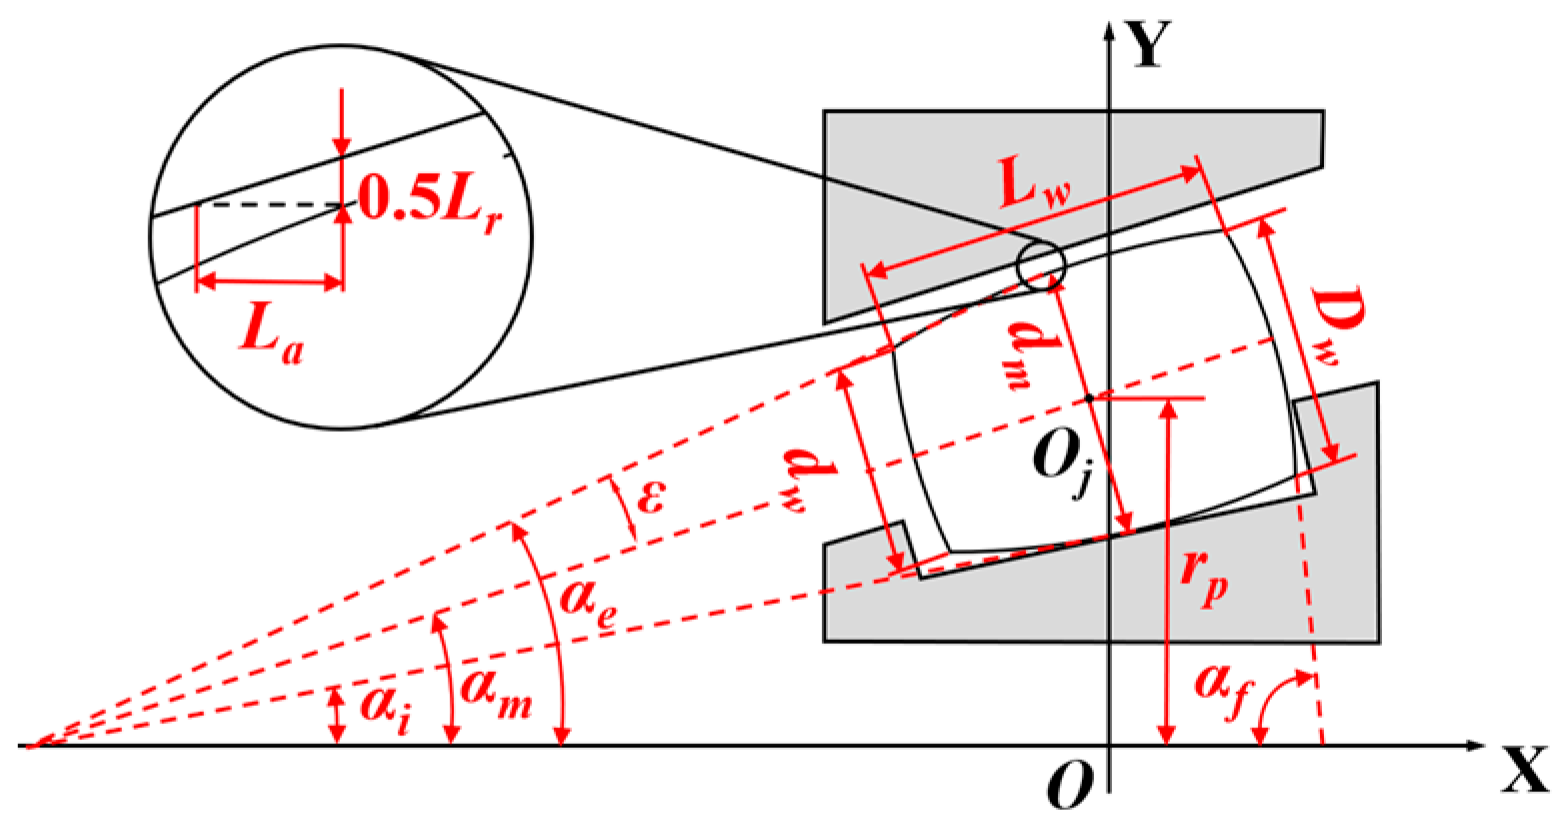
To clarify the geometric relationships involved in the subsequent analysis, the key geometric parameters of the tapered roller bearing are first defined, as illustrated in
Figure 1. Point O is designated as the bearing center point, and point O
j is designated as the center point of an individual roller. The specific meanings of the parameters are as follows:
dw: Roller small end diameter;
Dw: Roller large end diameter;
dm: Roller mean diameter (diameter at the axial midpoint);
rp: Bearing pitch circle radius;
Lw: Roller effective contact length;
La: Bearing axial clearance;
Lr: Bearing radial clearance;
αi: Contact angle between roller and inner ring raceway;
αe: Contact angle between roller and outer ring raceway;
αm: Roller mean contact angle;
ε: Roller semi-cone angle;
αf: Roller rib face angle.
Although the classical Hertz line contact theory provides the theoretical basis for calculating the contact load between rollers and raceways, it exhibits significant limitations when applied to tapered rollers and fails to yield an analytical solution formula for contact deformation [
17,
36]. Consequently, for non-spherical roller bearings (such as tapered roller bearings), analysis typically relies on the empirical formula proposed by Palmgren [
37]. This formula establishes a quantitative relationship between the contact load and contact deformation for a given roller. The specific expression is as follows:
The specific meanings of the parameters in the formula are as follows:
Q: Contact load;
δ: Contact deformation;
K: Load–deformation constant;
L: Contact length between the roller and raceway;
n: Load–deformation exponent (for a given tapered roller, n = 10/9).
To analyze the contact load on the roller, a global coordinate system is established with the bearing center point O as the origin, as shown in
Figure 2. The
X-axis is defined along the bearing axial direction. Within this coordinate system, the external force acting on the bearing can be resolved into three components along the coordinate axes:
Fx,
Fy,
Fz. Simultaneously, the external moment acting on the bearing can be resolved into components about the three coordinate axes:
Mx,
My,
Mz.
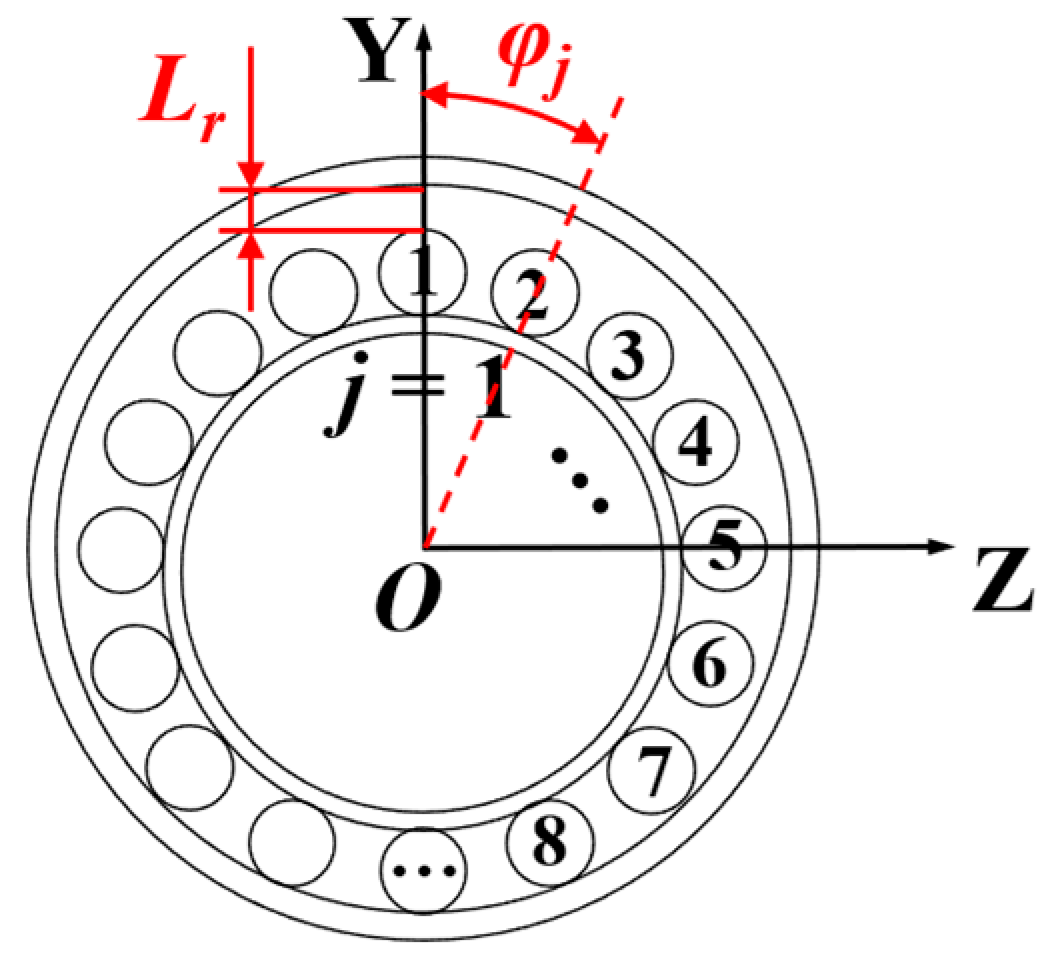
The symbol
j is used to denote the roller number. The positive direction of the global coordinate system’s
Y-axis is defined to point toward Roller No. 1. Subsequently, the roller number
j increases sequentially in a clockwise direction around the
X-axis, as illustrated in
Figure 3. The absolute position angle, denoted as
φj, is defined for the
j-th roller. This angle represents the circumferential angle of the roller’s center relative to the origin of the bearing’s global XYZ coordinate system. A specific mathematical relationship exists between the roller’s absolute position angle
φj, its number
j, and the total number of rollers
z. This relationship can be expressed as:
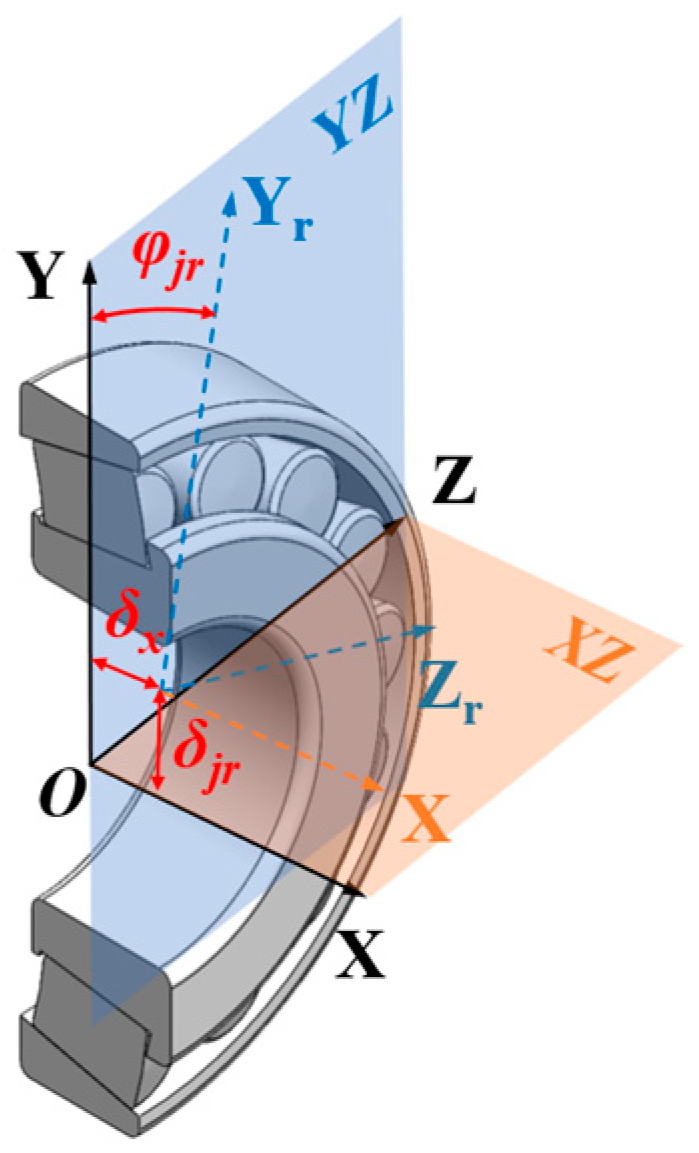
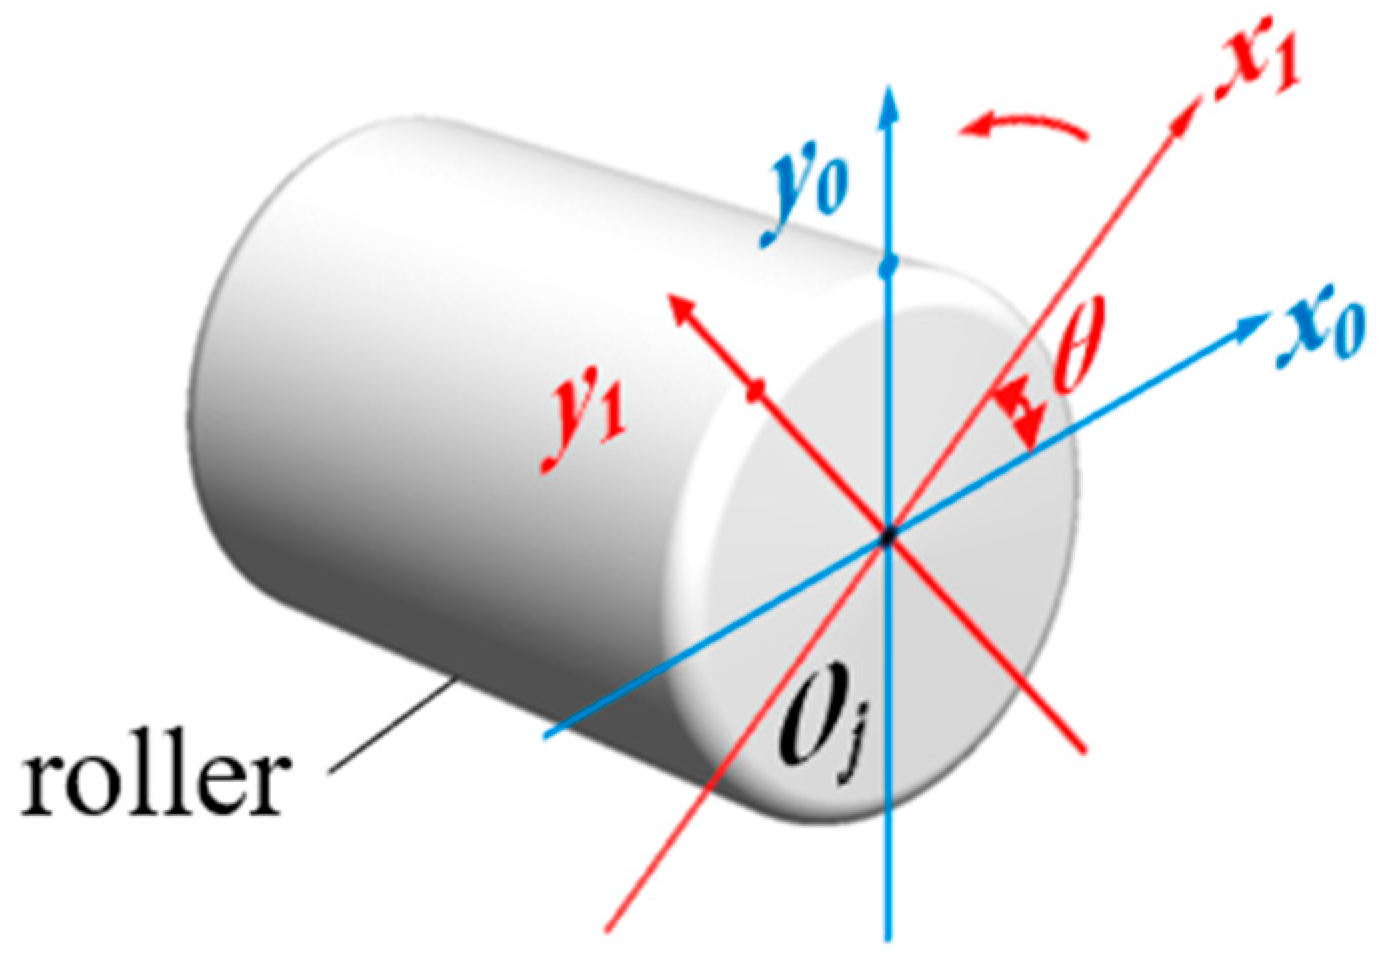
When the direction of the resultant force of the external load does not align with the
Y-axis of the global coordinate system, it is necessary to decompose the force. To simplify subsequent mechanical analysis, it is assumed that the roller is rigidly connected to the inner ring of the bearing. Under this assumption, the original global coordinate system XYZ is rotated by a certain angle around its
X-axis to establish a new coordinate system XY
rZ
r. The spatial relationship after rotation is illustrated in
Figure 4. Under external loading, both the roller and inner ring will undergo displacement, with a radial offset of
δjr and an axial offset of
δx. Simultaneously, the rotation angle
φjr is defined as the relative position angle of the
j-th roller, which is specifically characterized as follows:
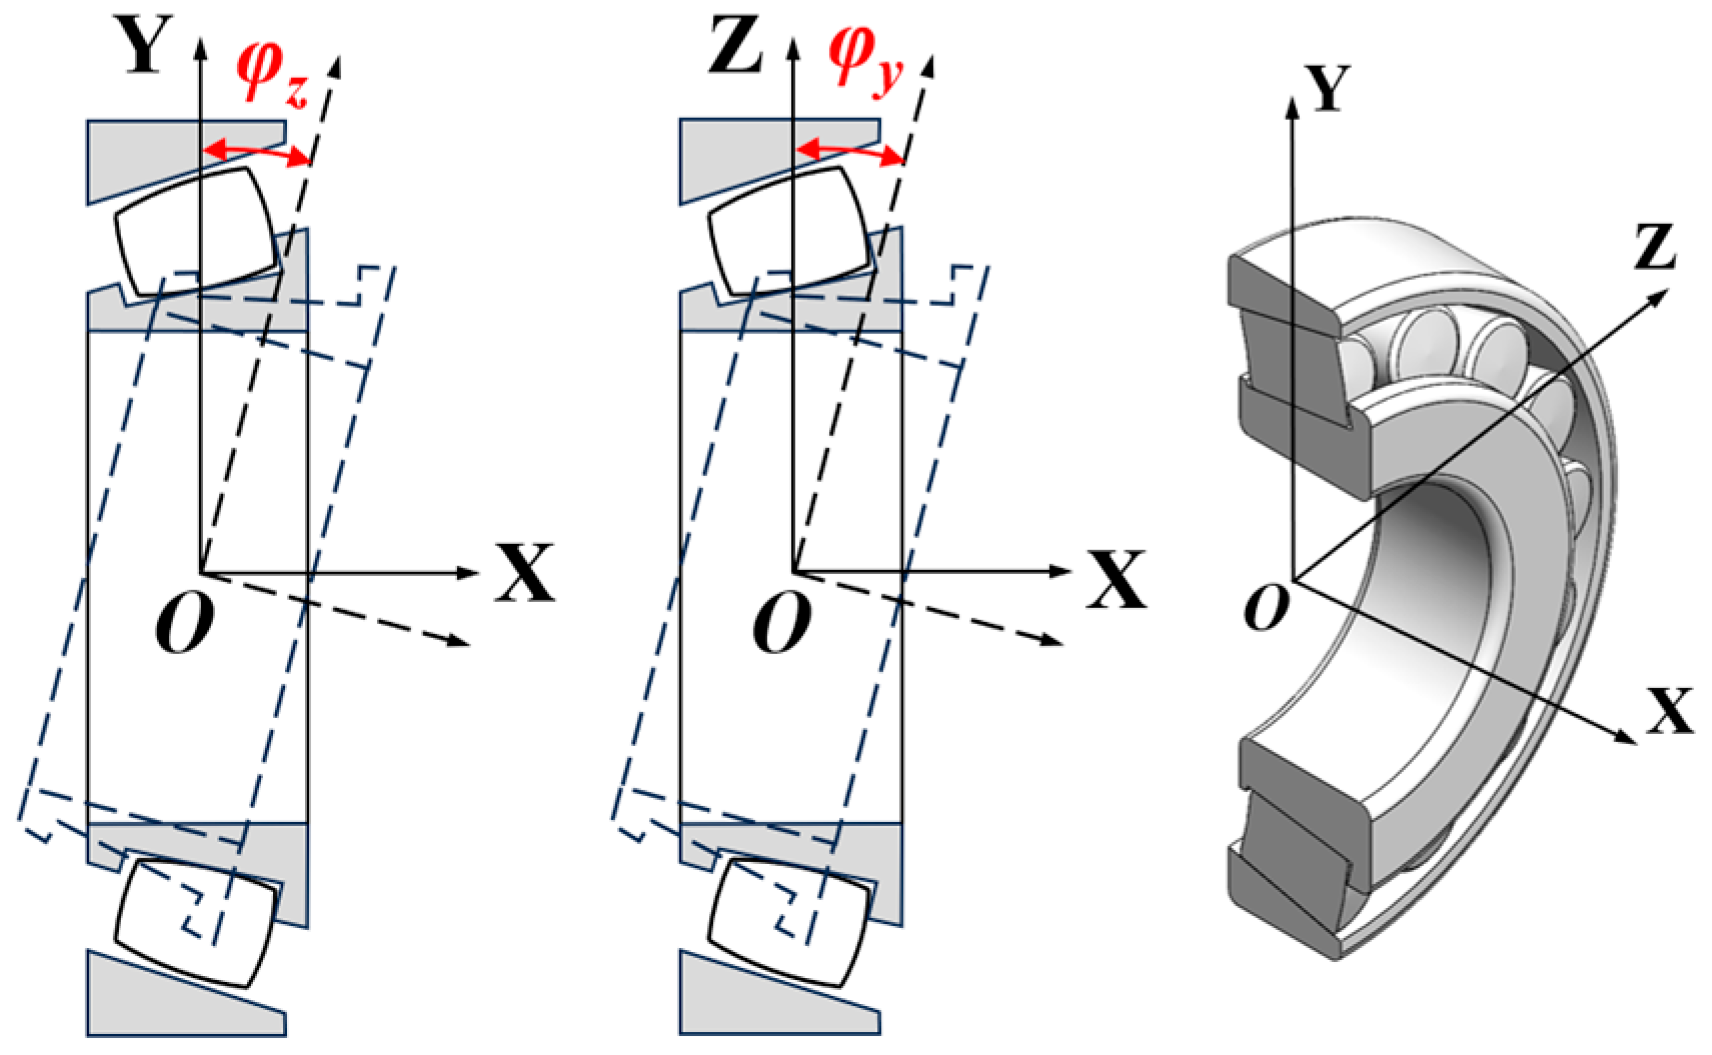
When the bearing is subjected to both axial and radial loads simultaneously, it is assumed that the outer ring remains stationary. Under these conditions, the inner ring of the bearing will deflect relative to the outer ring about the
Y-axis and
Z-axis of the global coordinate system. These deflection angles are denoted as
φy and
φz, respectively, as illustrated in
Figure 5.
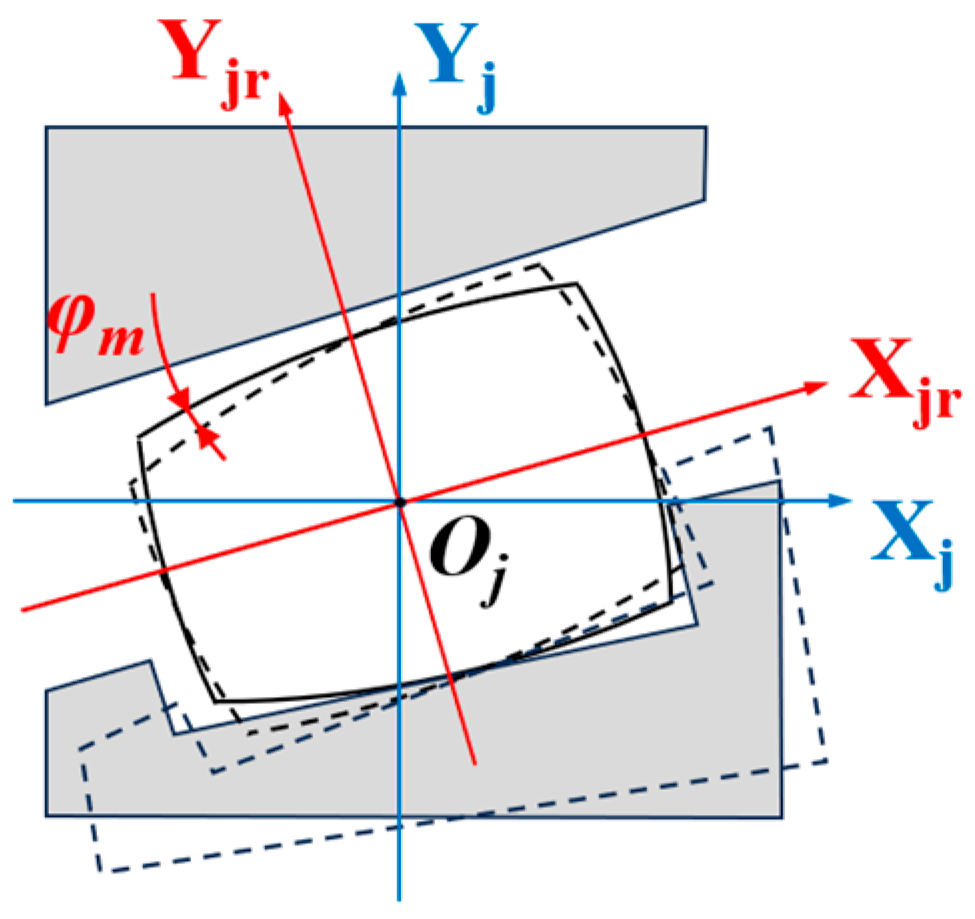
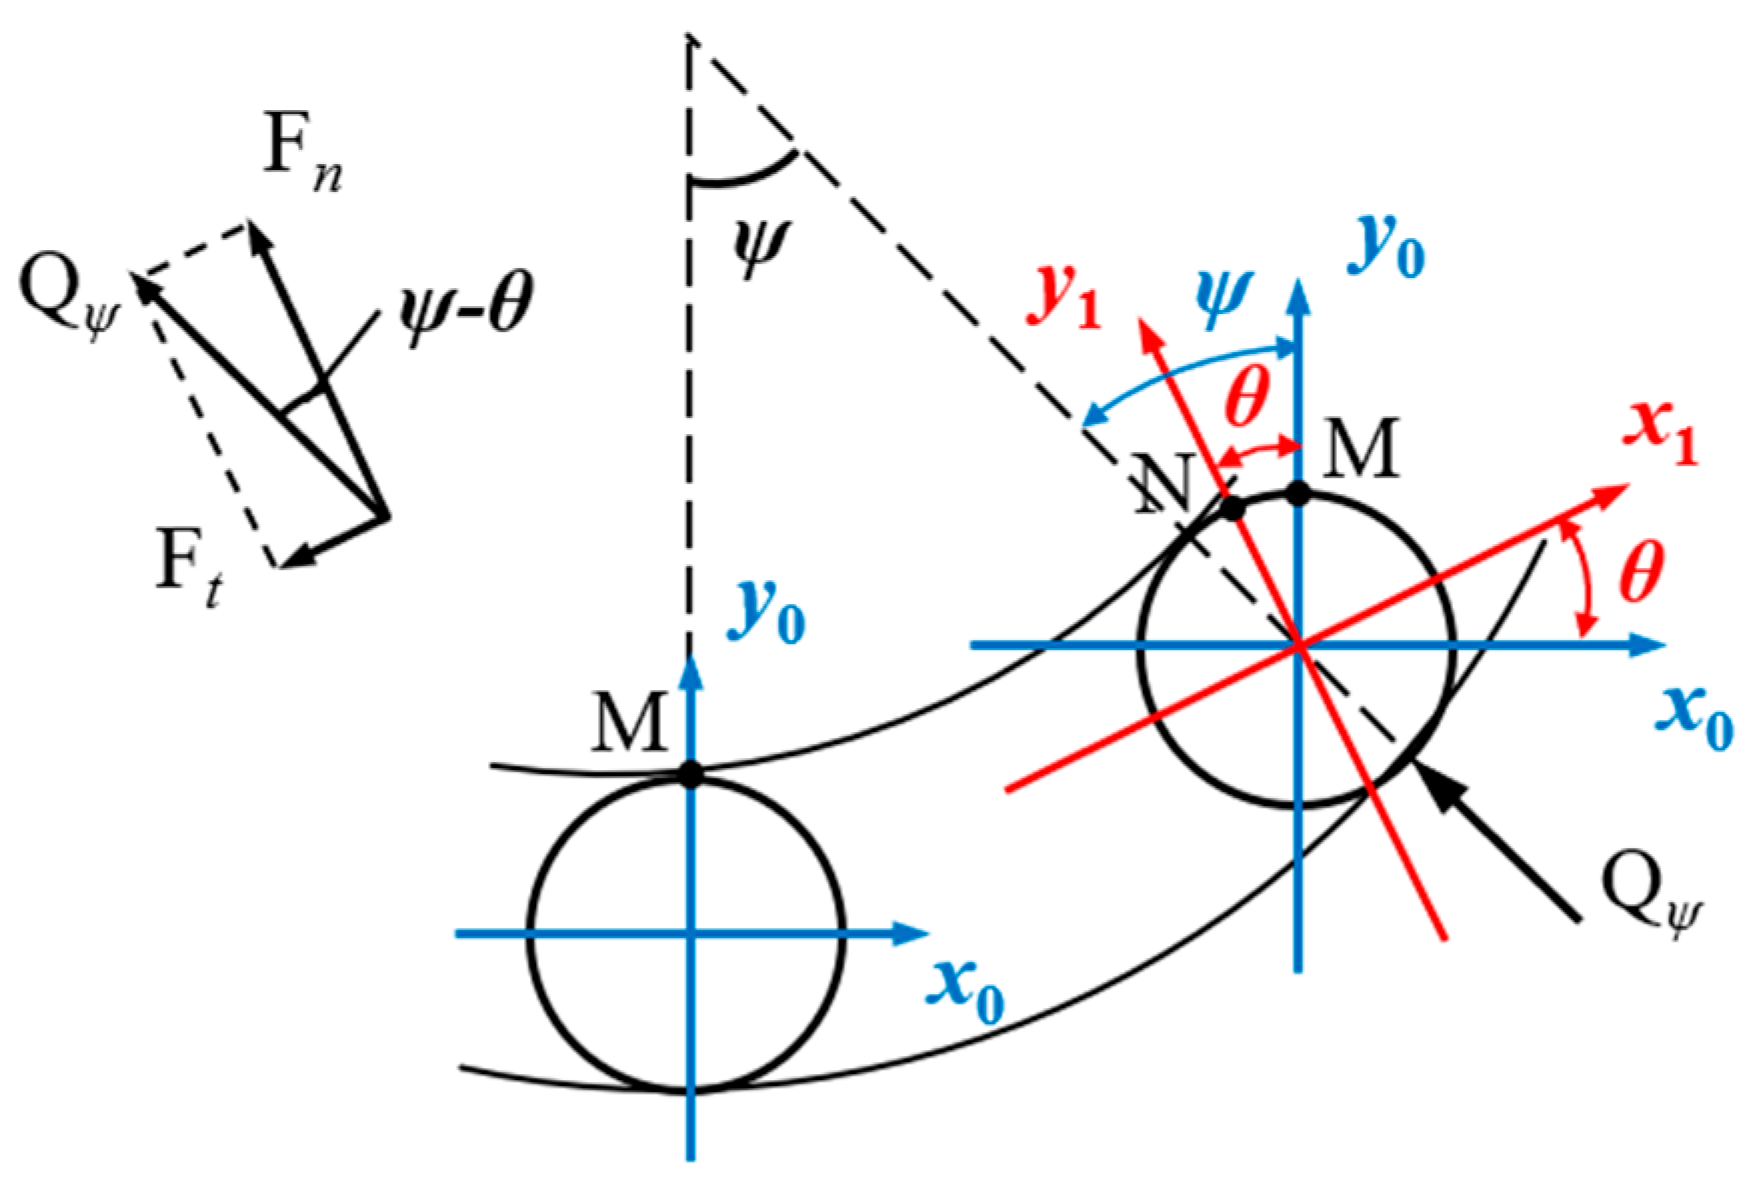
With the centroid
Oj of the
j-th roller as the origin, a local roller coordinate system
XjYjθ is established. Subsequently, this coordinate system is rotated by an angle
αm about its origin to obtain a new roller coordinate system
XjrYjrψ, as shown in
Figure 6. Given that the axial offset of the roller centroid
Oj relative to the bearing center
O is
xp, the coordinates of the roller coordinate system origin in the global coordinate system are (
xp,
rp). To analyze the force-induced deformation of the roller, the displacement offset vector
δ generated by the load in the global coordinate system XYZ must be transformed into the roller’s own coordinate system
XjYjθ, thereby deriving the relationship between them:
To simplify calculations, the aforementioned relationship is decomposed into matrix form:
where vector
D represents the offset vector in the roller coordinate system
XjYjθ,
T is the transformation matrix, and
L denotes the bearing clearance matrix. These can be expressed as:
Based on the relationship between coordinate systems
XjYjθ and
XjrYjrψ shown in
Figure 6, we further derive:
where vector
U represents the offset vector in the rotated roller coordinate system
XjrYjrψ, and
R is the rotation matrix. These can be expressed as:
When contacting the outer raceway, the normal contact deformation offset
δjn of the tapered roller is illustrated in
Figure 7. This offset is derived from the displacements along the
Xjr-axis and
Yjr-axis combined with the semi-cone angle
ε:
The tapered roller is discretized along its axis into
n slices of uniform thickness Δ
l, where each slice is approximated as a constant-diameter cylinder, as shown in
Figure 8. The position
lk of the
k-th slice is calculated as follows:
When an ideal cylindrical roller contacts the raceway, its contact stress exhibits a uniform rectangular distribution along the contact line. However, due to the convergent geometry of tapered rollers, stress concentration occurs at both ends of the contact zone. This results in significantly higher stress values in these localized regions than predicted by classical Hertz line contact theory [
38]. To improve the stress distribution and promote a more uniform profile, logarithmic profile modification is applied to the tapered roller contour. The modification depth along the roller axis is given by:
where
dm denotes the mean diameter of the profiled tapered roller, and
Lw represents the effective contact length of the roller.
Consequently, when calculating the contact deformation of each discrete slice, the influence of roller profiling must be considered. Furthermore, due to the misalignment angle
φm inducing additional compressive (or separative) deformation at the slice locations, as illustrated in
Figure 9, a corrective adjustment for this effect is required. Synthesizing the profiling influence and misalignment correction, the equivalent normal contact deformation for each slice is derived as follows:
where
hm denotes the correction term for the slice’s additional deformation induced by angular misalignment, and
lk represents the position coordinate of the
k-th slice along the
Xjr-axis, with the roller center (
lk = 0) as the origin and the positive direction defined toward the roller’s large end.
Deformation response under misalignment:
Small-end compression (φm > 0)
Small-end slices: Increased deformation hm > 0
Large-end slices: Reduced deformation hm < 0 (potential separation)
Large-end compression (φm < 0)
Small-end slices: Reduced deformation hm < 0
Large-end slices: Increased deformation hm > 0
Based on Equations (1) and (2), the contact load
qjnk on each slice can be calculated using the contact deformation
δjnk of that slice. The roller’s total contact load
Qjn is obtained by summing the contact loads of all slices. Crucially, when the contact deformation
δjnk computed via Equation (17) yields a negative value, it indicates loss of contact between the slice and the outer raceway. Consequently, for slices where
δjnk < 0, the corresponding contact load
qjnk must be set to zero in the summation for
Qjn. The final expression for the roller contact load accounting for separation states is given by:
Considering the case of a hollow tapered roller, the contact deformation on the inner wall
δhjnk is related to the outer surface contact deformation
δjnk by:
where
Kh denotes the conversion coefficient. The relationship between strain and deformation on the inner wall is given by:
Synthesizing Equations (20)–(22), the contact load on the slice is derived as:


