


Leakage Detection in Subway Tunnels Using 3D Point Cloud Data: Integrating Intensity and Geometric Features with XGBoost Classifier

Abstract
1. Introduction
- (1)
- An automated framework was developed to accurately detect tunnel leakage in 3D point cloud data, which addresses challenges related to noise and the limited spatial representation of leakage patterns.
- (2)
- Geometric features were introduced as complementary characteristics, which resulted in improved accuracy for leakage detection.
- (3)
- The XGBoost classifier was introduced for leakage detection, and a comparative analysis demonstrated its superior accuracy and computational efficiency, thereby validating its applicability in this context.
2. Related Works
- (1)
- Intensity threshold-based segmentation methods. These methods convert point clouds into grayscale images by utilizing the intensity values of laser scanning points [7,9,10]. Leakage is detected by establishing intensity thresholds derived from the difference between leakage and non-leakage regions in grayscale domain [11,12]. For example, Huang, et al. [7] employed Otsu’s method to compute grayscale histogram and determine an optimal intensity threshold that maximizes inter-class variance between leakage and non-leakage areas, achieving optimal segmentation results. However, point cloud intensity is susceptible to biases induced by factors such as scanning distance, incidence angle, and surface roughness. Hawley and Gräbe [13] investigated these influences, emphasizing the necessity of intensity correction models to mitigate such deviations [14]. Xu, et al. [15] proposed a two-step approach: first, correcting intensity values based on scanning distance and incidence angle; second, employing an intensity threshold to extract leakage and a distance threshold to eliminate noise points. Despite their effectiveness, these methods exhibit notable limitations. The segmentation process is highly sensitive to the intensity threshold, which is typically determined empirically or heuristically. This approach may not generalize well to diverse datasets, limiting its practical applicability. Furthermore, most implementations are confined to 2D leakage segmentation, lacking the capability to provide detailed 3D information regarding the depth and spatial extent of leakages.
- (2)
- Image-based supervised classification methods. These methods also involve transforming point clouds into grayscale images. Annotated samples are used to train deep learning models, which are then tested on grayscale images to detect leakage locations and areas. Recent advancements in convolutional neural networks (CNNs) have garnered attention for their capability to efficiently extract features. Deep learning frameworks derived from CNNs, such as ResNet [16], Faster R-CNN [17], R-FCN [18], Mask R-CNN [19], DeepLabV3+ [20], and YOLO [21], have been extensively applied to various object detection tasks. These tasks include crack detection [22], defect detection [23], leakage detection [24], etc. For example, Liu, et al. [25] combined Res2Net with cascade modules and fully connected networks (FCNs) to detect leakage, leveraging multi-scale feature extraction and enhanced representation. Among these, Mask R-CNN, one of the most widely used algorithms for leakage instance segmentation, extends Faster R-CNN by integrating Region of Interest (RoI) Align [26] and FCN [27] modules. To enhance the segmentation accuracy, Guo et al. [1] employed RDES-Net to effectively segment leakage on grayscale images. Chen et al. [28] proposed an enhanced YOLO-V7 model that integrates attention mechanisms, edge refinement techniques, and mixed data augmentation strategies to achieve precise leakage segmentation. Wang et al. [29] designed a lightweight leakage segmentation method using the DeepLabV3+ model with integrated channel attention, demonstrating enhanced accuracy and generalization performance in complex environments. To visualize leakage in 3D space, Chen et al. [19] introduced a method to unfold point clouds into grayscale images using cylindrical voxels, enabling Mask R-CNN-based detection and subsequent mapping back to 3D space. Additionally, Xue et al. [30] applied SfM-Deep Learning to map leakage textures onto 3D models, further enhancing spatial analysis capabilities.
3. Materials and Methods
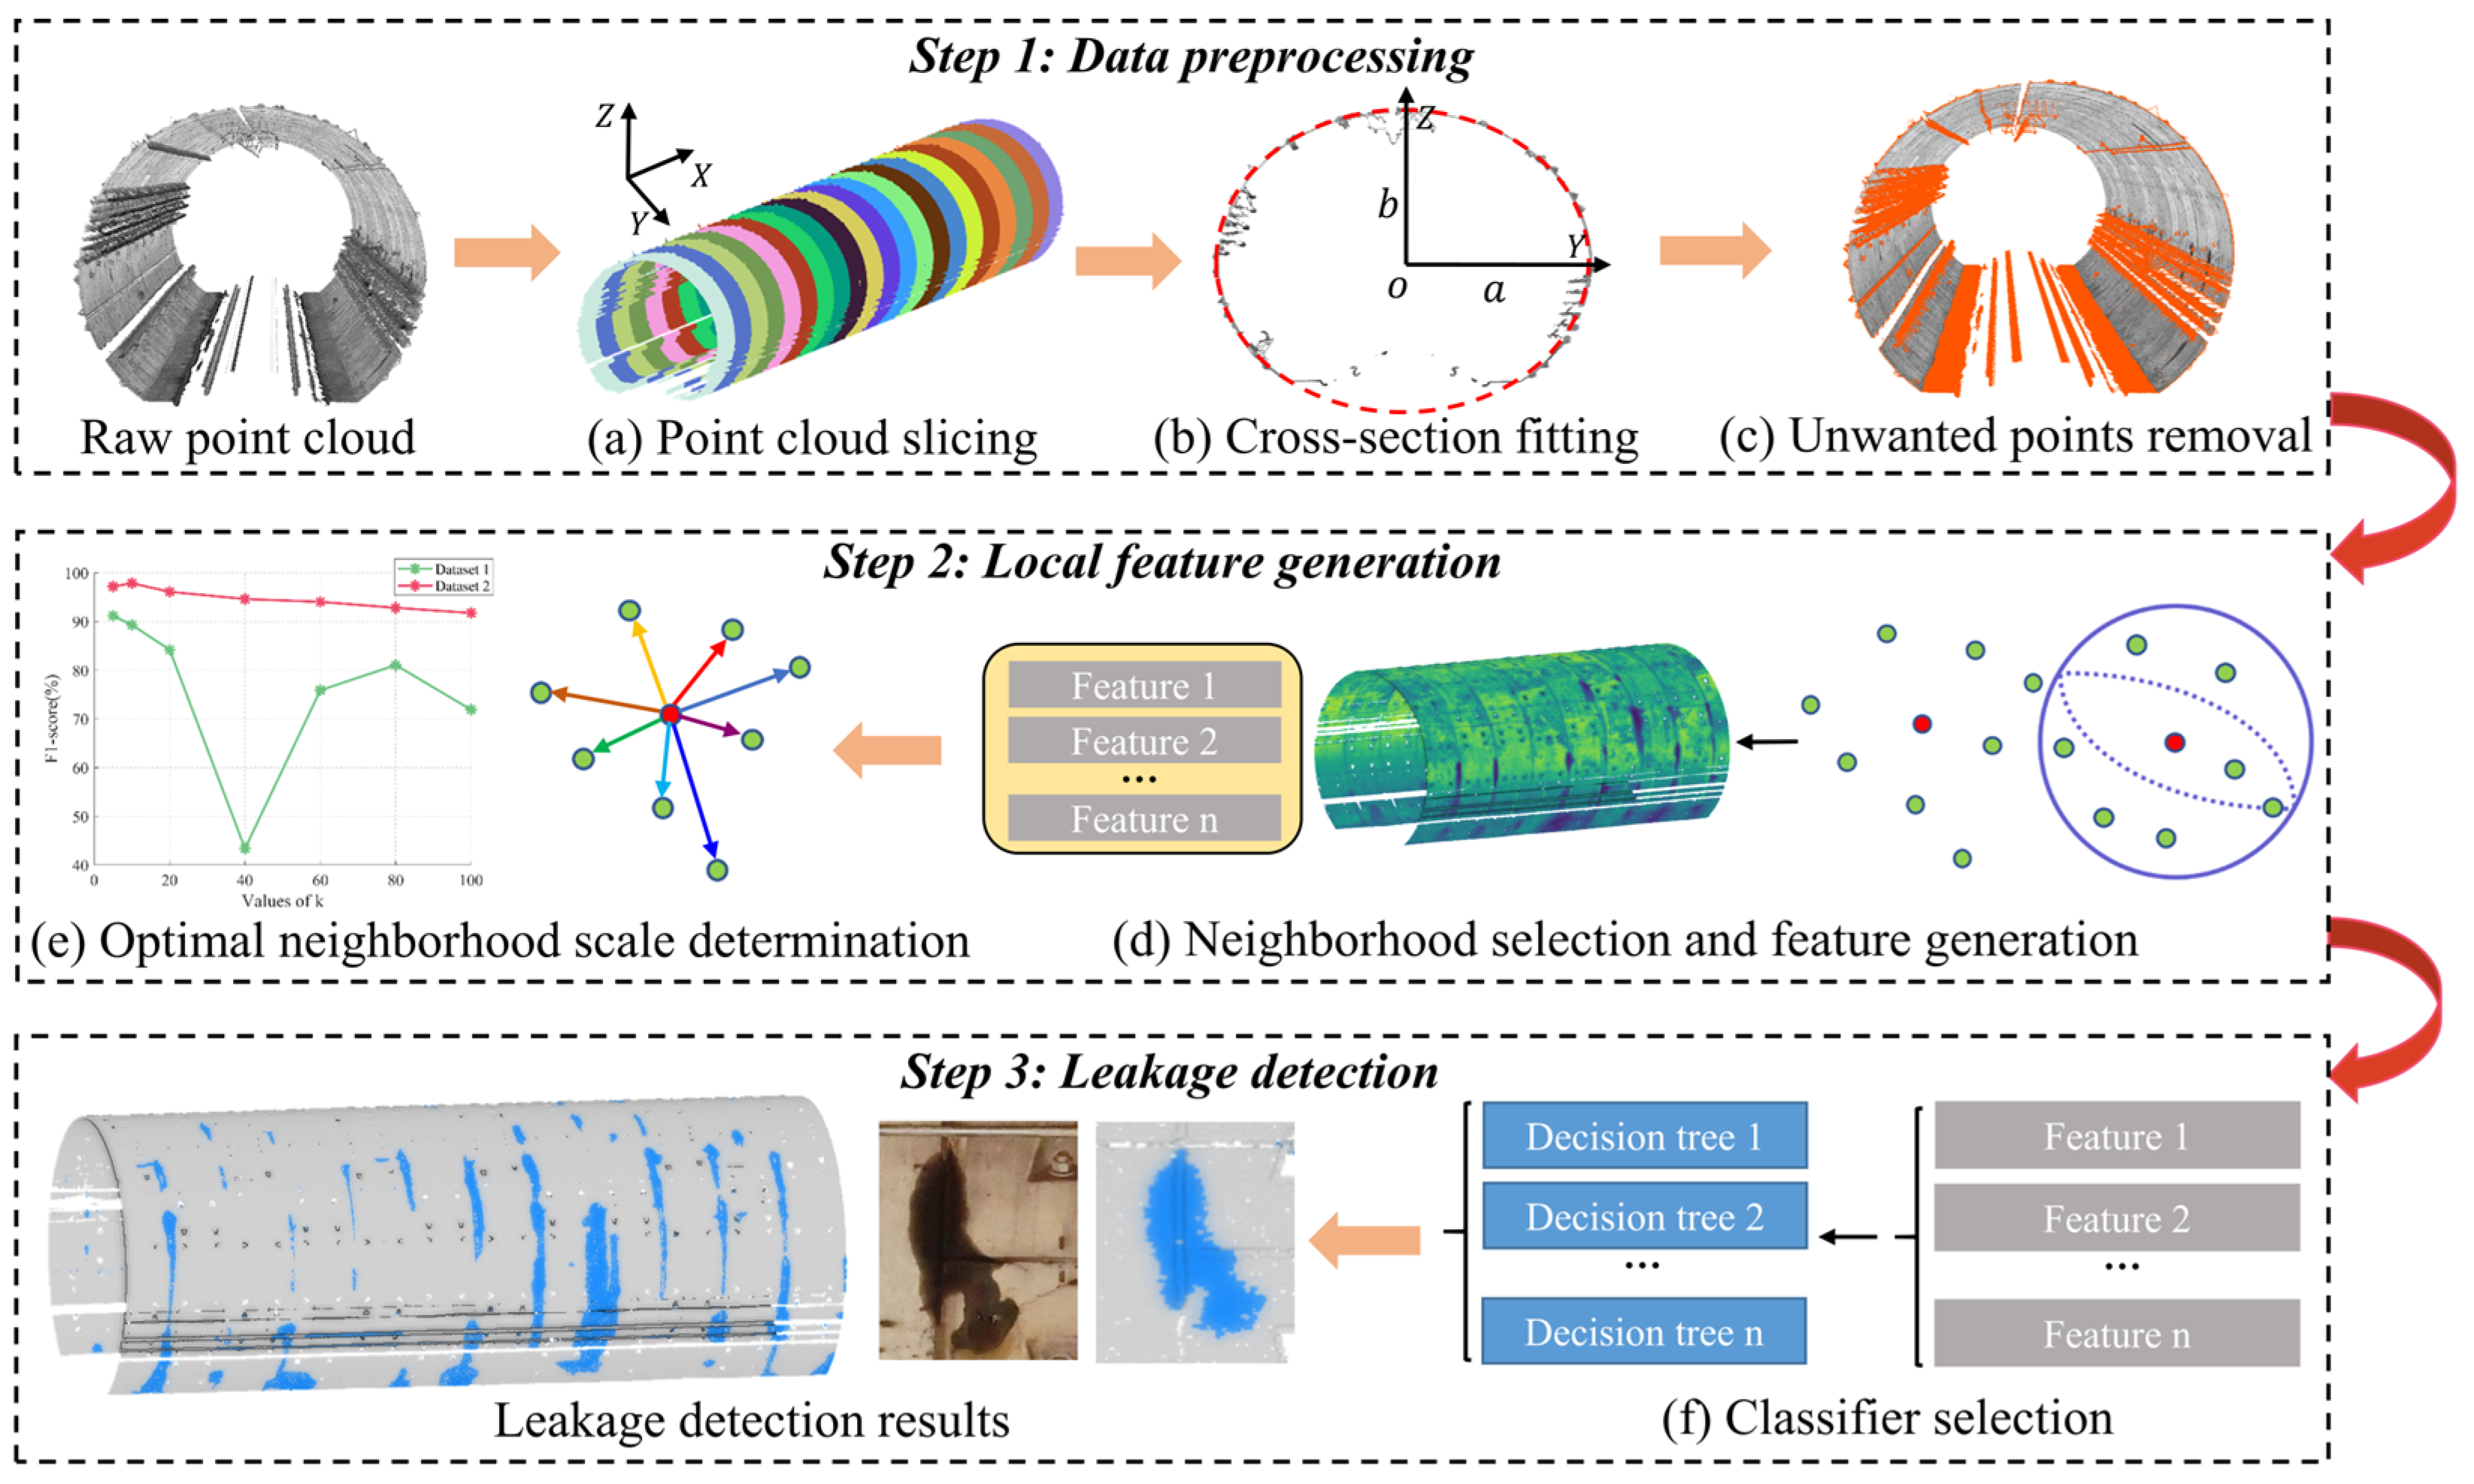
3.1. Data Preprocessing
3.1.1. Tunnel Slicing Along the Tunnel Axis
3.1.2. Cross-Section Fitting
3.1.3. Unwanted Points Removal
3.2. Neighborhood Selection and Feature Generation
3.3. Optimal Neighborhood Scale Determination
3.4. Classifier Selection
3.5. Performance Evaluation Metrics
4. Experimental Results and Discussions
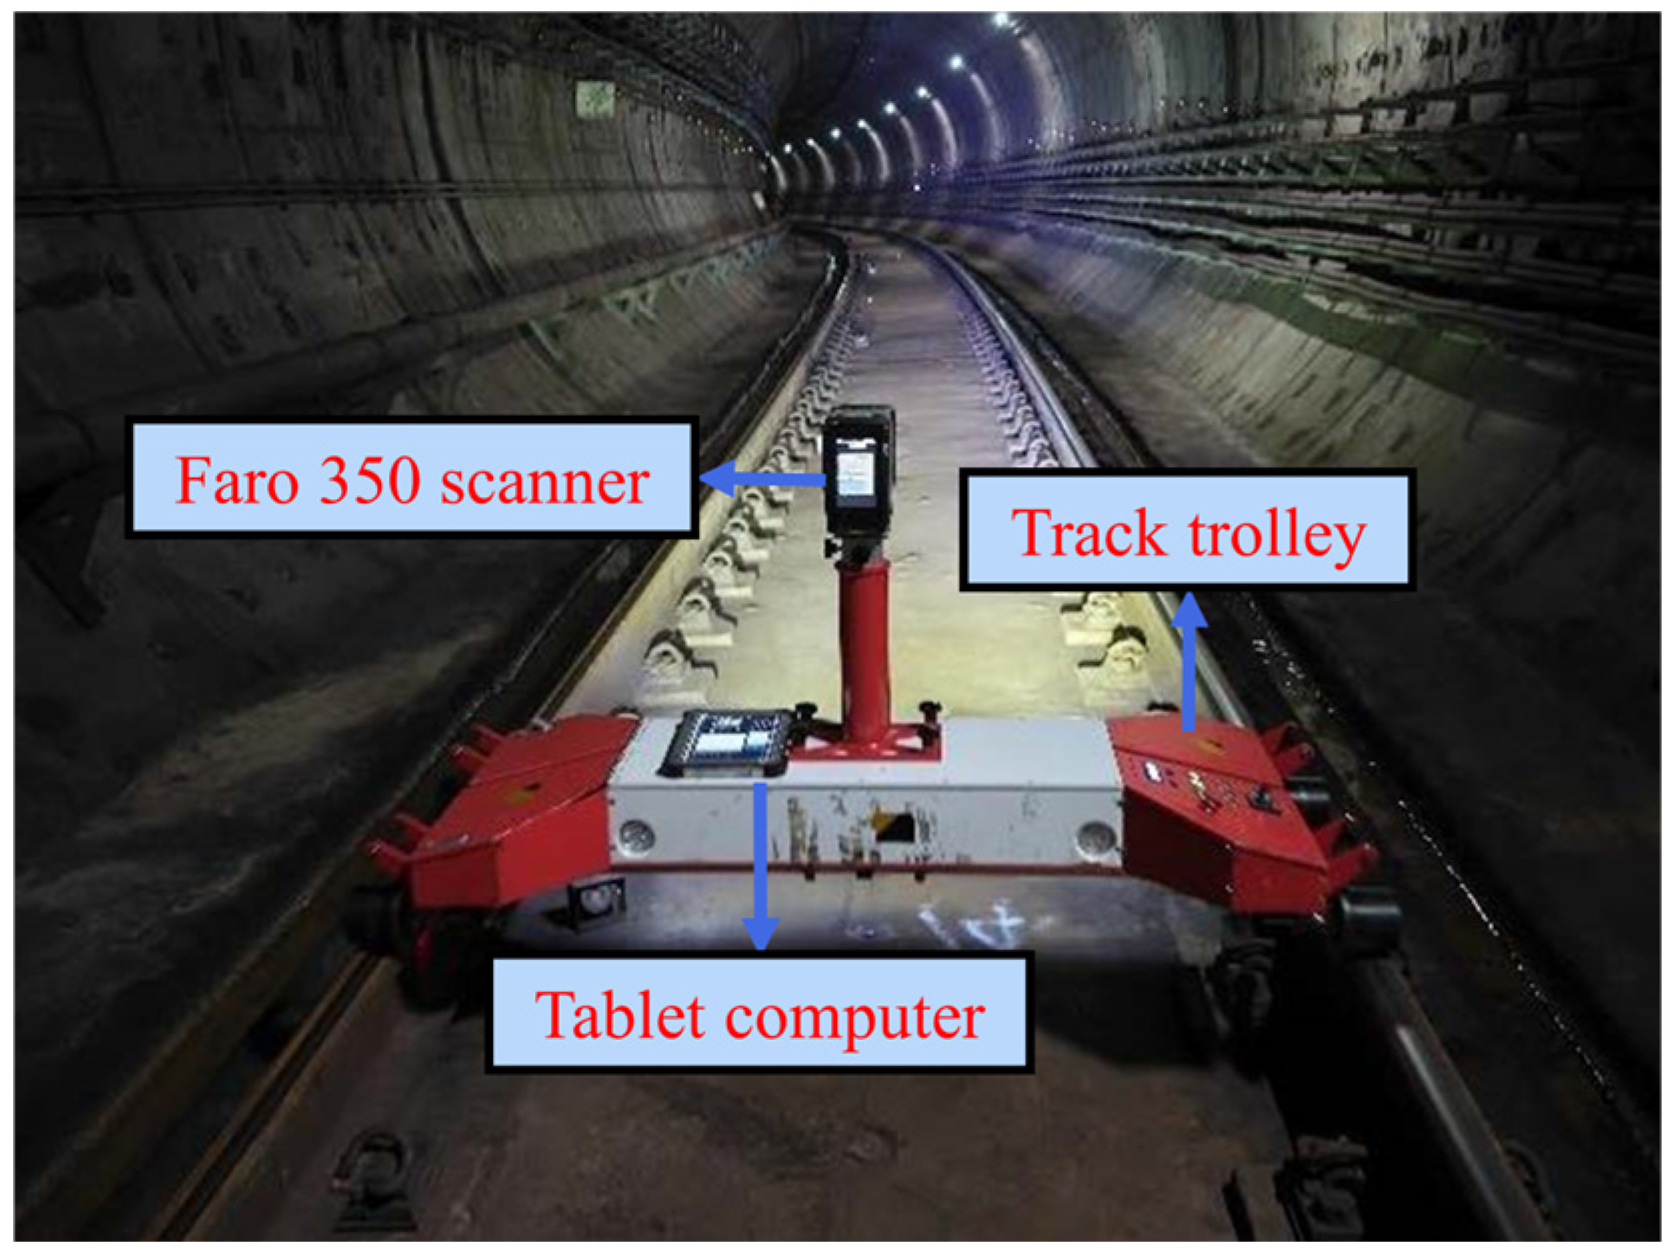
4.1. Experimental Data Collection
4.2. Experimental Setting and Parameter Configuration
4.3. Data Preprocessing Results
4.4. Optimal Neighborhood Scale Results and Analysis
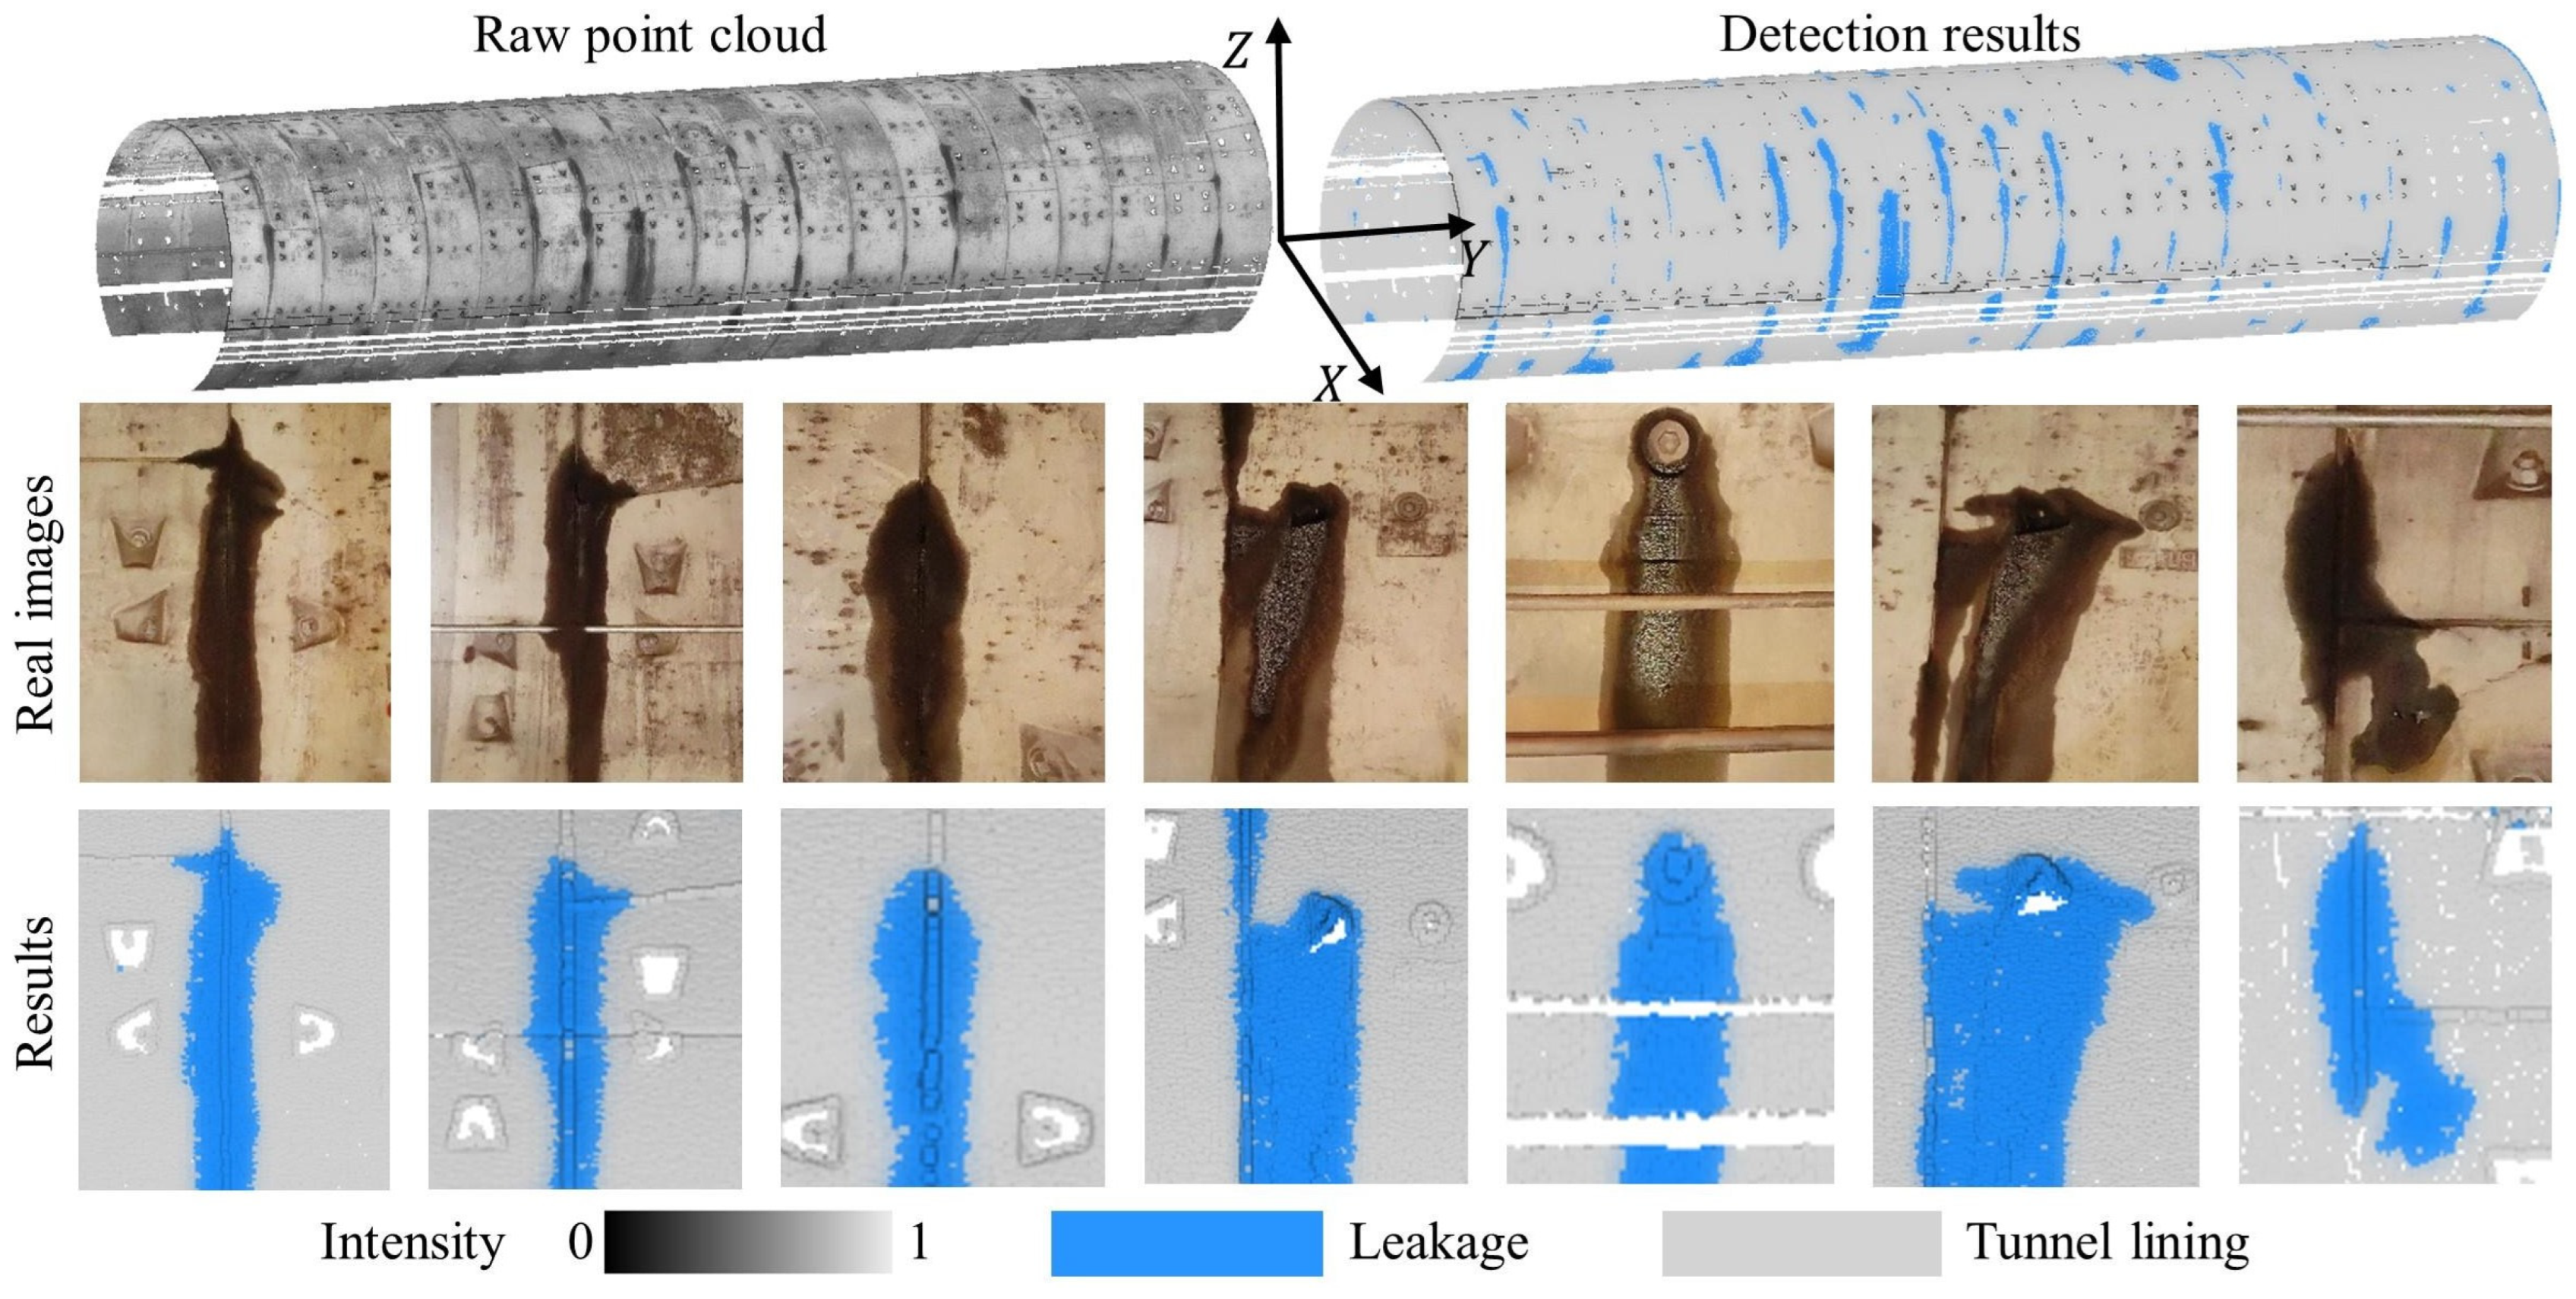
4.5. Leakage Detection Results
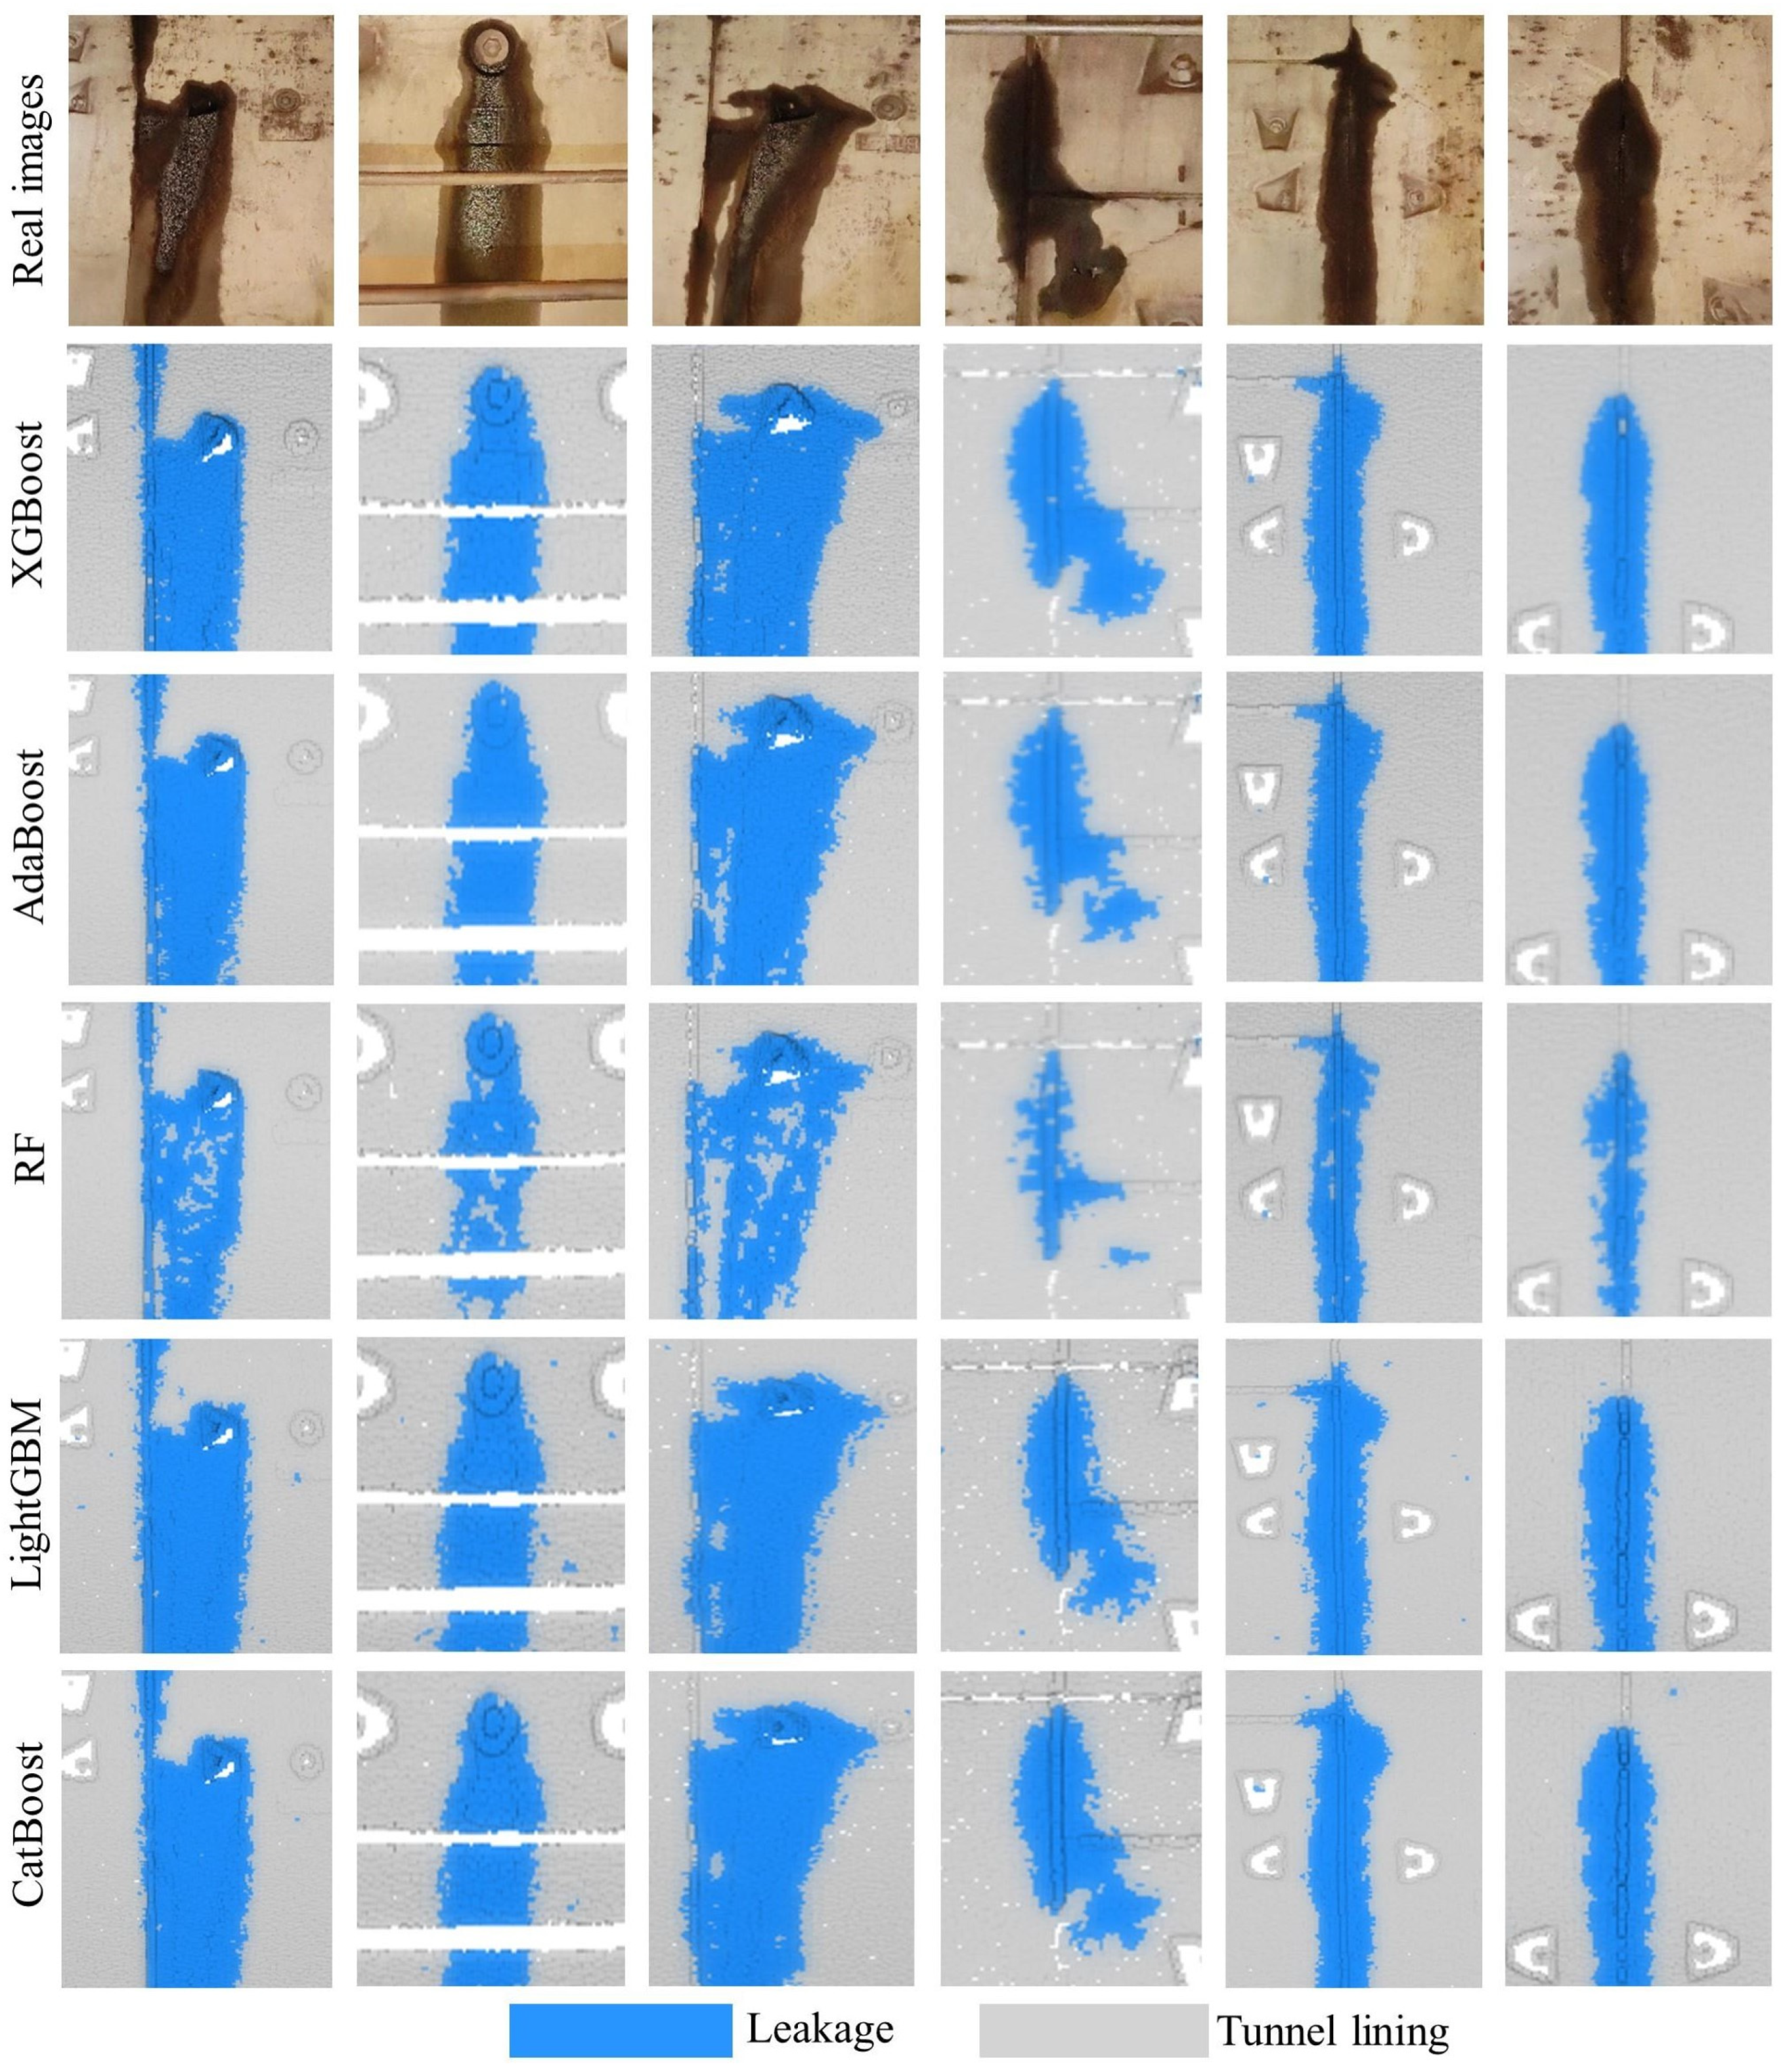
4.6. Comparison with Other Frequently Used Classifiers
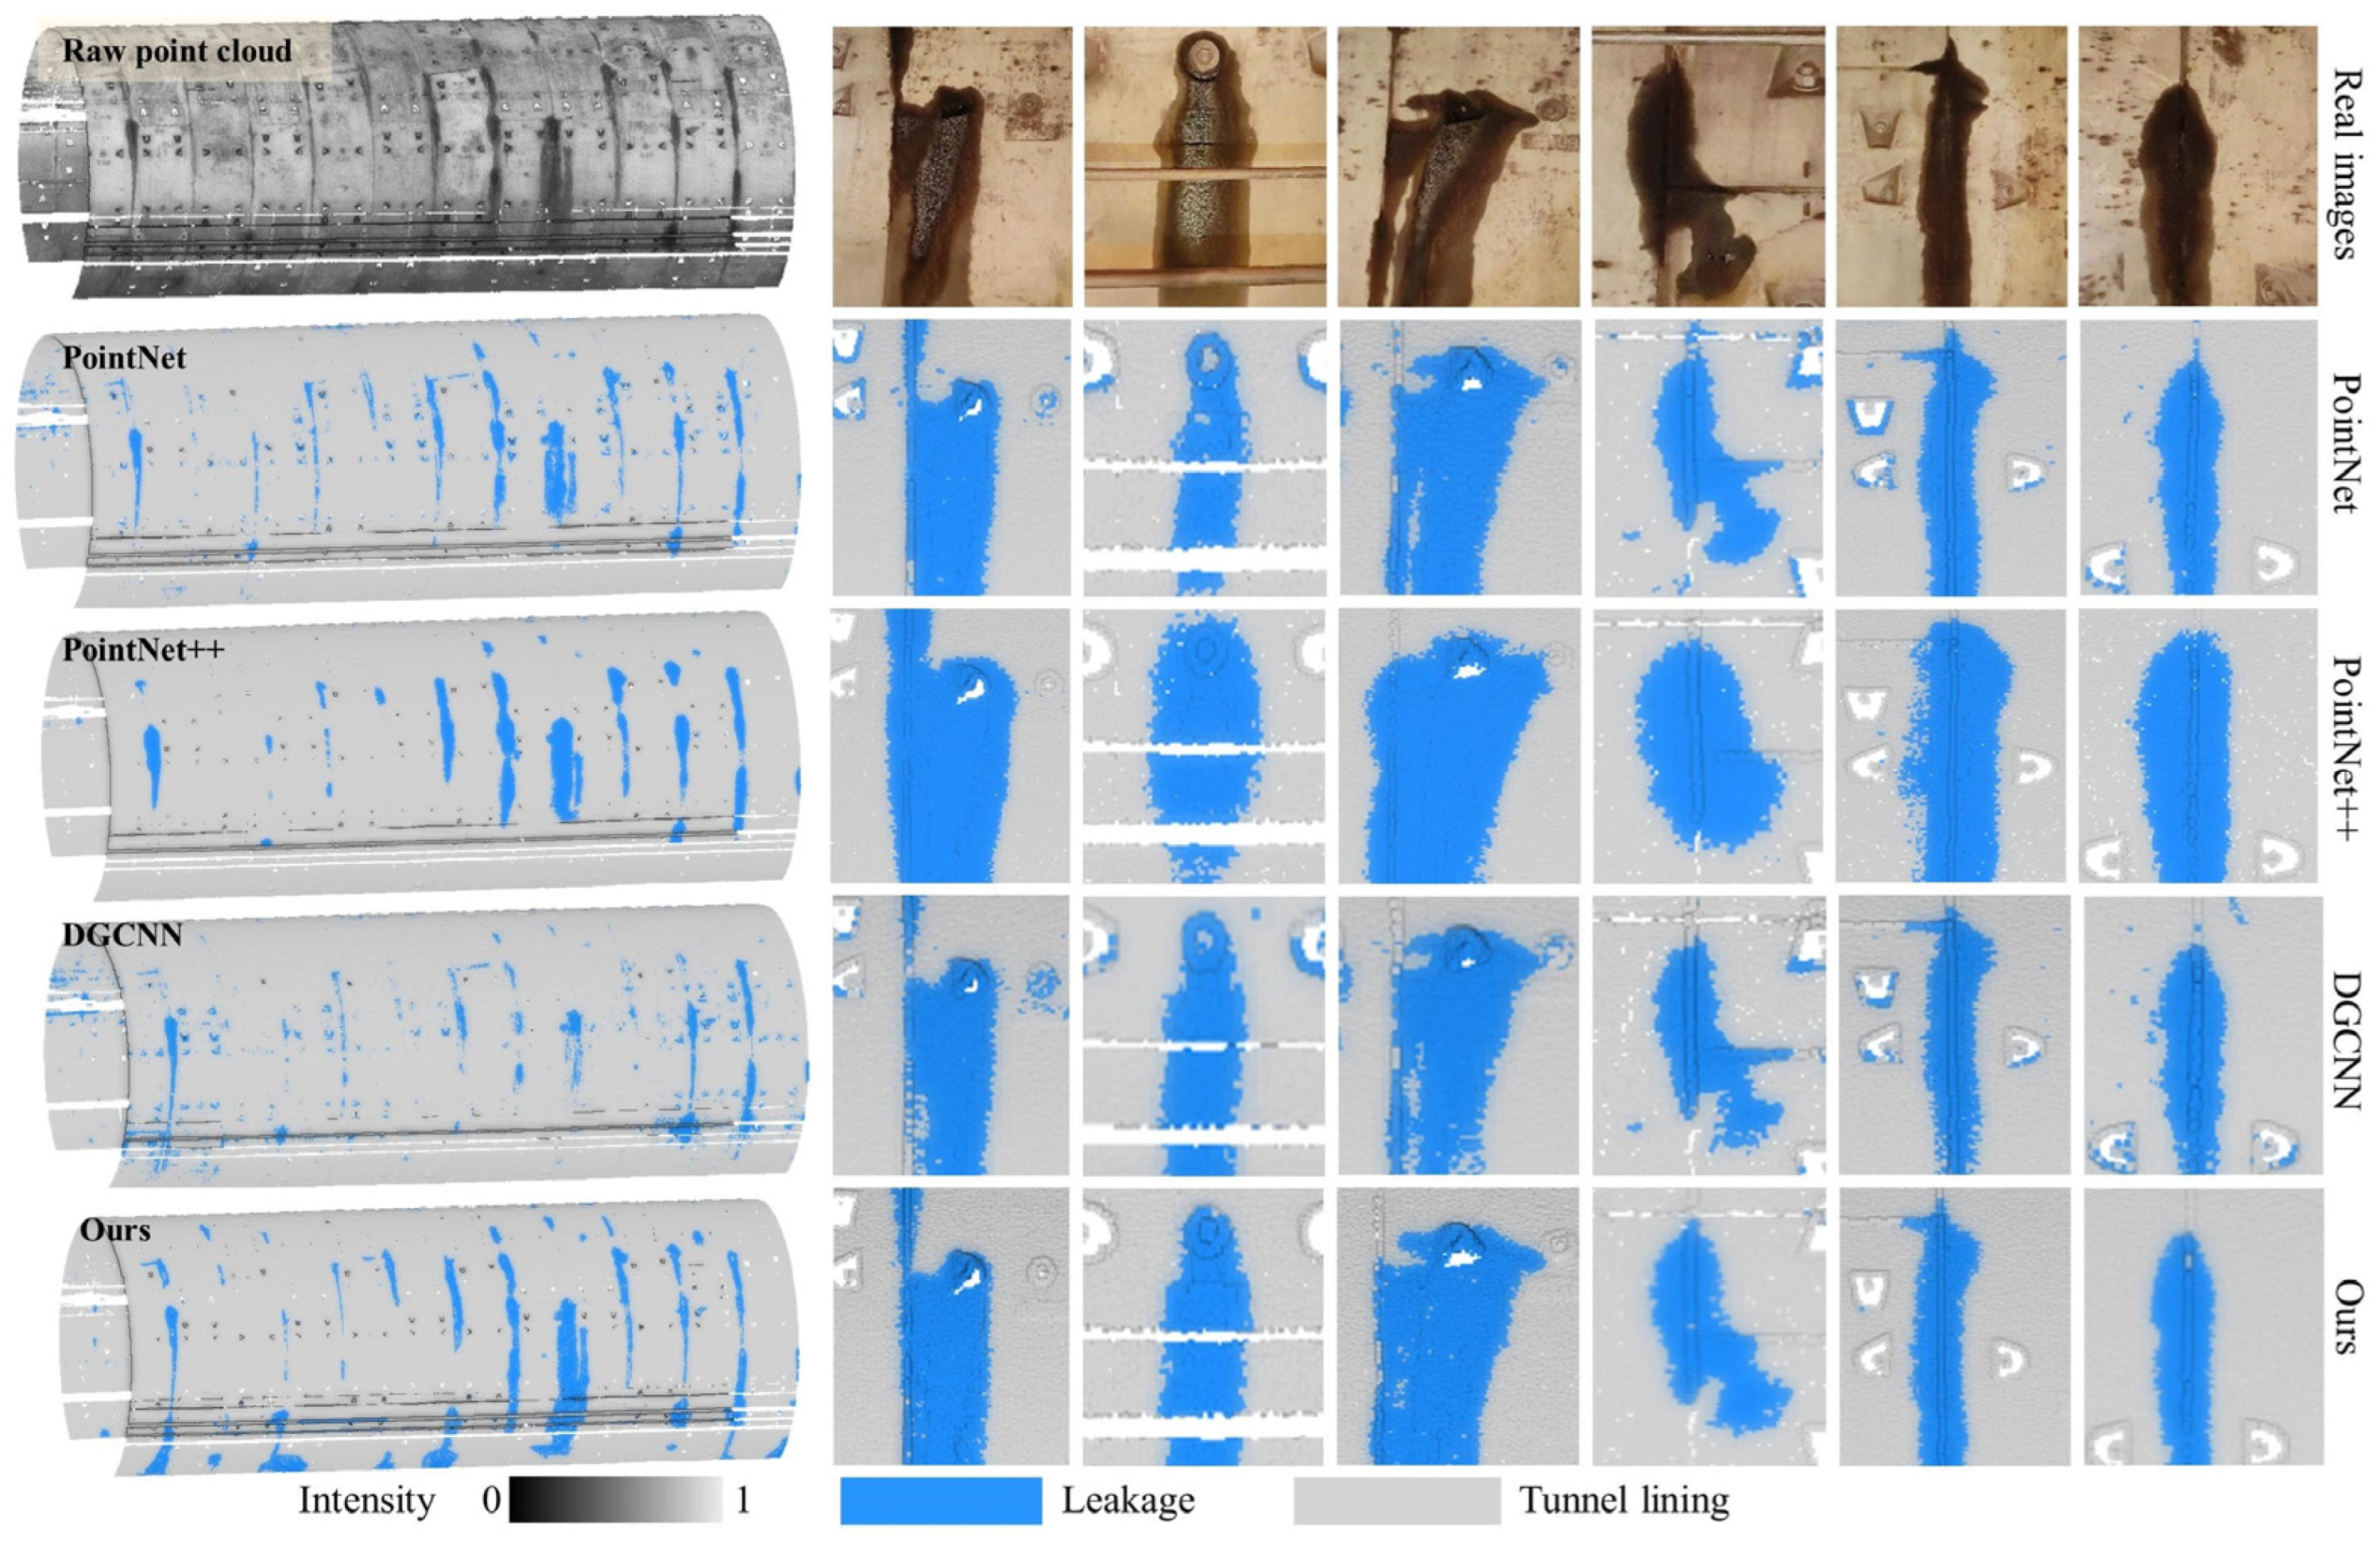
4.7. Comparison with Different Methods
4.8. Generalizability of the Proposed Method
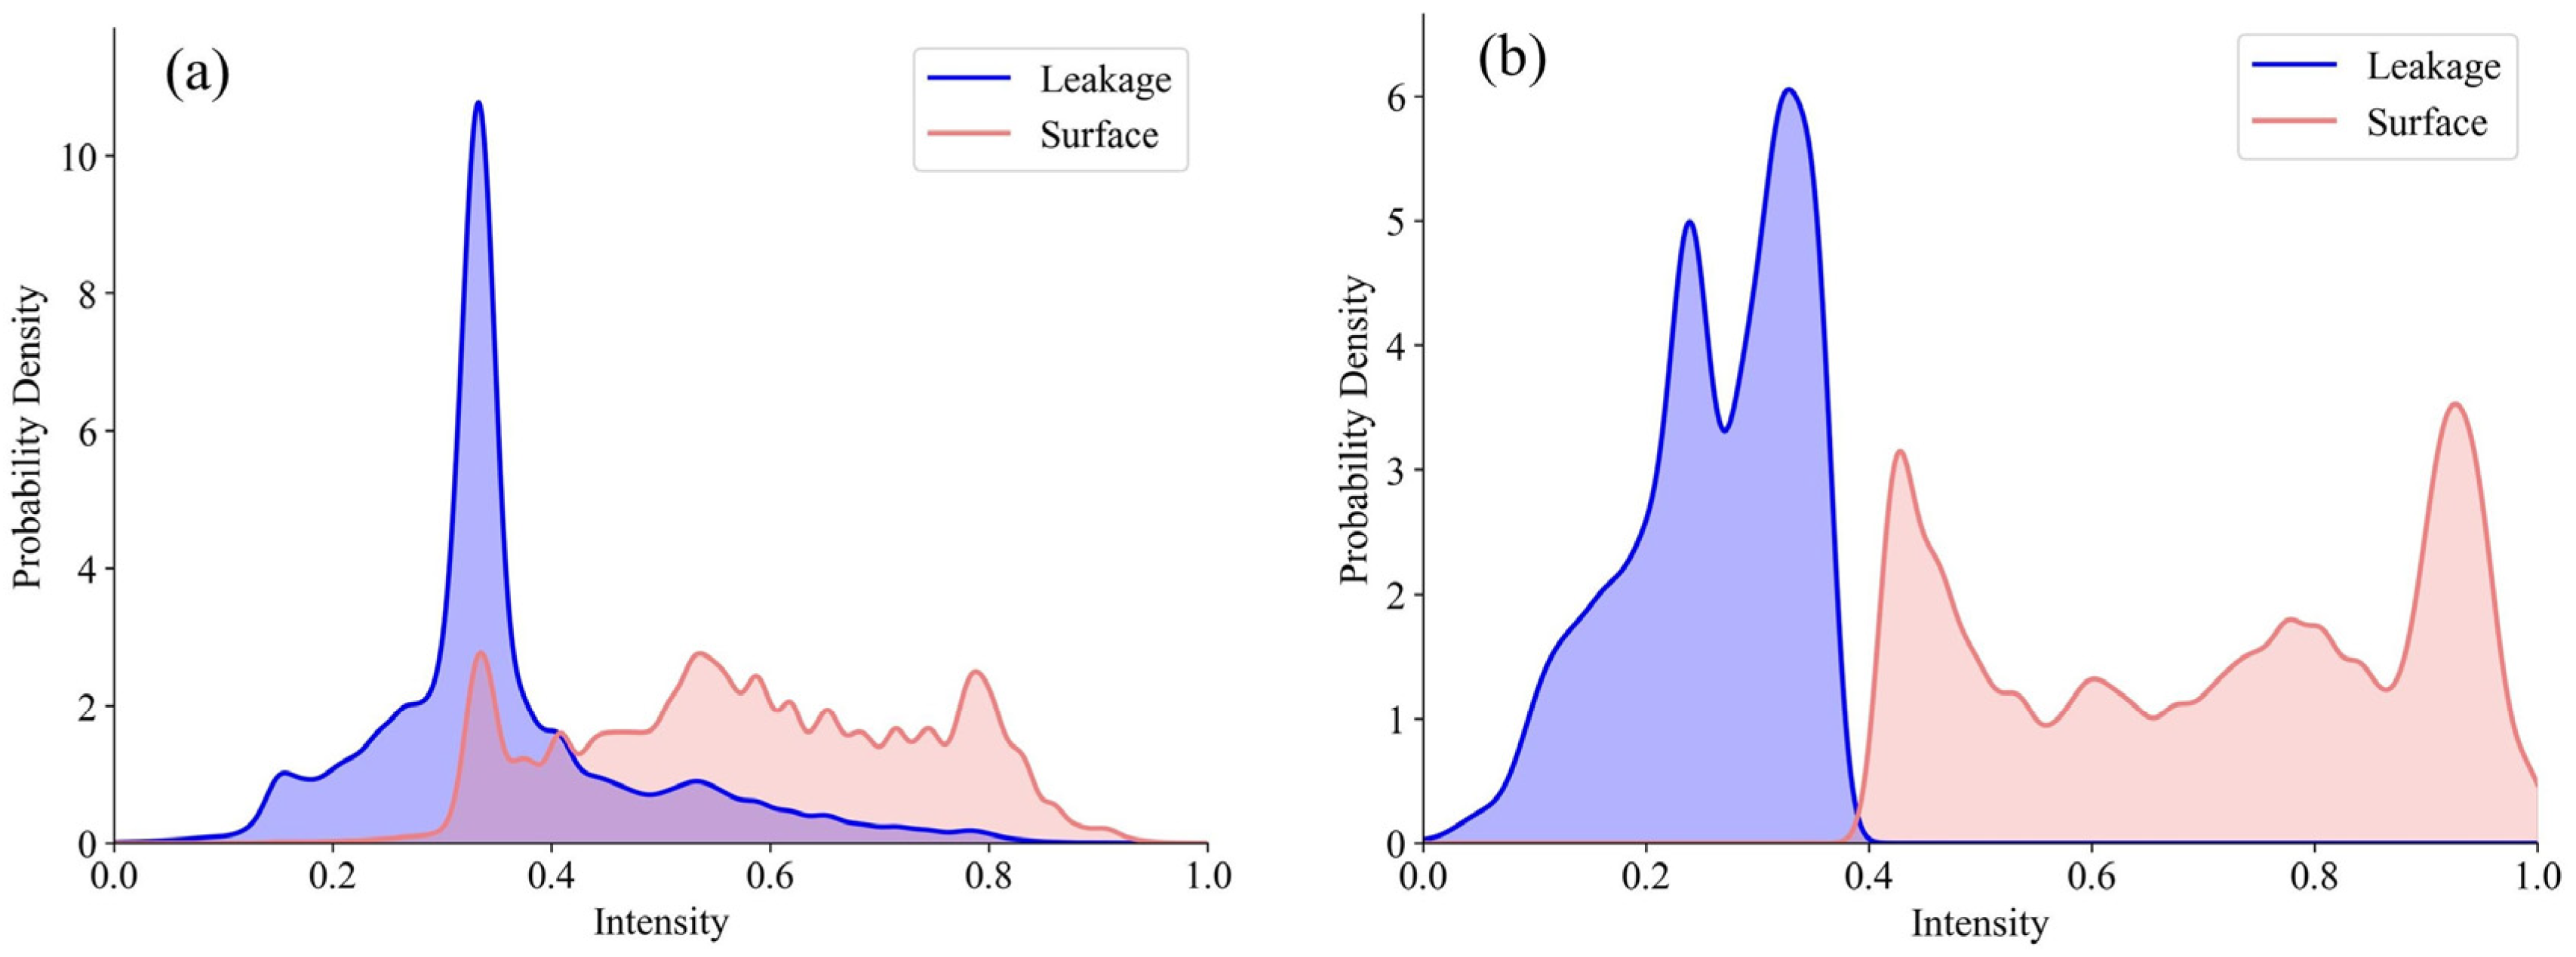
4.9. Importance of Geometric Features
5. Conclusions
Author Contributions
Funding
Institutional Review Board Statement
Informed Consent Statement
Data Availability Statement
Conflicts of Interest
References
- Guo, Z.; Wei, J.; Sun, H.; Zhong, R.; Ji, C. Enhanced water leakage detection in shield tunnels based on laser scanning intensity images using RDES-Net. IEEE J. Sel. Top. Appl. Earth Obs. Remote Sens. 2024, 17, 5680–5690. [Google Scholar] [CrossRef]
- Zhou, H.; Gao, B.; Wu, W. Automatic crack detection and quantification for tunnel lining surface from 3D terrestrial LiDAR data. J. Eng. Res. 2023, 11, 239–257. [Google Scholar] [CrossRef]
- Cui, H.; Mao, Q.; Li, J.; Hu, Q.; Tao, Y.; Ma, J.; Li, Z. Shield tunnel dislocation detection method based on semantic segmentation and bolt hole positioning of MLS point cloud. IEEE Trans. Geosci. Remote Sens. 2024, 62, 5702815. [Google Scholar] [CrossRef]
- Camara, M.; Wang, L.; You, Z. Tunnel cross-section deformation monitoring based on mobile laser scanning point cloud. Sensors 2024, 24, 7192. [Google Scholar] [CrossRef] [PubMed]
- Liu, C.; Liu, Y.; Chen, Y.; Zhao, C.; Qiu, J.; Wu, D.; Liu, T.; Fan, H.; Qin, Y.; Tang, K. A state-of-the-practice review of three-dimensional laser scanning technology for tunnel distress monitoring. J. Perform. Constr. Facil. 2023, 37, 03123001. [Google Scholar] [CrossRef]
- Yu, P.; Wu, H.; Liu, C.; Xu, Z. Water Leakage Diagnosis in Metro Tunnels by Intergration of Laser Point Cloud and Infrared Thermal Imaging. In Proceedings of the International Archives of the Photogrammetry, Remote Sensing and Spatial Information Sciences, Beijing, China, 7–10 May 2018; pp. 2167–2171. [Google Scholar]
- Huang, H.; Sun, Y.; Xue, Y.; Wang, F. Inspection equipment study for subway tunnel defects by grey-scale image processing. Adv. Eng. Inform. 2017, 32, 188–201. [Google Scholar] [CrossRef]
- Huang, H.; Cheng, W.; Zhou, M.; Chen, J.; Zhao, S. Towards automated 3D inspection of water leakages in shield tunnel linings using mobile laser scanning data. Sensors 2020, 20, 6669. [Google Scholar] [CrossRef] [PubMed]
- Nojima, K.; Kawhara, M. Mesh generation of three-dimensional underground tunnels based on the three-dimensional delaunay tetrahedration. J. Appl. Mech. 2002, 5, 253–262. [Google Scholar] [CrossRef]
- Yi, C.; Lu, D.; Xie, Q.; Liu, S.; Li, H.; Wei, M.; Wang, J. Hierarchical tunnel modeling from 3D raw LiDAR point cloud. Comput. Aided Des. 2019, 114, 143–154. [Google Scholar] [CrossRef]
- Wang, K.; Wu, X.; Li, H.; Wang, F.; Zhang, L.; Chen, H. Adaptively unsupervised seepage detection in tunnels from 3D point clouds. Struct. Infrastruct. Eng. 2022, 20, 1288–1306. [Google Scholar] [CrossRef]
- Li, P.; Wang, Q.; Li, J.; Pei, Y.; He, P. Automated extraction of tunnel leakage location and area from 3D laser scanning point clouds. Opt. Lasers Eng. 2024, 178, 108217. [Google Scholar] [CrossRef]
- Hawley, C.J.; Gräbe, P. Water leakage mapping in concrete railway tunnels using LiDAR generated point clouds. Constr. Build. Mater. 2022, 361, 129644. [Google Scholar] [CrossRef]
- Tan, K.; Cheng, X.; Ju, Q.; Wu, S. Correction of mobile TLS intensity data for water leakage spots detection in metro tunnels. IEEE Geosci. Remote Sens. Lett. 2016, 13, 1711–1715. [Google Scholar] [CrossRef]
- Xu, T.; Xu, L.; Li, X.; Yao, J. Detection of water leakage in underground tunnels using corrected intensity data and 3D point cloud of terrestrial laser scanning. IEEE Access 2018, 6, 32471–32480. [Google Scholar] [CrossRef]
- He, K.; Zhang, X.; Ren, S.; Sun, J. Deep Residual Learning for Image Recognition. In Proceedings of the IEEE Conference on Computer Vision and Pattern Recognition, Las Vegas, NV, USA, 27–30 June 2016; pp. 770–778. [Google Scholar]
- Faster, R. Towards Real-Time Object Detection with Region Proposal Networks. In Proceedings of the Advances in Neural Information Processing Systems, Montreal, QC, Canada, 7–12 December 2015; pp. 2969239–2969250. [Google Scholar]
- Dai, J.; Li, Y.; He, K.; Sun, J. R-FCN: Object Detection Via Region-Based Fully Convolutional Networks. In Proceedings of the Advances in Neural Information Processing Systems, Long Beach, CA, USA, 5–10 December 2016; pp. 379–387. [Google Scholar]
- Chen, Q.; Kang, Z.; Cao, Z.; Xie, X.; Guan, B.; Pan, Y.; Chang, J. Combining cylindrical voxel and mask R-CNN for automatic detection of water leakages in shield tunnel point clouds. Remote Sens. 2024, 16, 896. [Google Scholar] [CrossRef]
- Chen, L.-C.; Zhu, Y.; Papandreou, G.; Schroff, F.; Adam, H. Encoder-Decoder with Atrous Separable Convolution for Semantic Image Segmentation. In Proceedings of the European Conference on Computer Vision (ECCV), Munich, Germany, 8–14 September 2018; pp. 801–818. [Google Scholar]
- Redmon, J.; Divvala, S.; Girshick, R.; Farhadi, A. You only look once: Unified, Real-Time Object Detection. In Proceedings of the IEEE Conference on Computer Vision and Pattern Recognition, Las Vegas, NV, USA, 27–30 June 2016; pp. 779–788. [Google Scholar]
- Xu, X.; Zhao, M.; Shi, P.; Ren, R.; He, X.; Wei, X.; Yang, H. Crack detection and comparison study based on faster R-CNN and mask R-CNN. Sensors 2022, 22, 1215. [Google Scholar] [CrossRef] [PubMed]
- Xu, Y.; Li, D.; Xie, Q.; Wu, Q.; Wang, J. Automatic defect detection and segmentation of tunnel surface using modified Mask R-CNN. Measurement 2021, 178, 109316. [Google Scholar] [CrossRef]
- Zhao, X.; Wang, X.; Du, Z. Research on Detection Method for the Leakage of Underwater Pipeline by YOLOv3. In Proceedings of the IEEE International Conference on Mechatronics and Automation (ICMA), Zhengzhou, China, 13–16 October 2020; pp. 637–642. [Google Scholar]
- Liu, S.; Sun, H.; Zhang, Z.; Li, Y.; Zhong, R.; Li, J.; Chen, S. A multiscale deep feature for the instance segmentation of water leakages in tunnel using MLS point cloud intensity images. IEEE Trans. Geosci. Remote Sens. 2022, 60, 1–16. [Google Scholar] [CrossRef]
- He, K.; Gkioxari, G.; Dollár, P.; Girshick, R. Mask R-CNN. In Proceedings of the IEEE International Conference on Computer Vision, Venice, Italy, 22–29 October 2017; pp. 2961–2969. [Google Scholar]
- Long, J.; Shelhamer, E.; Darrell, T. Fully Convolutional Networks for Semantic Segmentation. In Proceedings of the IEEE Conference on Computer Vision and Pattern Recognition, Boston, MA, USA, 7–12 June 2015; pp. 3431–3440. [Google Scholar]
- Chen, J.; Xu, X.; Jeon, G.; Camacho, D.; He, B.-G. WLR-Net: An improved YOLO-V7 with edge constraints and attention mechanism for water leakage recognition in the tunnel. IEEE Trans. Emerg. Top. Comput. Intell. 2024, 8, 3105–3116. [Google Scholar] [CrossRef]
- Wang, D.; Hou, G.; Chen, Q.; Li, W.; Fu, H.; Sun, X.; Yu, X. Segmentation of tunnel water leakage based on a lightweight DeepLabV3+ model. Meas. Sci. Technol. 2024, 36, 015414. [Google Scholar] [CrossRef]
- Xue, Y.; Shi, P.; Jia, F.; Huang, H. 3D reconstruction and automatic leakage defect quantification of metro tunnel based on SfM-Deep learning method. Undergr. Space 2022, 7, 311–323. [Google Scholar] [CrossRef]
- Shen, Y.; Wang, J.; Wang, J.; Duan, W.; Ferreira, V.G. Methodology for extraction of tunnel cross-sections using dense point cloud data. J. Geod. Geoinf. Sci. 2021, 4, 56. [Google Scholar]
- Huang, J.; Shen, Y.; Wang, J.; Ferreira, V. Automatic pylon extraction using color-aided classification from UAV LiDAR point cloud data. IEEE Trans. Instrum. Meas. 2023, 72, 2520611. [Google Scholar] [CrossRef]
- Belton, D.; Lichti, D.D. Classification and Segmentation of Terrestrial Laser Scanner Point Clouds Using Local Variance Information. In Proceedings of the International Archives of the Photogrammetry, Remote Sensing and Spatial Information Sciences, Dresden, Germany, 25–27 September 2006; pp. 44–49. [Google Scholar]
- Lalonde, J.-F.; Unnikrishnan, R.; Vandapel, N.; Hebert, M. Scale Selection for Classification of Point-Sampled 3D Surfaces. In Proceedings of the Fifth International Conference on 3-D Digital Imaging and Modeling (3DIM 2005), Ottawa, ON, Canada, 13–16 June 2005; pp. 285–292. [Google Scholar]
- Weinmann, M.; Urban, S.; Hinz, S.; Jutzi, B.; Mallet, C. Distinctive 2D and 3D features for automated large-scale scene analysis in urban areas. Comput. Graph. 2015, 49, 47–57. [Google Scholar] [CrossRef]
- Chen, T.; Guestrin, C. Xgboost: A Scalable Tree Boosting System. In Proceedings of the 22nd ACM Sigkdd International Conference on Knowledge Discovery and Data Mining, San Francisco, CA, USA, 17–21 November 2016; pp. 785–794. [Google Scholar]
- Shen, Y.; Yang, Y.; Jiang, J.; Wang, J.; Huang, J.; Ferreira, V.; Chen, Y. A novel method to segment individual wire from bundle conductor using UAV-LiDAR point cloud data. Measurement 2023, 211, 112603. [Google Scholar] [CrossRef]


| Approach | Source | Structure | Equipment | Used Data Type for Detection | Detection Techniques | Detection Accuracy | Limitations |
|---|---|---|---|---|---|---|---|
| Intensity threshold-based segmentation | Huang, et al. [7] | Shield | MTI-100 system (Line array camera) | Image | Otsu method | NA | (1) Sensitive to lighting conditions and object occlusion (2) Sensitive to varying threshold (3) Failure to visualize leakage patterns in 3D space |
| Xu, et al. [15] | Rectangle | TLS system ((RIEGL VZ400i scanner) | Images projected using point clouds | Intensity threshold | NA | ||
| Image-based supervised classification | Liu, et al. [25] | Shield | MLS system (Faro 120 & Leica P16 scanner) | Images projected using point clouds | (1) Res2Net (2) Cascade module (3) FCN | AP: 58.9% AP50: 89.7% AP75: 66.8% | (1) Sensitive to lighting conditions and object occlusion (2) Spatial information loss from 2D projection (3) Failure to visualize leakage patterns in 3D space |
| Guo, et al. [1] | Shield | MLS system (Faro X120 scanner) | Images projected using point clouds | (1) YOLOv5 (2) E3NCA (3) SoftNMS | mAP: 68.9%/49.2 | ||
| Chen, et al. [28] | Shield | NA | Images | (1) YOLOv7 (2) Attention mechanisms (3) Edge refinement | IoU: 89.97% | ||
| Wang, et al. [29] | Shield | Manual photography | Images | (1) DeepLabV3 (2) Channel attention | mIoU: 84.68% | ||
| Chen, et al. [19] | Shield | MLS system (Faro 120 scanner)/TLS system (Faro 350 scanner) | Images projected using point clouds | (1) Mask R-CNN (2) FPN (3) ResNet 50 | mAP: 76.4% |
| Data | Mean Values of Cross-Sectional Deformation | Point Cloud Density | Leakage Type | Training Samples | Testing Samples | ||||
|---|---|---|---|---|---|---|---|---|---|
| Length | Total Points | Ratio | Length | Total Points | Ratio | ||||
| Dataset 1 | 2 mm | 5865 pts/m2 | Joint leakage | 800 m | 83,020,439 | 1:61 | 200 m | 19,412,661 | 1:22 |
| Dataset 2 | 4 mm | 1652 pts/m2 | Joint leakage | 294 m | 4,846,982 | 1:24 | 22 m | 478,201 | 1:109 |
| k-Value | Dataset 1 | Dataset 2 | ||||
|---|---|---|---|---|---|---|
| Recall | Precision | F1-score | Recall | Precision | F1-score | |
| 5 | 87.17 | 95.56 | 91.18 | 97.59 | 96.81 | 97.20 |
| 10 | 98.47 | 81.66 | 89.28 | 97.41 | 98.27 | 97.84 |
| 20 | 82.38 | 86.10 | 84.20 | 95.19 | 97.03 | 96.10 |
| 40 | 33.50 | 61.58 | 43.39 | 93.66 | 95.58 | 94.61 |
| 60 | 64.79 | 91.57 | 75.88 | 94.61 | 93.46 | 94.03 |
| 80 | 74.92 | 88.30 | 81.06 | 93.50 | 92.13 | 92.81 |
| 100 | 64.35 | 81.42 | 71.89 | 92.94 | 90.57 | 91.74 |
| Data | Structure | Source | Precision | Recall | F1-score |
|---|---|---|---|---|---|
| Dataset 1 | Shield | Nanjing, line2 | 87.17 | 95.56 | 91.18 |
| Dataset 2 | Shield | Nanjing, line10 | 97.41 | 98.27 | 97.84 |
| Classifier | Dataset 1 | Dataset 2 | ||||
|---|---|---|---|---|---|---|
| Recall | Precision | F1-score | Recall | Precision | F1-score | |
| XGBoost | 87.17 | 95.56 | 91.18 | 97.41 | 98.27 | 97.84 |
| AdaBoost | 75.69 | 97.93 | 85.39 | 91.30 | 98.55 | 94.79 |
| RF | 51.89 | 96.99 | 67.61 | 88.85 | 98.59 | 93.46 |
| LightGBM | 84.20 | 84.51 | 84.35 | 87.86 | 93.80 | 90.73 |
| CatBoost | 84.42 | 89.22 | 86.75 | 94.21 | 94.47 | 94.34 |
| Classifier | Dataset 1 | Dataset 2 | ||
|---|---|---|---|---|
| Training | Testing | Training | Testing | |
| XGBoost | 9.43 | 0.03 | 0.14 | 0.001 |
| AdaBoost | 5308.25 | 0.58 | 6.93 | 0.02 |
| RF | 956.40 | 0.15 | 0.93 | 0.006 |
| LightGBM | 6.13 | 0.08 | 0.05 | 0.001 |
| CatBoost | 90.78 | 0.10 | 2.76 | 0.001 |
| Method | Precision | Recall | F1-score | Train Time | Test Time | Total Time |
|---|---|---|---|---|---|---|
| PointNet | 70.70 | 53.20 | 60.70 | 2 h 14 m | 45 m | 2 h 59 m |
| PointNet++ | 74.62 | 52.95 | 61.94 | 4 h 8 m | 42 m | 4 h 50 m |
| DGCNN | 54.78 | 76.11 | 63.71 | 3 h 50 m | 9 m | 3 h 59 m |
| Ours | 95.56 | 87.17 | 91.18 | 2 h 9 m | 0.03 m | 2 h 9.03 m |
| Data | Structure | Source | Scanner Type | Point Cloud Density | Precision | Recall | F1-score |
|---|---|---|---|---|---|---|---|
| Dataset 3 | Shield | Nanjing, line 3 | Z + F | 1685 pts/m2 | 81.64 | 87.49 | 84.46 |
| Dataset 4 | Shield | Wuxi, line 2 | Faro | 3094 pts/m2 | 83.65 | 85.71 | 84.66 |
| Dataset 5 | Shield | Hangzhou, line 2 | Leica | 1677 pts/m2 | 94.28 | 97.90 | 96.06 |
| Dataset 6 | Horseshoe | Nanjing | Leica | 2086 pts/m2 | 73.20 | 99.88 | 84.48 |
| Data | Feature Sets | Precision | Recall | F1-score |
|---|---|---|---|---|
| Dataset 1 | Intensity feature | 74.61 | 81.28 | 77.82 |
| Intensity feature+ Geometric features | 87.17 | 95.56 | 91.18 | |
| Dataset 2 | Intensity feature | 97.43 | 97.32 | 97.38 |
| Intensity feature + Geometric features | 97.41 | 98.27 | 97.84 |
Disclaimer/Publisher’s Note: The statements, opinions and data contained in all publications are solely those of the individual author(s) and contributor(s) and not of MDPI and/or the editor(s). MDPI and/or the editor(s) disclaim responsibility for any injury to people or property resulting from any ideas, methods, instructions or products referred to in the content. |
© 2025 by the authors. Licensee MDPI, Basel, Switzerland. This article is an open access article distributed under the terms and conditions of the Creative Commons Attribution (CC BY) license (https://creativecommons.org/licenses/by/4.0/).
Share and Cite
Zhang, A.; Huang, J.; Sun, Z.; Duan, J.; Zhang, Y.; Shen, Y. Leakage Detection in Subway Tunnels Using 3D Point Cloud Data: Integrating Intensity and Geometric Features with XGBoost Classifier. Sensors 2025, 25, 4475. https://doi.org/10.3390/s25144475
Zhang A, Huang J, Sun Z, Duan J, Zhang Y, Shen Y. Leakage Detection in Subway Tunnels Using 3D Point Cloud Data: Integrating Intensity and Geometric Features with XGBoost Classifier. Sensors. 2025; 25(14):4475. https://doi.org/10.3390/s25144475
Chicago/Turabian StyleZhang, Anyin, Junjun Huang, Zexin Sun, Juju Duan, Yuanai Zhang, and Yueqian Shen. 2025. "Leakage Detection in Subway Tunnels Using 3D Point Cloud Data: Integrating Intensity and Geometric Features with XGBoost Classifier" Sensors 25, no. 14: 4475. https://doi.org/10.3390/s25144475
APA StyleZhang, A., Huang, J., Sun, Z., Duan, J., Zhang, Y., & Shen, Y. (2025). Leakage Detection in Subway Tunnels Using 3D Point Cloud Data: Integrating Intensity and Geometric Features with XGBoost Classifier. Sensors, 25(14), 4475. https://doi.org/10.3390/s25144475