

Smart Watch Sensors for Tremor Assessment in Parkinson’s Disease—Algorithm Development and Measurement Properties Analysis

 , ,
, ,  and
and
Abstract
Highlights
- A smartwatch-based algorithm was developed to assess upper limb tremor in Parkinson’s Disease (PD) using spectral and spatiotemporal features.
- The algorithm showed moderate to strong agreement with a commercial IMU and was capable of distinguishing PD patients from healthy individuals.
- Smartwatches can be used as low-cost and accessible tools for remote clinical assessment of PD motor symptoms.
- This wearable approach may support the transition of tremor evaluation from controlled lab environments to free-living settings.
Abstract
1. Introduction
2. Materials and Methods
2.1. Study Design
2.2. Participants
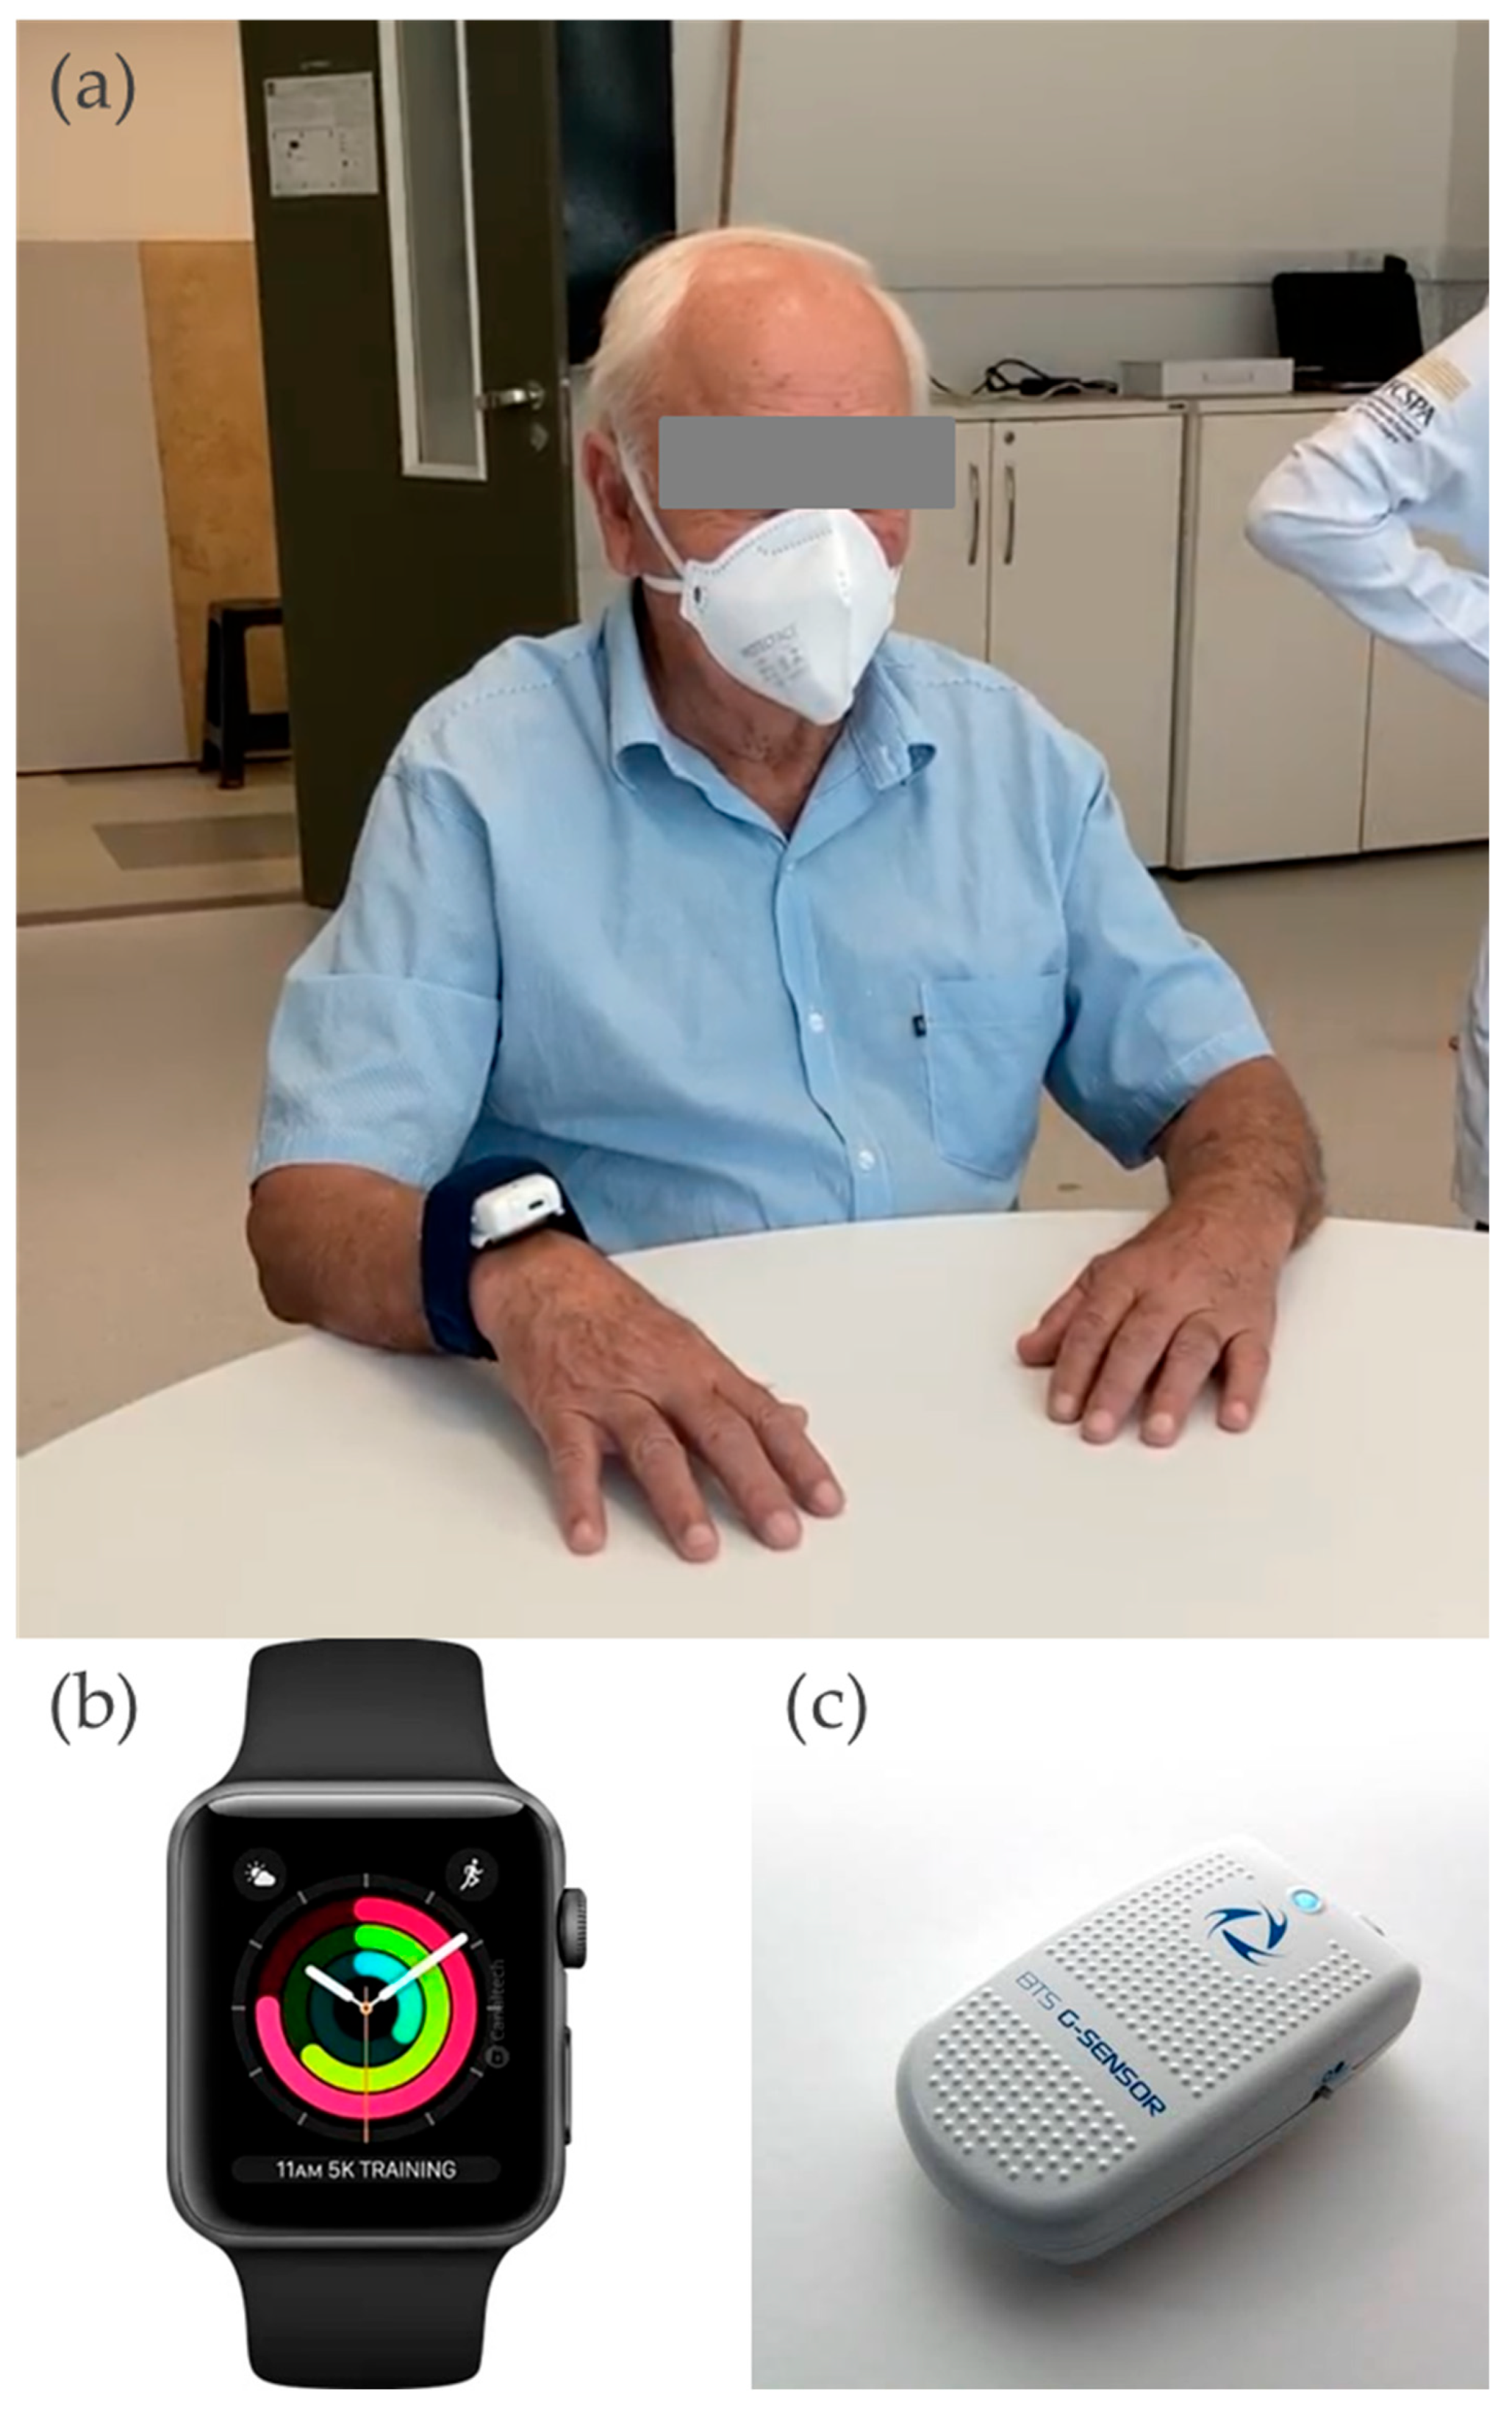
2.3. Instruments
2.4. Procedures
2.4.1. Arm Movement Acquisition
2.4.2. Data Analysis
- Signals Pre-processing
- Features Calculation
Spatio-Temporal Analysis
Spectral Analysis
2.4.3. PD Symptom Presence
2.4.4. Nine-Hole Peg Test
2.4.5. Algorithmic Assessment Features
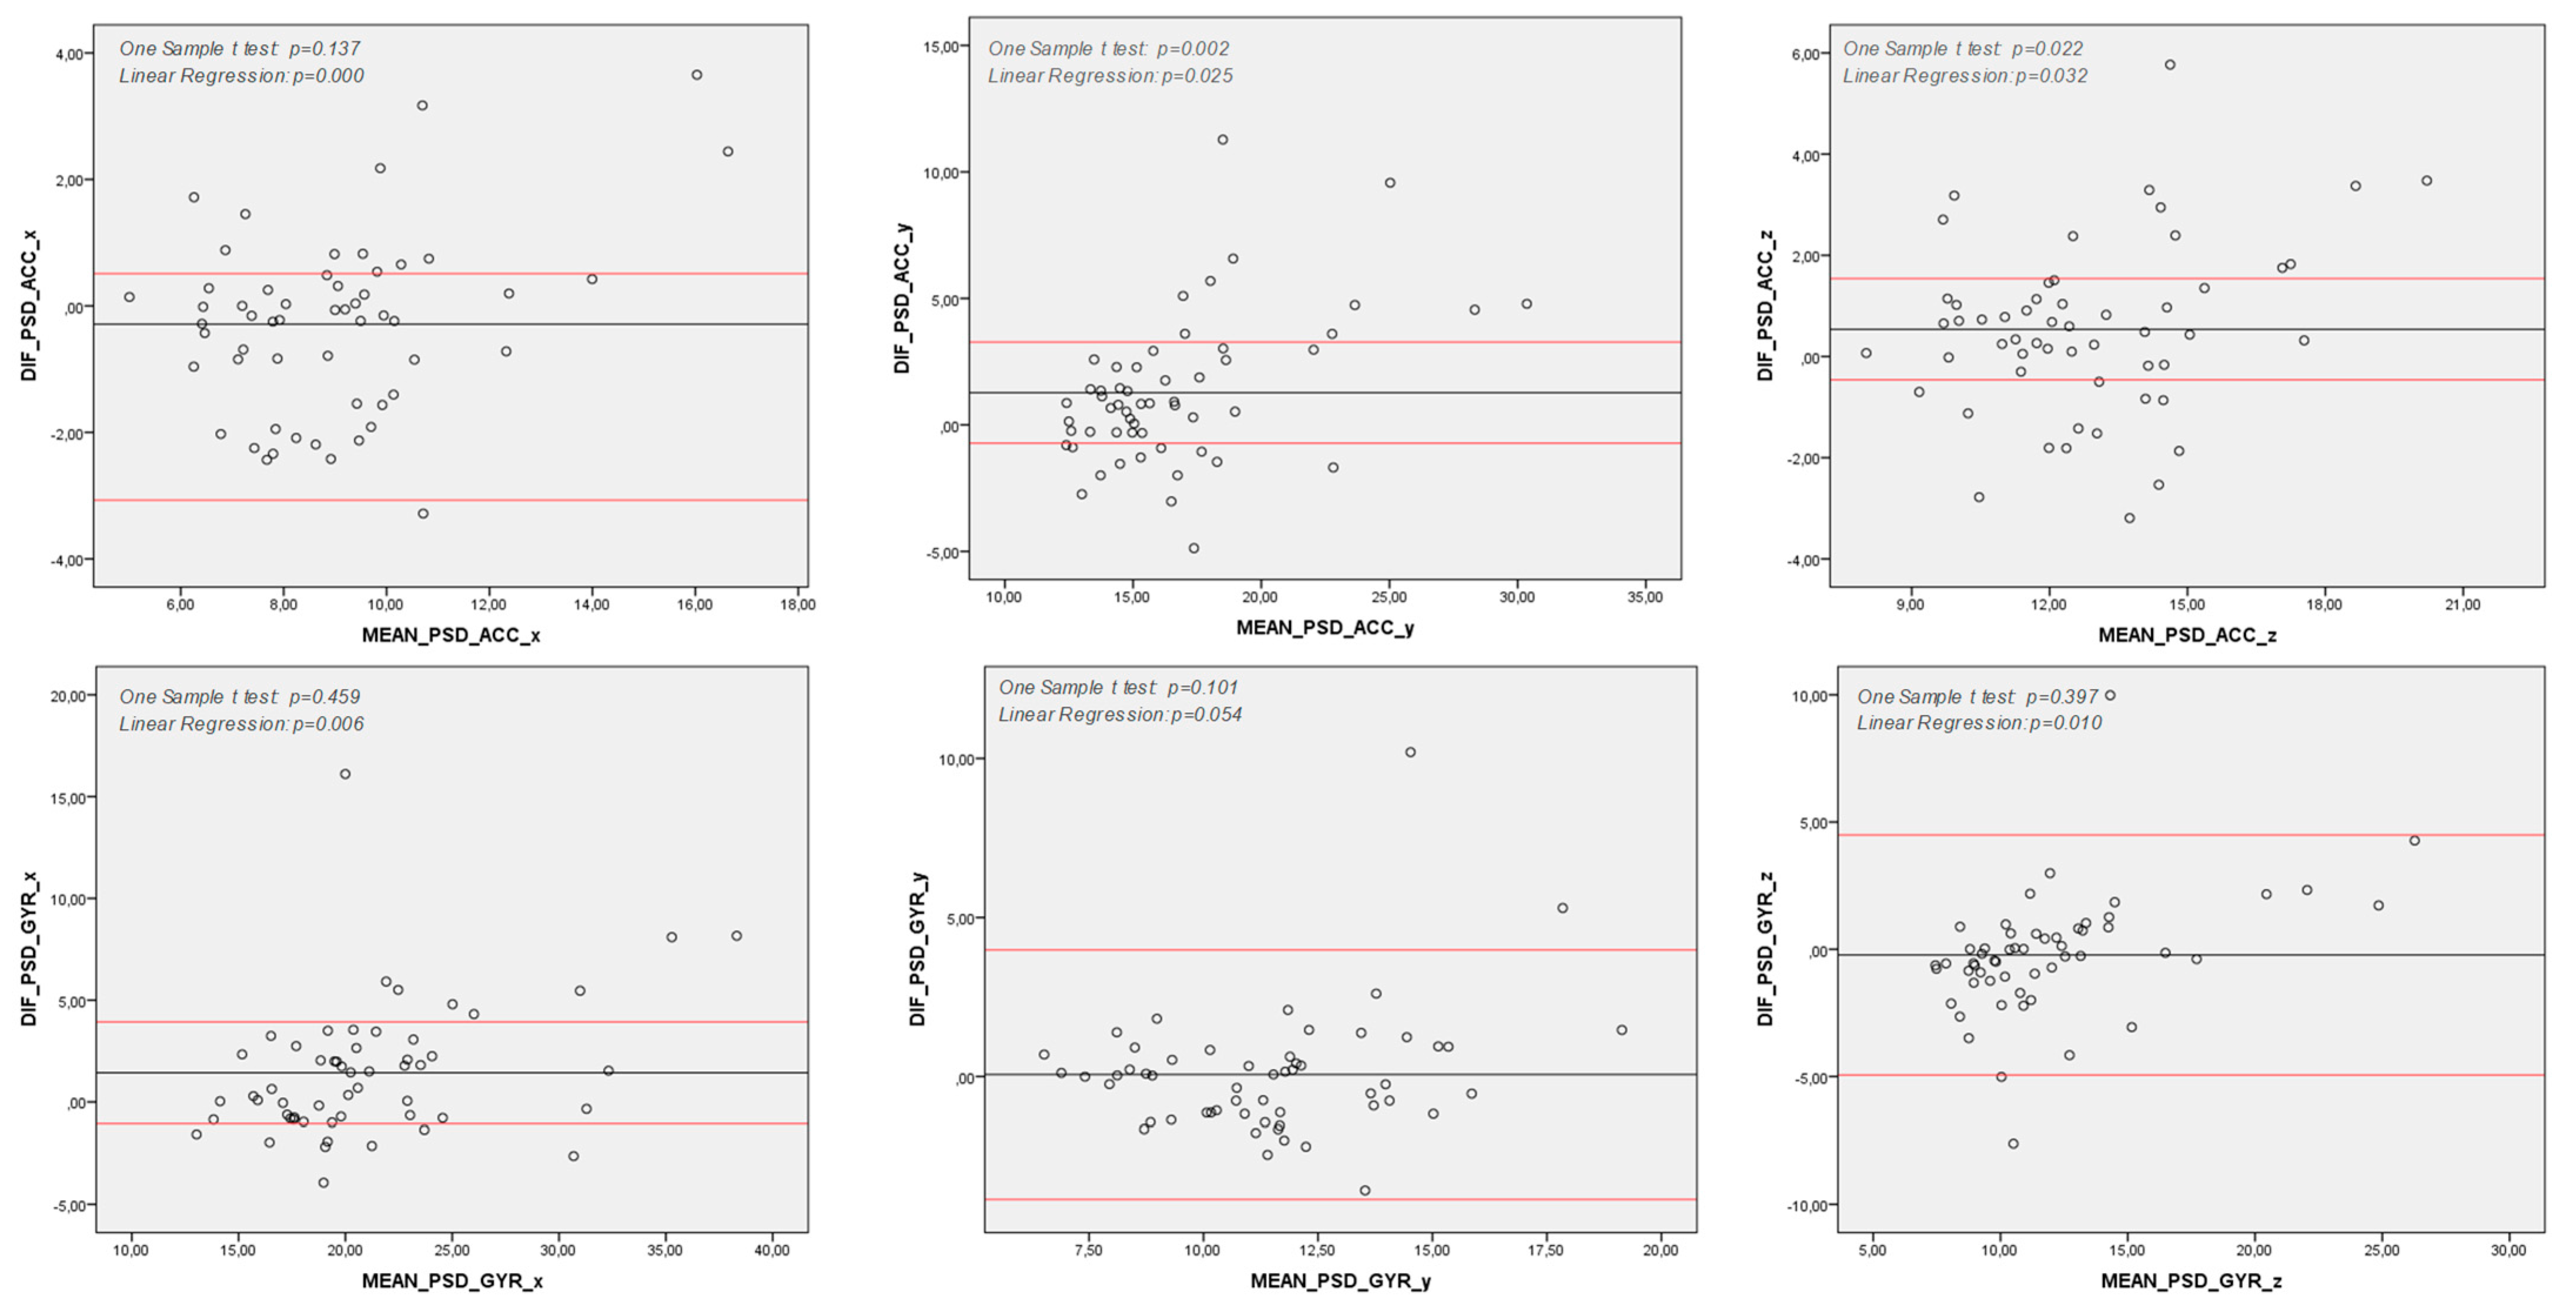
2.5. Statistical Analysis
3. Results
4. Discussion
5. Conclusions
Author Contributions
Funding
Institutional Review Board Statement
Informed Consent Statement
Data Availability Statement
Acknowledgments
Conflicts of Interest
References
- Chaudhuri, K.R.; Healy, D.G.; Schapira, A.H.V. Non-motor symptoms of Parkinson’s disease: Diagnosis and management. Lancet Neurol. 2006, 5, 235–245. [Google Scholar] [CrossRef] [PubMed]
- Hawkes, C.H.; Tredici, K.D.; Braak, H. A timeline for Parkinson’s disease. Parkinsonism Relat. Disord. 2010, 16, 79–84. [Google Scholar] [CrossRef]
- Haaxma, C.A.; Bloem, B.R.; Overeem, S.; Borm, G.F.; Horstink, M.W. Timed motor tests can detect subtle motor dysfunction in early Parkinson’s disease. Mov. Disord. 2010, 25, 1150–1156. [Google Scholar] [CrossRef]
- Gebhardt, A.; Vanbellingen, T.; Baronti, F.; Kersten, B.; Bohlhalter, S. Poor dopaminergic response of impaired dexterity in Parkinson’s disease: Bradykinesia or limb kinetic apraxia? Mov. Disord. 2008, 23, 1701–1706. [Google Scholar] [CrossRef] [PubMed]
- Proud, E.L.; Morris, M.E. Skilled hand dexterity in Parkinson’s disease: Effects of adding a concurrent task. Arch. Phys. Med. Rehabil. 2010, 91, 794–799. [Google Scholar] [CrossRef]
- Schenkman, M.; Zhu, C.W.; Cutson, T.M.; Whetten-Goldstein, K. Longitudinal evaluation of economic and physical impact of Parkinson’s disease. Parkinsonism Relat. Disord. 2001, 8, 41–50. [Google Scholar] [CrossRef] [PubMed]
- Ramsay, N.; Macleod, A.D.; Alves, G.; Camacho, M.; Forsgren, L.; Lawson, R.A.; Maple-Grødem, J.; Tysnes, O.B.; Williams-Gray, C.H.; Yarnall, A.J.; et al. Validation of a UPDRS-/MDS-UPDRS-based definition of functional dependency for Parkinson’s disease. Parkinsonism Relat. Disord. 2020, 76, 49–53. [Google Scholar] [CrossRef]
- Proud, E.L.; Miller, K.J.; Bilney, B.; Balachandran, S.; McGinley, J.L.; Morris, M.E. Evaluation of measures of upper limb functioning and disability in people with Parkinson disease: A systematic review. Arch. Phys. Med. Rehabil. 2015, 96, 540–551.e1. [Google Scholar] [CrossRef]
- Mathiowetz, V.; Volland, G.; Kashman, N.; Weber, K. Adult norms for the Box and Block Test of manual dexterity. Am. J. Occup. Ther. 1985, 39, 386–391. [Google Scholar] [CrossRef]
- Rissanen, S.; Kankaanpää, M.; Tarvainen, M.P.; Nuutinen, J.; Tarkka, I.M.; Airaksinen, O.; Karjalainen, P.A. Analysis of surface EMG signal morphology in Parkinson’s disease. Physiol. Meas. 2007, 28, 1507–1521. [Google Scholar] [CrossRef]
- Meigal, A.; Rissanen, S.; Tarvainen, M.; Karjalainen, P.; Iudina-Vassel, I.; Airaksinen, O.; Kankaanpää, M. Novel parameters of surface EMG in patients with Parkinson’s disease and healthy young and old controls. J. Electromyogr. Kinesiol. 2009, 19, e206–e213. [Google Scholar] [CrossRef]
- Salarian, A.; Russmann, H.; Wider, C.; Burkhard, P.R.; Vingerhoets, F.J.G.; Aminian, K. Quantification of tremor and bradykinesia in Parkinson’s disease using a novel ambulatory monitoring system. IEEE Trans. Biomed. Eng. 2007, 54, 313–322. [Google Scholar] [CrossRef]
- Salarian, A.; Russmann, H.; Vingerhoets, F.J.G.; Burkhard, P.R.; Aminian, K. Ambulatory monitoring of physical activities in patients with Parkinson’s disease. IEEE Trans. Biomed. Eng. 2007, 54, 2296–2299. [Google Scholar] [CrossRef] [PubMed]
- Thanawattano, C.; Pongthornseri, R.; Anan, C.; Dumnin, S.; Bhidayasiri, R. Temporal fluctuations of tremor signals from inertial sensor: A preliminary study in differentiating Parkinson’s disease from essential tremor. Biomed. Eng. Online 2015, 14, 101. [Google Scholar] [CrossRef]
- Heida, T.; Wentink, E.C.; Marani, E. Power spectral density analysis of physiological, rest and action tremor in Parkinson’s disease patients treated with deep brain stimulation. J. Neuroeng. Rehabil. 2013, 10, 70. [Google Scholar] [CrossRef] [PubMed]
- Dai, H.; Zhang, P.; Lueth, T.C. Quantitative Assessment of Parkinsonian Tremor Based on an Inertial Measurement Unit. Sensors 2015, 15, 25055–25071. [Google Scholar] [CrossRef]
- Giuffrida, J.P.; Riley, D.E.; Maddux, B.N.; Heldman, D.A. Clinically deployable Kinesia technology for automated tremor assessment. Mov. Disord. 2009, 24, 723–730. [Google Scholar] [CrossRef] [PubMed]
- Hoff, J.I.; Wagemans, E.A.; van Hilten, B.J. Ambulatory objective assessment of tremor in Parkinson’s disease. Clin. Neuropharmacol. 2001, 24, 280–283. [Google Scholar] [CrossRef]
- Cole, B.T.; Roy, S.H.; De Luca, C.J.; Nawab, S. Dynamic neural network detection of tremor and dyskinesia from wearable sensor data. In Proceedings of the Annual International Conference of the IEEE Engineering in Medicine and Biology Society (EMBC), Buenos Aires, Argentina, 31 August–4 September 2010; pp. 6062–6065. [Google Scholar]
- Daneault, J.-F.; Carignan, B.; Codère, C.É.; Sadikot, A.F.; Duval, C. Using a smart phone as a standalone platform for detection and monitoring of pathological tremors. Front. Hum. Neurosci. 2012, 6, 357. [Google Scholar] [CrossRef]
- Kostikis, N.; Hristu-Varsakelis, D.; Arnaoutoglou, M.; Kotsavasiloglou, C. A Smartphone-Based Tool for Assessing Parkinsonian Hand Tremor. IEEE J. Biomed. Health Inform. 2015, 19, 1835–1842. [Google Scholar] [CrossRef]
- Wile, D.J.; Ranawaya, R.; Kiss, Z.H. Smart watch accelerometry for analysis and diagnosis of tremor. J. Neurosci. Methods 2014, 230, 1–4. [Google Scholar] [CrossRef] [PubMed]
- Prieto-Avalos, G.; Sánchez-Morales, L.N.; Alor-Hernández, G.; Sánchez-Cervantes, J.L. A Review of Commercial and Non-Commercial Wearables Devices for Monitoring Motor Impairments Caused by Neurodegenerative Diseases. Biosensors 2022, 13, 72. [Google Scholar] [CrossRef]
- von Elm, E.; Altman, D.G.; Egger, M.; Pocock, S.J.; Gøtzsche, P.C.; Vandenbroucke, J.P.; STROBE Initiative. The Strengthening the Reporting of Observational Studies in Epidemiology (STROBE) statement: Guidelines for reporting observational studies. J. Clin. Epidemiol. 2008, 61, 344–349. [Google Scholar] [CrossRef] [PubMed]
- Bossuyt, P.M.; Reitsma, J.B.; Bruns, D.E.; Gatsonis, C.A.; Glasziou, P.P.; Irwig, L.; Lijmer, J.G.; Moher, D.; Rennie, D.; de Vet, H.C.; et al. STARD 2015: An Updated List of Essential Items for Reporting Diagnostic Accuracy Studies. Radiology 2015, 277, 826–832. [Google Scholar] [CrossRef] [PubMed]
- Jankovic, J. Parkinson’s disease: Clinical features and diagnosis. J. Neurol. Neurosurg. Psychiatry 2008, 79, 368–376. [Google Scholar] [CrossRef]
- Almeida, O.P. [Mini mental state examination and the diagnosis of dementia in Brazil]. Arq. Neuropsiquiatr. 1998, 56, 605–612. [Google Scholar] [CrossRef]
- McGrath, J.W.; Neville, J.; Stewart, T.; Clinning, H.; Thomas, B.; Cronin, J. Quantifying cricket fast bowling volume, speed and perceived intensity zone using an Apple Watch and machine learning. J. Sports Sci. 2022, 40, 323–330. [Google Scholar] [CrossRef]
- Goetz, C.G.; Poewe, W.; Rascol, O.; Sampaio, C.; Stebbins, G.T.; Counsell, C.; Giladi, N.; Holloway, R.G.; Moore, C.G.; Wenning, G.K.; et al. Movement Disorder Society Task Force report on the Hoehn and Yahr staging scale: Status and recommendations. Mov. Disord. 2004, 19, 1020–1028. [Google Scholar] [CrossRef]
- Ponsiglione, A.M.; Ricciardi, C.; Amato, F.; Cesarelli, M.; Cesarelli, G.; D’addio, G. Statistical Analysis and Kinematic Assessment of Upper Limb Reaching Task in Parkinson’s Disease. Sensors 2022, 22, 1708. [Google Scholar] [CrossRef]
- Berardelli, A.; Dick, J.P.; Rothwell, J.C.; Day, B.L.; Marsden, C.D. Scaling of the size of the first agonist EMG burst during rapid wrist movements in patients with Parkinson’s disease. J. Neurol. Neurosurg. Psychiatry 1986, 49, 1273–1279. [Google Scholar] [CrossRef]
- Opara, J.; Małecki, A.; Małecka, E.; Socha, T. Motor assessment in Parkinson;s disease. Ann. Agric. Environ. Med. 2017, 24, 411–415. [Google Scholar] [CrossRef]
- Patel, S.; Lorincz, K.; Hughes, R.; Huggins, N.; Growdon, J.; Standaert, D.; Akay, M.; Dy, J.; Welsh, M.; Bonato, P. Monitoring motor fluctuations in patients with Parkinson’s disease using wearable sensors. IEEE Trans. Inf. Technol. Biomed. 2009, 13, 864–873. [Google Scholar] [CrossRef] [PubMed]
- Jia, X.; Duroseau, N.; Chan, V.; Ciraco, C.; Wang, R.; Nia, S.M.; Ho, K.; Govindavari, J.P.; Delgosha, F.; Chan, T.; et al. Objective quantification of upper extremity motor functions in Unified Parkinson’s Disease Rating Scale Test. In Proceedings of the Annual International Conference of the IEEE Engineering in Medicine and Biology Society (EMBC), Chicago, IL, USA, 26–30 August 2014; pp. 5345–5348. [Google Scholar]
- Hoffman, J.D.; McNames, J. Objective measure of upper extremity motor impairment in Parkinson’s disease with inertial sensors. In Proceedings of the Annual International Conference of the IEEE Engineering in Medicine and Biology Society (EMBC), Boston, MA, USA, 30 August–3 September 2011; pp. 4378–4381. [Google Scholar]
- Yokoe, M.; Okuno, R.; Hamasaki, T.; Kurachi, Y.; Akazawa, K.; Sakoda, S. Opening velocity, a novel parameter, for finger tapping test in patients with Parkinson’s disease. Parkinsonism Relat. Disord. 2009, 15, 440–444. [Google Scholar] [CrossRef]
- Calzetti, S.; Baratti, M.; Gresty, M.; Findley, L. Frequency/amplitude characteristics of postural tremor of the hands in a population of patients with bilateral essential tremor: Implications for the classification and mechanism of essential tremor. J. Neurol. Neurosurg. Psychiatry 1987, 50, 561–567. [Google Scholar] [CrossRef] [PubMed]
- Mcgurrin, P.; Mcnames, J.; Wu, T.; Hallett, M.; Haubenberger, D. Quantifying Tremor in Essential Tremor Using Inertial Sensors-Validation of an Algorithm. IEEE J. Transl. Eng. Health Med. 2021, 9, 2700110. [Google Scholar]
- Proud, E.L.; Bilney, B.; Miller, K.J.; Morris, M.E.; McGinley, J.L. Measuring Hand Dexterity in People With Parkinson’s Disease: Reliability of Pegboard Tests. Am. J. Occup. Ther. 2019, 73, 7304205050p1–7304205050p8. [Google Scholar] [CrossRef] [PubMed]
- Proud, E.; Morris, M.E.; Bilney, B.; Miller, K.J.; Nijkrake, M.J.; Munneke, M.; McGinley, J.L. Hand dexterity assessment in Parkinson’s disease: Construct validity of the 9-Hole peg test for the more affected hand. Disabil. Rehabil. 2021, 43, 3834–3838. [Google Scholar] [CrossRef]
- Weir, J.P. Quantifying test-retest reliability using the intraclass correlation coefficient and the SEM. J. Strength. Cond. Res. 2005, 19, 231–240. [Google Scholar]
- Hopkins, W.G. Measures of reliability in sports medicine and science. Sports Med. 2000, 30, 1–15. [Google Scholar] [CrossRef]
- Metz, C.E. Basic principles of ROC analysis. Semin. Nucl. Med. 1978, 8, 283–298. [Google Scholar] [CrossRef]
- Channa, A.; Ifrim, R.-C.; Popescu, D.; Popescu, N. A-WEAR Bracelet for Detection of Hand Tremor and Bradykinesia in Parkinson’s Patients. Sensors 2021, 21, 981. [Google Scholar] [CrossRef] [PubMed]
- Suzuki, M.; Mitoma, H.; Yoneyama, M. Quantitative Analysis of Motor Status in Parkinson’s Disease Using Wearable Devices: From Methodological Considerations to Problems in Clinical Applications. Parkinsons Dis. 2017, 2017, 6139716. [Google Scholar] [CrossRef] [PubMed]
- McNames, J.; Shah, V.V.; Mancini, M.; Curtze, C.; El-Gohary, M.; Aboy, M.; Carlson-Kuhta, P.; Nutt, J.G.; Fay, H. A Two-Stage Tremor Detection Algorithm for Wearable Inertial Sensors During Normal Daily Activities. In Proceedings of the Annual International Conference of the IEEE Engineering in Medicine and Biology Society (EMBC), Berlin, Germany, 23–27 July 2019; pp. 2535–2538. [Google Scholar]
- Kavanagh, J.J.; Menz, H.B. Accelerometry: A technique for quantifying movement patterns during walking. Gait Posture 2008, 28, 1–15. [Google Scholar] [CrossRef]
- Hess, C.W.; Pullman, S.L. Tremor: Clinical phenomenology and assessment techniques. Tremor Other Hyperkinet Mov. 2012, 2, tre-02-65-365-1. [Google Scholar] [CrossRef]
- Deuschl, G.; Bain, P.; Brin, M. Consensus statement of the Movement Disorder Society on Tremor. Ad Hoc Scientific Committee. Mov. Disord. 1998, 13, 2–23. [Google Scholar] [CrossRef]
- Bhatia, K.P.; Bain, P.; Bajaj, N.; Elble, R.J.; Hallett, M.; Louis, E.D.; Raethjen, J.; Stamelou, M.; Testa, C.M.; Deuschl, G.; et al. Consensus Statement on the classification of tremors. from the task force on tremor of the International Parkinson and Movement Disorder Society. Mov. Disord. 2018, 33, 75–87. [Google Scholar] [CrossRef] [PubMed]
- Buijink, A.W.G.; Contarino, M.F.; Koelman, J.H.T.M.; Speelman, J.D.; van Rootselaar, A.F. How to tackle tremor—Systematic review of the literature and diagnostic work-up. Front. Neurol. 2012, 3, 146. [Google Scholar] [CrossRef]
- Lee, W.; Evans, A.; Williams, D.R. Validation of a Smartphone Application Measuring Motor Function in Parkinson’s Disease. J. Parkinsons Dis. 2016, 6, 371–382. [Google Scholar] [CrossRef]
- Pendt, L.K.; Reuter, I.; Müller, H. Motor skill learning, retention, and control deficits in Parkinson’s disease. PLoS ONE 2011, 6, e21669. [Google Scholar] [CrossRef]
- Lu, T.-C.; Fu, C.-M.; Ma, M.H.-M.; Fang, C.-C.; Turner, A.M. Healthcare Applications of Smart Watches. A Systematic Review. Appl. Clin. Inform. 2016, 7, 850–869. [Google Scholar] [CrossRef]
- Iakovakis, D.; Mastoras, R.E.; Hadjidimitriou, S.; Charisis, V.; Bostanjopoulou, S.; Katsarou, Z.; Klingelhoefer, L.; Reichmann, H.; Trivedi, D.; Chaudhuri, R.K.; et al. Smartwatch-based Activity Analysis During Sleep for Early Parkinson’s Disease Detection. In Proceedings of the Annual International Conference of the IEEE Engineering in Medicine and Biology Society (EMBC), Montreal, QC, Canada, 20–24 July 2020; pp. 4326–4329. [Google Scholar]
- Rigas, G.; Tzallas, A.T.; Tsipouras, M.G.; Bougia, P.; Tripoliti, E.E.; Baga, D.; Fotiadis, D.I.; Tsouli, S.G.; Konitsiotis, S. Assessment of tremor activity in the Parkinson’s disease using a set of wearable sensors. IEEE Trans. Inf. Technol. Biomed. 2012, 16, 478–487. [Google Scholar] [CrossRef] [PubMed]
- Rissanen, S.M.; Kankaanpää, M.; Meigal, A.; Tarvainen, M.P.; Nuutinen, J.; Tarkka, I.M.; Airaksinen, O.; Karjalainen, P.A. Surface EMG and acceleration signals in Parkinson’s disease: Feature extraction and cluster analysis. Med. Biol. Eng. Comput. 2008, 46, 849–858. [Google Scholar] [CrossRef] [PubMed]
- Kostikis, N.; Hristu-Varsakelis, D.; Arnaoutoglou, M.; Kotsavasiloglou, C. Smartphone-based evaluation of parkinsonian hand tremor: Quantitative measurements vs clinical assessment scores. In Proceedings of the Annual International Conference of the IEEE Engineering in Medicine and Biology Society (EMBC), Chicago, IL, USA, 26–30 August 2014; pp. 906–909. [Google Scholar]


| PD | Control | |
|---|---|---|
| (n = 21) | (n = 27) | |
| Male | 8 (38.09) | 9 (33.3) |
| Age, years, mean ± SD | 66.92 ± 9.0 | 57.18 ± 8.9 |
| Height, mean ± SD (m) | 1.66 ± 0.90 | 1.66 ± 0.81 |
| Body Mass (kg) | 71.51 ± 10.85 | 73.22 ± 17.75 |
| MoCA Test, mean ± SD (score) | 25.85 ± 3.3 | 24.74 ± 4.3 |
| SAH | 13 (46.4) | 12 (44.4) |
| DM | 3 (10.7) | 1 (3.7) |
| Time since diagnosis median (min–max), (months) | 72 (4–372) | - |
| MDS-UPDRS III (0–132) median (min–max), (score) | 8 (1−25) | - |
| H&Y modified, frequency (1/1.5/2/2.5/3/4/5) | 11/6/1/2/1/0/0 | - |
| Acceleration | Angular Velocity | |||||||
|---|---|---|---|---|---|---|---|---|
| G-sensor | SmartWatch | r | p | G-Sensor | SmartWatch | r | p | |
| Mean | ||||||||
| x | −0.070 (−0.3 to 0.2) | −0.065 (−2.7 to 0.2) | 0.45 ** | 0.001 | −0.002 (−1.4 to 0.6) | 0.015 (−0.1 to 1.3) | 0.323 ** | 0.02 |
| y | 0.019 (−0.2 to 0.2) | 0.042 (−0.5 to 0.3) | - | - | 0.027 (−1.1 to 0.2) | −0.033 (−1.9 to 0.1) | - | - |
| z | −0.052 (−0.4 to 0.1) | −0.061 (−0.3 to 0.1) | 0.803 *** | 0.000 | −0.0306 (−0.2 to 0.2) | −0.084(−3.4 to 0.1) | 0.782 *** | 0.00 |
| SD | ||||||||
| x | 0.427 (0.2 to 0.5) | 0.505 (0.3 to 2.8) | 0.756 *** | 0.000 | 0.323 (0.2 to 0.) | 0.357 (0.26 to 1.48) | 0.294 * | 0.03 |
| y | 0.341 (0.2 to 0.4) | 0.388 (0.2 to 0.8) | 0.429 ** | 0.001 | 0.337 (−0.2 to 0.2) | 0.390 (0.2 to 2.1) | 0.553 ** | 0.00 |
| z | 0.361 (0.2 to 0.5) | 0.436 (0.2 to 3.7) | 0.627 ** | 0.000 | 0.361 (0.2 to 0.5) | 0.436 (0.2 to 3.7) | 0.608 ** | 0.,00 |
| PSD | ||||||||
| x | 8.833 (5.0 to 17.8) | 9.122 (4.9 to 15.4) | 0.761 *** | 0.000 | 21.855 (12.2 to 42.4) | 20.41 (11.94 to 34.24) | 0.767 *** | 0.00 |
| y | 17.322 (11.6 to 32.7) | 16.046 (11.9 to 27.9) | 0.699 ** | 0.000 | 11.516 (6.86 to 20.4) | 11.452 (6.1 to 18.41) | 0.815 *** | 0.00 |
| z | 13.053 (8.0 to 21.9) | 12.514 (7.98 to 18.47) | 0.802 *** | 0.000 | 11.82 (6.7 to 28.4) | 12.04 (7.7 to 24.1) | 0.717 *** | 0.00 |
| G-sensor | Smart Watch | |||||||
|---|---|---|---|---|---|---|---|---|
| PD | Control | p | Effect Size | PD | Control | p | Effect Size | |
| Mean | ||||||||
| x | −0.0103 (−0.0 to 0.0) | 0.005 (−0.0 to 0.0) | - | - | 0.037 (−0.0–0.1) | −0.007 (−0.0–0.0) | - | - |
| y | 0.030 (−0.0 to 0.0) | 0.024 (−0.0 to 0.0) | - | - | –0.0785 (−0.2–0.0) | 0.012 (−0.0–0.0) | - | - |
| z | −0.0003 (−0.0 to −0.0) * | −0.062 (−0.0 to −0.0) | 0.003 | 0.844 | −0.119 (−0.3–0.1) * | –0.047 (0.0–0.0) | 0.02 | 1.033 |
| SD | ||||||||
| x | 0.331 (0.3 to 0.3) | 0.315 (0.3 to 0.3) | - | - | 0.374 (0.2–0.4) | 0.339 (0.3–0.3) | - | - |
| y | 0.333 (0.3 to 0.3) | 0.341 (0.3 to 0.3) | - | - | 0.411 (0.2–0.5) * | 0.369 (0.3–0.3) | 0.04 | 0.165 |
| z | 0.361 (0.3 to 0.3) | 0.361 (0.3 to 0.3) | - | - | 0.485 (0.2–0.7) | 0.384 (0.3–0.4) | - | - |
| PSD | ||||||||
| x | 23.800 (21.1 to 26.4) * | 19.839 (18.1 to 21) | 0.01 | 0.705 | 22.080 (19.8 to 24.2) * | 18.696 (17.4 to 19.9) | 0.009 | 0.750 |
| y | 12.613 (11.2 to 13.9) * | 10.379 (9.4 to 11.2) | 0.008 | 0.776 | 11.780 (10.7 to 12.7) | 11.112 (10.0 to 12.1) | - | - |
| z | 13.381 (11.1 to 13.3) * | 10.210 (9.3 to 11) | 0.04 | 0.816 | 12.990 (11.2 to 14.7) | 11.068 (10.2 to 11.8) | - | - |
| Time Since Diagnosis | UPDRS III Total | UPDRS III—Rest Tremor | UPDRS III—Action Tremor | 9HPT—Dexterity | |||||||
|---|---|---|---|---|---|---|---|---|---|---|---|
| Acceleration | |||||||||||
| r | p value | r | p value | r | p value | r | p value | r | p value | ||
| Mean | |||||||||||
| x | –0.065 (−2.7 to 0.2) | - | - | - | - | - | |||||
| y | 0.042 (−0.5 to 0.3) | - | - | - | - | - | |||||
| z | –0.061 (−0.3 to 0.1) | - | - | - | - | - | |||||
| SD | |||||||||||
| x | 0.505 (0.3 to 2.8) | - | - | - | - | −0.379 * | 0.047 | ||||
| y | 0.388 (0.2 to 0.8) | - | - | - | - | - | |||||
| z | 0.436 (0.2 to 3.7) | - | - | - | - | - | |||||
| PSD | |||||||||||
| x | 9.122 (4.9 to 15.4) | 0.427 ** | 0.023 | 0.606 *** | 0.001 | 0.455 ** | 0.015 | 0.400 ** | 0.040 | - | |
| y | 16.046 (11.9 to 27.9) | - | - | - | - | - | |||||
| z | 12.514 (7.98 to 18.47) | 0.438 ** | 0.020 | 0.560 ** | 0.002 | - | - | - | |||
| Angular Velocity | |||||||||||
| r | p value | r | p value | r | p value | r | p value | r | p value | ||
| Mean | |||||||||||
| x | 0.015 (−0.1 to 1.3) | - | - | - | - | - | |||||
| y | –0.033 (−1.9 to 0.1) | - | - | 0.425 ** | 0.024 | - | - | ||||
| z | –0.084(−3.4 to 0.1) | –0.390 * | 0.040 | - | - | - | - | ||||
| SD | |||||||||||
| x | 0.357 (0.26 to 1.48) | - | - | –0.373 * | 0.050 | - | - | ||||
| y | 0.390 (0.2 to 2.1) | - | - | - | - | - | |||||
| z | 0.436 (0.2 to 3.7) | - | - | - | - | - | |||||
| PSD | |||||||||||
| x | 20.41 (11.94 to 34.24) | - | - | - | - | - | |||||
| y | 11.452 (6.1 to 18.41) | - | 0.541 ** | 0.003 | - | - | - | ||||
| z | 12.04 (7.7 to 24.1) | - | - | 0.500 ** | 0.007 | - | - | ||||
| AUC | Cutoff Point | Sensitivity | Specificity | |
|---|---|---|---|---|
| PD vs. Control # | 0.705 | 19.35 | 71% | 67% |
| Rest Tremor Φ | 0.711 | 9.07 | 80% | 62% |
| Action Tremor Φ | 0.760 | 6.43 | 96% | 67% |
Disclaimer/Publisher’s Note: The statements, opinions and data contained in all publications are solely those of the individual author(s) and contributor(s) and not of MDPI and/or the editor(s). MDPI and/or the editor(s) disclaim responsibility for any injury to people or property resulting from any ideas, methods, instructions or products referred to in the content. |
© 2025 by the authors. Licensee MDPI, Basel, Switzerland. This article is an open access article distributed under the terms and conditions of the Creative Commons Attribution (CC BY) license (https://creativecommons.org/licenses/by/4.0/).
Share and Cite
Schifino, G.P.; da Cunha, M.J.; Marchese, R.R.; Mabília, V.; Vian, L.H.A.; Pereira, F.d.S.; Cimolin, V.; Pagnussat, A.S. Smart Watch Sensors for Tremor Assessment in Parkinson’s Disease—Algorithm Development and Measurement Properties Analysis. Sensors 2025, 25, 4313. https://doi.org/10.3390/s25144313
Schifino GP, da Cunha MJ, Marchese RR, Mabília V, Vian LHA, Pereira FdS, Cimolin V, Pagnussat AS. Smart Watch Sensors for Tremor Assessment in Parkinson’s Disease—Algorithm Development and Measurement Properties Analysis. Sensors. 2025; 25(14):4313. https://doi.org/10.3390/s25144313
Chicago/Turabian StyleSchifino, Giulia Palermo, Maira Jaqueline da Cunha, Ritchele Redivo Marchese, Vinicius Mabília, Luis Henrique Amoedo Vian, Francisca dos Santos Pereira, Veronica Cimolin, and Aline Souza Pagnussat. 2025. "Smart Watch Sensors for Tremor Assessment in Parkinson’s Disease—Algorithm Development and Measurement Properties Analysis" Sensors 25, no. 14: 4313. https://doi.org/10.3390/s25144313
APA StyleSchifino, G. P., da Cunha, M. J., Marchese, R. R., Mabília, V., Vian, L. H. A., Pereira, F. d. S., Cimolin, V., & Pagnussat, A. S. (2025). Smart Watch Sensors for Tremor Assessment in Parkinson’s Disease—Algorithm Development and Measurement Properties Analysis. Sensors, 25(14), 4313. https://doi.org/10.3390/s25144313