

Toward a User-Accessible Spectroscopic Sensing Platform for Beverage Recognition Through K-Nearest Neighbors Algorithm


Abstract

1. Introduction
2. Materials and Methods
2.1. Beverages Analyzed
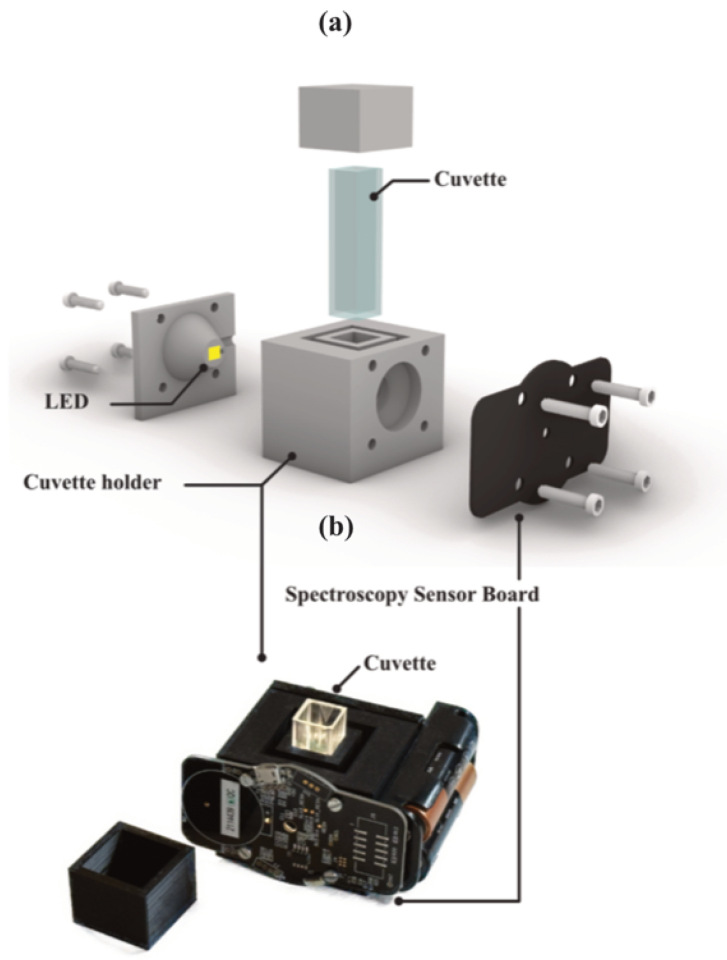
2.2. System Setup
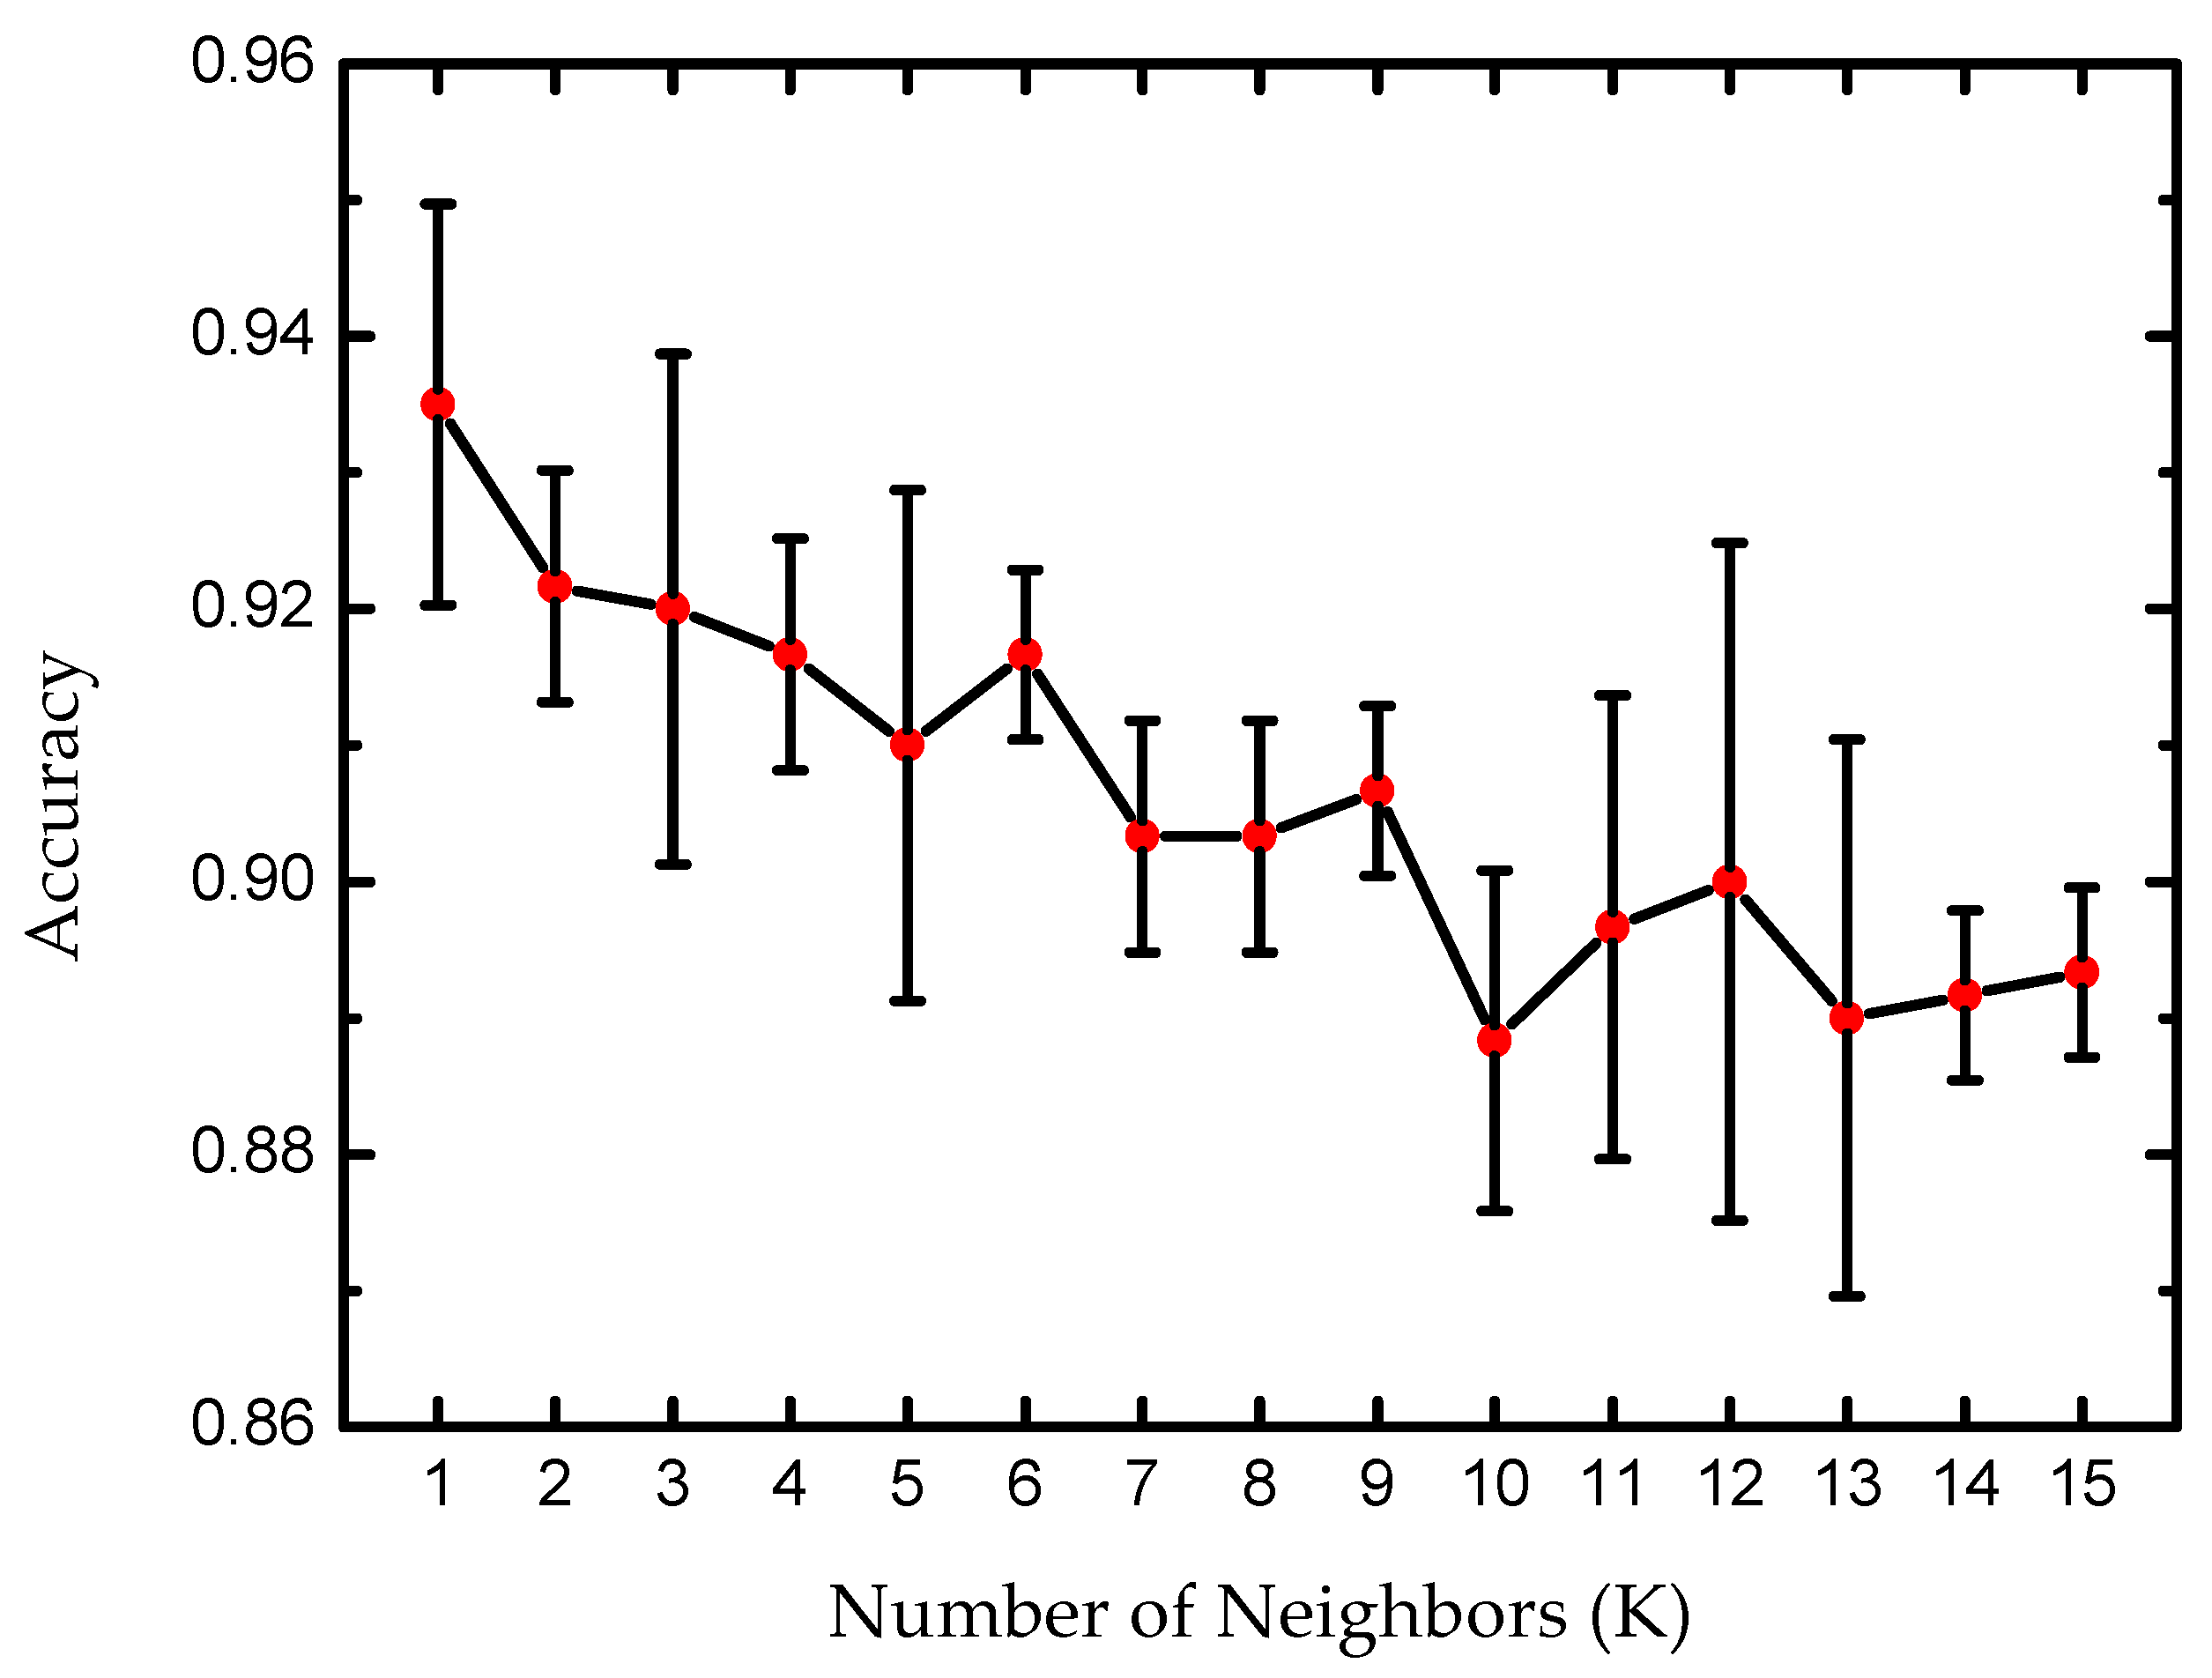
2.3. KNN Algorithm
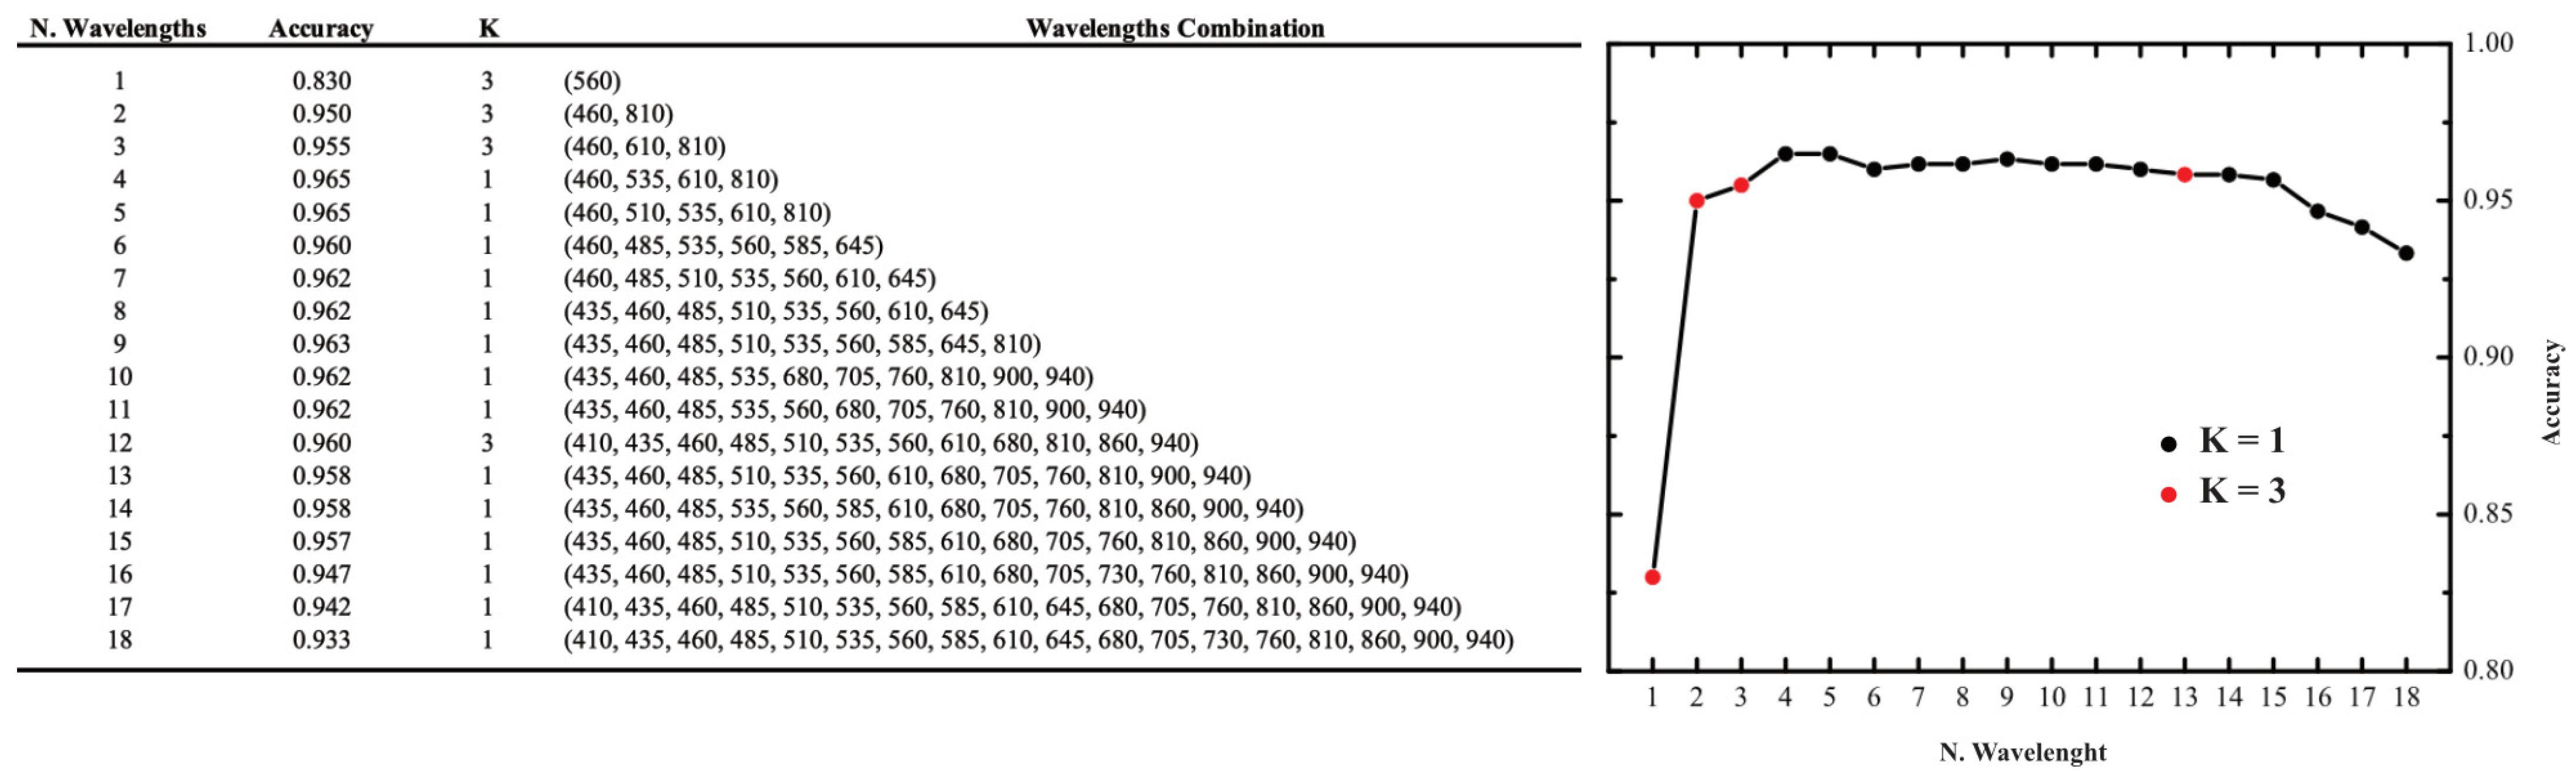
3. Results and Discussion
4. Conclusions
Supplementary Materials
Author Contributions
Funding
Institutional Review Board Statement
Informed Consent Statement
Data Availability Statement
Acknowledgments
Conflicts of Interest
Abbreviations
| IoT | Internet of Things |
| CRI | Color Rendering Index |
| KNN | K-nearest neighbors |
| PMMA | Poly(methyl methacrylate) |
References
- Khot, R.A.; Mueller, F. Human-Food Interaction. Found. Trends® Hum.–Comput. Interact. 2019, 12, 238–415. [Google Scholar] [CrossRef]
- Peuhkuri, K.; Sihvola, N.; Korpela, R. Diet Promotes Sleep Duration and Quality. Nutr. Res. 2012, 32, 309–319. [Google Scholar] [CrossRef] [PubMed]
- St-Onge, M.P.; Mikic, A.; Pietrolungo, C.E. Effects of Diet on Sleep Quality. Adv. Nutr. 2016, 7, 938–949. [Google Scholar] [CrossRef]
- Bellisle, F. Effects of Diet on Behaviour and Cognition in Children. Br. J. Nutr. 2004, 92 (Suppl. S2), S227–S232. [Google Scholar] [CrossRef]
- Block, G.; Azar, K.M.J.; Romanelli, R.J.; Block, T.J.; Palaniappan, L.P.; Dolginsky, M.; Block, C.H. Improving Diet, Activity and Wellness in Adults at Risk of Diabetes: Randomized Controlled Trial. Nutr. Diabetes 2016, 6, e231. [Google Scholar] [CrossRef]
- Karlsson, J.; Hallgren, P.; Kral, J.; Lindroos, A.-K.; Sjöström, L.; Sullivan, M. Predictors and Effects of Long-Term Dieting on Mental Well-Being and Weight Loss in Obese Women. Appetite 1994, 23, 15–26. [Google Scholar] [CrossRef]
- Kontogianni, M.D.; Vijayakumar, A.; Rooney, C.; Noad, R.L.; Appleton, K.M.; McCarthy, D.; Donnelly, M.; Young, I.S.; McKinley, M.C.; McKeown, P.P.; et al. A High Polyphenol Diet Improves Psychological Well-Being: The Polyphenol Intervention Trial (PPhIT). Nutrients 2020, 12, 2445. [Google Scholar] [CrossRef]
- Esteban-Gonzalo, L.; Turner, A.I.; Torres, S.J.; Esteban-Cornejo, I.; Castro-Piñero, J.; Delgado-Alfonso, Á.; Marcos, A.; Gómez-Martínez, S.; Veiga, Ó.L. Diet Quality and Well-Being in Children and Adolescents: The UP&DOWN Longitudinal Study. Br. J. Nutr. 2018, 121, 221–231. [Google Scholar] [CrossRef]
- Katz, D.L.; Meller, S. Can We Say What Diet Is Best for Health? Annu. Rev. Public Health 2014, 35, 83–103. [Google Scholar] [CrossRef]
- Chapman, K. Can People Make Healthy Changes to Their Diet and Maintain Them in the Long Term? A Review of the Evidence. Appetite 2010, 54, 433–441. [Google Scholar] [CrossRef]
- de Ridder, D.; Kroese, F.; Evers, C.; Adriaanse, M.; Gillebaart, M. Healthy Diet: Health Impact, Prevalence, Correlates, and Interventions. Psychol. Health 2017, 32, 907–941. [Google Scholar] [CrossRef] [PubMed]
- Tan, M.; He, F.J.; MacGregor, G.A. Obesity and COVID-19: The Role of the Food Industry. BMJ 2020, 369, m2237. [Google Scholar] [CrossRef] [PubMed]
- Pahuja, V.; Sanghvi, S. Childhood Obesity in South Asian Population. Obes. Pillars 2024, 12, 100148. [Google Scholar] [CrossRef]
- Welsh, A.; Hammad, M.; Piña, I.L.; Kulinski, J. Obesity and Cardiovascular Health. Eur. J. Prev. Cardiol. 2024, 31, 1026–1035. [Google Scholar] [CrossRef]
- Agha, M.; Agha, R. The Rising Prevalence of Obesity: Part A: Impact on Public Health. Int. J. Surg. Oncol. 2017, 2, e17. [Google Scholar] [CrossRef]
- Burke, L.E.; Warziski, M.; Starrett, T.; Choo, J.; Music, E.; Sereika, S.; Stark, S.; Sevick, M.A. Self-Monitoring Dietary Intake: Current and Future Practices. J. Ren. Nutr. 2005, 15, 281–290. [Google Scholar] [CrossRef]
- Li, C.; Wang, J.; Wang, S.; Zhang, Y. A Review of IoT Applications in Healthcare. Neurocomputing 2024, 565, 127017. [Google Scholar] [CrossRef]
- Maiolo, L.; Maita, F.; Castiello, A.; Minotti, A.; Pecora, A. Highly Wearable Wireless Wristband for Monitoring Pilot Cardiac Activity and Muscle Fine Movements. In Proceedings of the 2017 IEEE International Workshop on Metrology for AeroSpace (MetroAeroSpace), Padua, Italy, 21–23 June 2017; pp. 271–275. [Google Scholar]
- Ferrone, A.; Maita, F.; Maiolo, L.; Arquilla, M.; Castiello, A.; Pecora, A.; Jiang, X.; Menon, C.; Ferrone, A.; Colace, L. Wearable Band for Hand Gesture Recognition Based on Strain Sensors. In Proceedings of the 2016 6th IEEE International Conference on Biomedical Robotics and Biomechatronics (BioRob), Singapore, 26–29 June 2016; pp. 1319–1322. [Google Scholar]
- Hutchesson, M.J.; Rollo, M.E.; Callister, R.; Collins, C.E. Self-Monitoring of Dietary Intake by Young Women: Online Food Records Completed on Computer or Smartphone are as Accurate as Paper-Based Food Records but More Acceptable. J. Acad. Nutr. Diet. 2015, 115, 87–94. [Google Scholar] [CrossRef]
- Päßler, S.; Wolff, M.; Fischer, W.-J. Food Intake Monitoring: An Acoustical Approach to Automated Food Intake Activity Detection and Classification of Consumed Food. Physiol. Meas. 2012, 33, 1073–1093. [Google Scholar] [CrossRef]
- Dalakleidi, K.V.; Papadelli, M.; Kapolos, I.; Papadimitriou, K. Applying Image-Based Food-Recognition Systems on Dietary Assessment: A Systematic Review. Adv. Nutr. 2022, 13, 2590–2619. [Google Scholar] [CrossRef]
- Rateni, G.; Dario, P.; Cavallo, F. Smartphone-Based Food Diagnostic Technologies: A Review. Sensors 2017, 17, 1453. [Google Scholar] [CrossRef] [PubMed]
- Ma, T.; Wang, H.; Wei, M.; Lan, T.; Wang, J.; Bao, S.; Ge, Q.; Fang, Y.; Sun, X. Application of Smart-Phone Use in Rapid Food Detection, Food Traceability Systems, and Personalized Diet Guidance, Making Our Diet More Health. Food Res. Int. 2022, 152, 110918. [Google Scholar] [CrossRef] [PubMed]
- Resende Silva, B.V.; Cui, J. A Survey on Automated Food Monitoring and Dietary Management Systems. J. Health Med. Inform. 2017, 8, 272. [Google Scholar] [CrossRef]
- Ams OSRAM. Available online: https://ams-osram.com/ (accessed on 14 March 2025).
- Suyal, M.; Goyal, P. A Review on Analysis of K-Nearest Neighbor Classification Machine Learning Algorithms Based on Supervised Learning. Int. J. Eng. Trends Technol. 2022, 70, 43–48. [Google Scholar] [CrossRef]
- Zhang, S.; Li, X.; Zong, M.; Zhu, X.; Wang, R. Efficient KNN Classification with Different Numbers of Nearest Neighbors. IEEE Trans. Neural Netw. Learn. Syst. 2018, 29, 1774–1785. [Google Scholar] [CrossRef]
- Shi, Y.; Yang, K.; Yang, Z.; Zhou, Y. Primer on Artificial Intelligence. In Mobile Edge Artificial Intelligence; Academic Press: Cambridge, MA, USA, 2022; pp. 7–36. [Google Scholar] [CrossRef]
- Guo, G.; Wang, H.; Bell, D.; Bi, Y.; Greer, K. KNN Model-Based Approach in Classification. In On the Move to Meaningful Internet Systems 2003: CoopIS, DOA, and ODBASE; Lecture Notes in Computer Science (including subseries Lecture Notes in Artificial Intelligence and Lecture Notes in Bioinformatics); Springer: Berlin/Heidelberg, Germany, 2003; Volume 2888, pp. 986–996. [Google Scholar] [CrossRef]
- Nti, I.K.; Nyarko-Boateng, O.; Aning, J. Performance of Machine Learning Algorithms with Different K Values in K-Fold CrossValidation. Int. J. Inf. Technol. Comput. Sci. 2021, 13, 61–71. [Google Scholar] [CrossRef]
- Steege, F.F.; Stephan, V.; Groß, H.M. The ‘K’ in K-Fold Cross Validation. In Proceedings of the European Symposium on Artificial Neural Networks, Computational Intelligence and Machine Learning, Bruges, Belgium, 25–27 April 2012; pp. 441–446. [Google Scholar]
- Wong, T.T.; Yeh, P.Y. Reliable Accuracy Estimates from K-Fold Cross Validation. IEEE Trans. Knowl. Data Eng. 2020, 32, 1586–1594. [Google Scholar] [CrossRef]
- Rodríguez, J.D.; Pérez, A.; Lozano, J.A. Sensitivity Analysis of K-Fold Cross Validation in Prediction Error Estimation. IEEE Trans. Pattern Anal. Mach. Intell. 2010, 32, 569–575. [Google Scholar] [CrossRef]
- Marcot, B.G.; Hanea, A.M. What Is an Optimal Value of k in K-Fold Cross-Validation in Discrete Bayesian Network Analysis? Comput. Stat. 2021, 36, 2009–2031. [Google Scholar] [CrossRef]
- Aluker, N.L.; Herrmann, M.; Suzdaltseva, J.M. Water Spectrophotometry in the UV and Visible Range as an Element of Water-Resource Ecoanalytics. Instrum. Exp. Tech. 2020, 63, 853–859. [Google Scholar] [CrossRef]


| Beverage Category | Beverage Type |
|---|---|
| Water | Still Water, Sparkling Water |
| Animal based Milk | Cow Milk |
| Plant based Milk | Oats Milk, Almond Milk |
| Soft Drink | Coca-Cola®, Coca-Cola Zero Sugar®, Pepsi®, |
| Schweppes®, Lemon Cold Tea, Peach Cold Tea | |
| Alcoholic Drink | Beer, White Wine, Red Wine |
| Energy Drink | Monster Energy®, Red bull® |
| Sport Drink | Gatorade®, Powerade® |
| Brewed Drink | Coffee |
Disclaimer/Publisher’s Note: The statements, opinions and data contained in all publications are solely those of the individual author(s) and contributor(s) and not of MDPI and/or the editor(s). MDPI and/or the editor(s) disclaim responsibility for any injury to people or property resulting from any ideas, methods, instructions or products referred to in the content. |
© 2025 by the authors. Licensee MDPI, Basel, Switzerland. This article is an open access article distributed under the terms and conditions of the Creative Commons Attribution (CC BY) license (https://creativecommons.org/licenses/by/4.0/).
Share and Cite
Montaina, L.; Palmieri, E.; Lucarini, I.; Maiolo, L.; Maita, F. Toward a User-Accessible Spectroscopic Sensing Platform for Beverage Recognition Through K-Nearest Neighbors Algorithm. Sensors 2025, 25, 4264. https://doi.org/10.3390/s25144264
Montaina L, Palmieri E, Lucarini I, Maiolo L, Maita F. Toward a User-Accessible Spectroscopic Sensing Platform for Beverage Recognition Through K-Nearest Neighbors Algorithm. Sensors. 2025; 25(14):4264. https://doi.org/10.3390/s25144264
Chicago/Turabian StyleMontaina, Luca, Elena Palmieri, Ivano Lucarini, Luca Maiolo, and Francesco Maita. 2025. "Toward a User-Accessible Spectroscopic Sensing Platform for Beverage Recognition Through K-Nearest Neighbors Algorithm" Sensors 25, no. 14: 4264. https://doi.org/10.3390/s25144264
APA StyleMontaina, L., Palmieri, E., Lucarini, I., Maiolo, L., & Maita, F. (2025). Toward a User-Accessible Spectroscopic Sensing Platform for Beverage Recognition Through K-Nearest Neighbors Algorithm. Sensors, 25(14), 4264. https://doi.org/10.3390/s25144264