

A Passive Ladder-Shaped FBG Sensor Network with Fault Detection Using Time- and Wavelength-Division Multiplexing

Abstract
1. Introduction
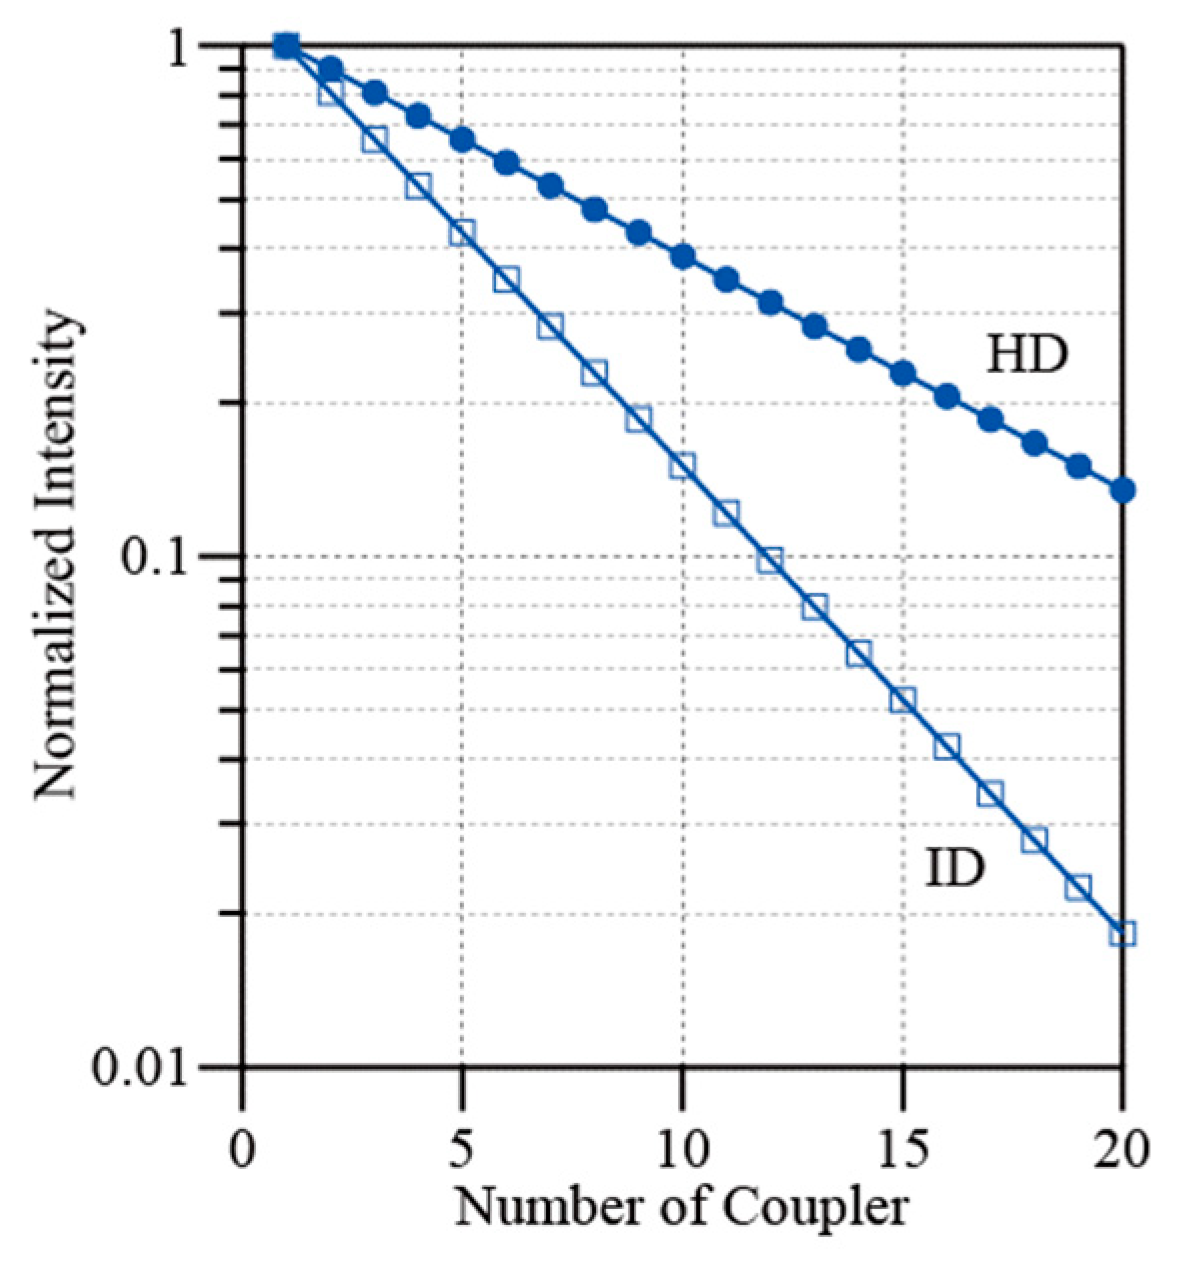
2. Heterodyne Detection
3. Experimental
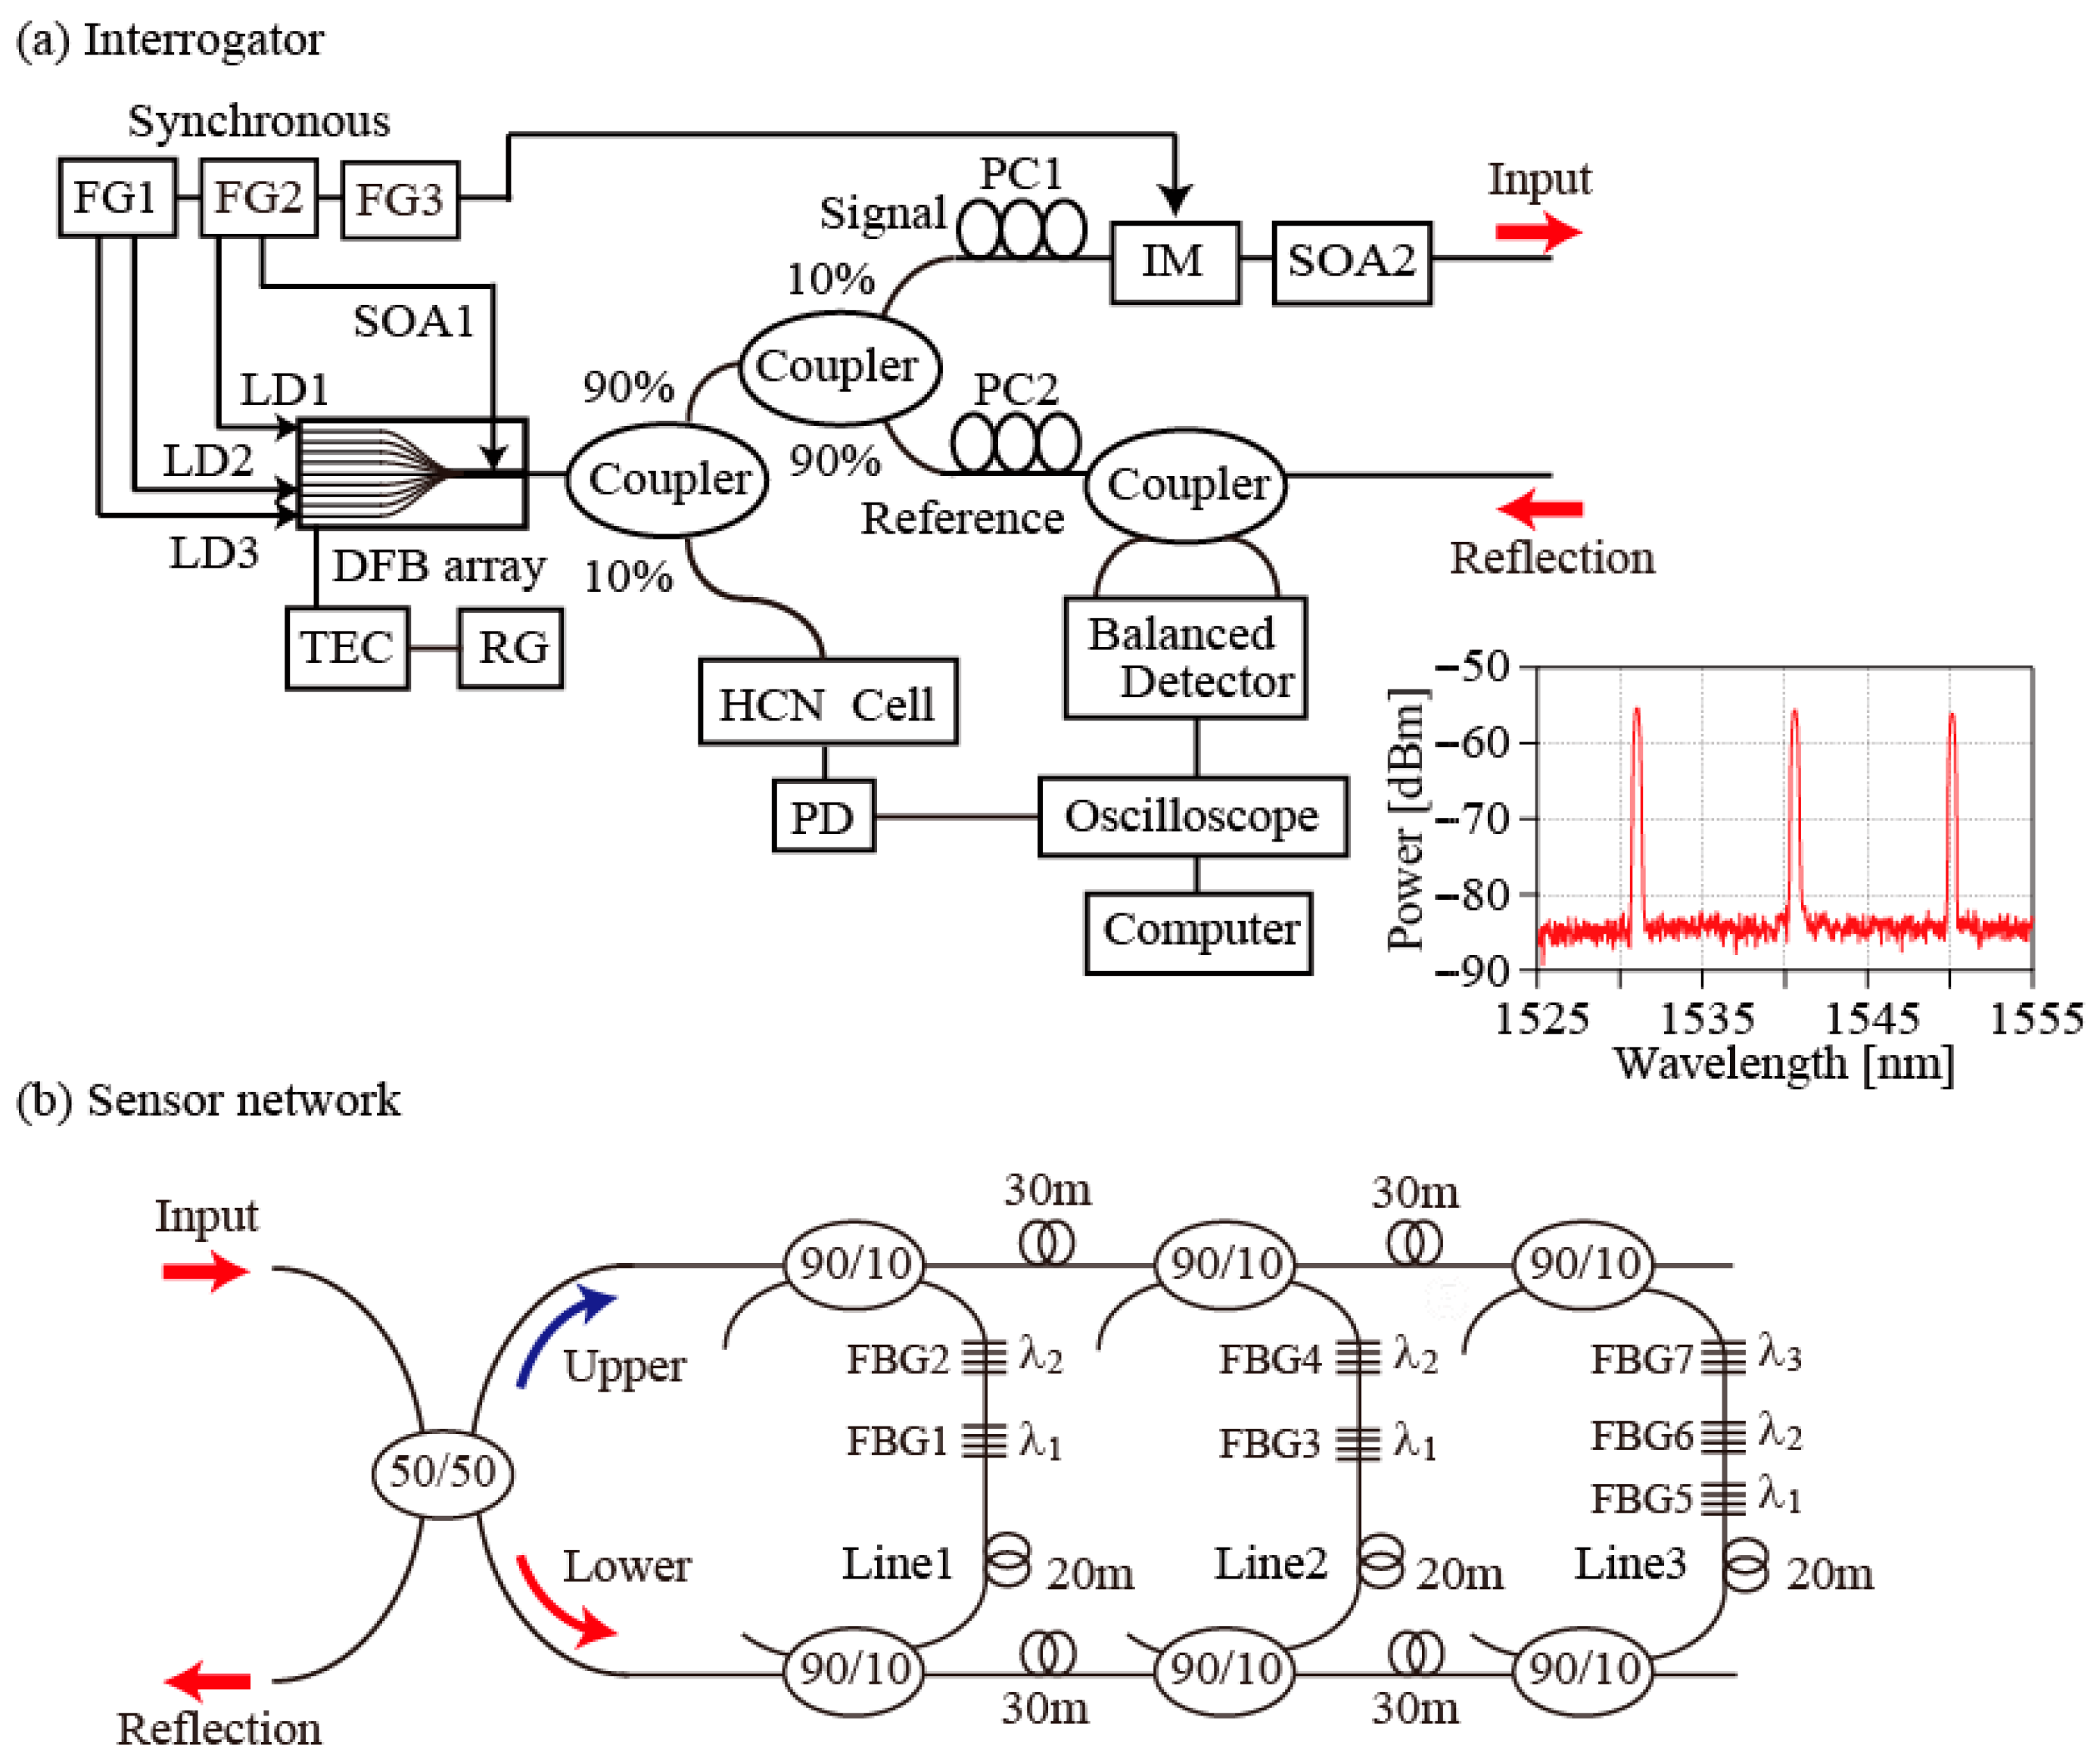
3.1. Interrogator
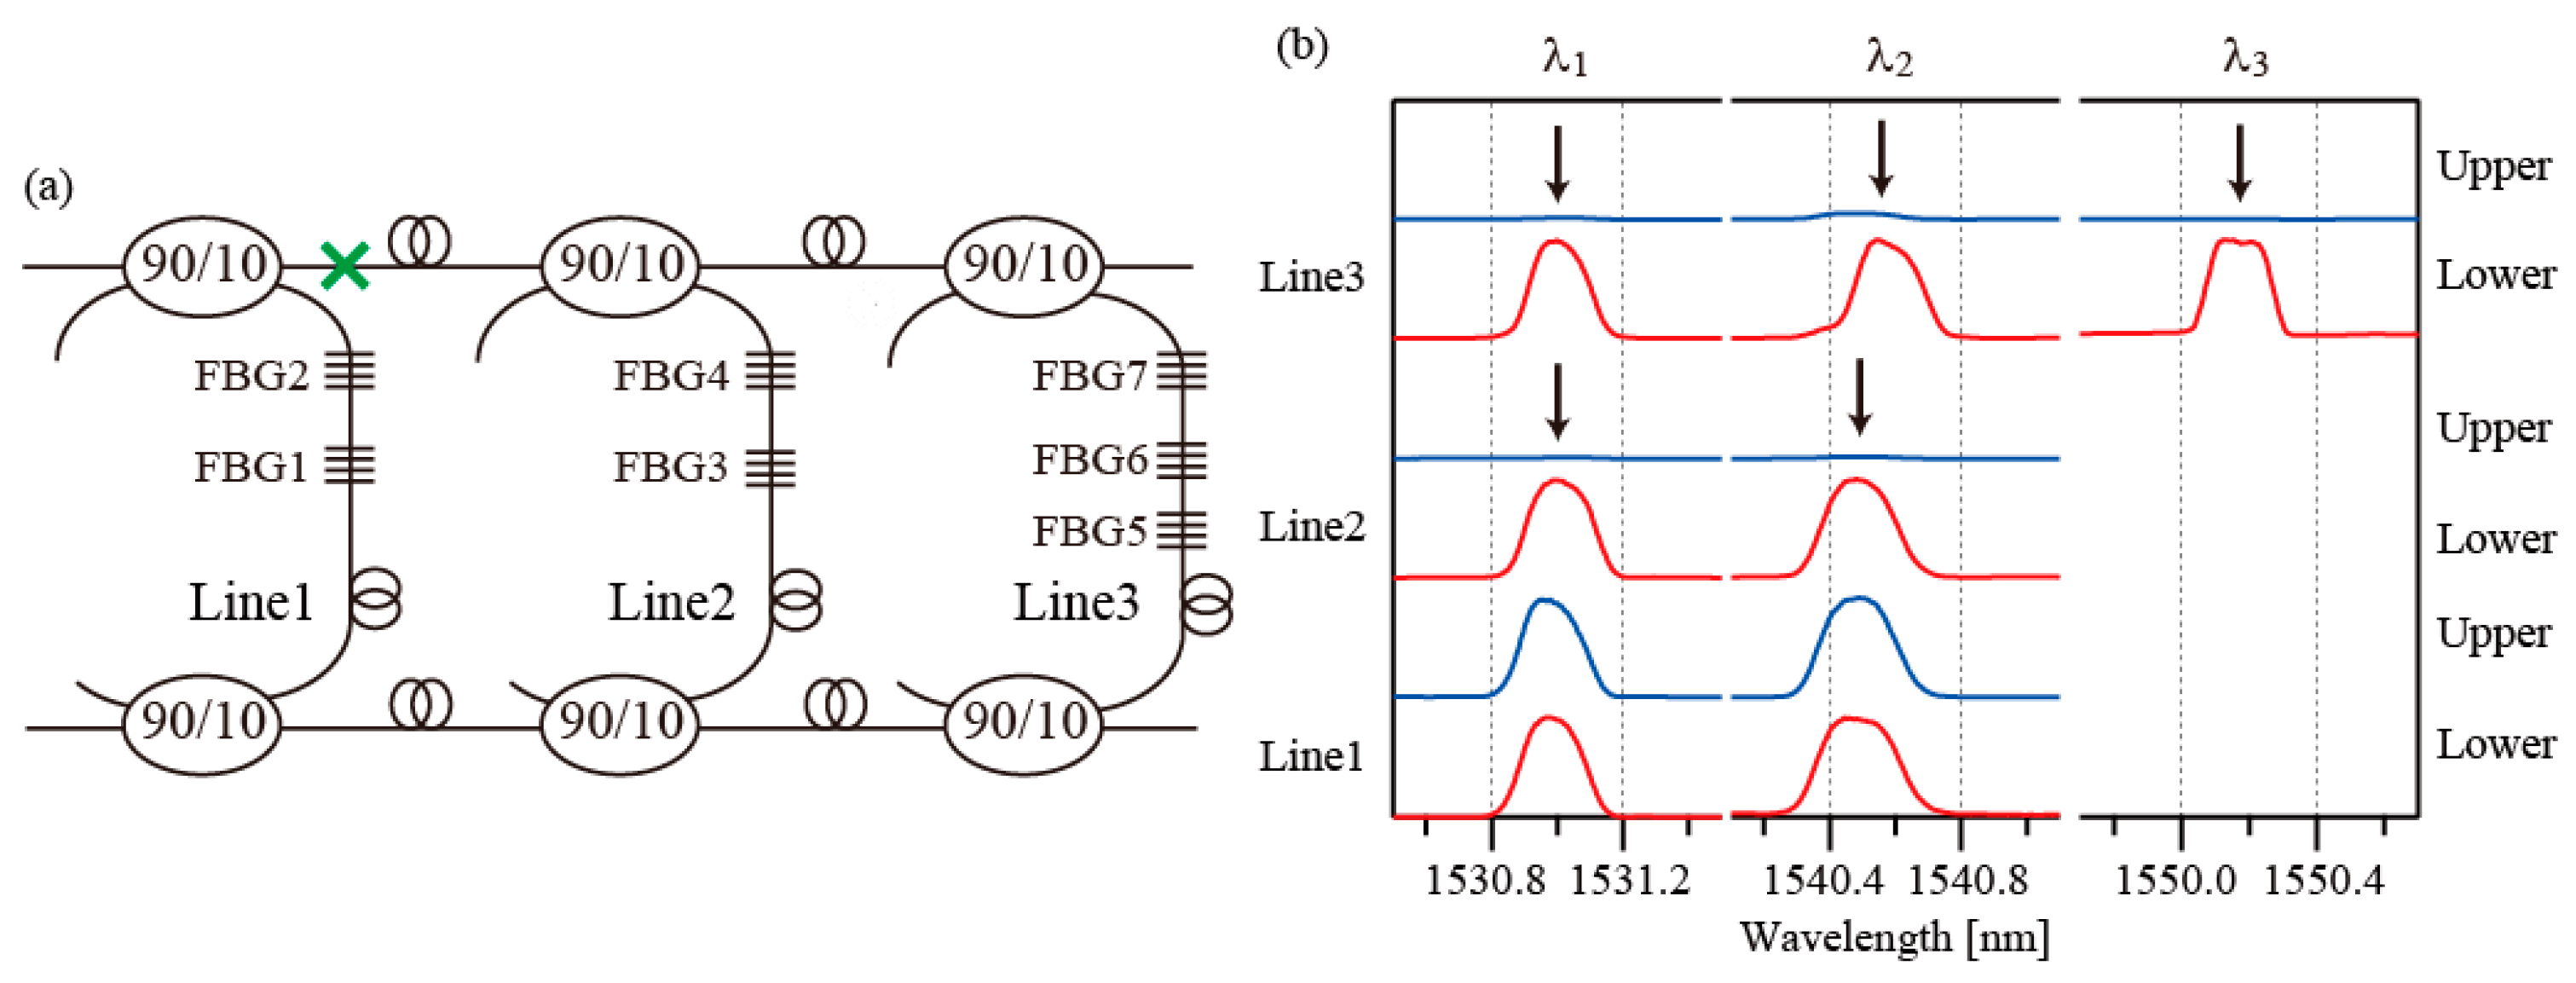
3.2. Sensor Network
3.3. Voltages Applied to the Devices
4. Results
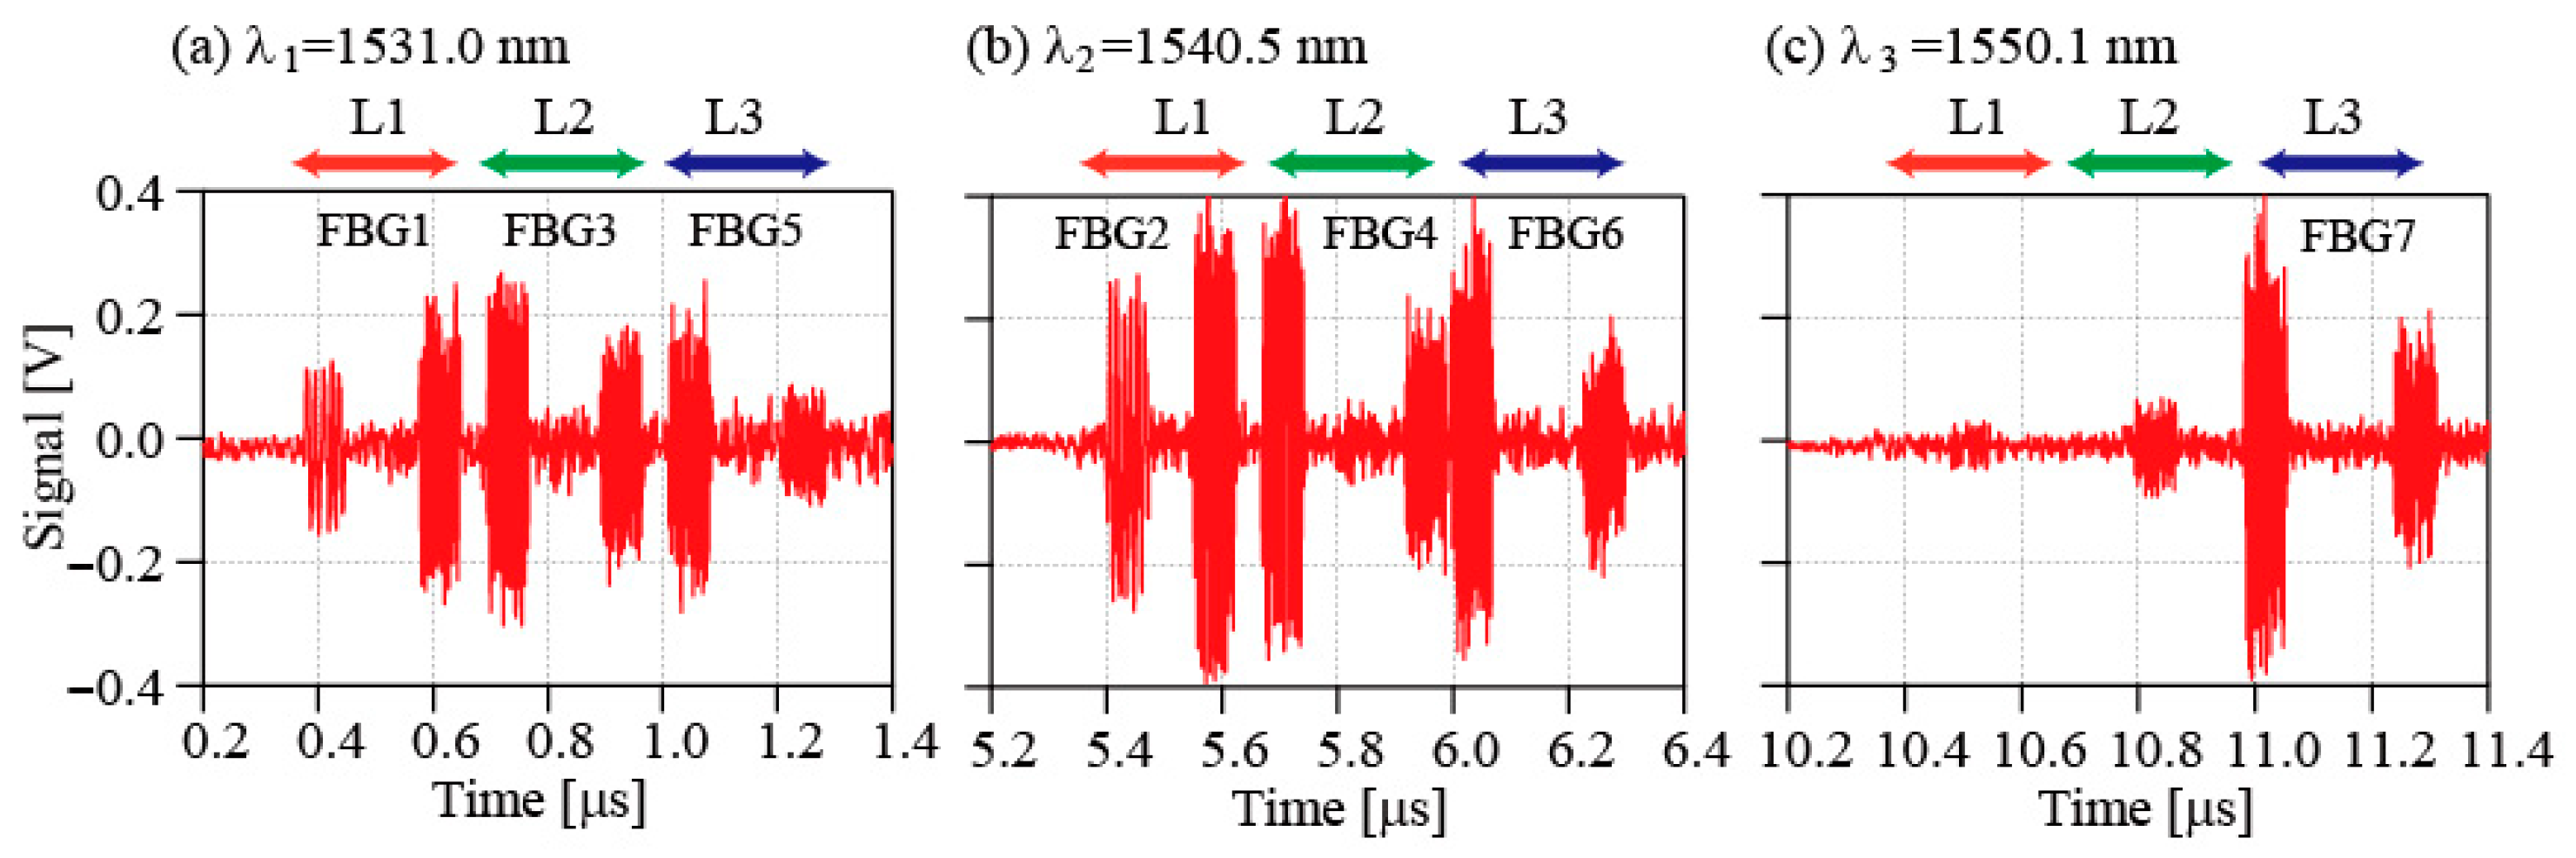
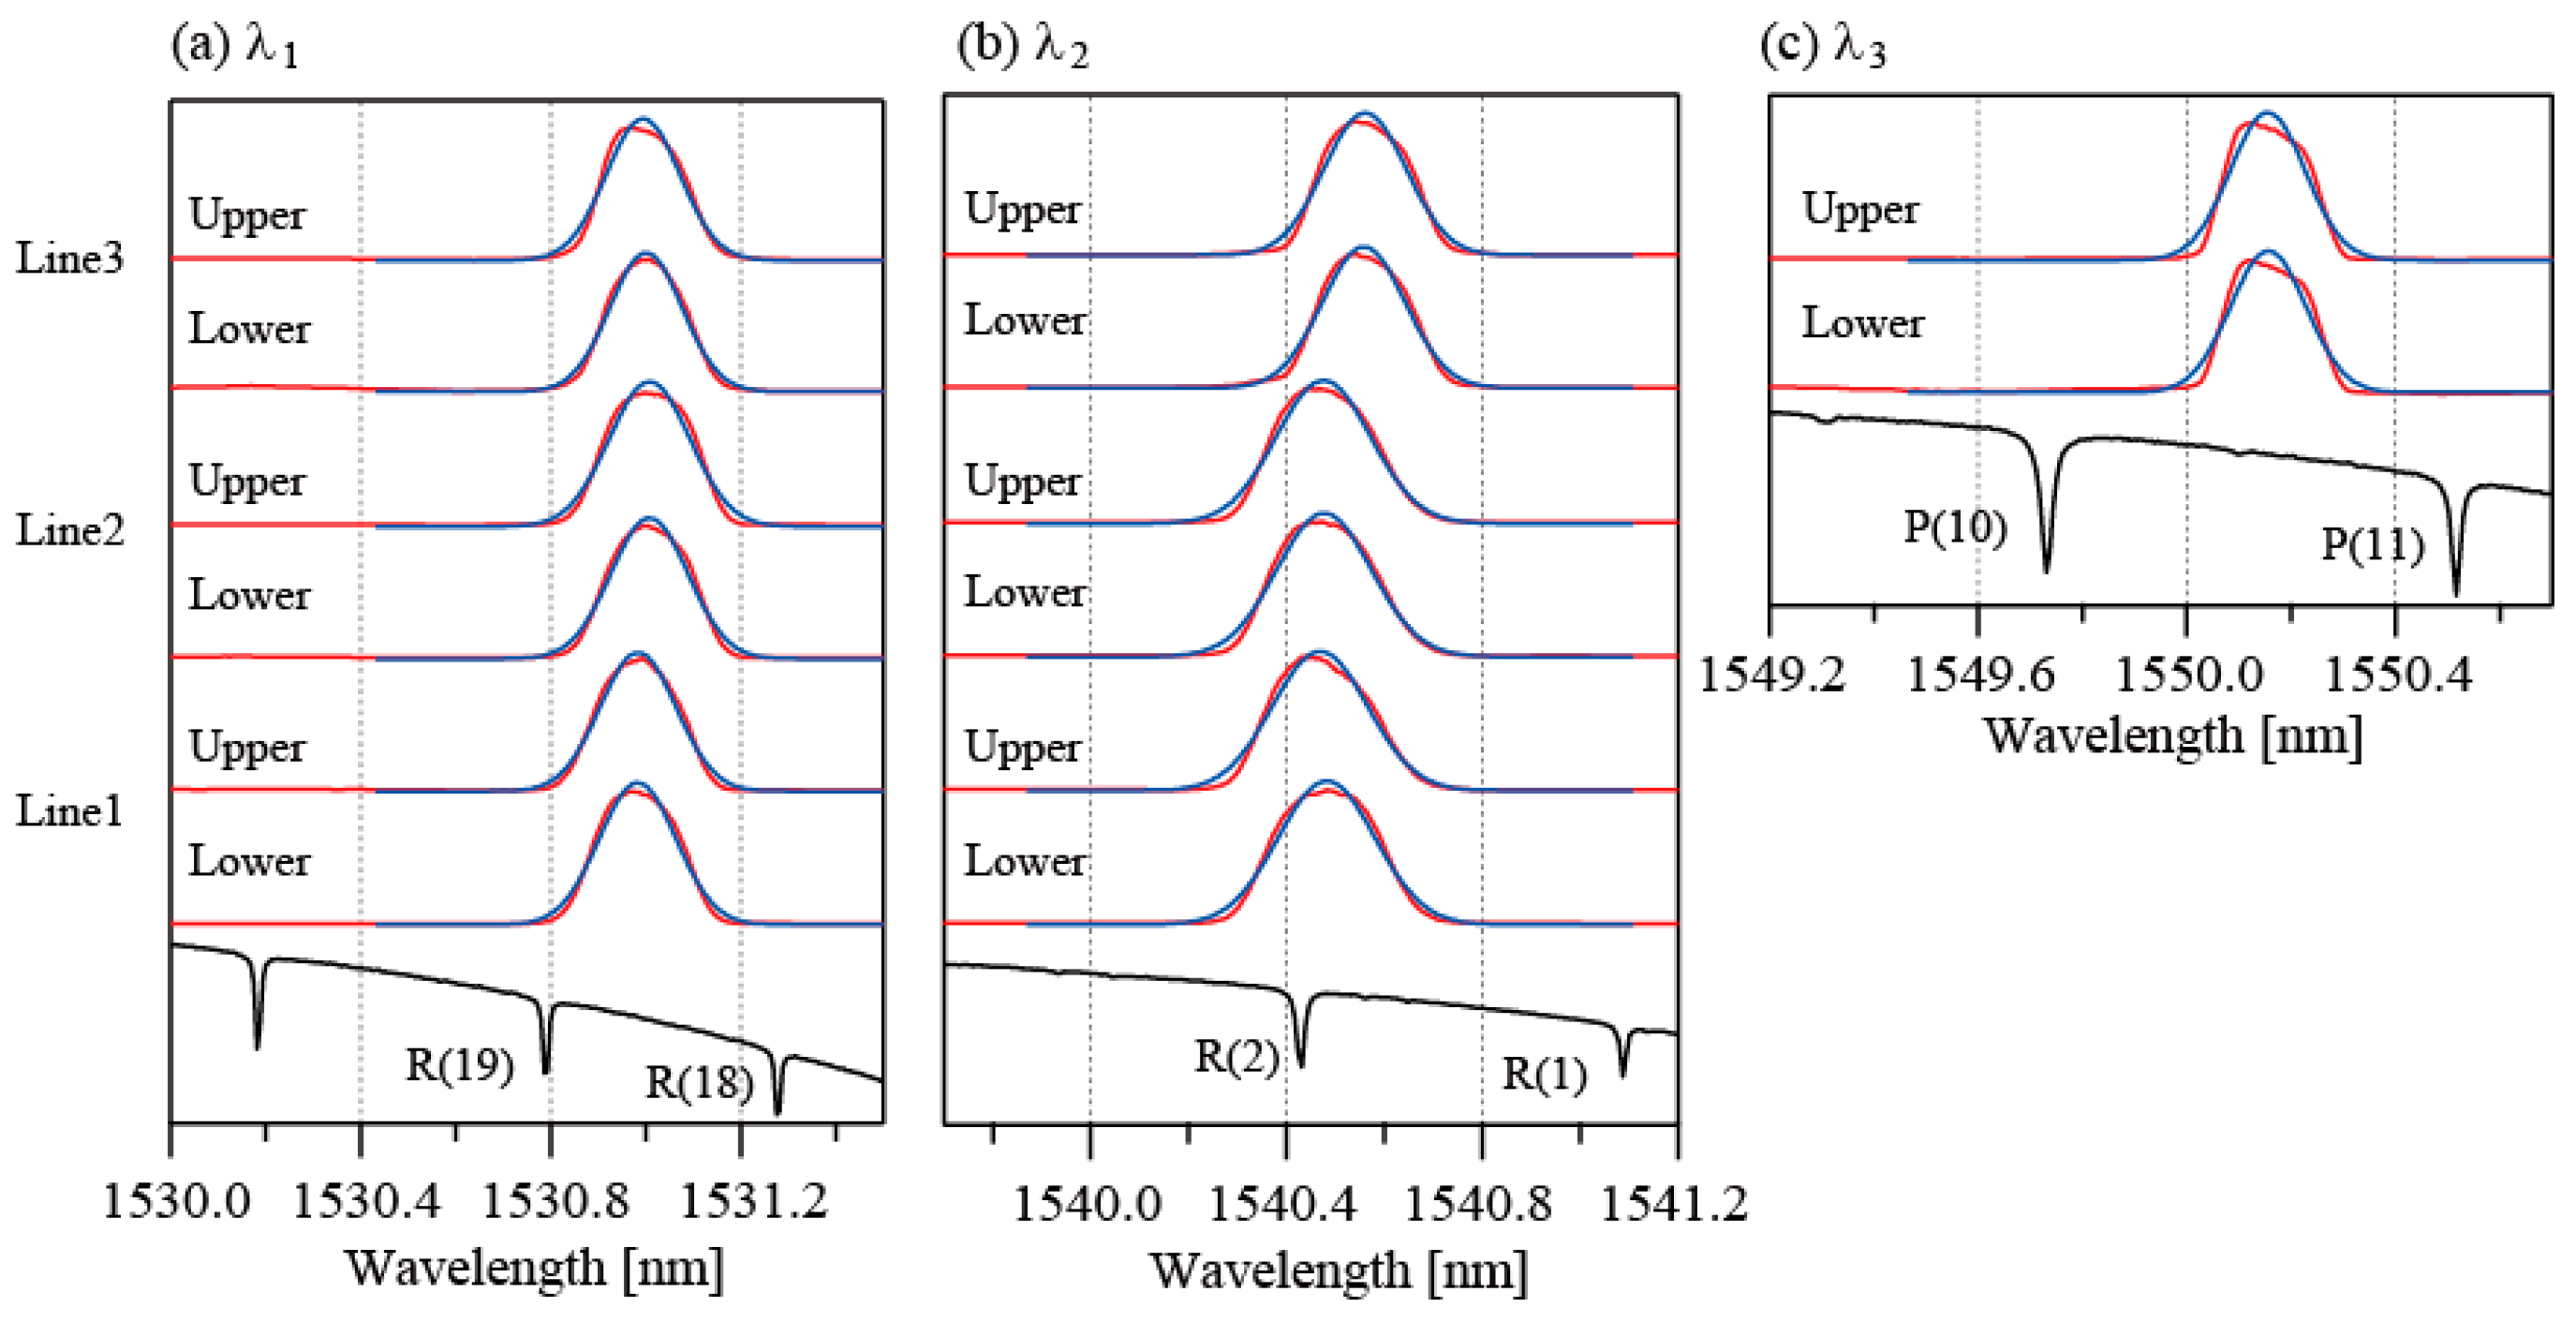
4.1. No Fault Case
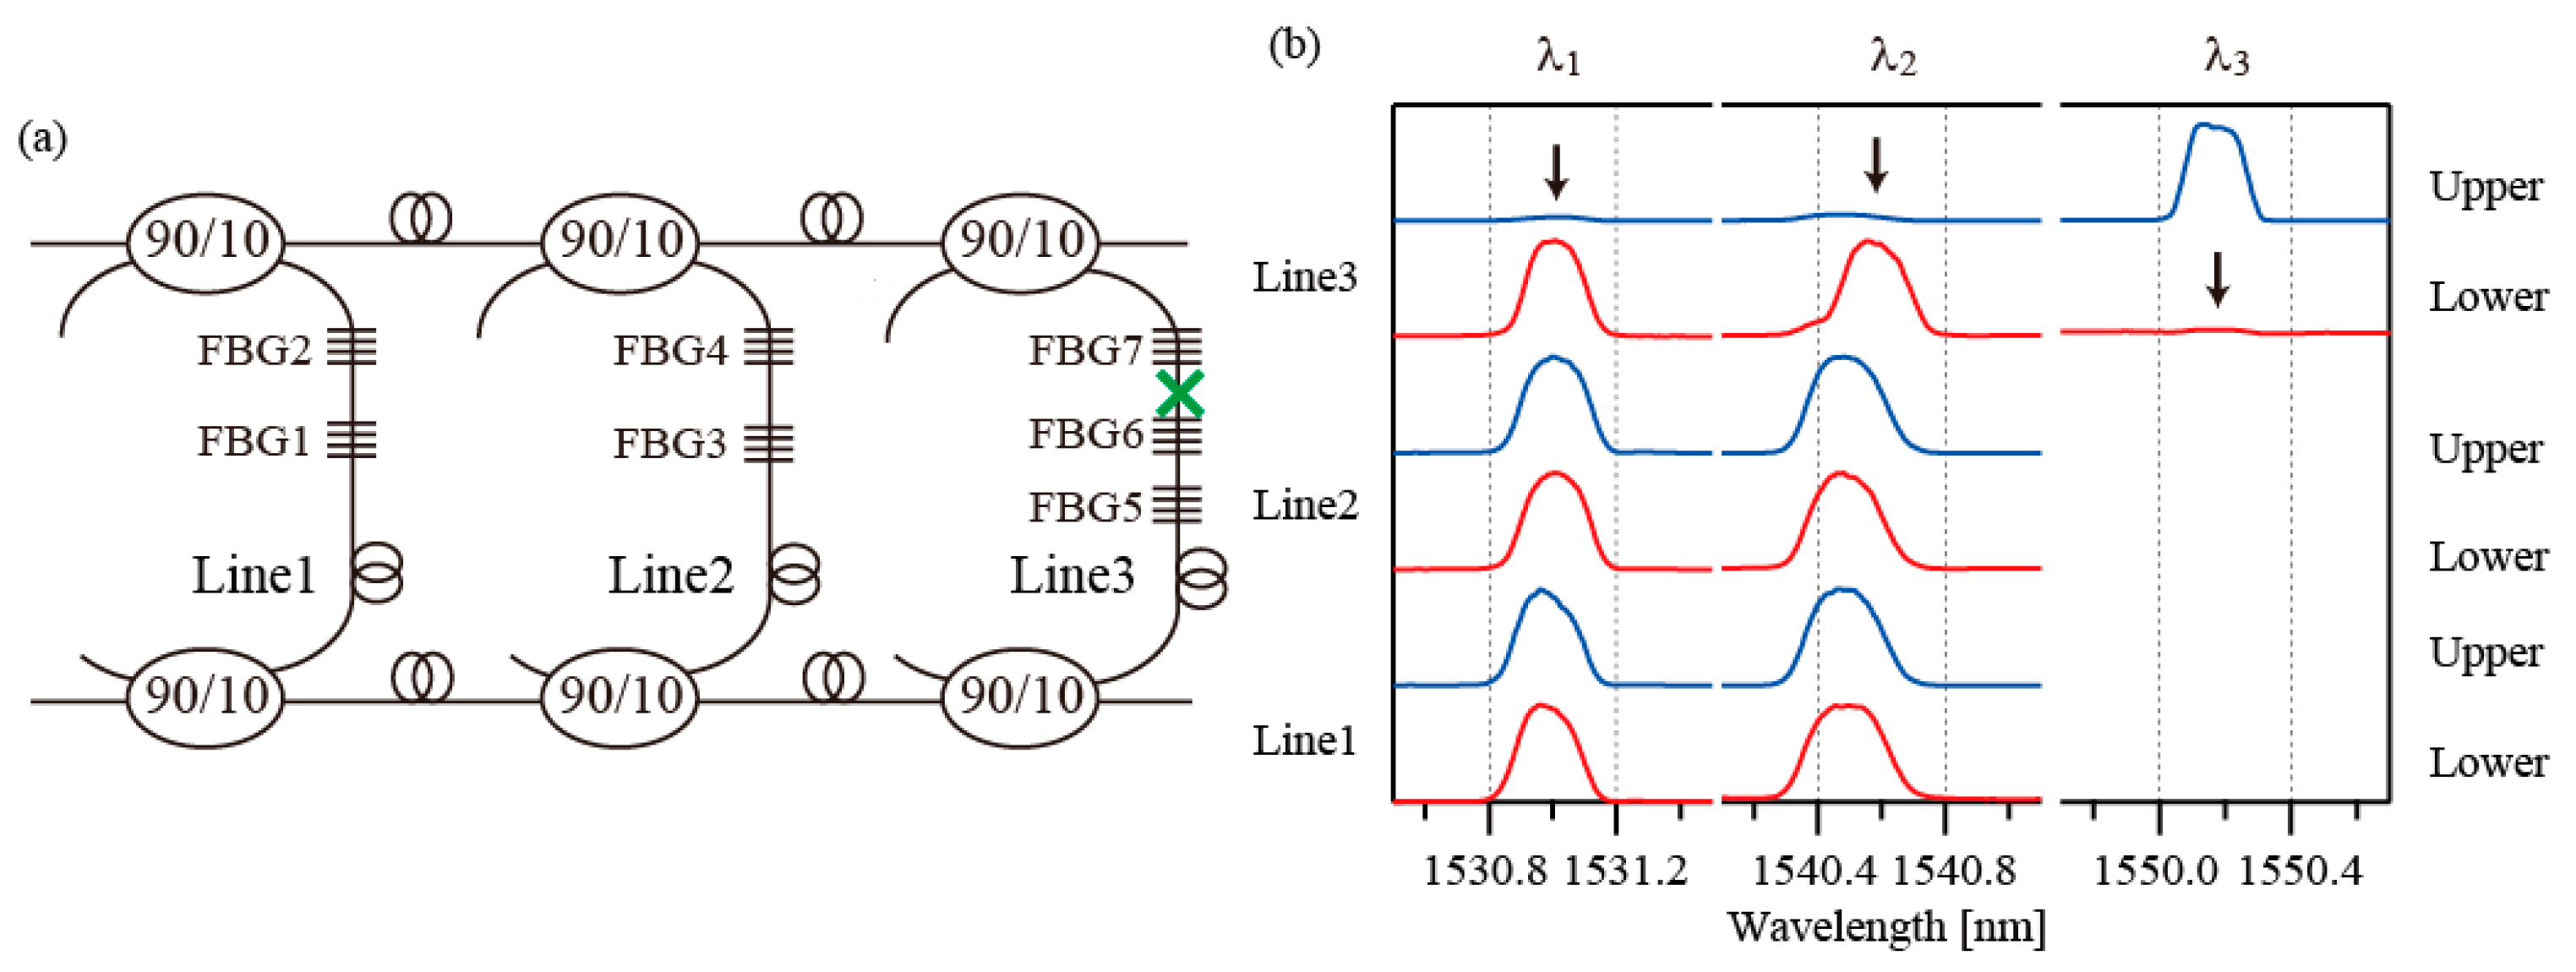
4.2. Fault Detection
5. Discussion
6. Conclusions
Funding
Institutional Review Board Statement
Informed Consent Statement
Data Availability Statement
Acknowledgments
Conflicts of Interest
Abbreviations
| DFB-LD | Distributed feedback laser |
| FBG | Fiber Bragg grating |
| TDM | Time-division multiplexing |
| WDM | Wavelength-division multiplexing |
| OSA | Optical spectrum analyzer |
| HD | Heterodyne detection |
| ID | Intensity detection |
| BD | Balanced detector |
| SOA | Semiconductor optical amplifier |
| PD | Photodetector |
| IM | Intensity modulator |
| FG | Function generator |
| PC | Polarization controller |
| SNR | Signal-to-noise ratio |
| EDF | Erbium-doped fiber |
| WDMD | Wavelength-division multiplexed demodulator |
| OTDV | Optical time-division visualizer |
References
- Lloyd, G.D.; Everall, L.A.; Sugden, K.; Bennion, I. Resonant cavity time-division-multiplexed fiber Bragg grating sensor interrogator. IEEE Photon. Technol. Lett. 2004, 16, 2323–2325. [Google Scholar]
- Wang, Y.; Gong, J.; Wang, D.Y.; Dong, B.; Bi, W.; Wang, A. A Quasi-Distributed Sensing Network With Time-Division-Multiplexed Fiber Bragg Gratings. IEEE Photon. Technol. Lett. 2011, 23, 70–72. [Google Scholar]
- Zhang, M.; Sun, Q.; Wang, Z.; Li, X.; Liu, H.; Liu, D. A large capacity sensing network with identical weak fiber Bragg gratings multiplexing. Opt. Commun. 2012, 285, 3082–3087. [Google Scholar]
- Peng, P.-C.; Tseng, H.-Y.; Chi, S. Long-Distance FBG Sensor System Using a Linear-Cavity Fiber Raman Laser Scheme. IEEE Photon. Technol. Lett. 2004, 16, 575–577. [Google Scholar]
- Darwich, D.; Youssef, A.; Zaraket, H. Low-cost multiple FBG interrogation technique for static applications. Opt. Lett. 2020, 45, 1116–1119. [Google Scholar] [PubMed]
- Margulis, W.; Lindberg, R.; Laurell, F.G.; Hedin, G. Intracavity interrogation of an array of fiber Bragg gratings. Opt. Express 2021, 29, 111–118. [Google Scholar]
- Chung, W.H.; Tam, H.-Y.; Wai, P.K.A.; Khandelwal, A. Time- and wavelength-division multiplexing of FBG sensors using a semiconductor optical amplifier in ring cavity configuration. IEEE Photon. Technol. Lett. 2005, 17, 2709–2711. [Google Scholar]
- Luo, Z.; Wen, H.; Guo, H.; Yang, M. A time- and wavelength-division multiplexing sensor network with ultra-weak fiber Bragg gratings. Opt. Express 2013, 21, 22799–22807. [Google Scholar]
- Perez-Herrera, R.A.; Lopez-Amo, M. Fiber optic sensor networks. Opt. Fiber Technol. 2013, 19, 689–699. [Google Scholar]
- Peng, P.C.; Tseng, H.T.; Chi, S. Fiber-ring laser-based fiber grating sensor system using self-healing ring architecture. Microw. Opt. Technol. Lett. 2002, 35, 441–444. [Google Scholar]
- Yeh, C.H.; Chow, C.W.; Wang, C.H.; Shih, F.Y.; Wu, Y.F.; Chi, S. A simple self-restored fiber Bragg grating (FBG)-based passive sensing ring network. Meas. Sci. Technol. 2009, 20, 043001. [Google Scholar]
- Chang, C.H.; Lu, D.Y.; Lin, W.H. All-Passive Optical Fiber Sensor Network With Self-Healing Functionality. IEEE Photon. J. 2018, 10, 7203310. [Google Scholar]
- Vallejo, M.F.; Perez-Herrera, R.A.; Elosua, C.; Diaz, S.; Urquhart, P.; Bariáin, C.; Lopez-Amo, M. Resilient Amplified Double-Ring Optical Networks to Multiplex Optical Fiber Sensors. J. Light. Technol. 2009, 27, 1301–1306. [Google Scholar]
- Hayle, S.T.; Manie, Y.C.; Dehnaw, A.M.; Hsu, Y.T.; Li, J.W.; Liang, H.C.; Peng, P.C. Reliable self-healing FBG sensor network for improvement of multipoint strain sensing. Opt. Commun. 2021, 499, 127286. [Google Scholar]
- Yeh, C.H.; Chow, C.W.; Wu, P.C.; Tseng, F.G. A simple fiber Bragg grating-based sensor network architecture with self-protecting and monitoring functions. Sensors 2011, 11, 1375–1382. [Google Scholar]
- Yeh, C.H.; Tsai, N.; Zhuang, Y.H.; Chow, C.W.; Liu, W.F. Fault Self-Detection Technique in Fiber Bragg Grating-Based Passive Sensor Network. IEEE Sens. J. 2016, 16, 8070–8074. [Google Scholar]
- Yeh, C.H.; Chang, Y.J.; Huang, T.J.; Yang, Z.Q.; Chow, C.W.; Chen, K.H. A fiber Bragg grating based passive semicircular sensor architecture with fault monitoring. Opt. Fiber Technol. 2019, 48, 258–262. [Google Scholar]
- Yuan, L.; Wang, Q.; Zhao, Y. A passive ladder-shaped sensor architecture with failure detection based on fiber Bragg grating. Opt. Fiber Technol. 2023, 81, 103540. [Google Scholar]
- Yuan, L.; Wang, Q.; Zhao, Y. A wavelength-time division multiplexing sensor network with failure detection using fiber Bragg grating. Opt. Fiber Technol. 2024, 88, 103818. [Google Scholar]
- Kuroda, K. Heterodyne detection applied to a fiber Bragg grating-based sensor using a directly modulated distributed feedback laser. Opt. Lett. 2021, 46, 3985–3988. [Google Scholar]
- Kuroda, K. Performance evaluation of a time-division multiplexed fiber Bragg grating sensor based on heterodyne detection. Appl. Opt. 2023, 62, 2869–2873. [Google Scholar] [PubMed]
- Gilbert, S.L.; Swann, W.C.; Wang, C.M. Hydrogen Cyanide H13C14N Absorption Reference for 1530 nm to 1565 nm Wavelength Calibration-SRM 2519a; Technical Report; NIST Special Publication: Gaithersburg, MD, USA, 2005; pp. 137–260.
- Matsumoto, T.; Kuroda, K. Heterodyne-Based Interrogation of FBGs Temporally and Spectrally Multiplexed in Bus Topology. IEEE Photon. Technol. Lett. 2025, 37, 273–276. [Google Scholar]
- Kuroda, K.; Oka, H. Interrogation of Fiber Bragg Grating-Based Sensors Temporally and Spectrally Multiplexed in Tree Topology. J. Light. Technol. 2025, 43, 3786–3791. [Google Scholar]


| Ref. [15] | Ref. [16] | Ref. [17] | This Work | |
|---|---|---|---|---|
| Source | 1 EDF | 1 EDF | Broadband Pulse | DFB LD |
| Multiplexing | WDM | WDM | WDM/TDM | WDM/TDM |
| First-Line SNR | 20 dB | 30 dB | 30 dB | 20 dB |
| FBG | 6 | 8 | 8 | 7 |
| Detection | OSA | OSA | 2 WDMD 3 OTDV | BD |
| Resolution | 60 pm | 10 pm | 3 pm [24] | |
| Bi-directional access | Optical switch | Optical switch | Optical switch | Coupler |
Disclaimer/Publisher’s Note: The statements, opinions and data contained in all publications are solely those of the individual author(s) and contributor(s) and not of MDPI and/or the editor(s). MDPI and/or the editor(s) disclaim responsibility for any injury to people or property resulting from any ideas, methods, instructions or products referred to in the content. |
© 2025 by the author. Licensee MDPI, Basel, Switzerland. This article is an open access article distributed under the terms and conditions of the Creative Commons Attribution (CC BY) license (https://creativecommons.org/licenses/by/4.0/).
Share and Cite
Kuroda, K. A Passive Ladder-Shaped FBG Sensor Network with Fault Detection Using Time- and Wavelength-Division Multiplexing. Sensors 2025, 25, 4261. https://doi.org/10.3390/s25144261
Kuroda K. A Passive Ladder-Shaped FBG Sensor Network with Fault Detection Using Time- and Wavelength-Division Multiplexing. Sensors. 2025; 25(14):4261. https://doi.org/10.3390/s25144261
Chicago/Turabian StyleKuroda, Keiji. 2025. "A Passive Ladder-Shaped FBG Sensor Network with Fault Detection Using Time- and Wavelength-Division Multiplexing" Sensors 25, no. 14: 4261. https://doi.org/10.3390/s25144261
APA StyleKuroda, K. (2025). A Passive Ladder-Shaped FBG Sensor Network with Fault Detection Using Time- and Wavelength-Division Multiplexing. Sensors, 25(14), 4261. https://doi.org/10.3390/s25144261