

Synchronous Acquisition and Processing of Electro- and Phono-Cardiogram Signals for Accurate Systolic Times’ Measurement in Heart Disease Diagnosis and Monitoring

 ,
, 
 ,
,  and
and 
Abstract
1. Introduction
- Review the scientific literature regarding wearable systems for discreetly acquiring phonocardiograms and other biosignals for detecting heart diseases.
- Analysis of the main features that can be extracted from the joint analysis of ECG and PCG, highlighting their clinical significance.
- Development of an experimental setup for ECG and PCG’s simultaneous acquisition.
- Development of an adaptive segmentation and feature-extracting algorithm for the joint processing of ECG and PCG based on the segmentation of both biosignals and the extraction of the corresponding systolic times.
- Testing of the developed algorithm on acquired signal and its validation on data provided by an open-source dataset to confirm its reliability.
1.1. Literature Analysis of Advanced Systems to Acquire PCG and ECG
1.1.1. Advanced Devices and Algorithms for Detecting and Processing Heart Sounds
1.1.2. Systems and Algorithms for Joint Analysis of ECG and PCG Signals
2. Materials and Methods
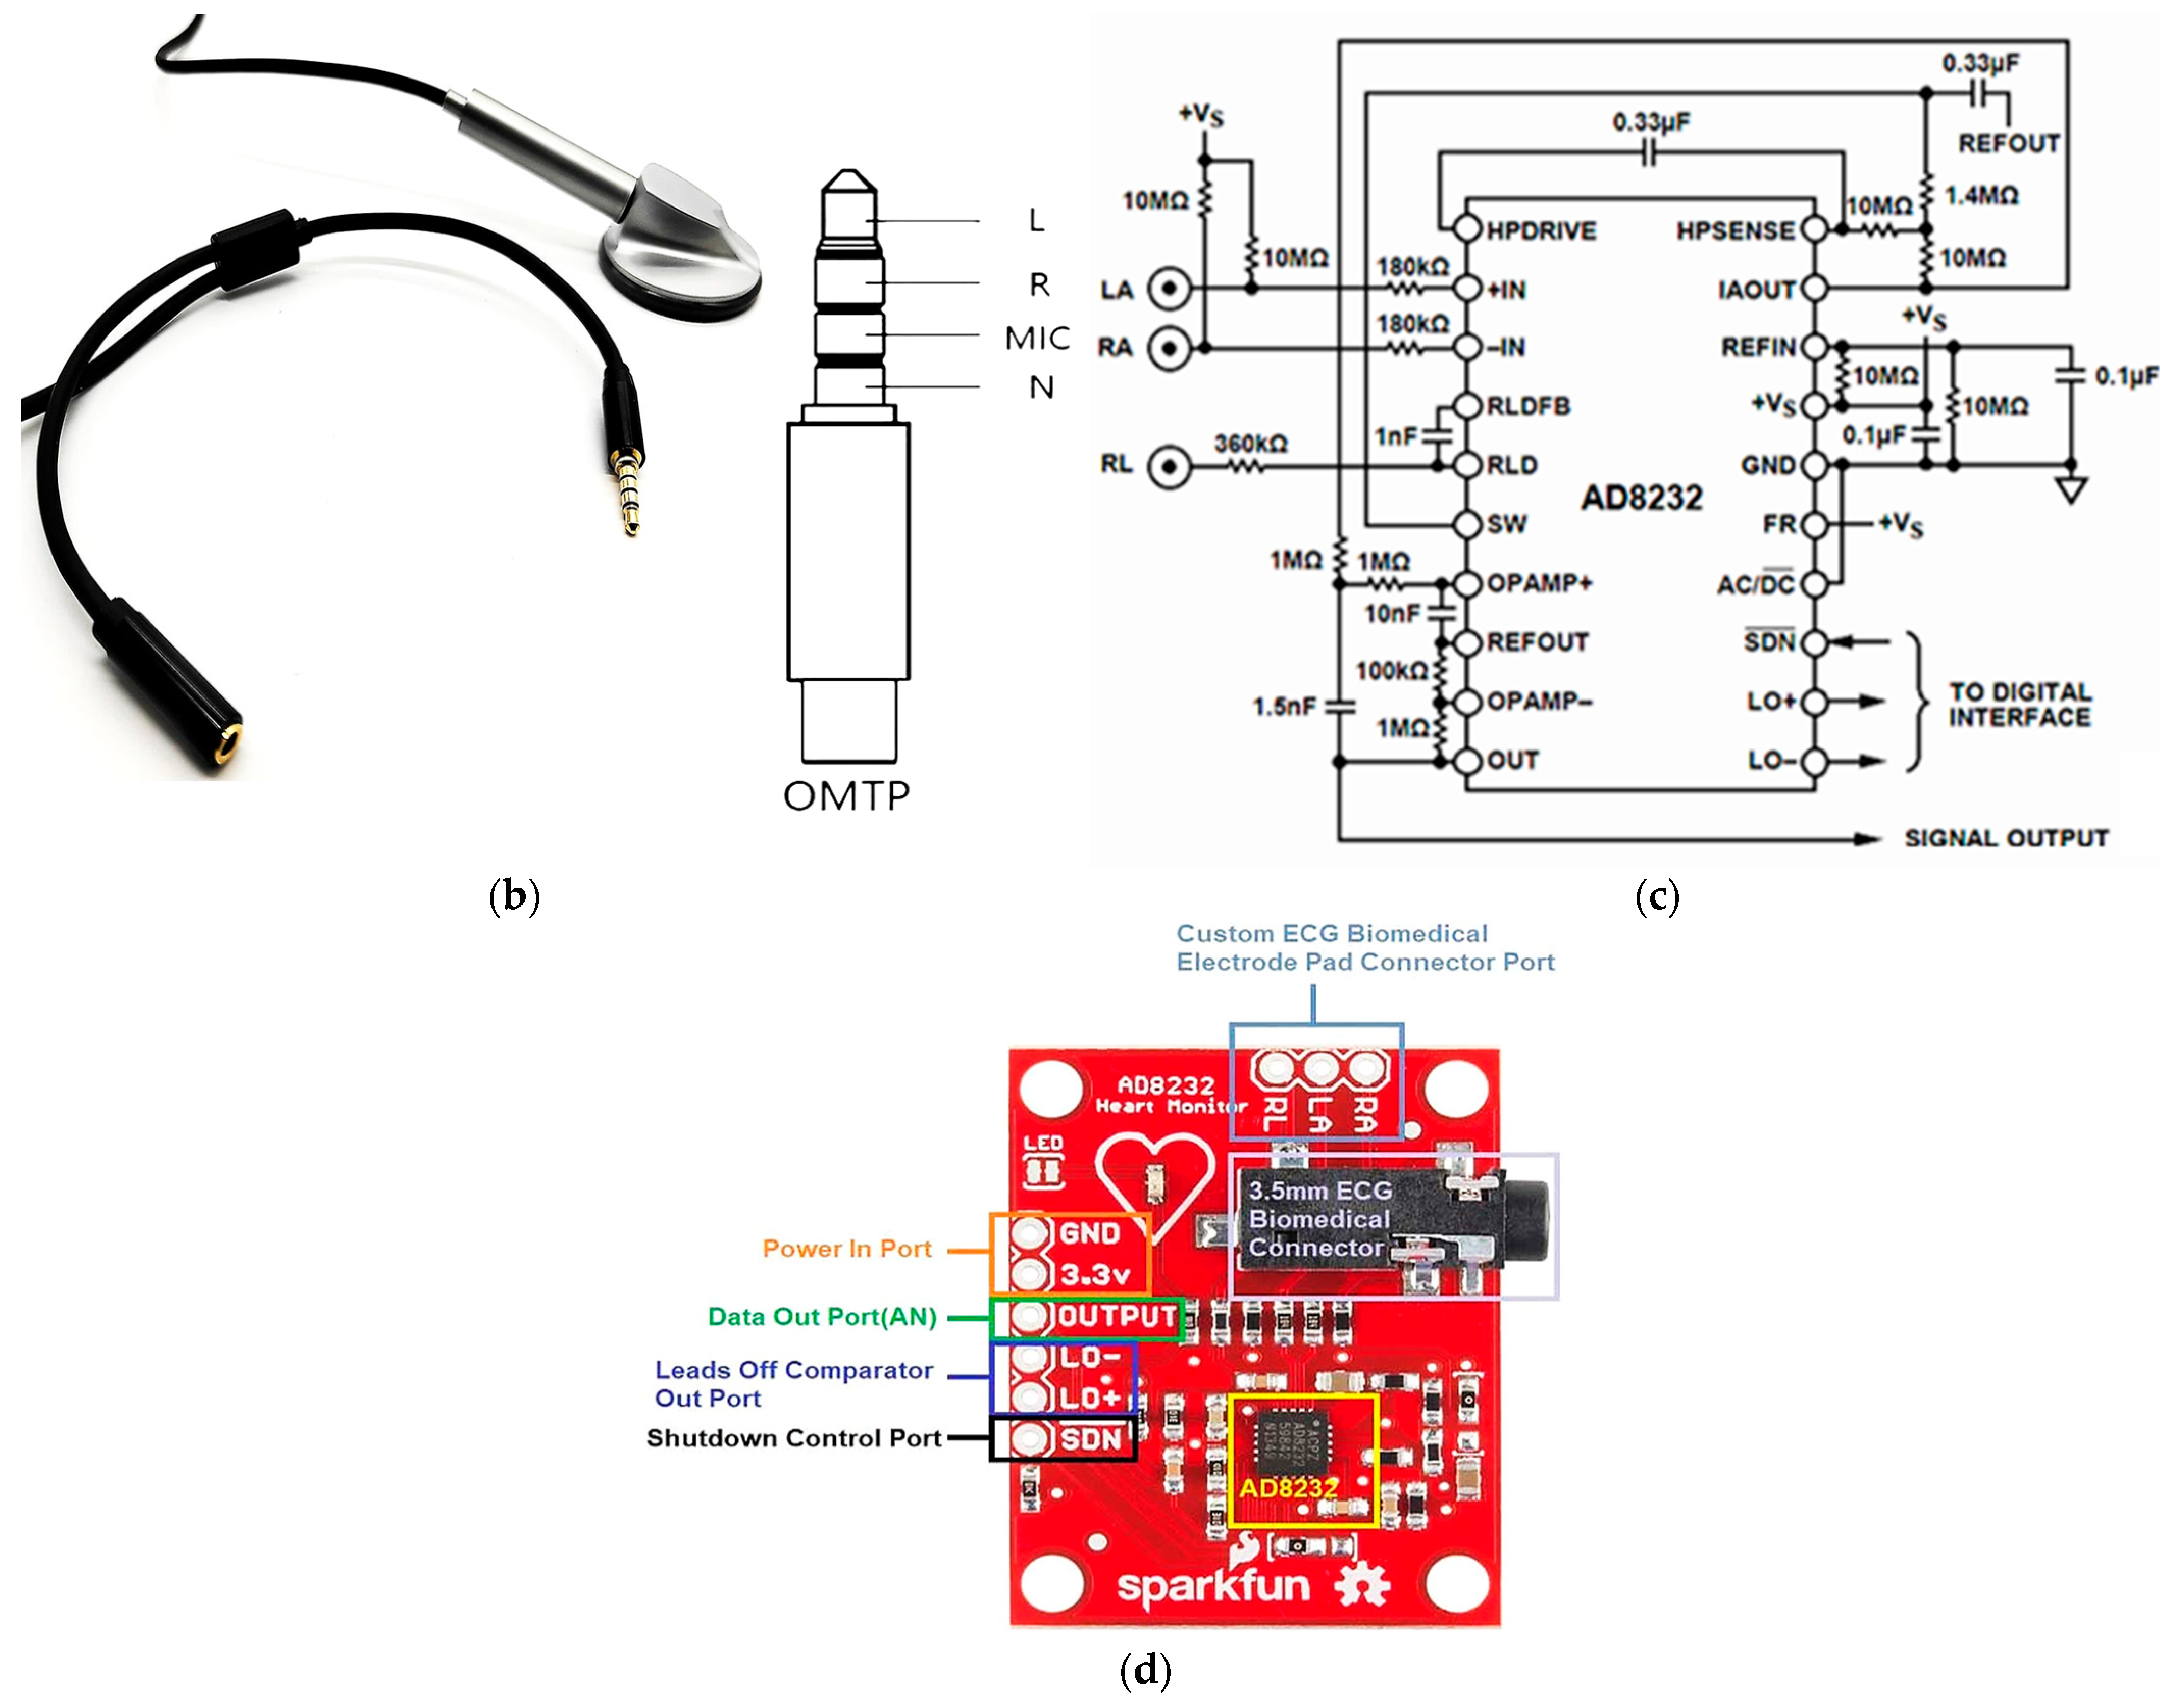
2.1. Description of the Used Materials and Devices
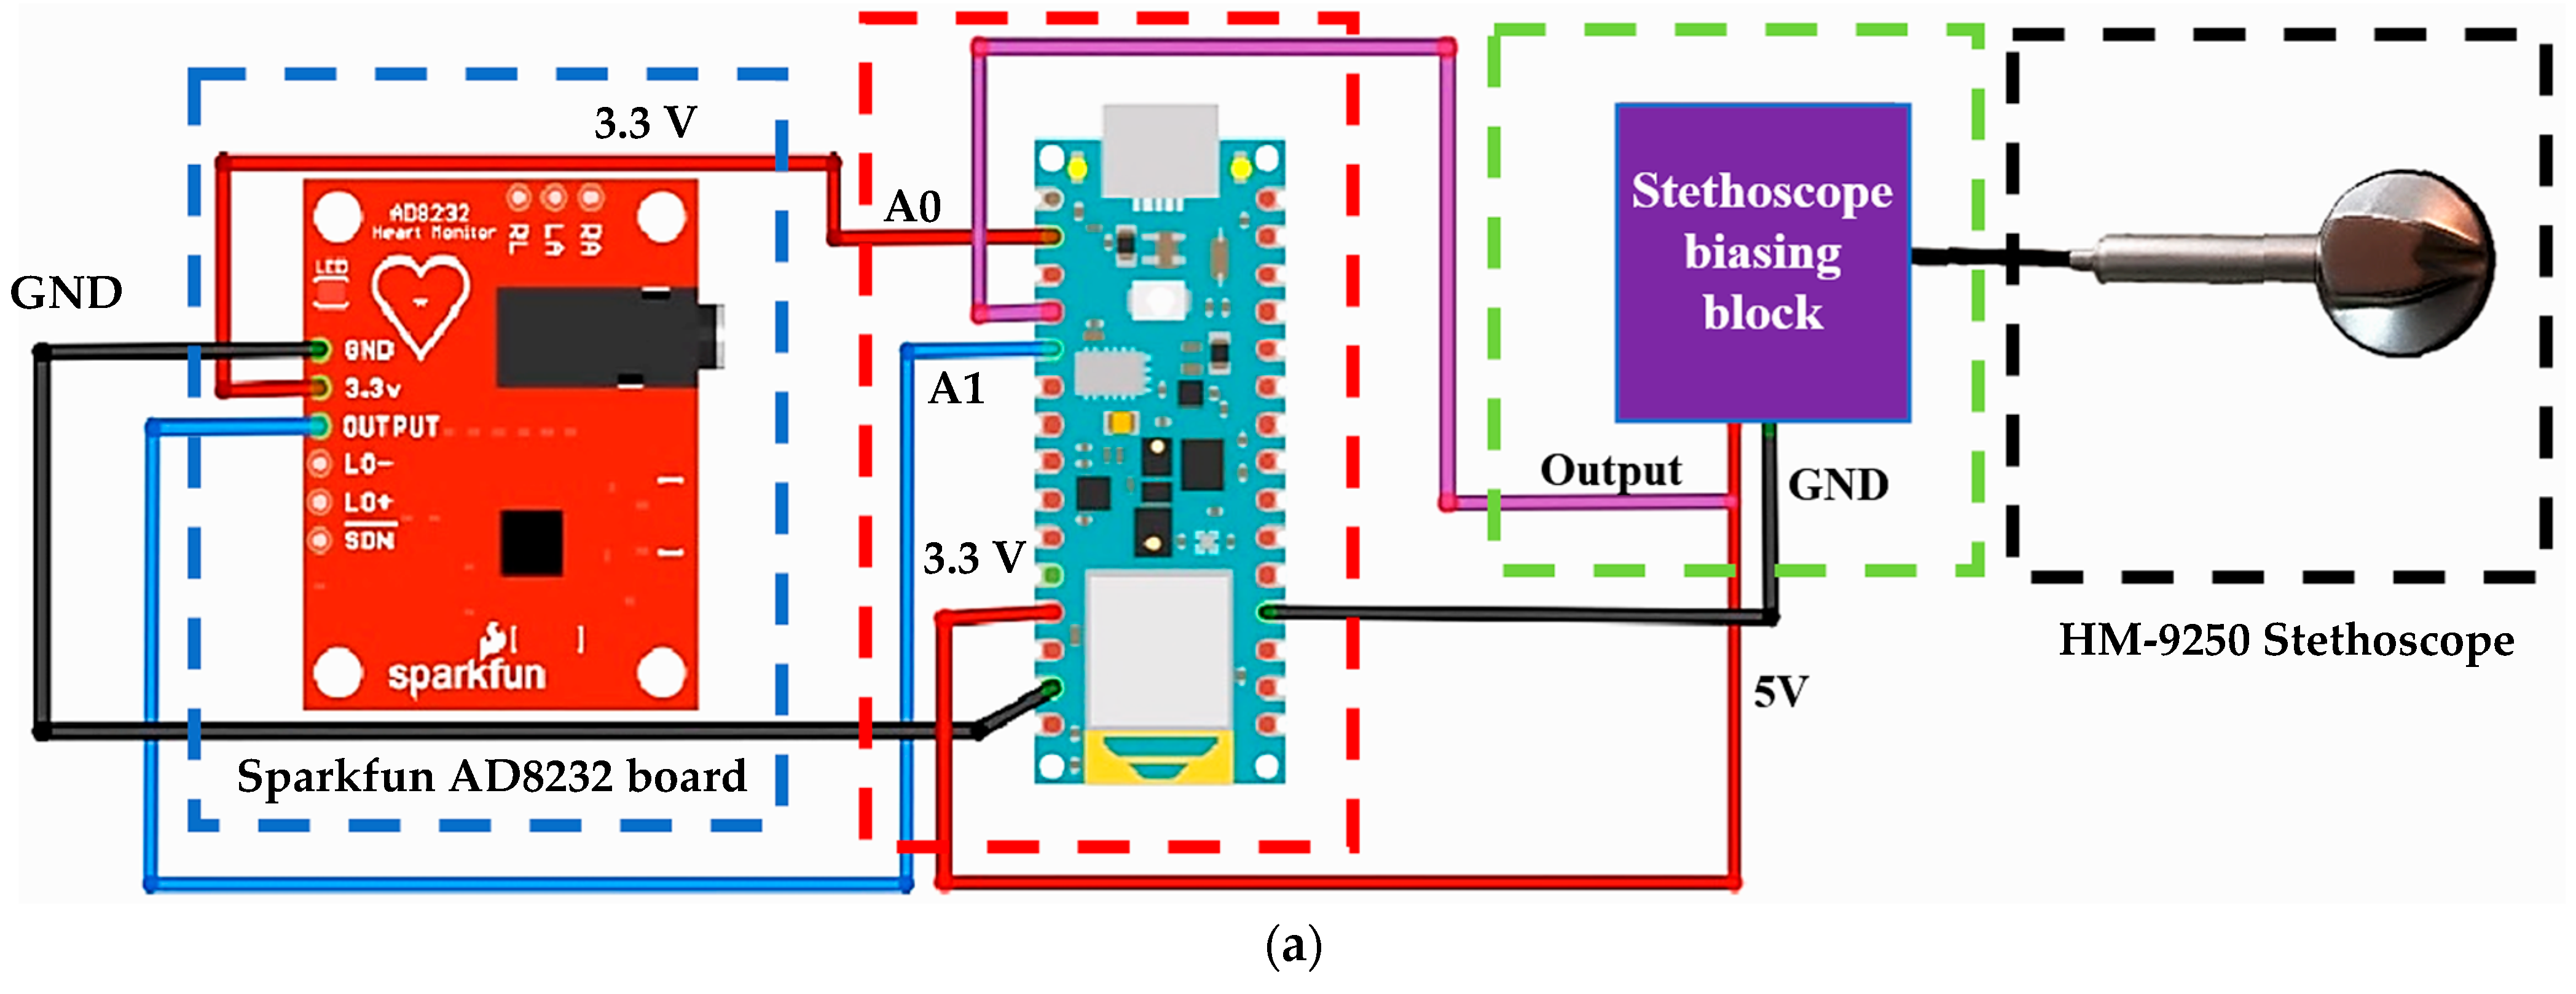
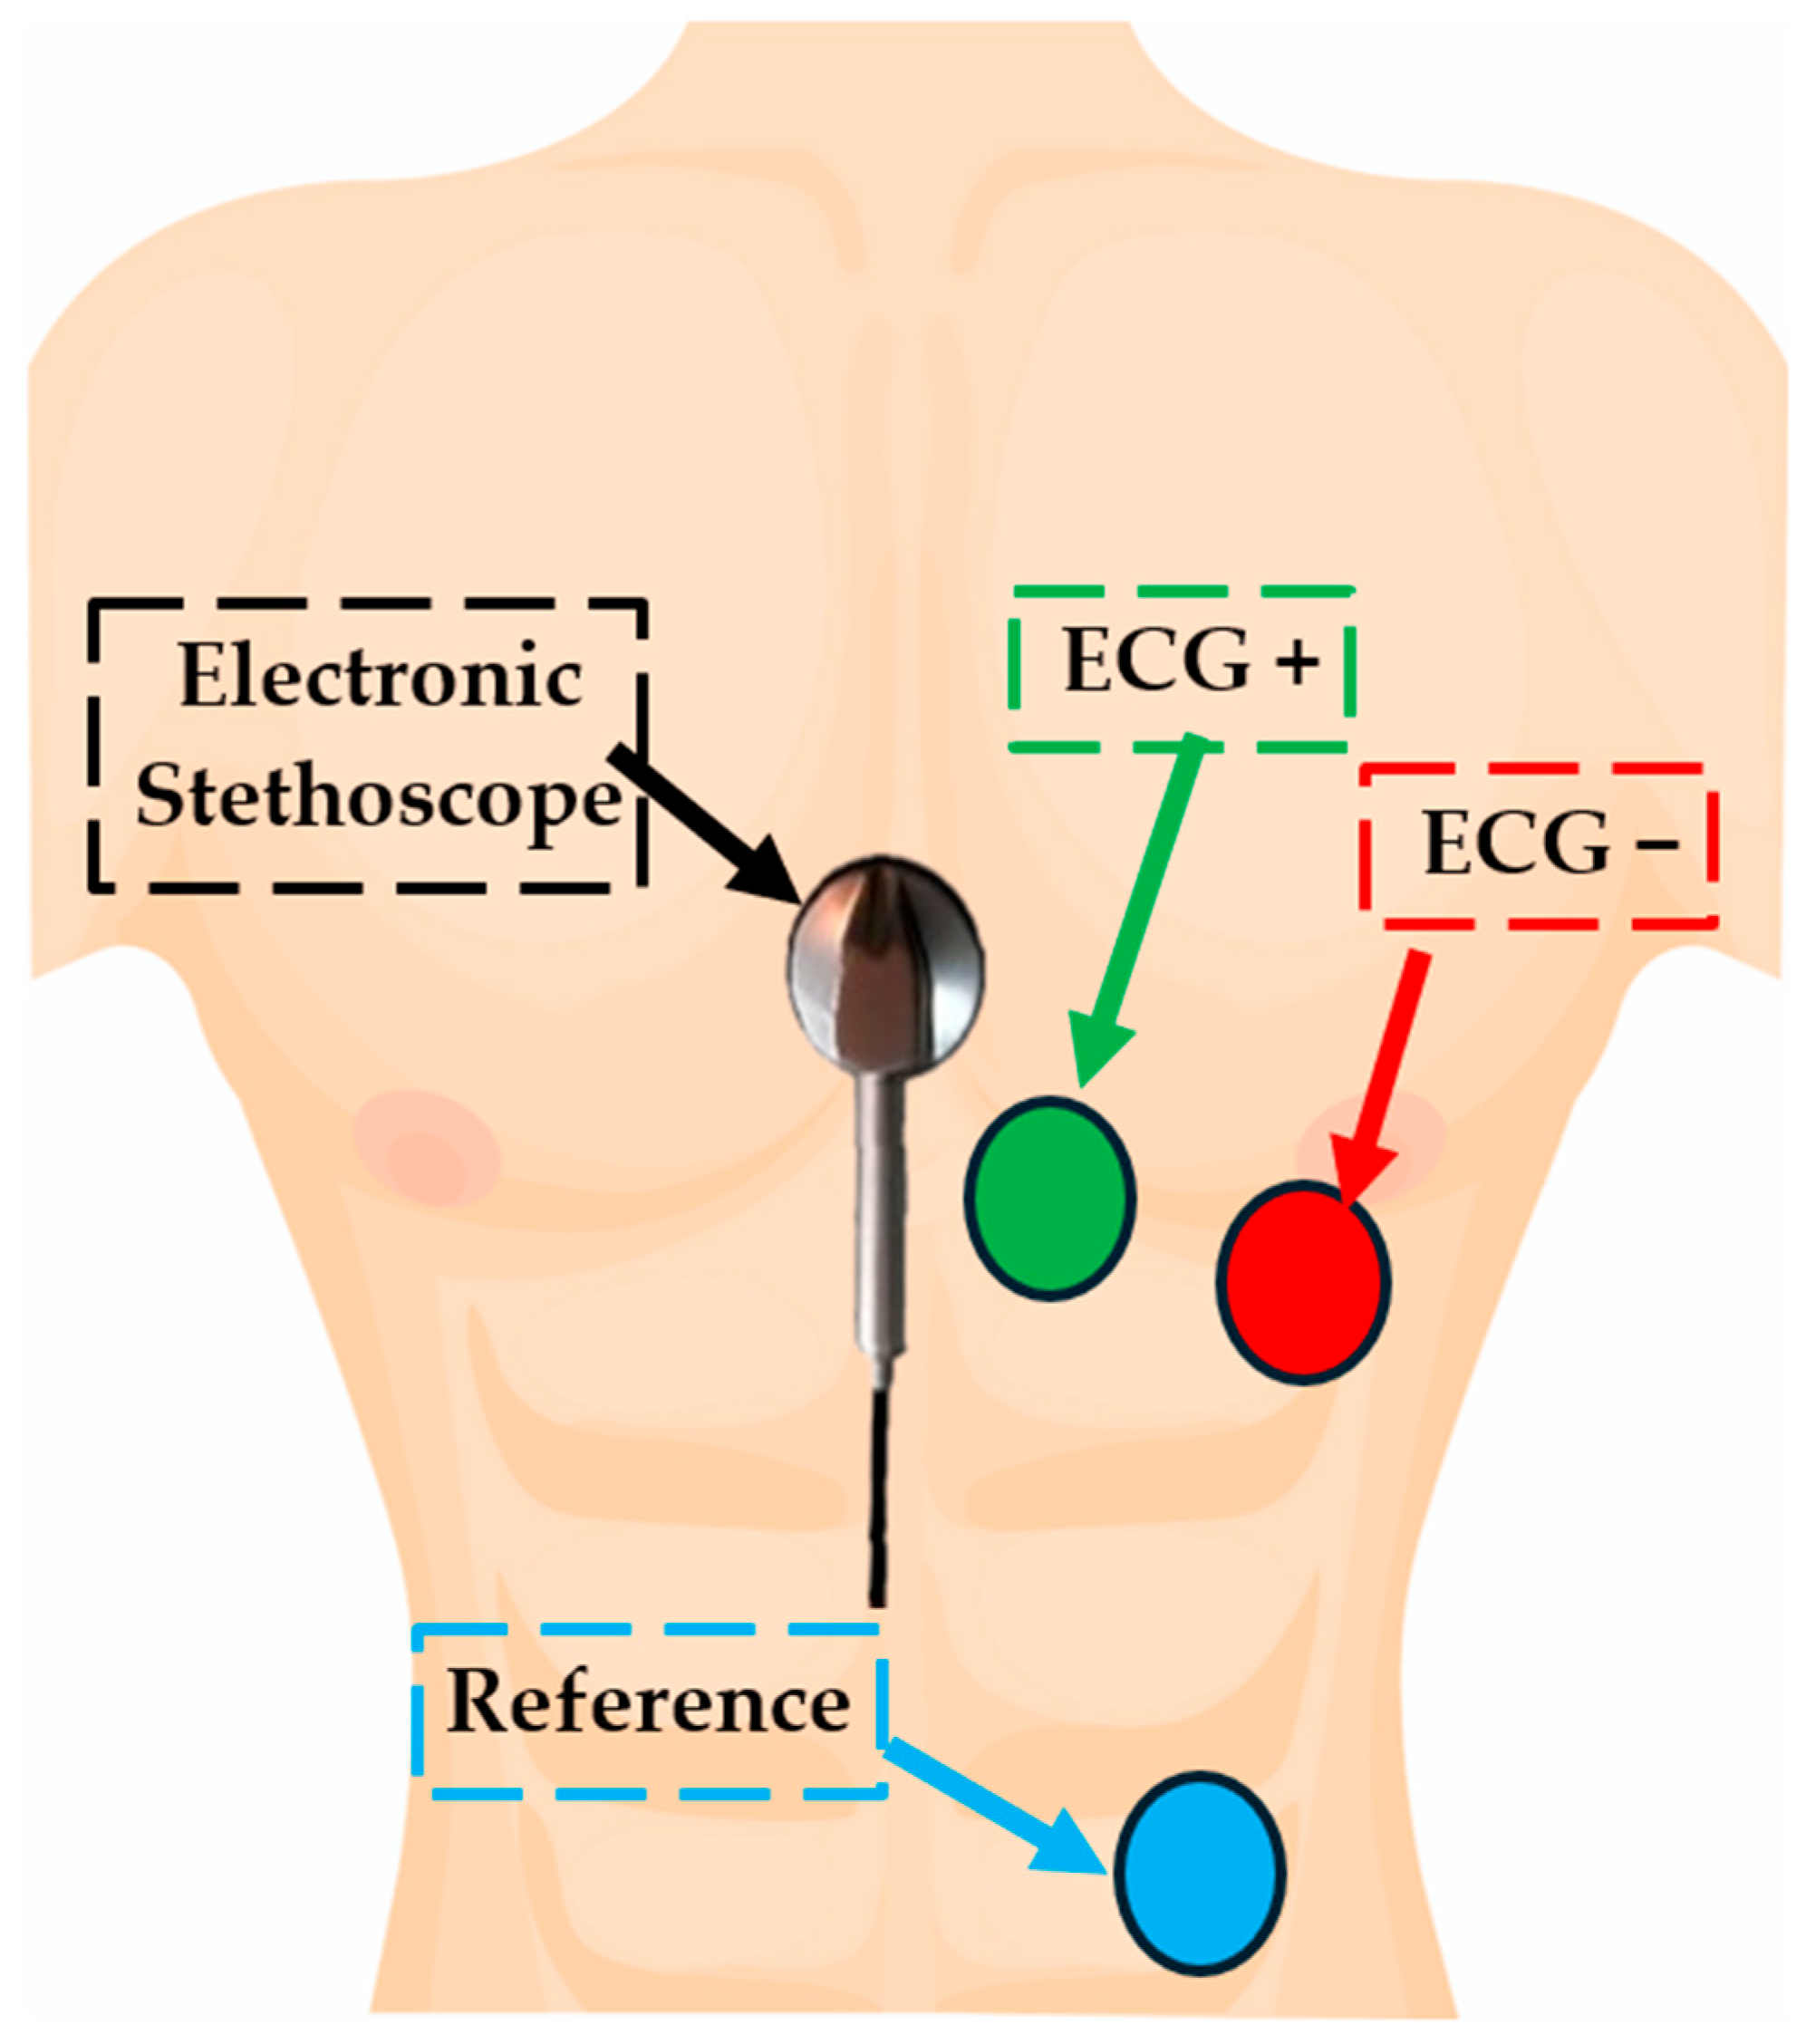
2.2. Description of the Experimental Setup for Simultaneous Acquisition of ECG and PCG
| 1 #include <Filters.h> 2 FilterTwoPole filterTwoLowpass_pcg(100,1,0); // set the LP filter for PCG 3 FilterTwoPole filterTwoLowpass_ecg(15,0.707,0);// set the LP filter for ECG 4 void setup() { 5 Serial.begin(115200); 6 analogReadResolution(12); 7 analogReference(AR_VDD); 8 } 9 void loop() { 10 int raw_pcg= analogRead(A0); 11 int ecg = analogRead(A1); 12 int raw1_pcg= analogRead(A0); 13 float pcg = 0.5*(raw_pcg + raw1_pcg);//estimates the synchronous sample of PCG with respect to the ECG 14 filterTwoLowpass_pcg.input(pcg); //2nd-order LP filter for PCG 15 float filtered2 = filterTwoLowpass_pcg.output(); // provide the output of LP filter 16 filterTwoLowpass_ecg.input(ecg); // 2nd-order LP filter for ECG 17 float ecg_filtered = filterTwoLowpass_ecg.output(); //provide the output of the LP filter 18 Serial.print(millis()); 19 Serial.print(“,”); 20 Serial.print(filtered2); 21 Serial.print(“,”); 22 Serial.println(ecg_filtered); 23 delay(1); 24 } |
2.3. Description of the MATLAB Script for Segmenting PCG and ECG
| for s = 1:1:window_number 19 t = data.b(slice_*(s-1) + 1:slice_*s,1); %time loading 20 ecg = detrend(data.b(slice_*(s-1) + 1:slice_*s,8)); %ecg loading 21 hpFilt = designfilt(‘highpassiir’, ... 22 ‘FilterOrder’, 4, ... 23 ‘HalfPowerFrequency’, 2, ... 24 ‘SampleRate’, fs); 25 % Apply the filter 26 ecg = filtfilt(hpFilt, ecg);% ecg filtering 27 pcg = detrend(data.b(slice_*(s-1) + 1:slice_*s,3)- Mean(data.b(slice_*(s-1) + 1:slice_*s,3))) |
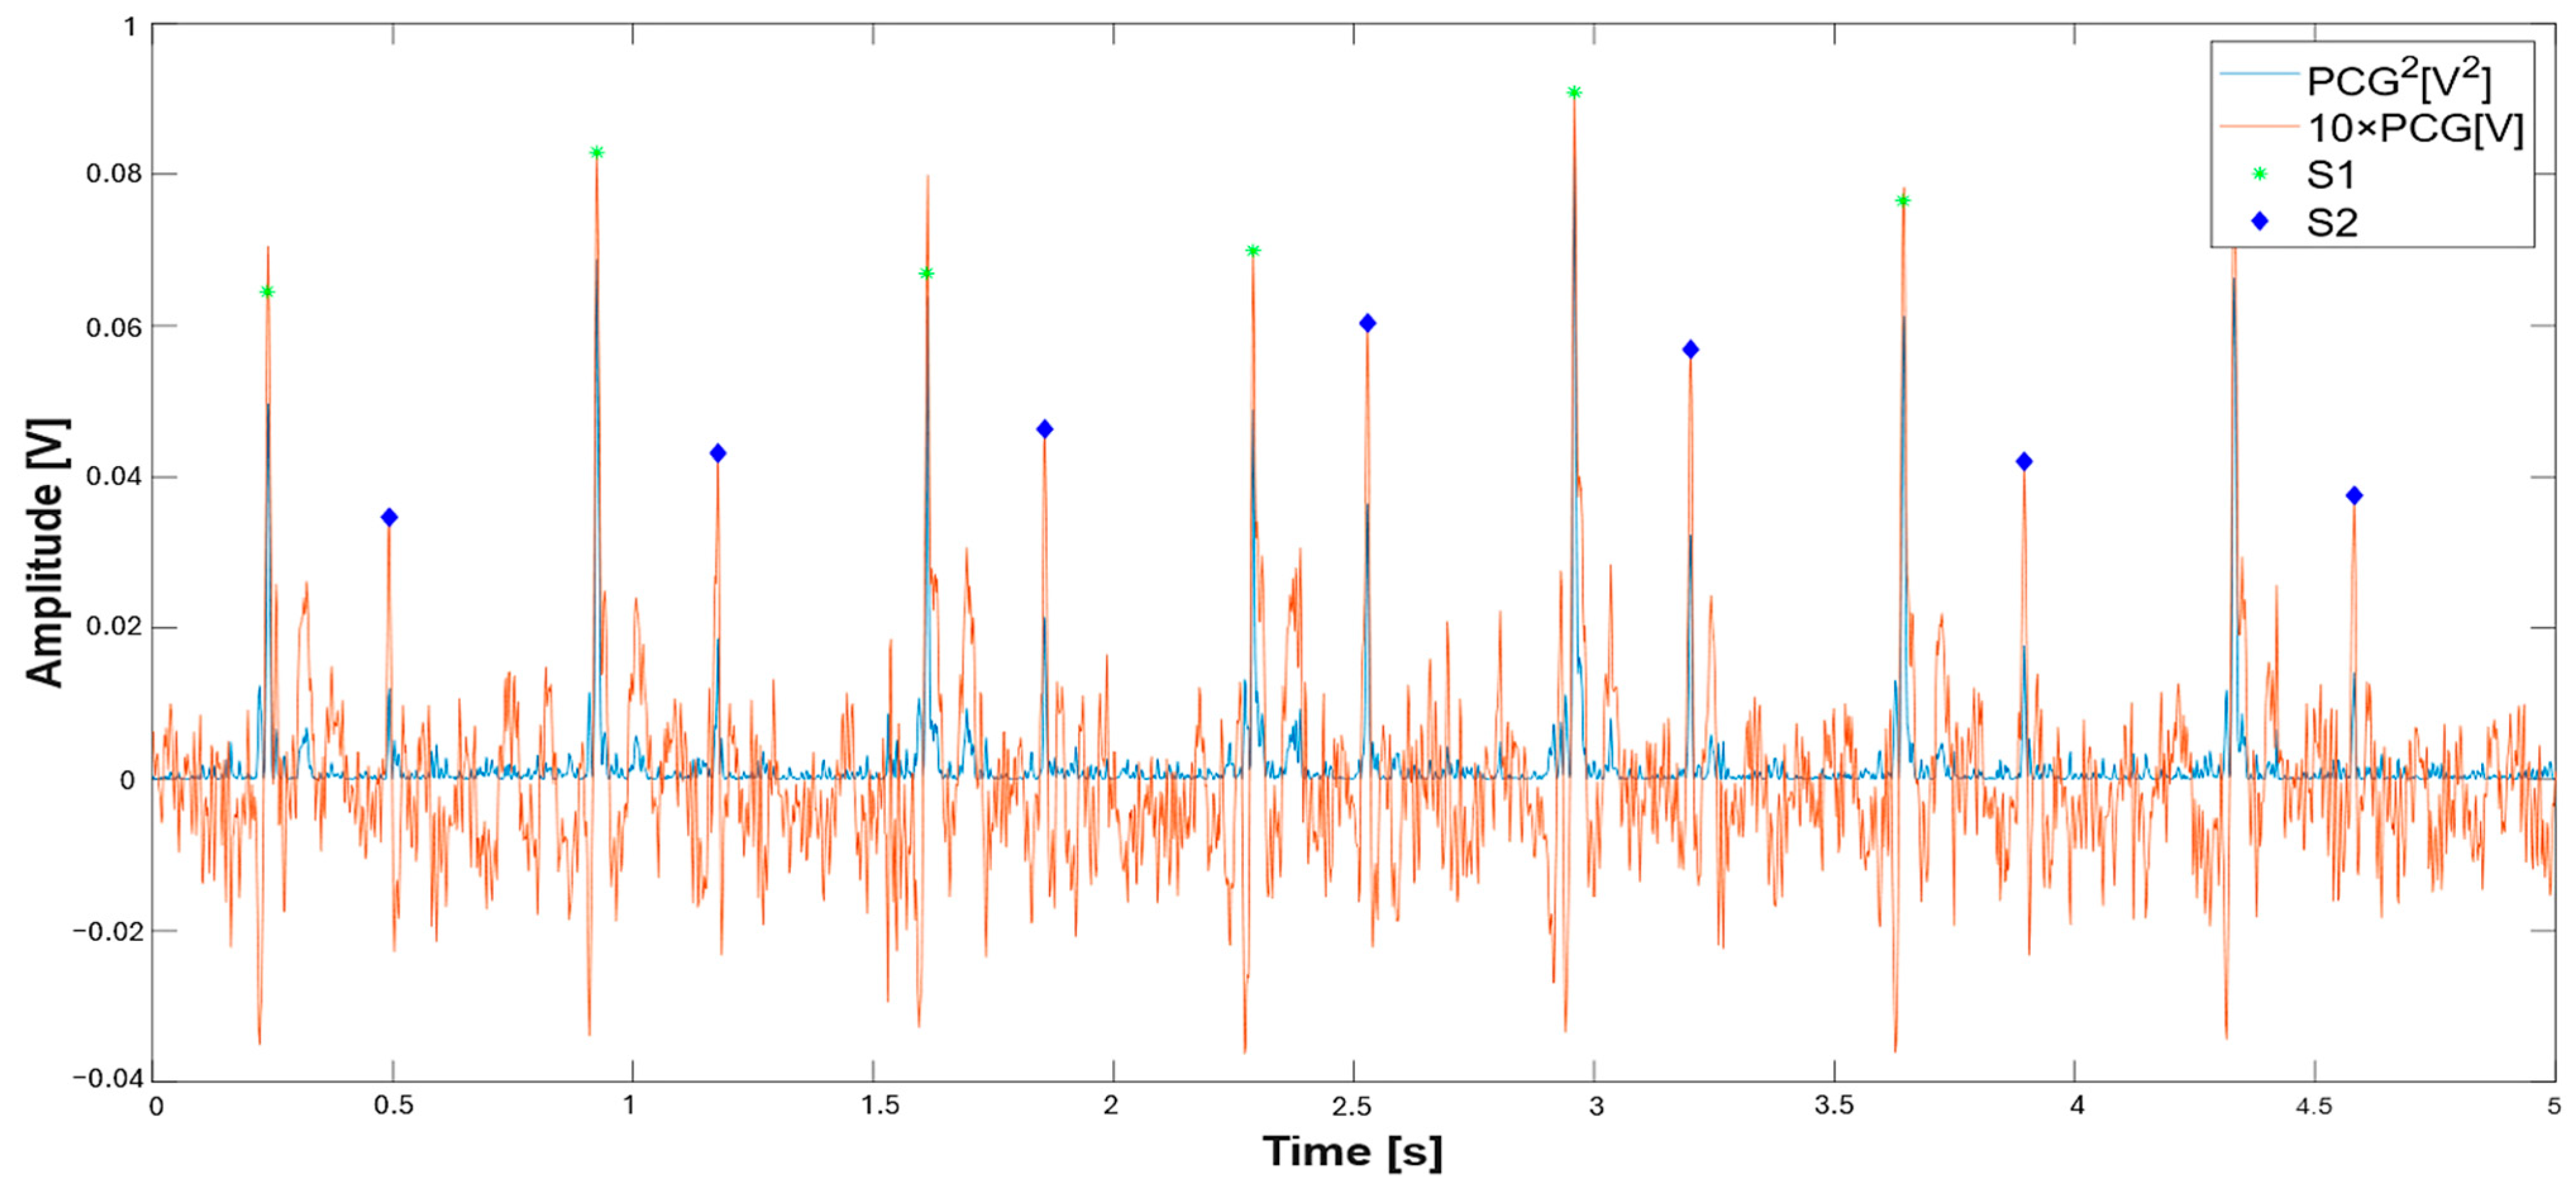
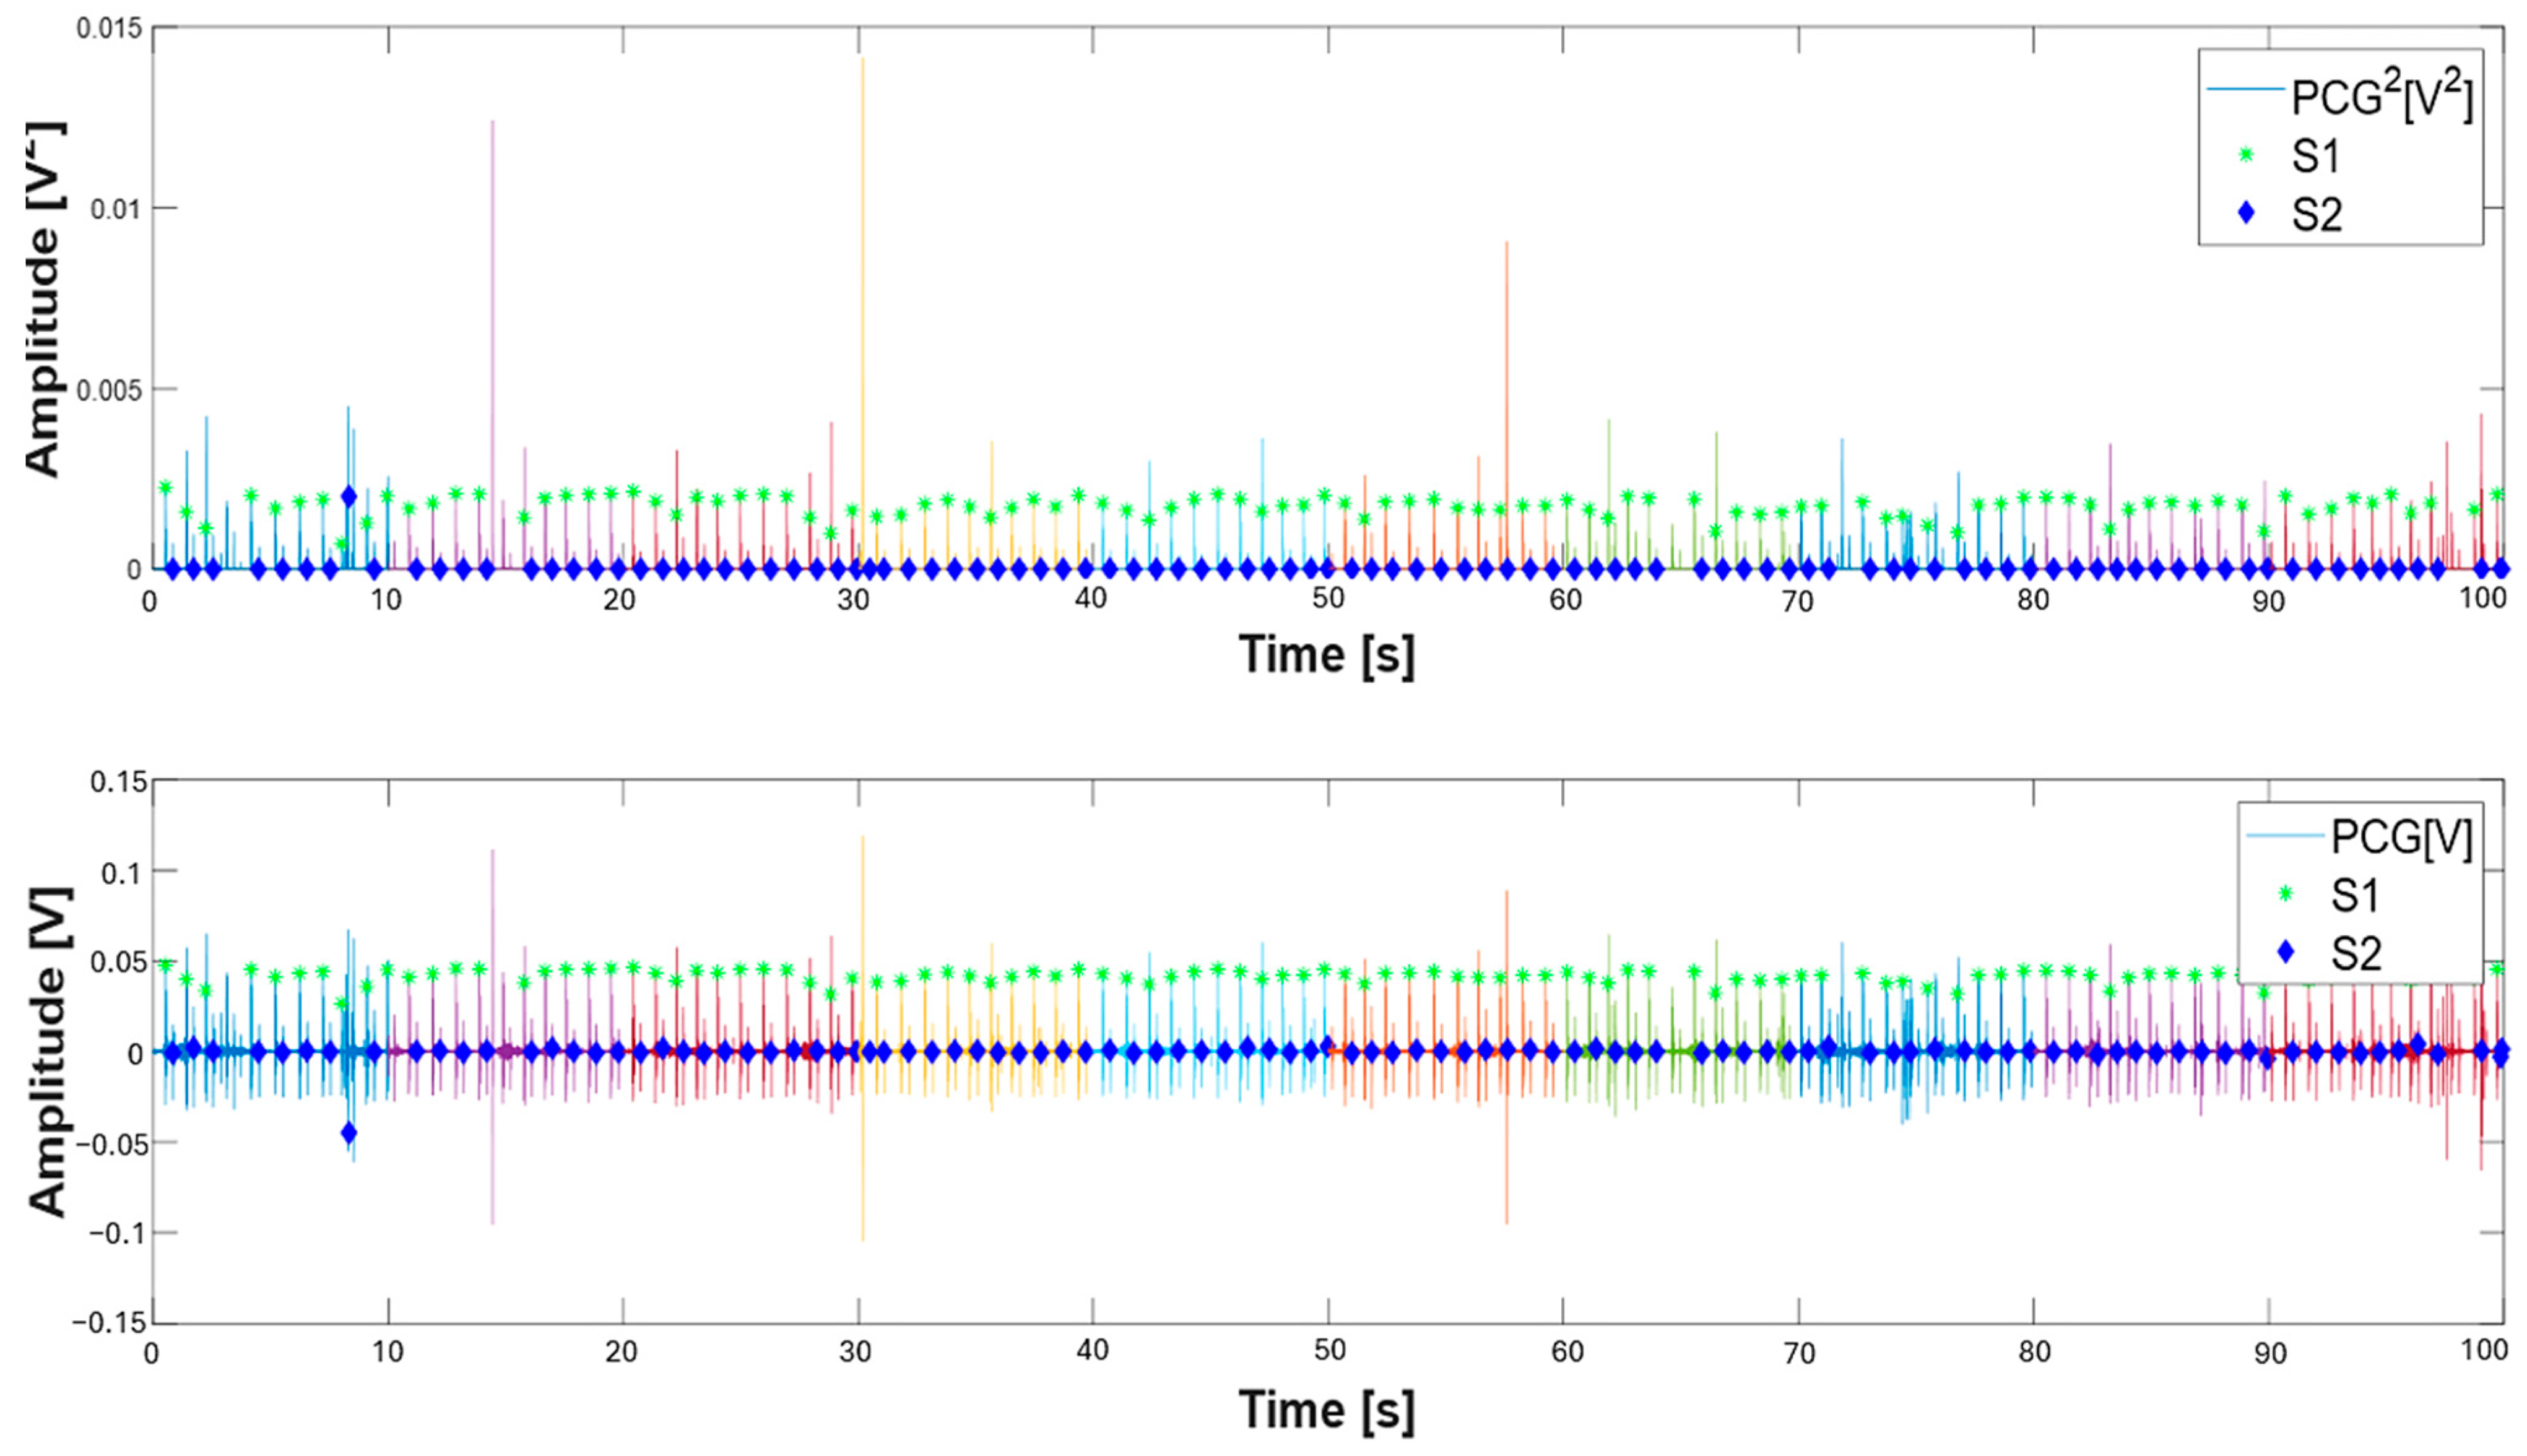
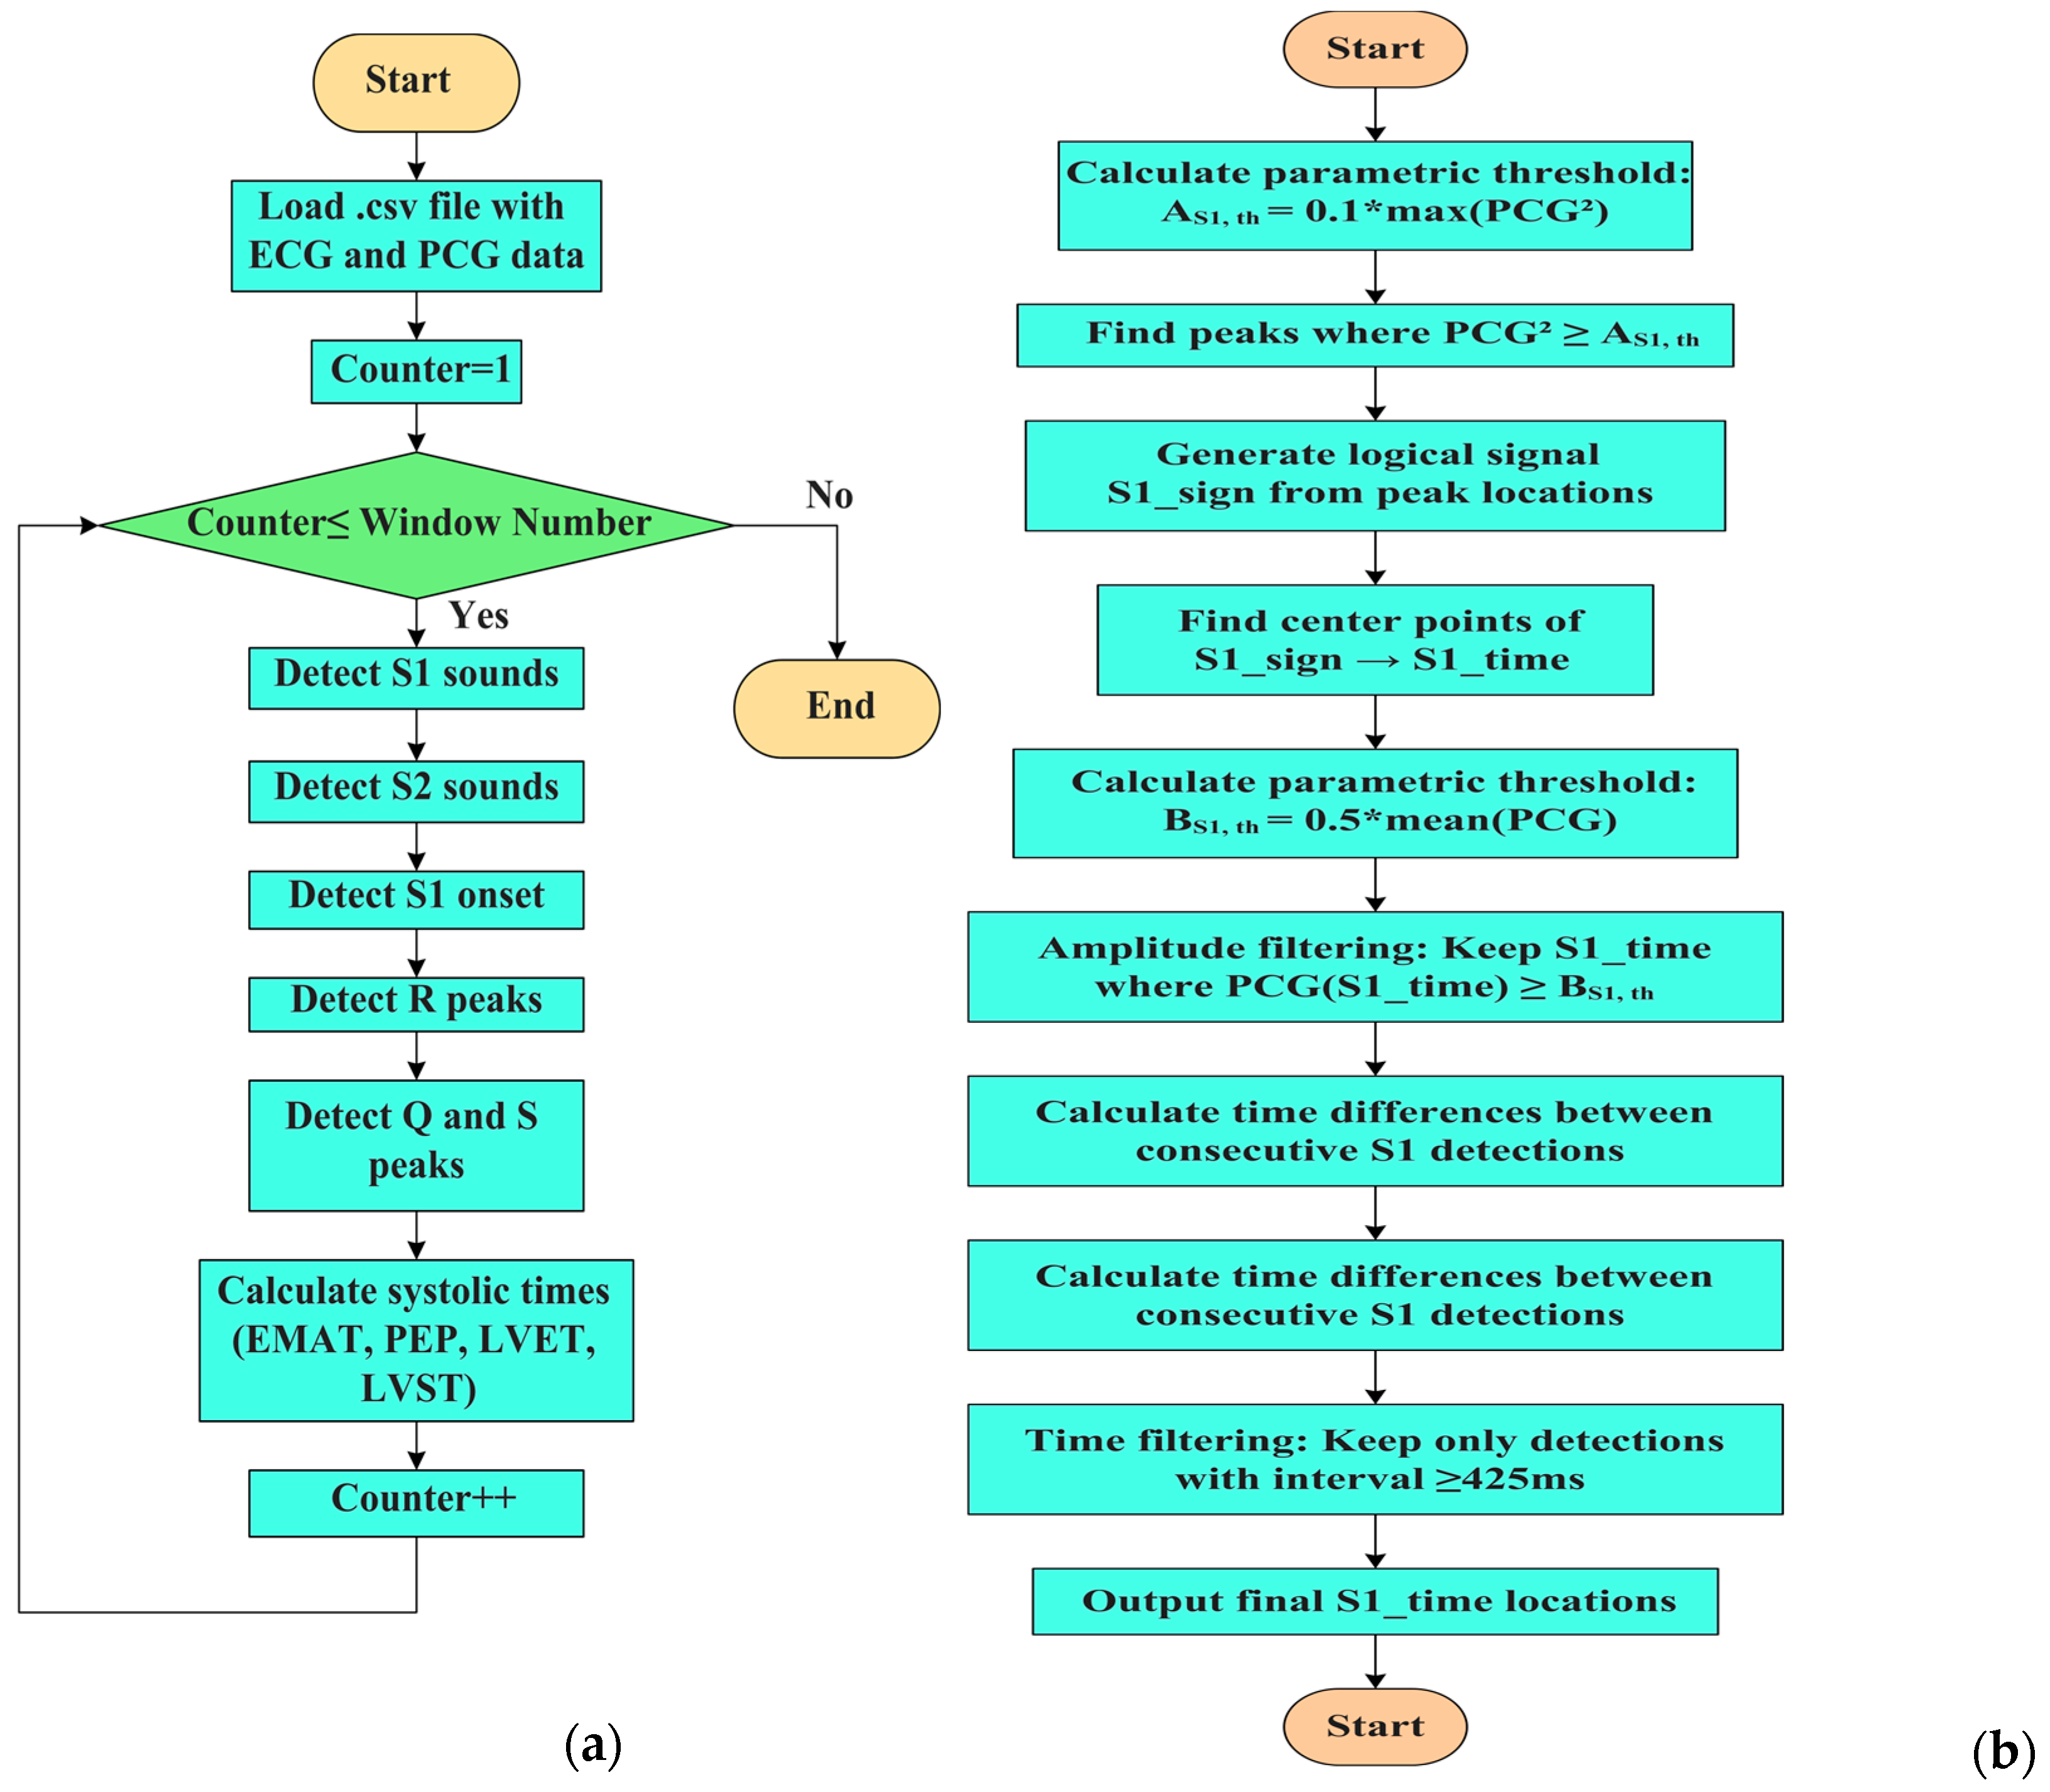
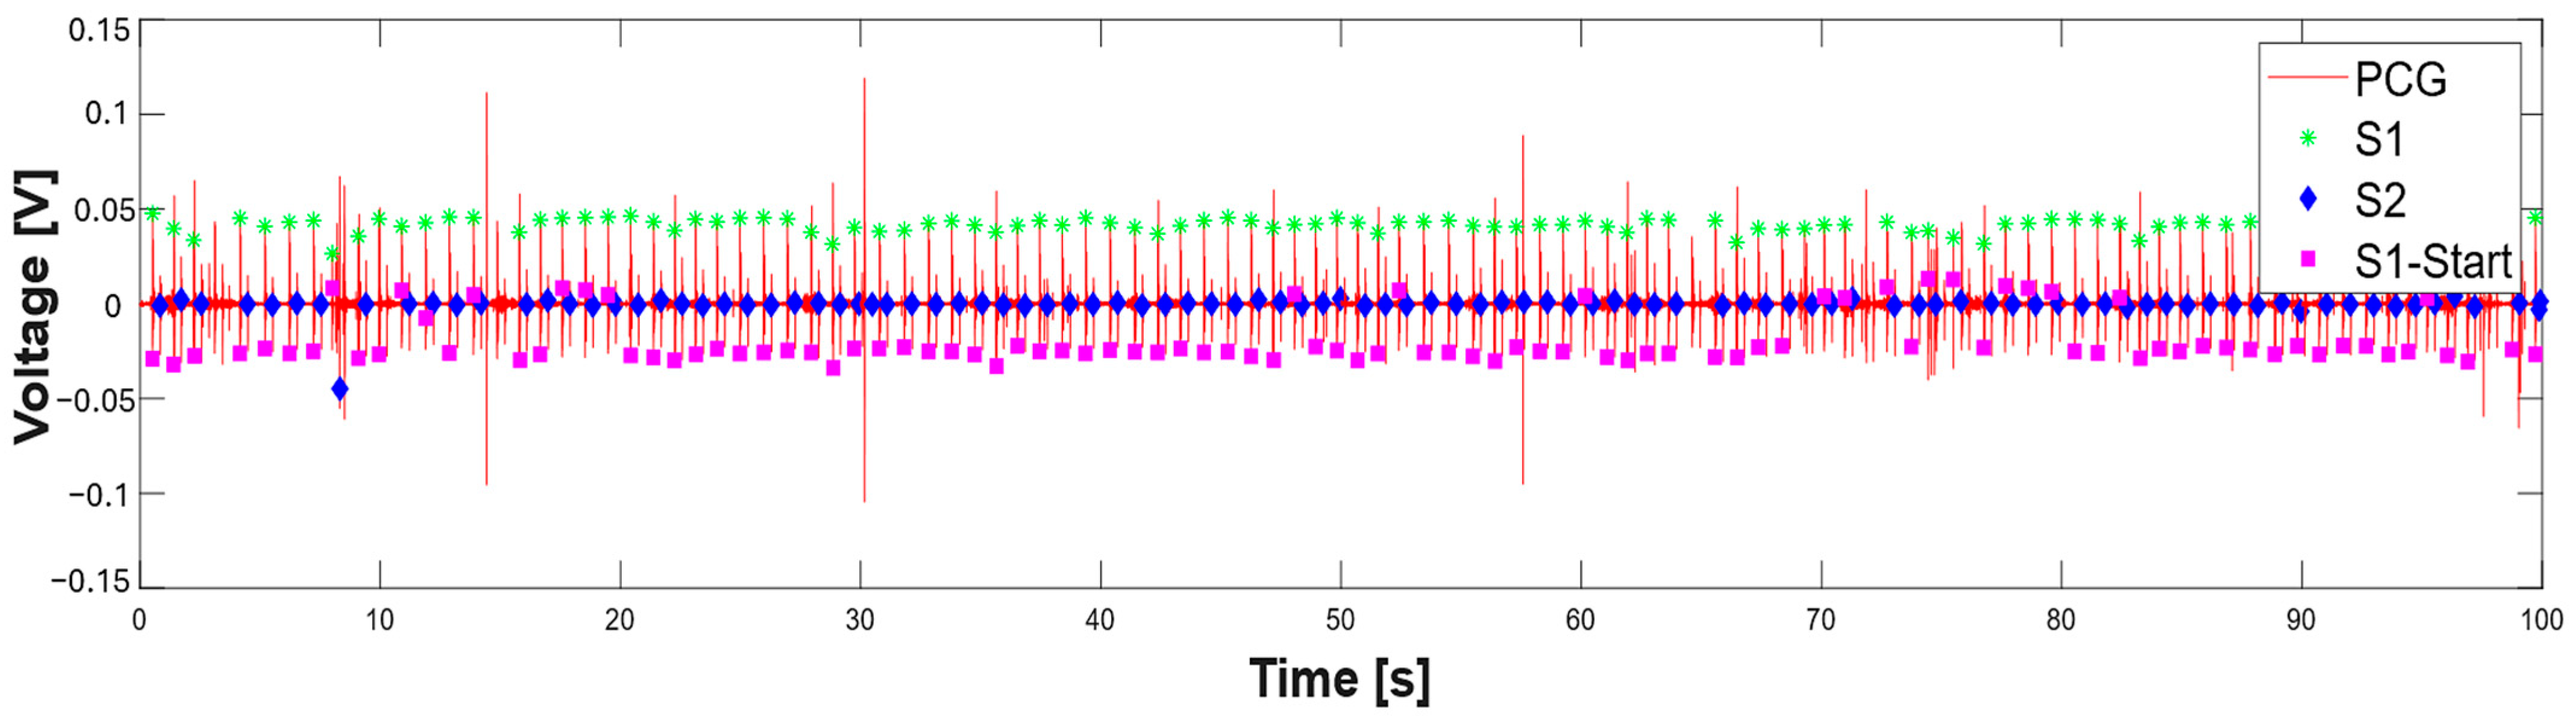
| 48 A_S1_th = 0.1*max(pcg.^2);% parametric threshold on S1 sound 49 peak_S1 = find(pcg.^2 >= A_S1_th); %find S1 peak 50 S1_sign = generate_signal(peak_S1,length(pcg));%generate logic signal 51 figure(2); 52 fig_ = gcf; 53 fig_.WindowState = ‘maximized’; 54 subplot(2,1,1) 55 plot(t,(pcg.^2));hold on 56 xlabel(‘Time [s]’, ‘fontweight’, ‘bold’, ‘fontsize’,16); 57 ylabel(‘Amplitude [V^2]’, ‘fontweight’, ‘bold’, ‘fontsize’,16); 58 legend(‘PCG^2[V^2]’,’S1’,’S2’); 59 subplot(2,1,2); 60 plot(t, pcg);hold on 61 %xlim([0 11]) 62 S1_time = find_center_points(S1_sign);% find center of logic signal 63 B_S1_th = 0.5*mean(pcg(S1_time));% amplitude threshold on S1 detection 64 S1_time = S1_time(pcg(round(S1_time)) >= B_S1_th); % amplitude filtering on S1 65 differences = diff(S1_time); 66 threshold = 0.425*fs; 67 keep_index = [true,abs(differences) >= threshold]; %time filtering on S1 sounds 68 S1_time = S1_time(keep_index); |
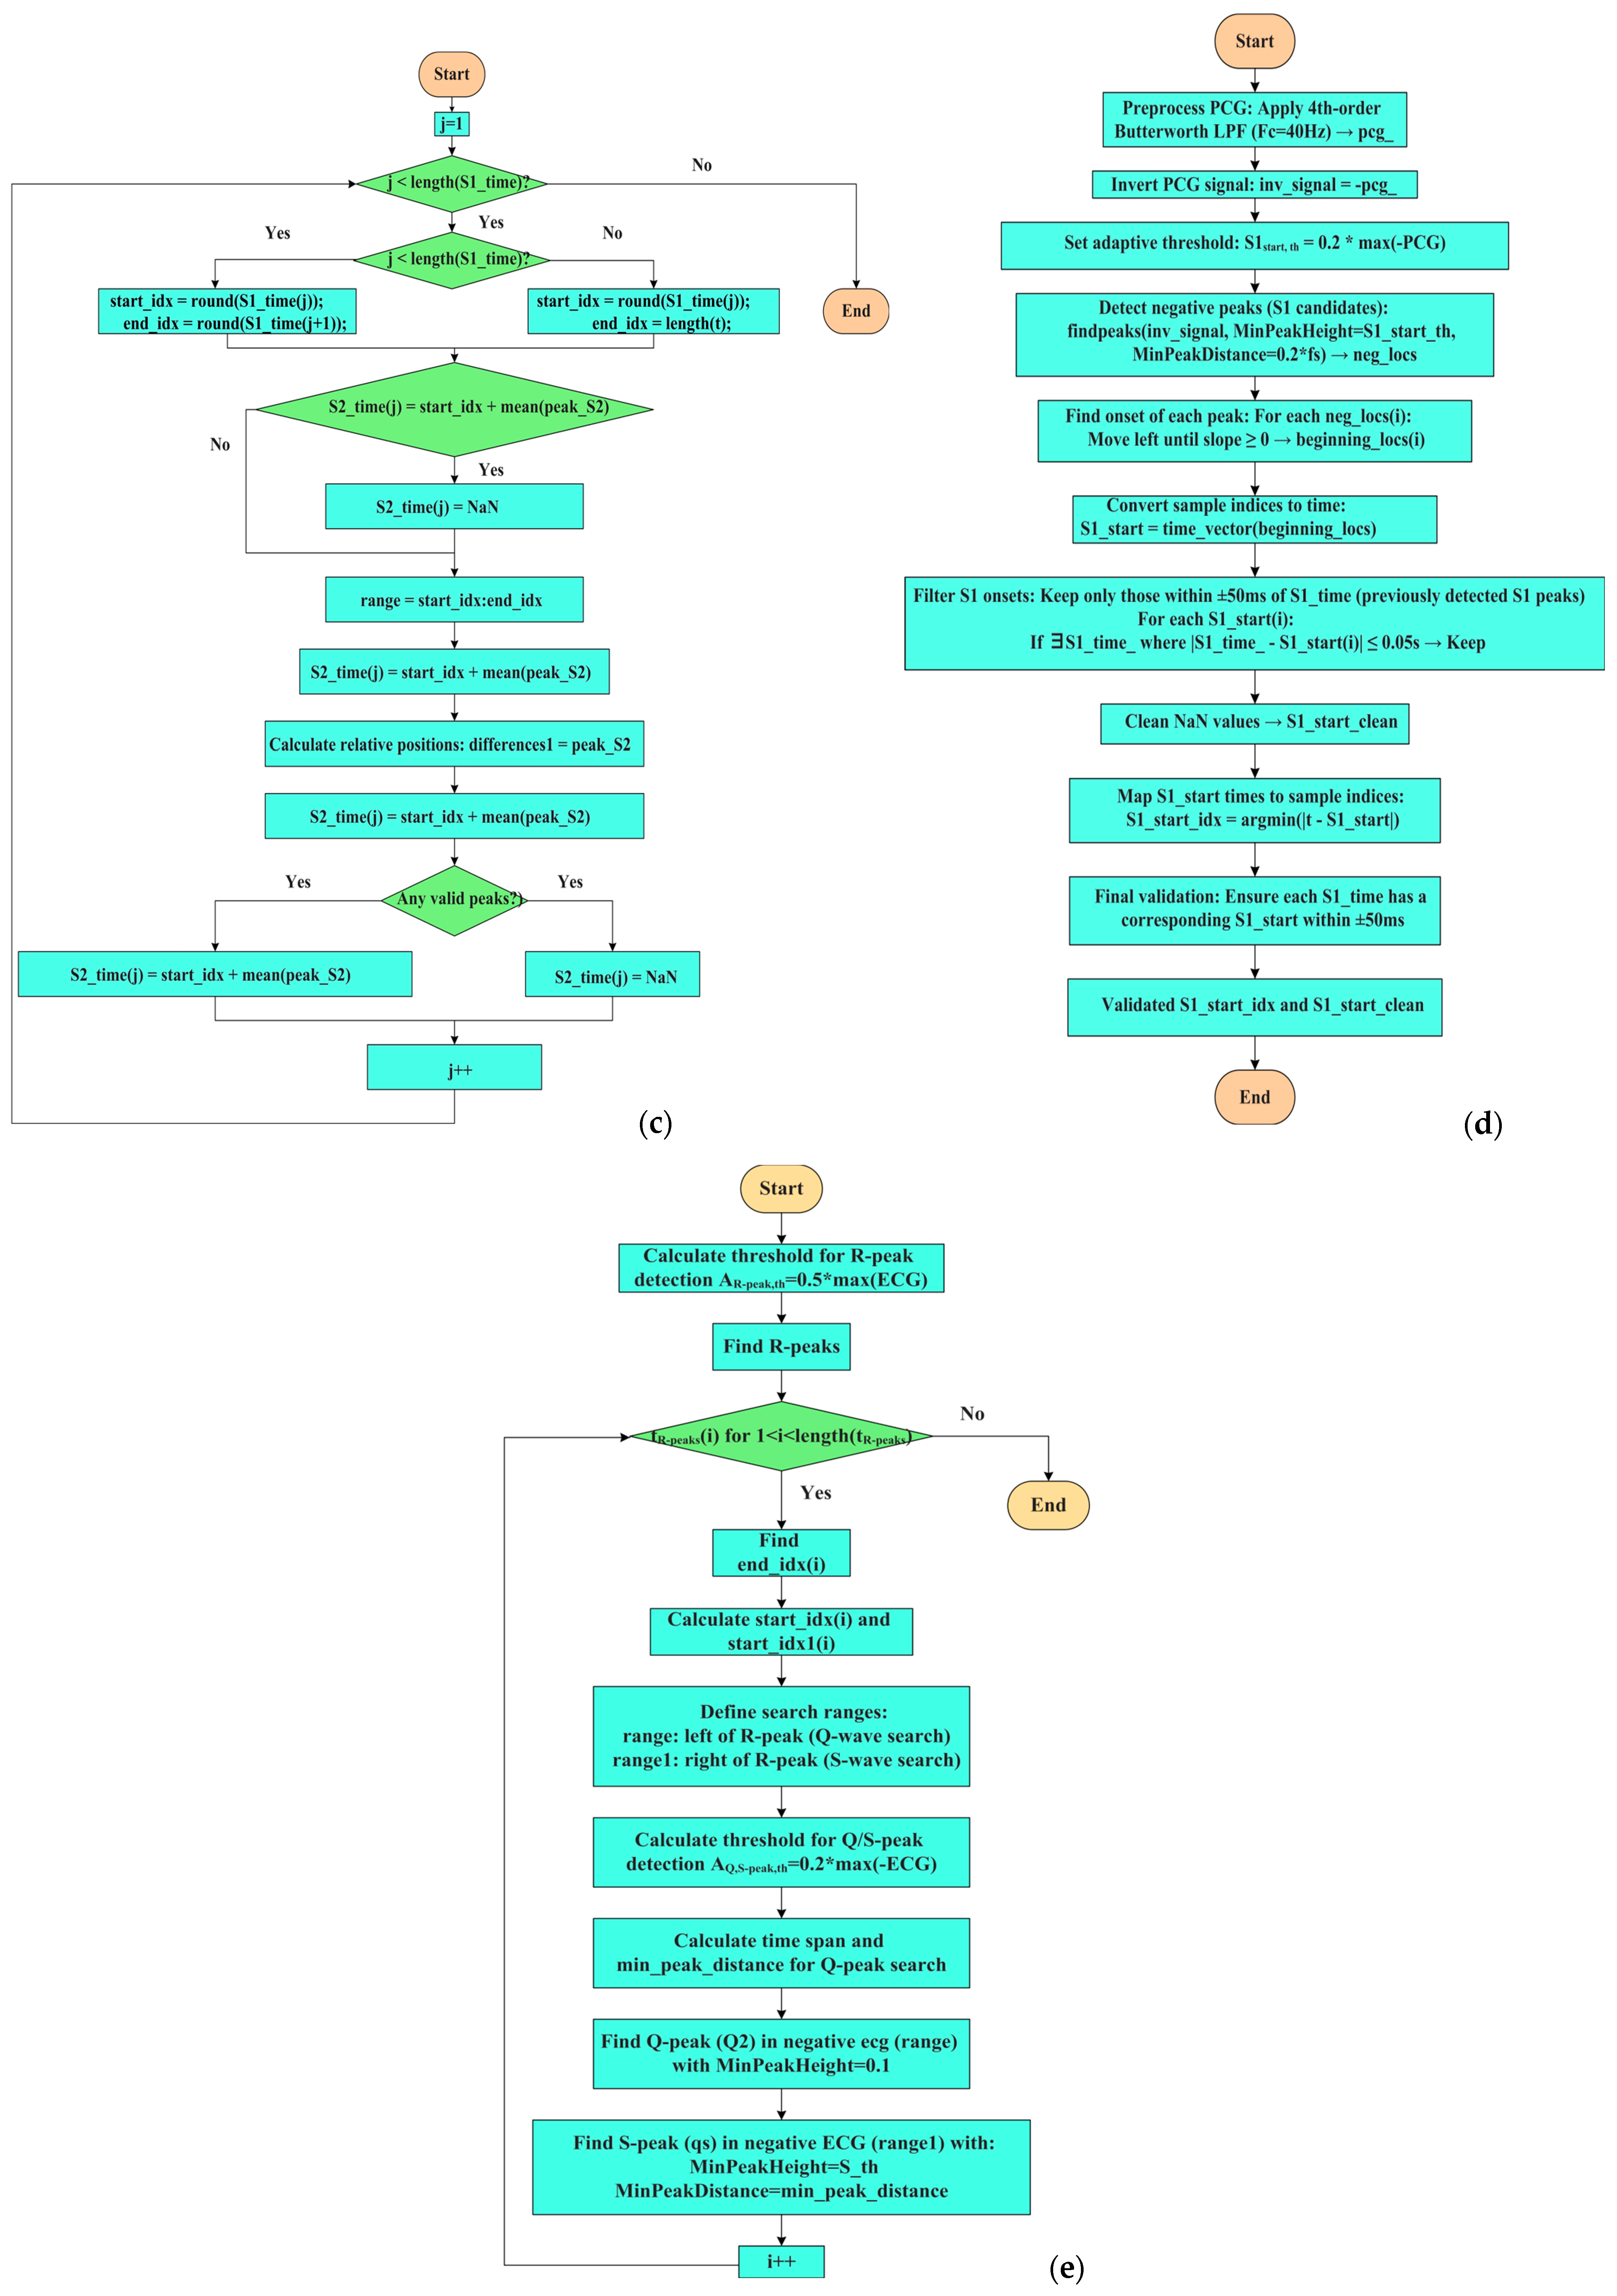
| % Detection of S2 sounds 70 %Determines ranges around the S1 sounds 71 for j = 1:length(S1_time) % Prevent index overflow at j + 1 72 % Ensure range indices are integers 73 if j < length(S1_time) 74 start_idx = round(S1_time(j)); 75 end_idx = round(S1_time(j + 1)); 76 elseif j==length(S1_time) 77 start_idx = round(S1_time(j)); 78 end_idx = length(t); 79 end 80 if start_idx >= end_idx || end_idx > length(pcg) 81 S2_time(j) = NaN; % Or handle appropriately 82 continue; 83 end 84 range = start_idx:end_idx; 85 [~,peak_S2] = findpeaks(pcg(range).^2);% find S2 sounds on squared PCG 86 differences1 = peak_S2; % Relative to start of range 87 indices_logical= (differences1 < 0.5*fs) & (differences1 > 0.125*fs); %time filtering 88 peak_S2_index = find(indices_logical); 89 if ~isempty(peak_S2_index) 90 peak_S2 = peak_S2(peak_S2_index); 91 S2_time(j) = mean(start_idx + peak_S2); % Convert back to full signal index 92 else 93 S2_time(j) = NaN; % No valid peaks found 94 end 95 end |
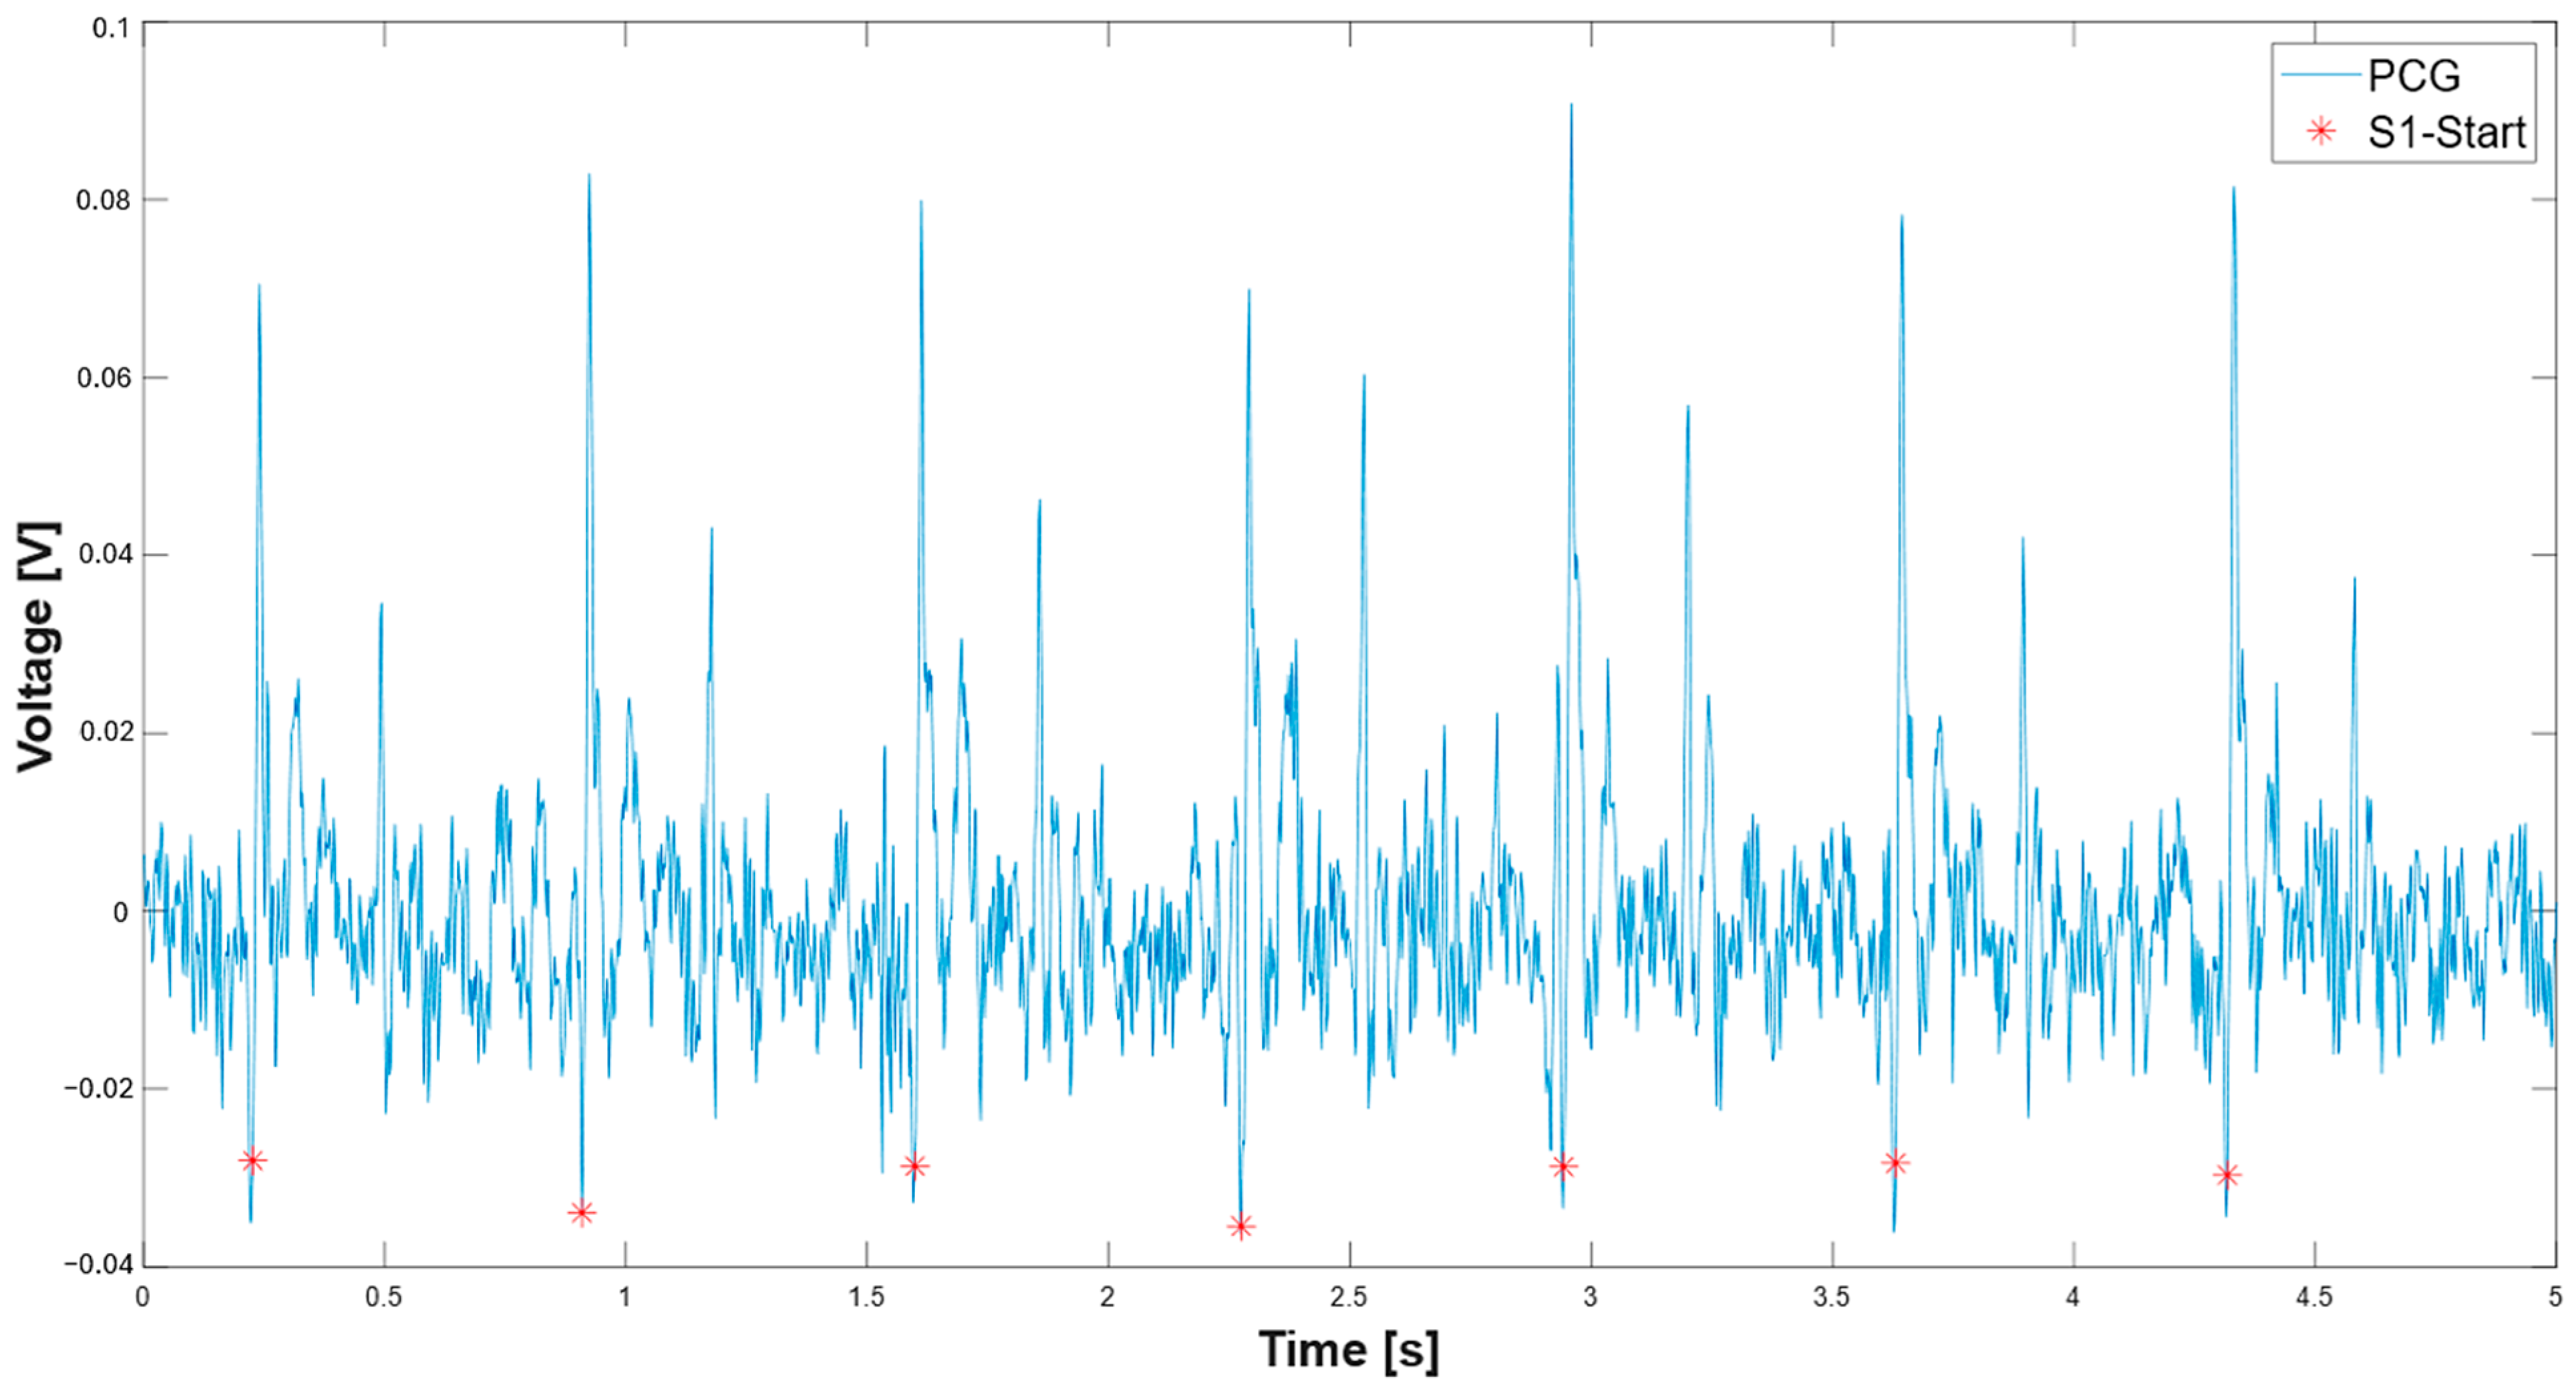
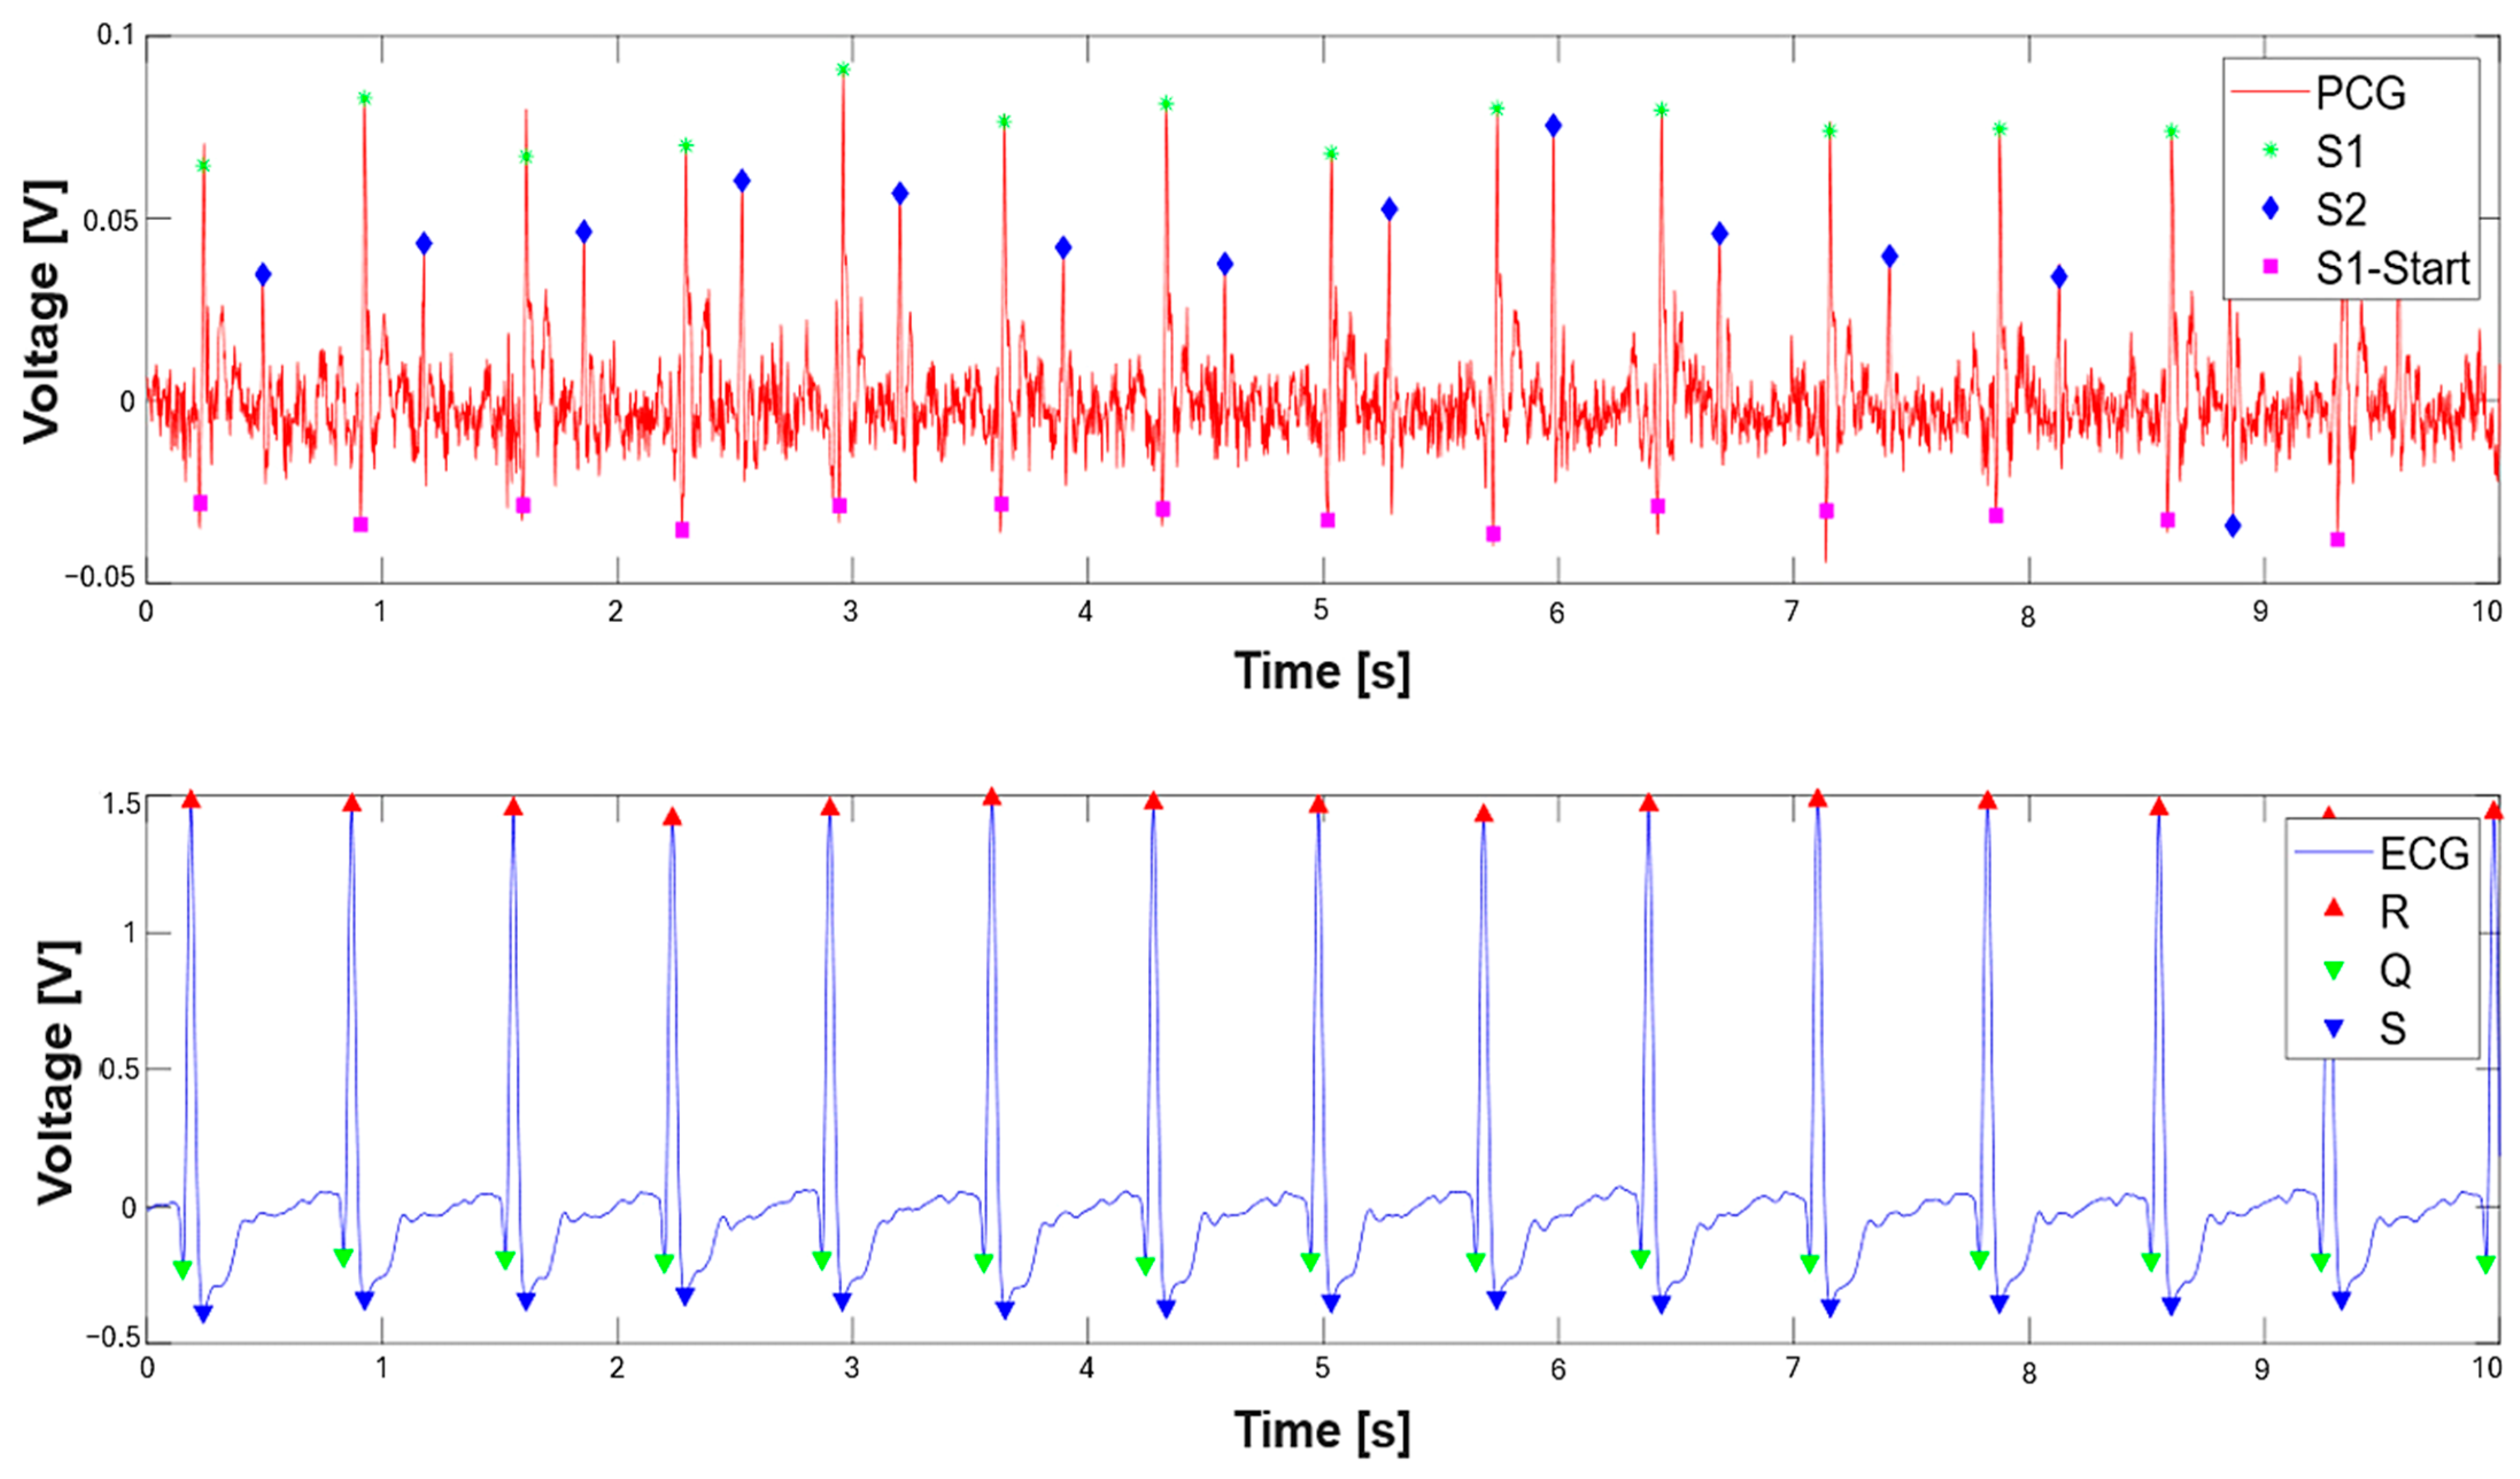
| 203 min_peak_distance_sec = 0.2; 204 min_peak_distance_samples = round(min_peak_distance_sec * fs); 205 inv_signal = -pcg;% inversion of the signal 206 S1_start_th = 0.2*max(-pcg);% adaptive threshold on S1 onset 207 [neg_peaks,neg_locs] = findpeaks(inv_signal,’MinPeakHeight’, S1_start_th,’MinPeakDistance’,min_peak_distance_samples) %find peaks on inverted signal; 208 % Find beginning of each negative peak 209 beginning_locs = zeros(size(neg_locs)); 210 for i = 1:length(neg_locs) 211 idx = neg_locs(i); 212 %Go backward until slope is no longer negative (signal starts falling) 213 while idx > 1 && pcg(idx) < pcg(idx - 1) 214 idx = idx - 1; 215 end 216 beginning_locs(i) = idx; 217 end 218 time_vector = (0:length(pcg)-1) / fs; 219 peak_times = time_vector(neg_locs); 220 S1_start = time_vector(beginning_locs) + t(1); |
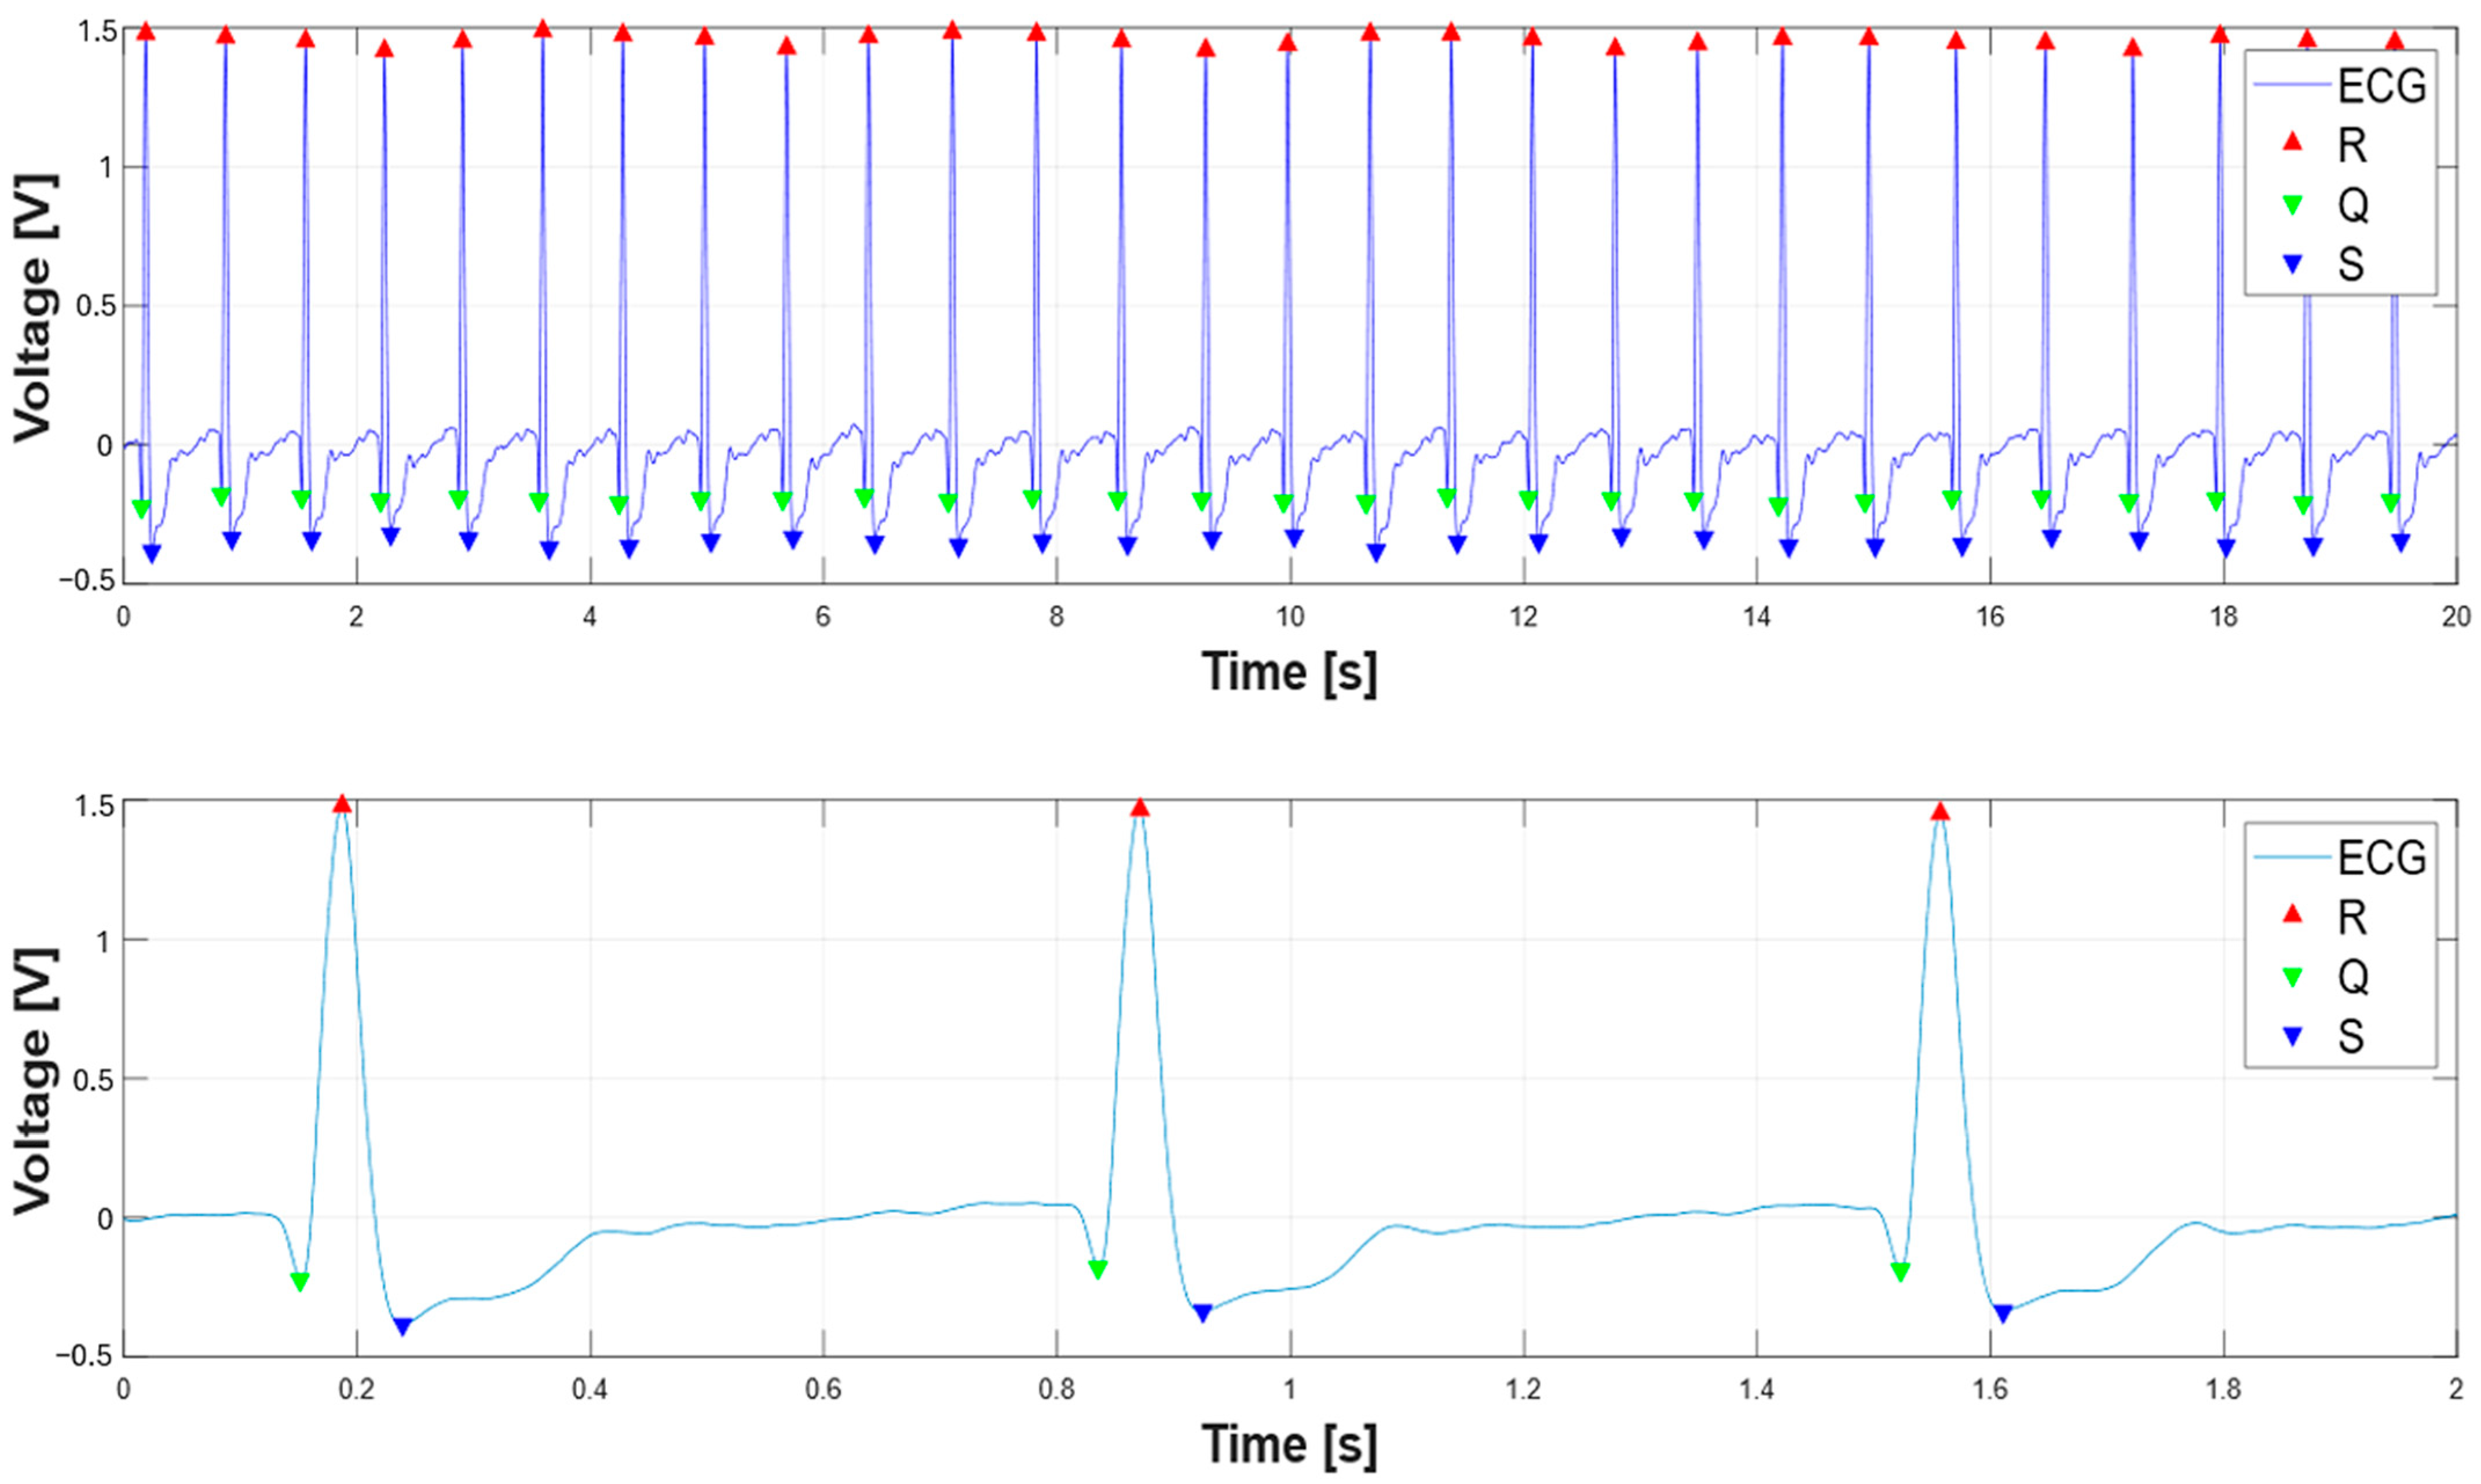
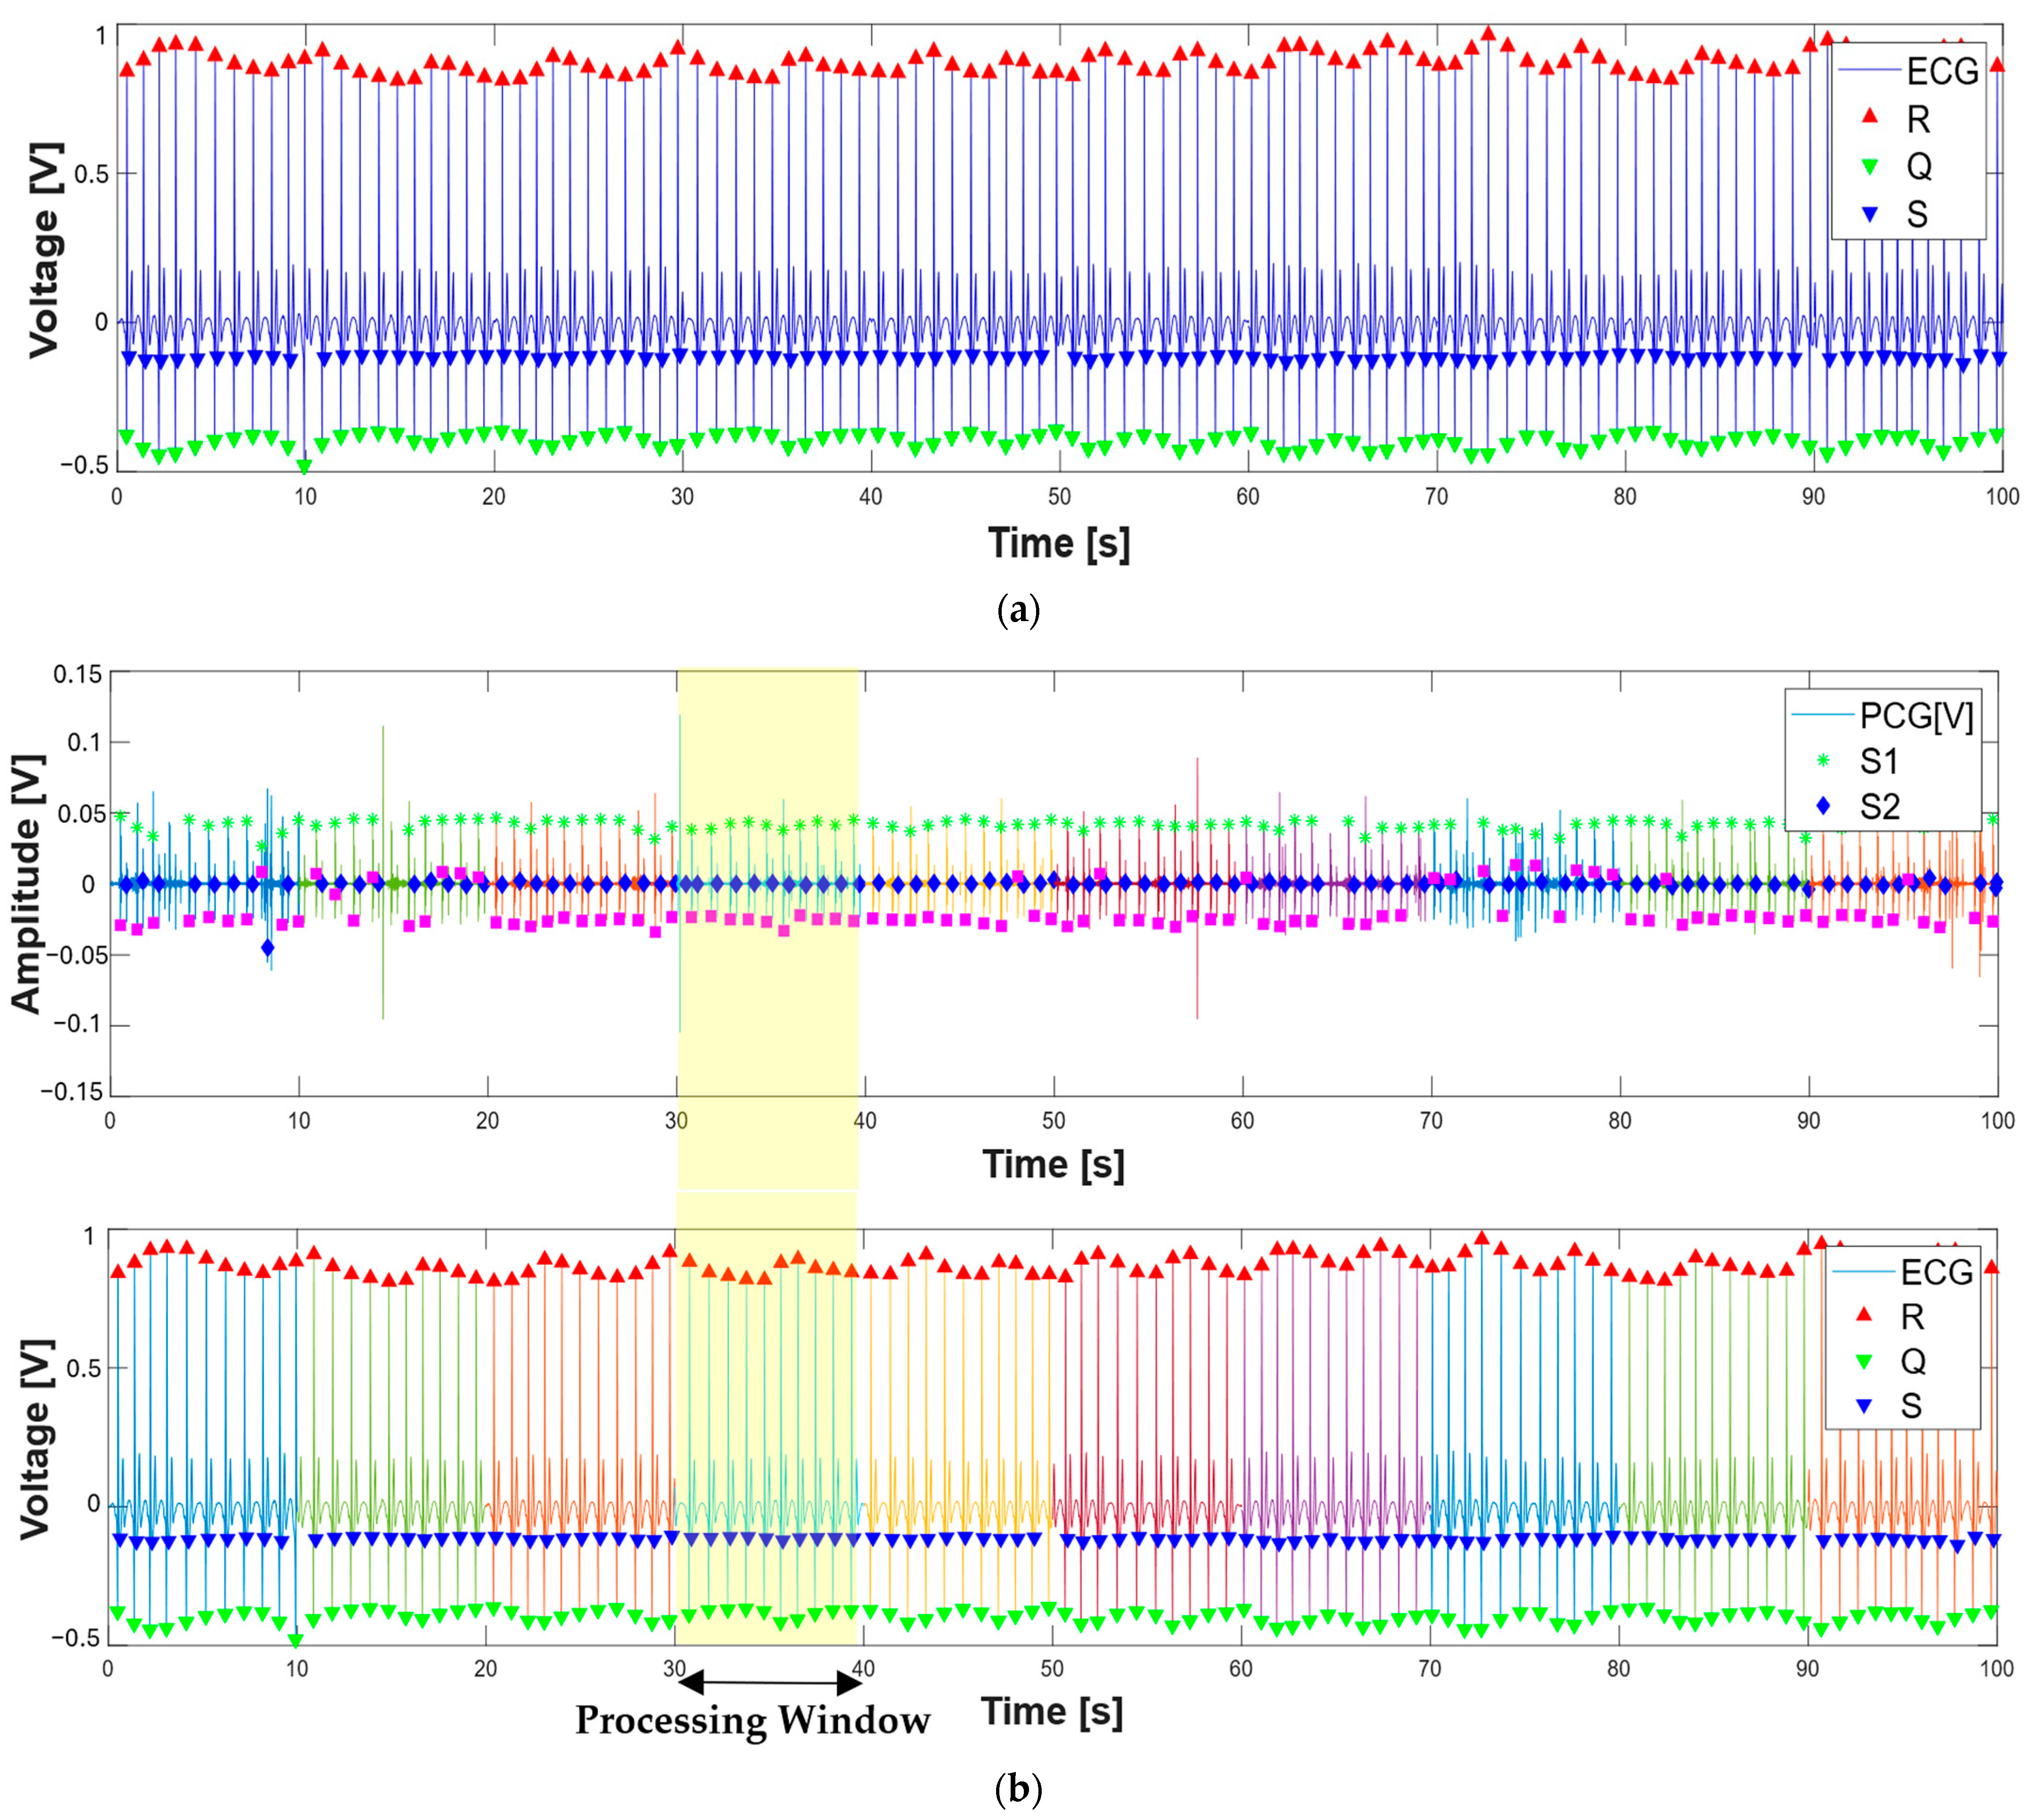
| %Find ECG peaks 270 R_peak_th = 0.5*max(ecg); 271 [R2,TR2] = findpeaks( ecg, t, ‘MinPeakHeight’, R_peak_th); 272 for i = 1:length(TR2)% starting from R-peak search for Q and S peaks 273 end_idx = find(t == TR2(i)); 274 if isempty(end_idx) 275 continue; % Skip if t doesn’t contain exact TR2(i) 276 end 277 start_idx = end_idx - 0.250*fs; 278 start_idx = max(start_idx, 1); % Ensure within bounds 279 start_idx1 = end_idx + 0.250*fs; 280 start_idx1 = min(start_idx1, length(t)); % Ensure within bounds 283 range = start_idx:end_idx; %range to left 284 range1 = end_idx:start_idx1;%range to right 286 if isempty(range) || isempty(range1) 287 continue; % Prevents findpeaks on empty vector 288 end 289 S_th = 0.2*max(-ecg); %threshold on S-peaks 290 range_time_span = t(range1(end)) - t(range1(1)); % time threshold for Q-peak search 291 min_peak_distance = min(0.05,0.9*range_time_span); % for safety 292 [Q2(i),TQ2(i)] = findpeaks(-ecg(range),t(range),’MinPeakHeight’, 0.1); %find Q-peak 293 [qs, ts] = findpeaks(-ecg(range1), t(range1), ... 294 ‘MinPeakHeight’, S_th, ‘MinPeakDistance’, min_peak_distance); |
3. Results
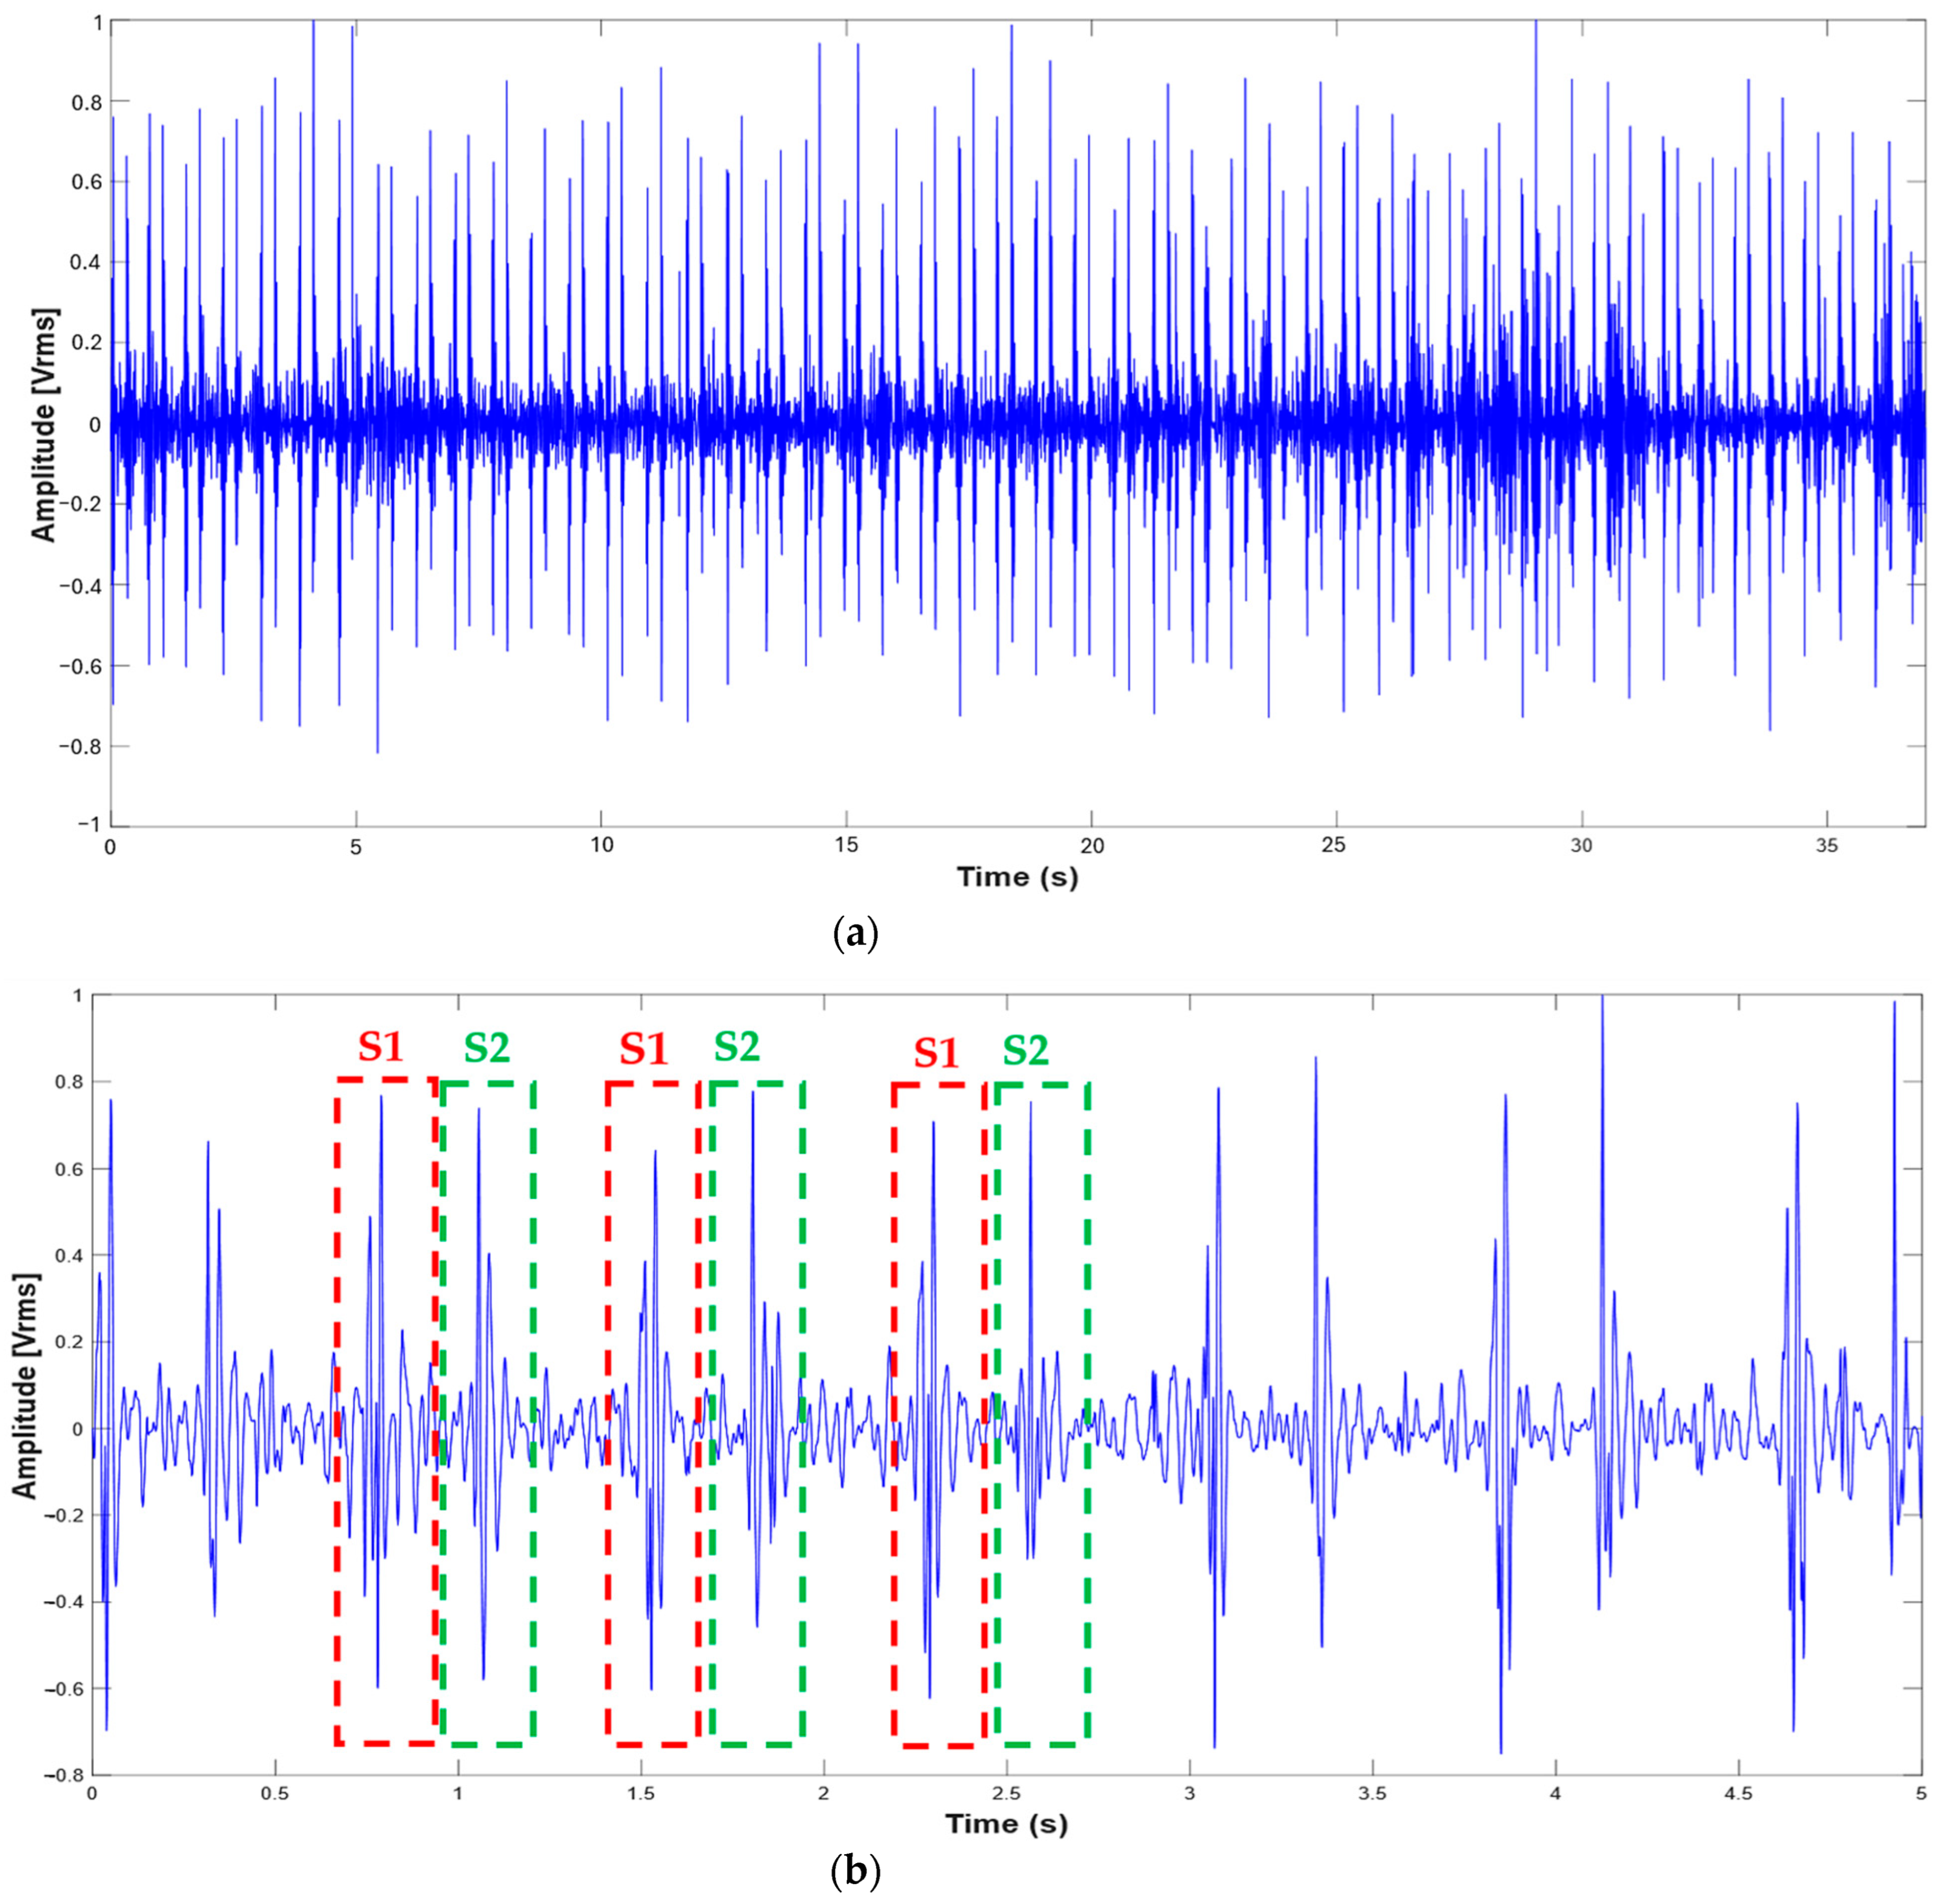
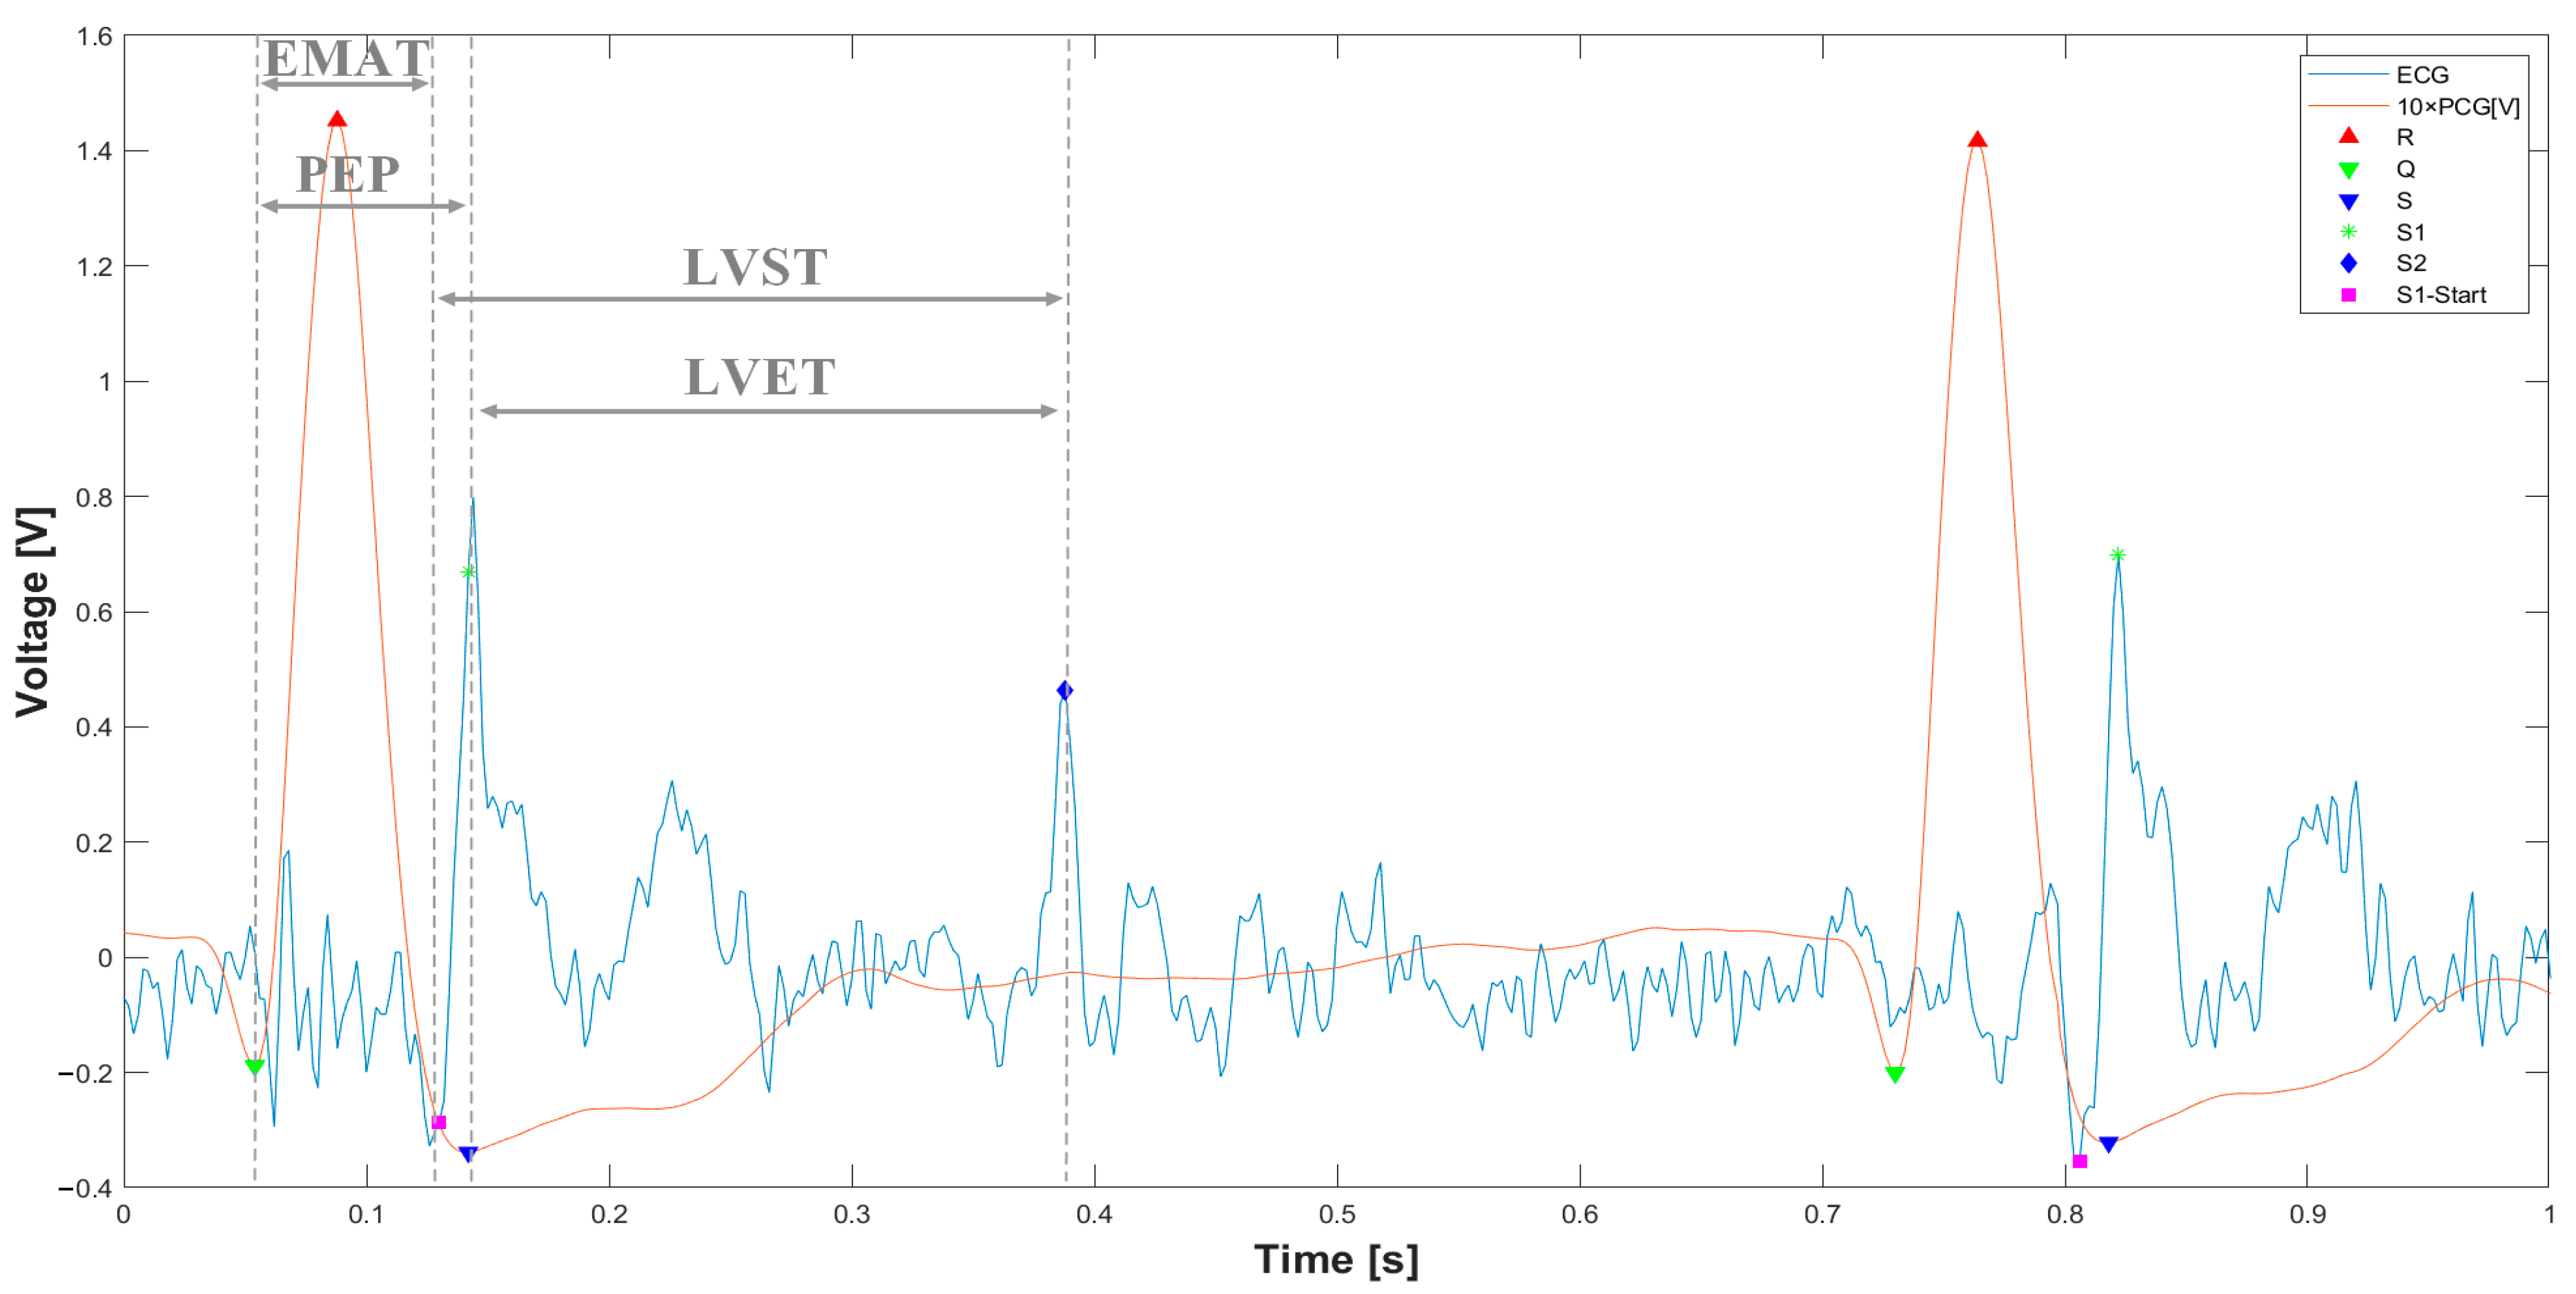
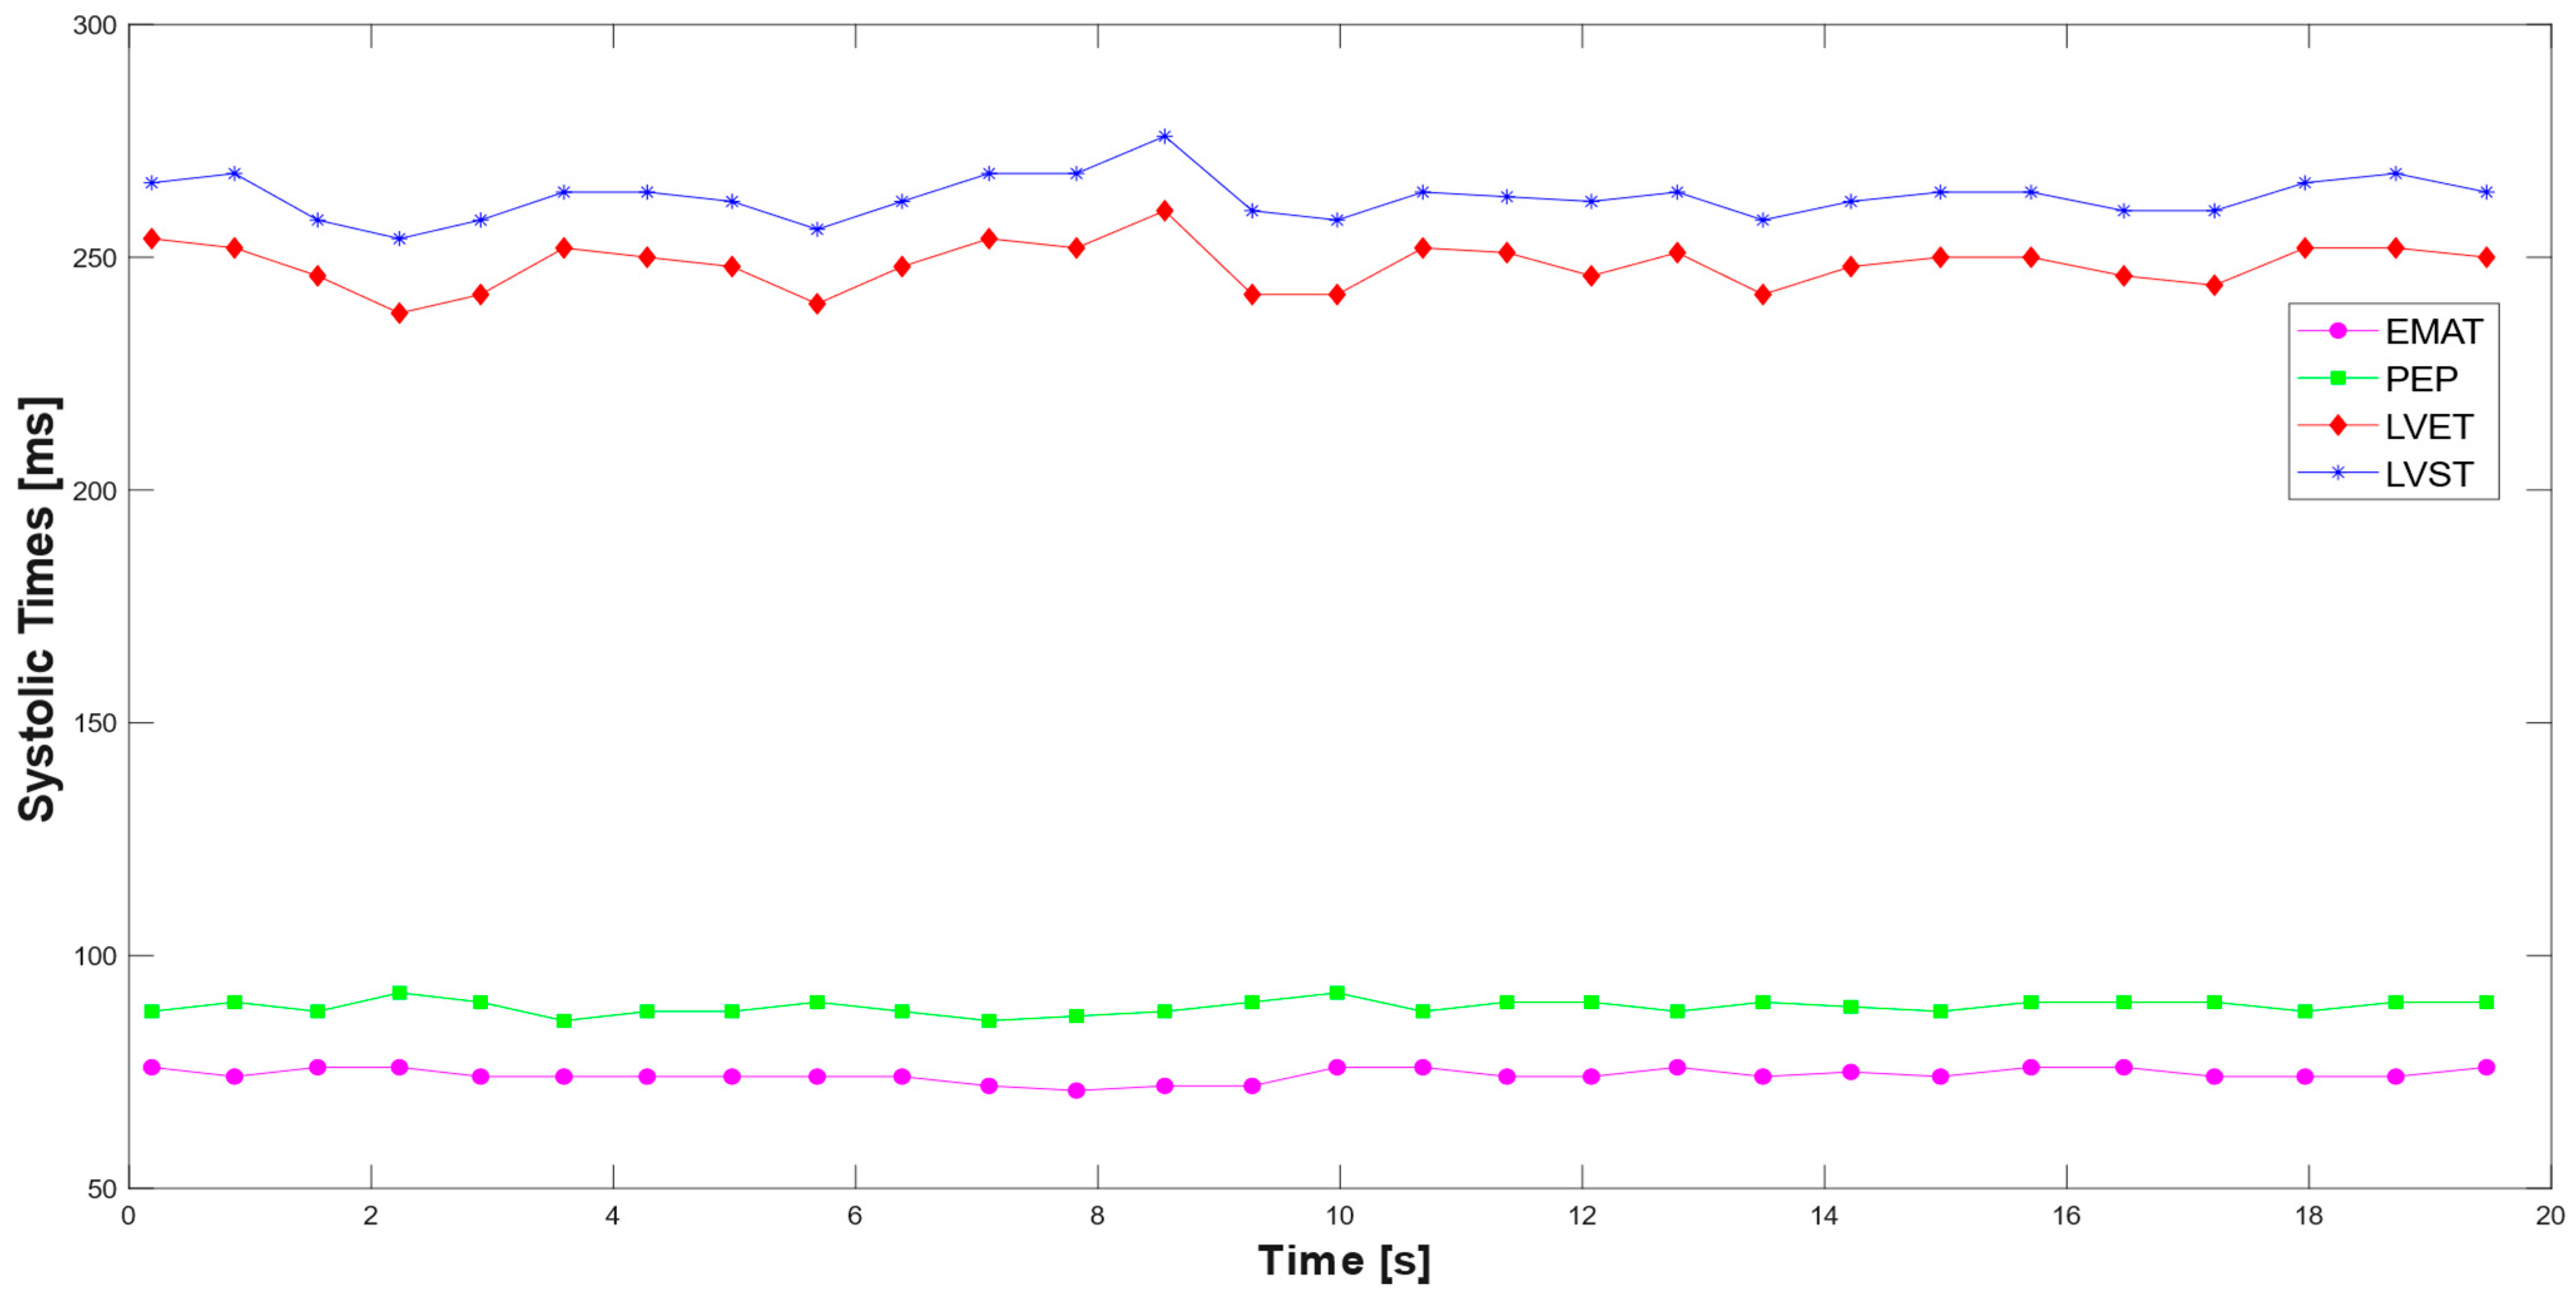
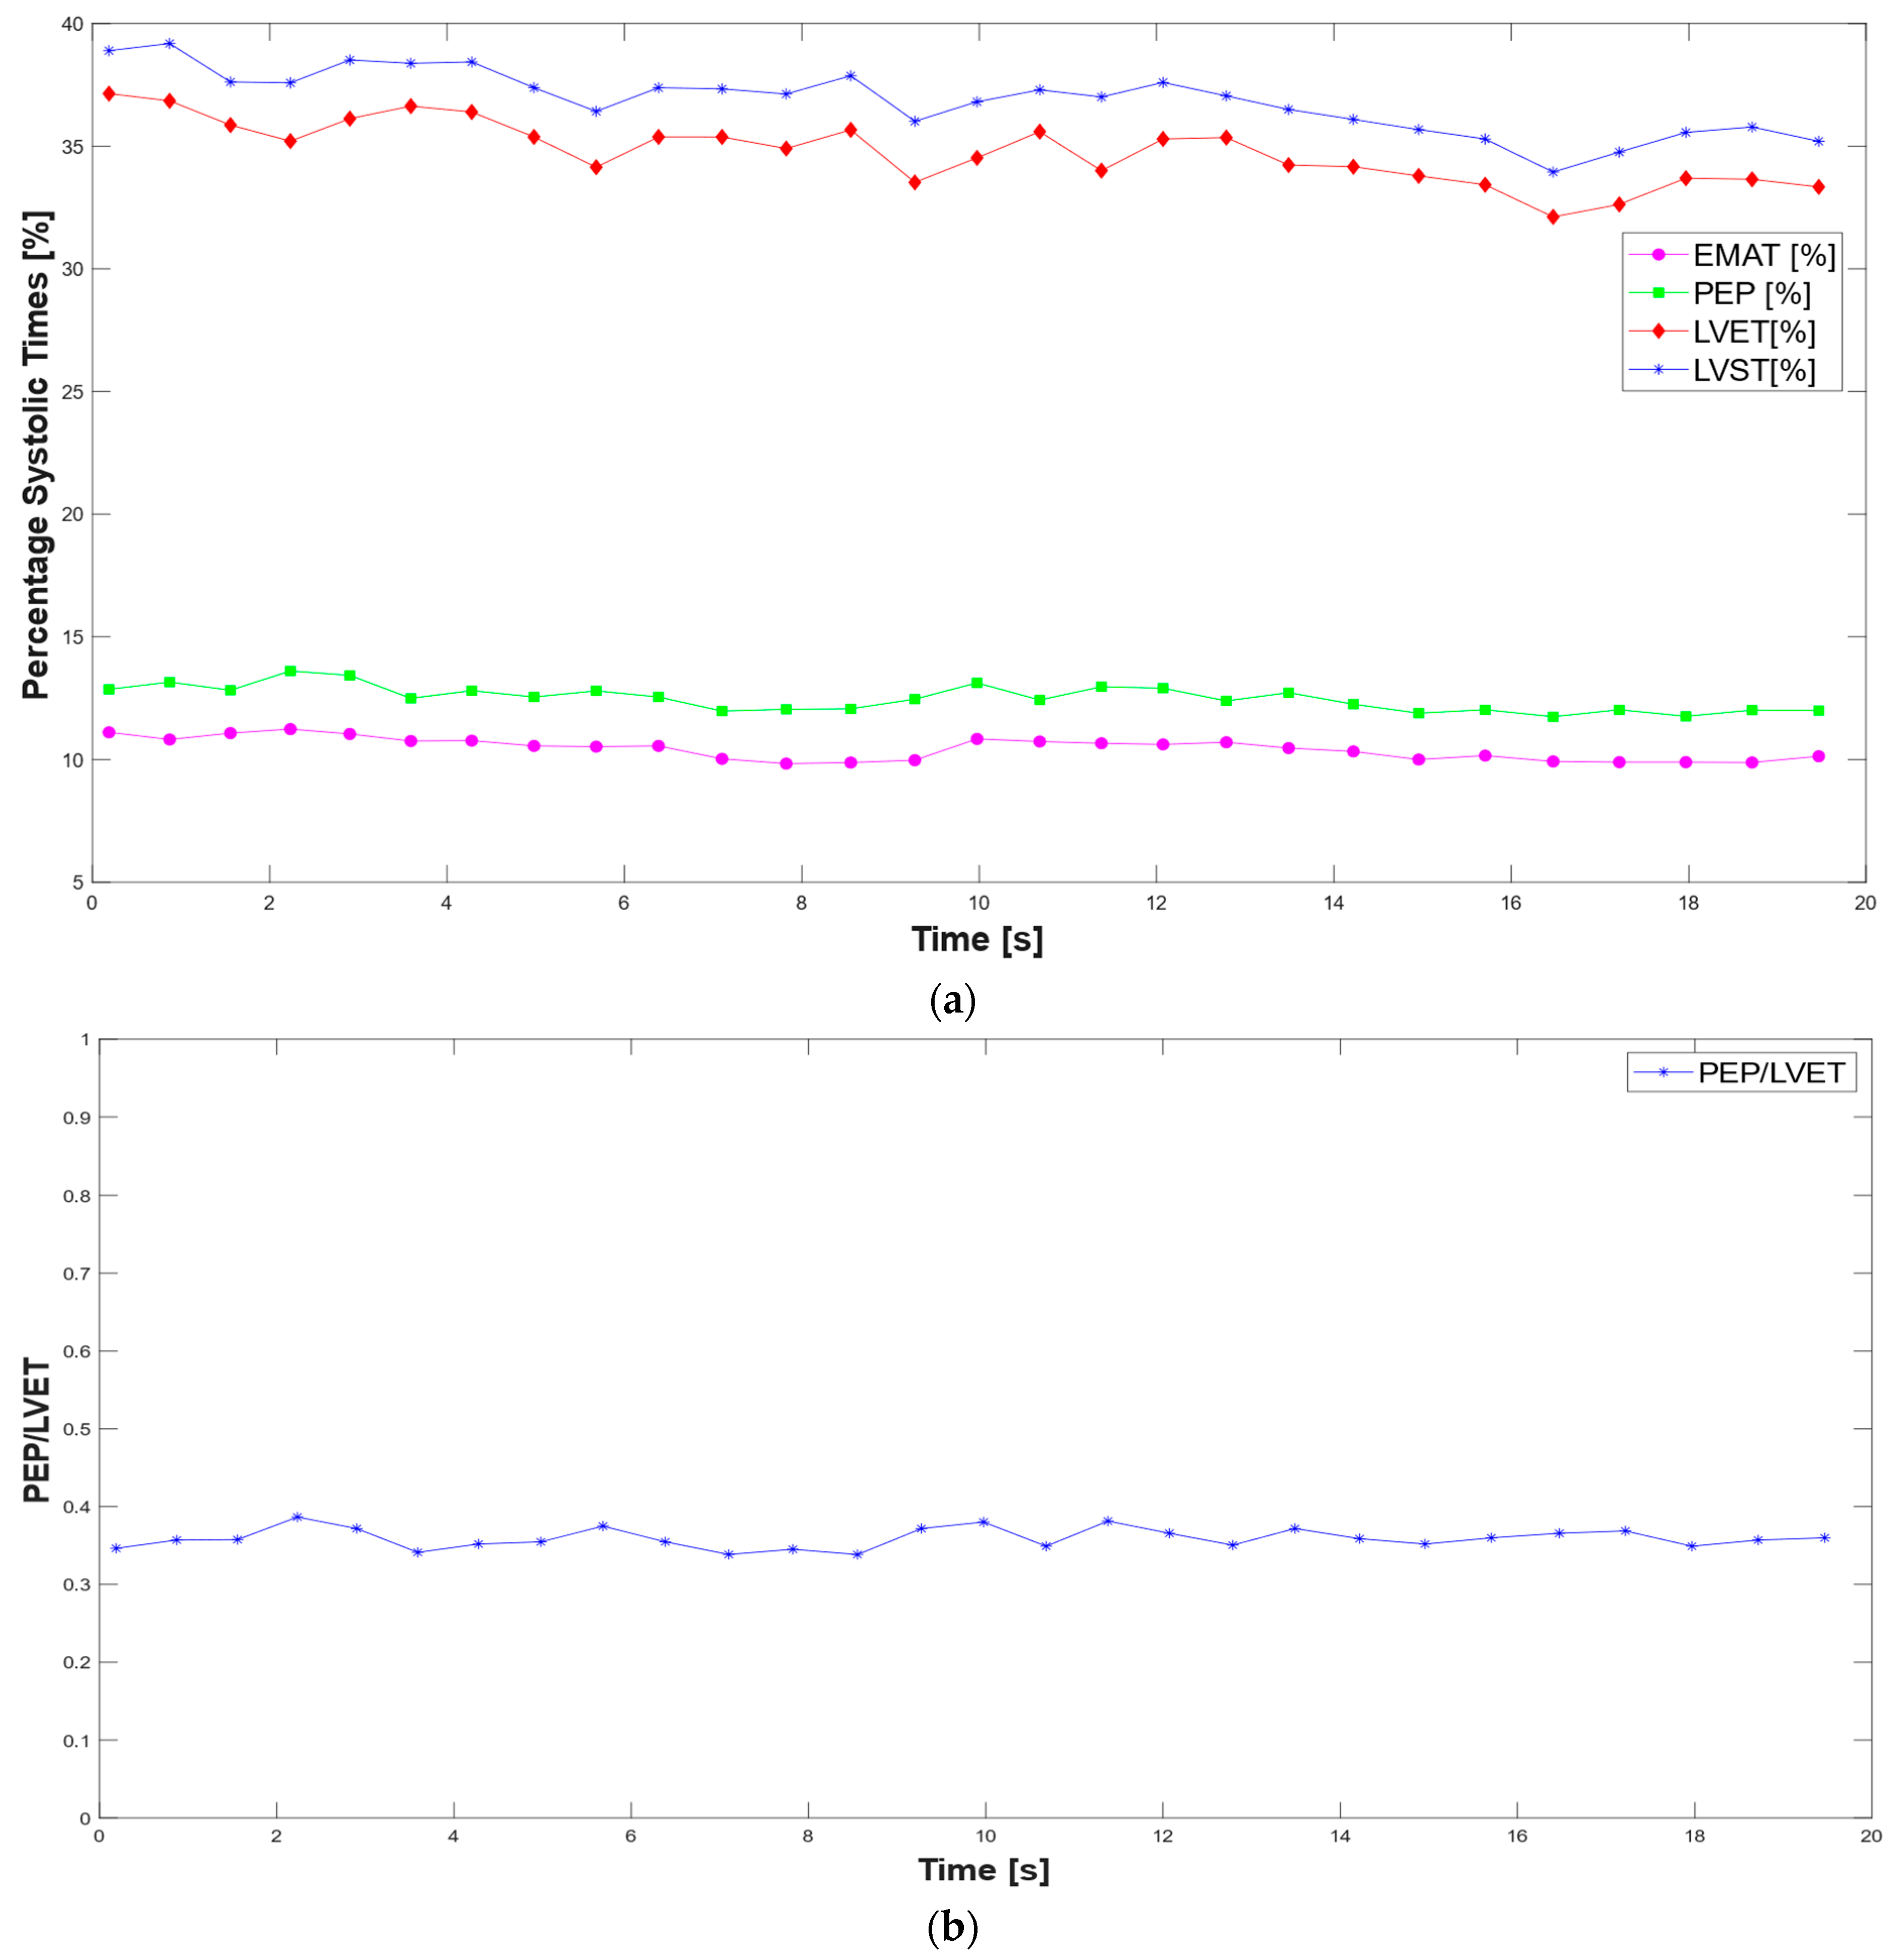
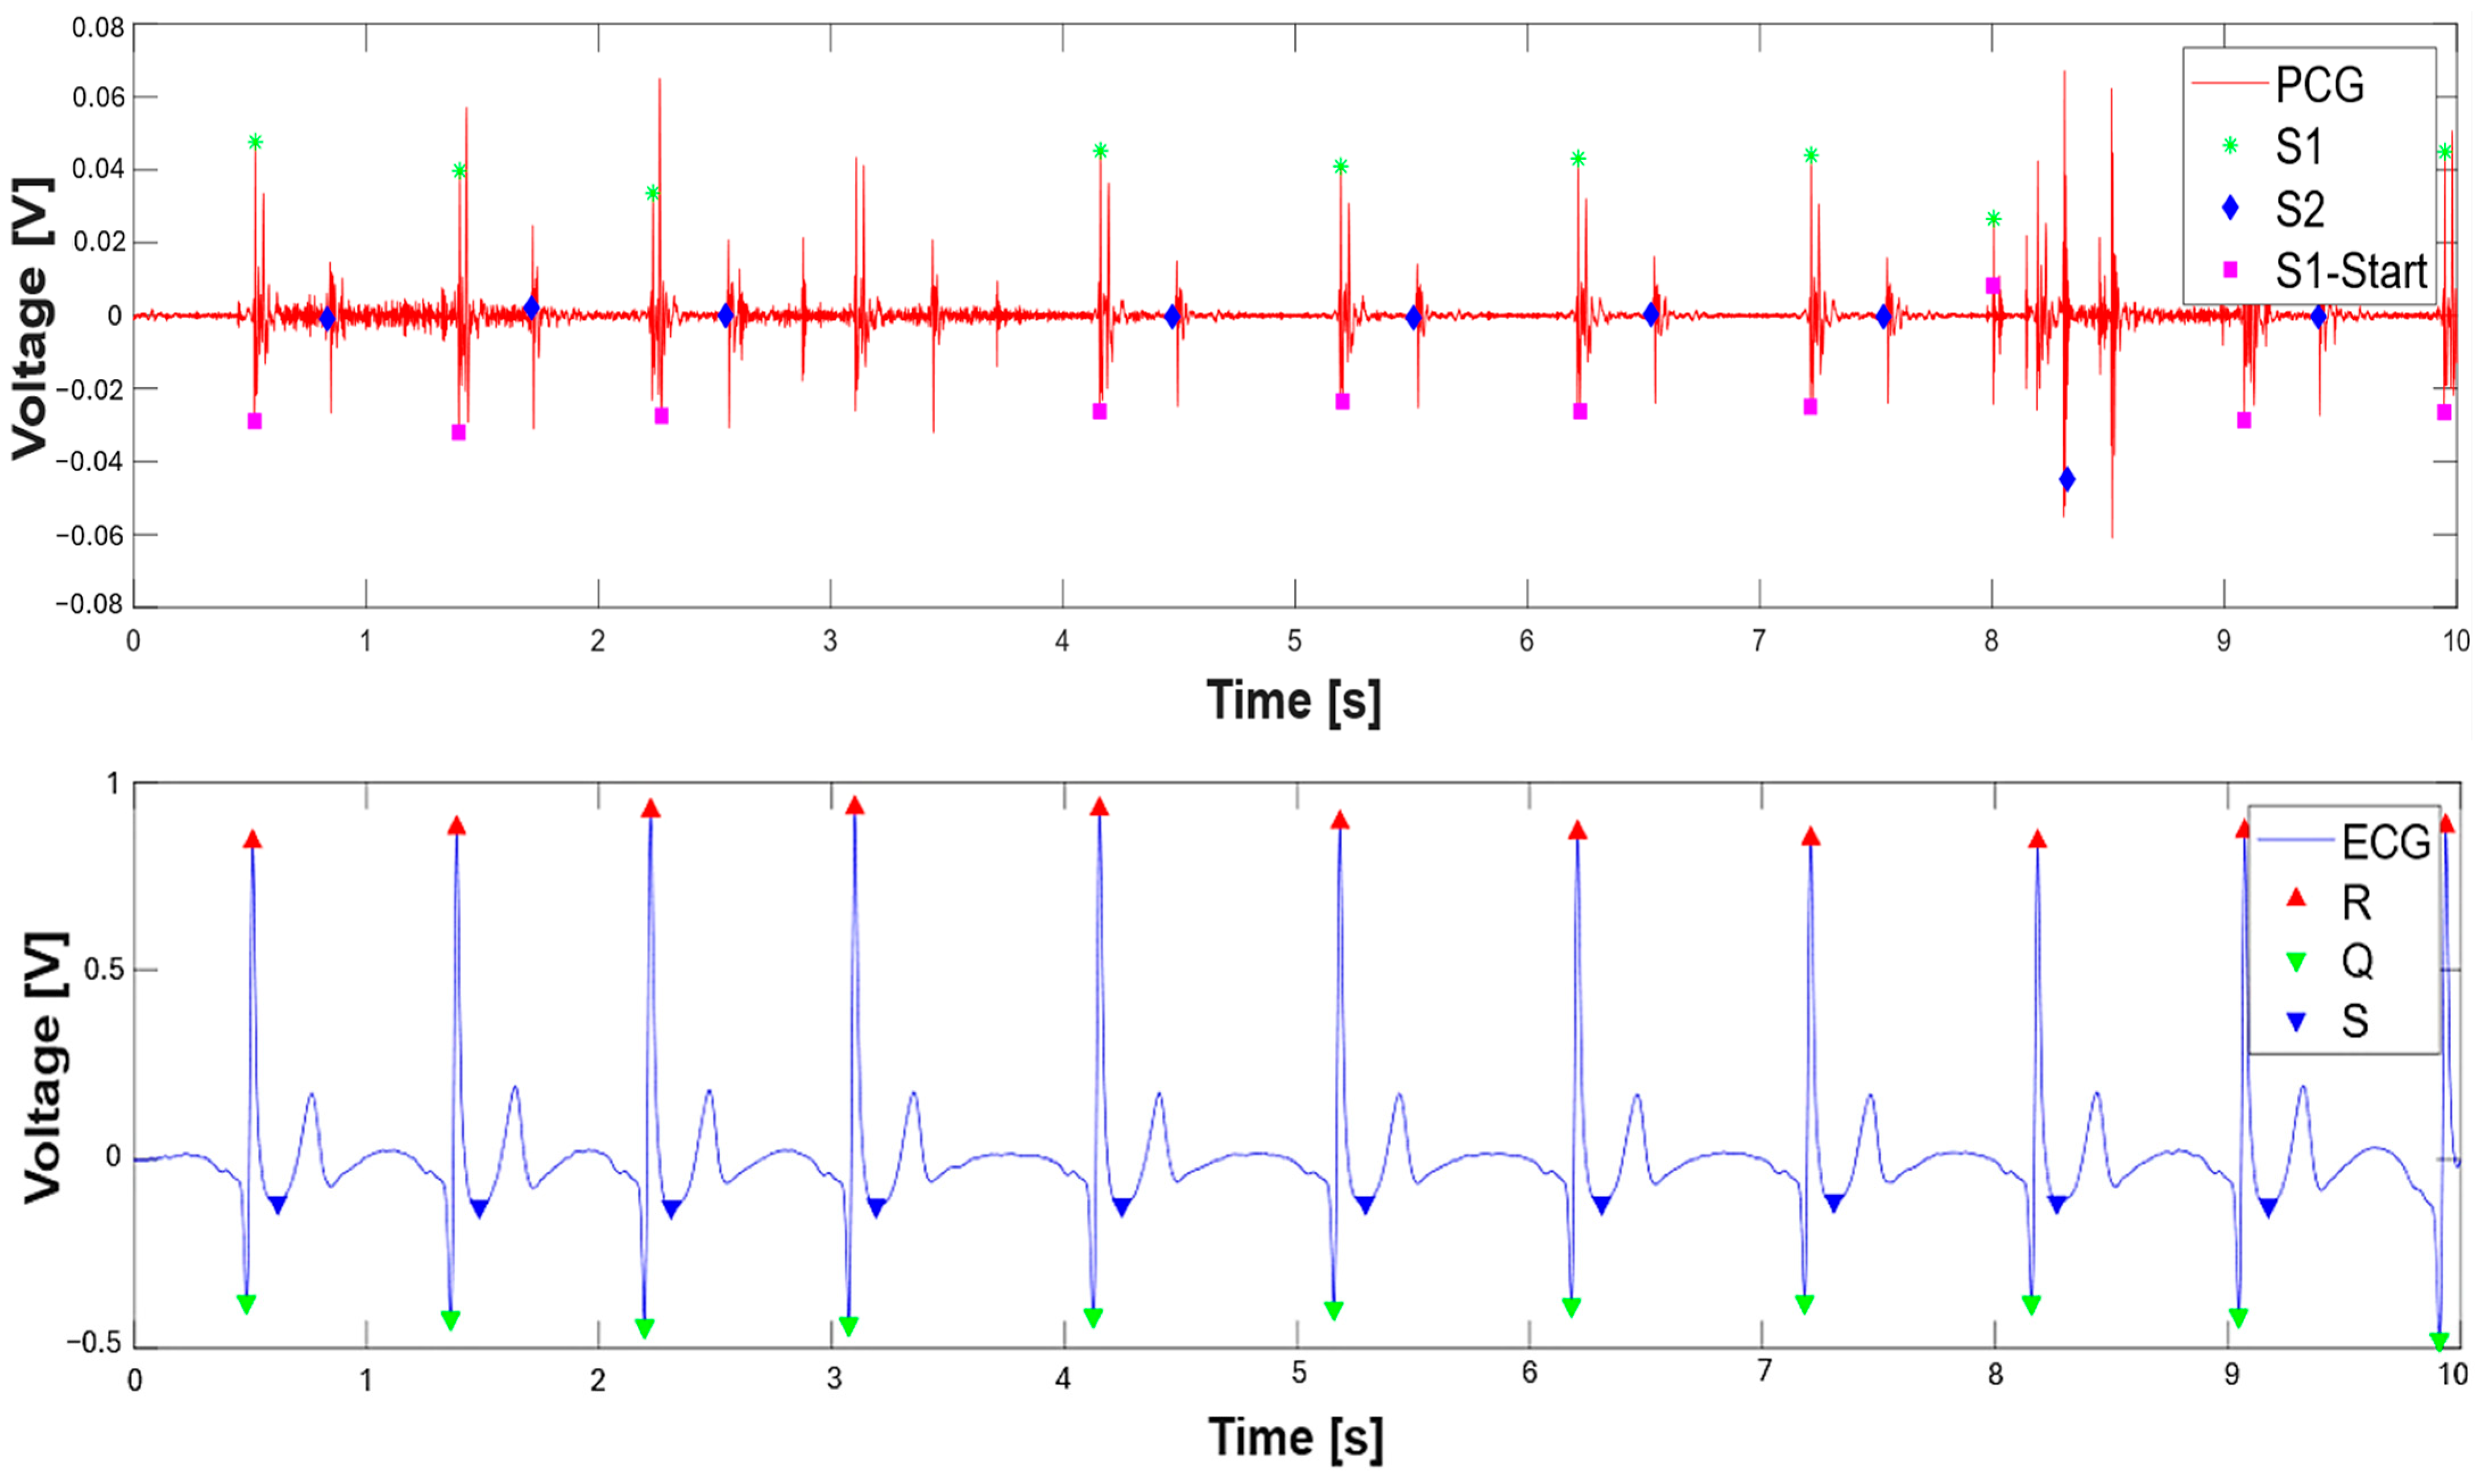
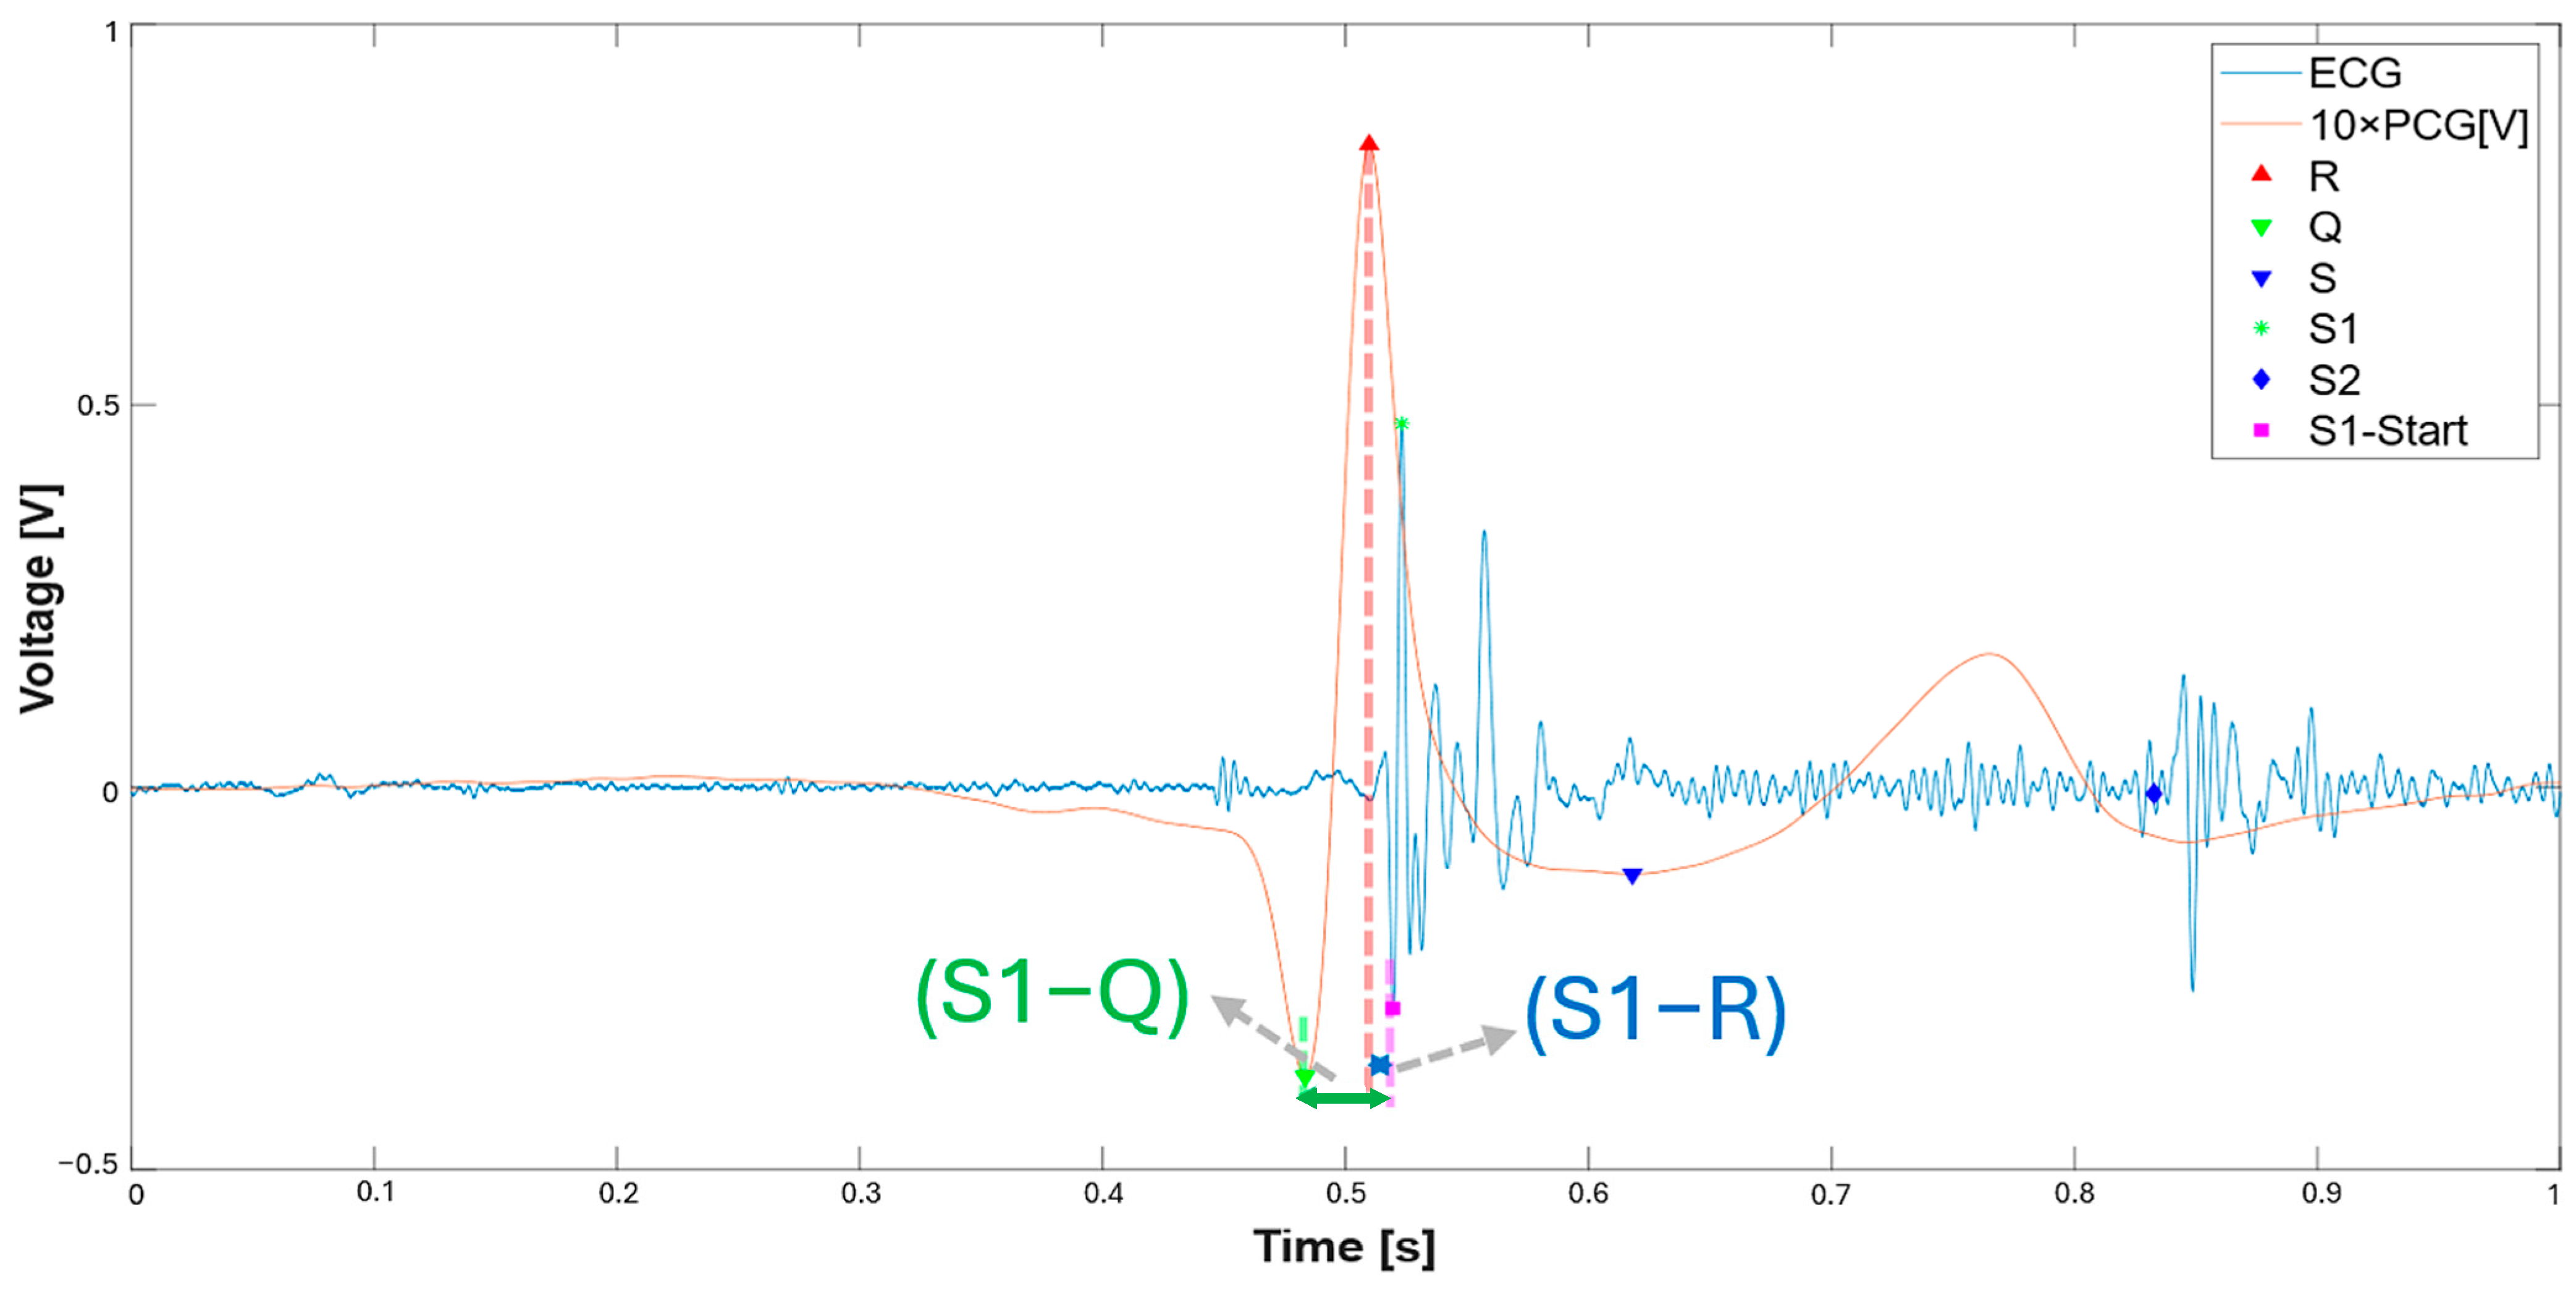
3.1. Extraction of the Systolic Times from PCG and ECG Processing
| 412 % Calculate systolic times 413 EMAT = (S1_start-TQ2)*1000; 414 PEP = (S1_time_-TQ2)*1000; 415 LVET = (S2_time_-S1_time_)*1000; 416 LVST = (S2_time_’-S1_start)*1000; 417 S1R = (S1_start-TR2)*1000; |
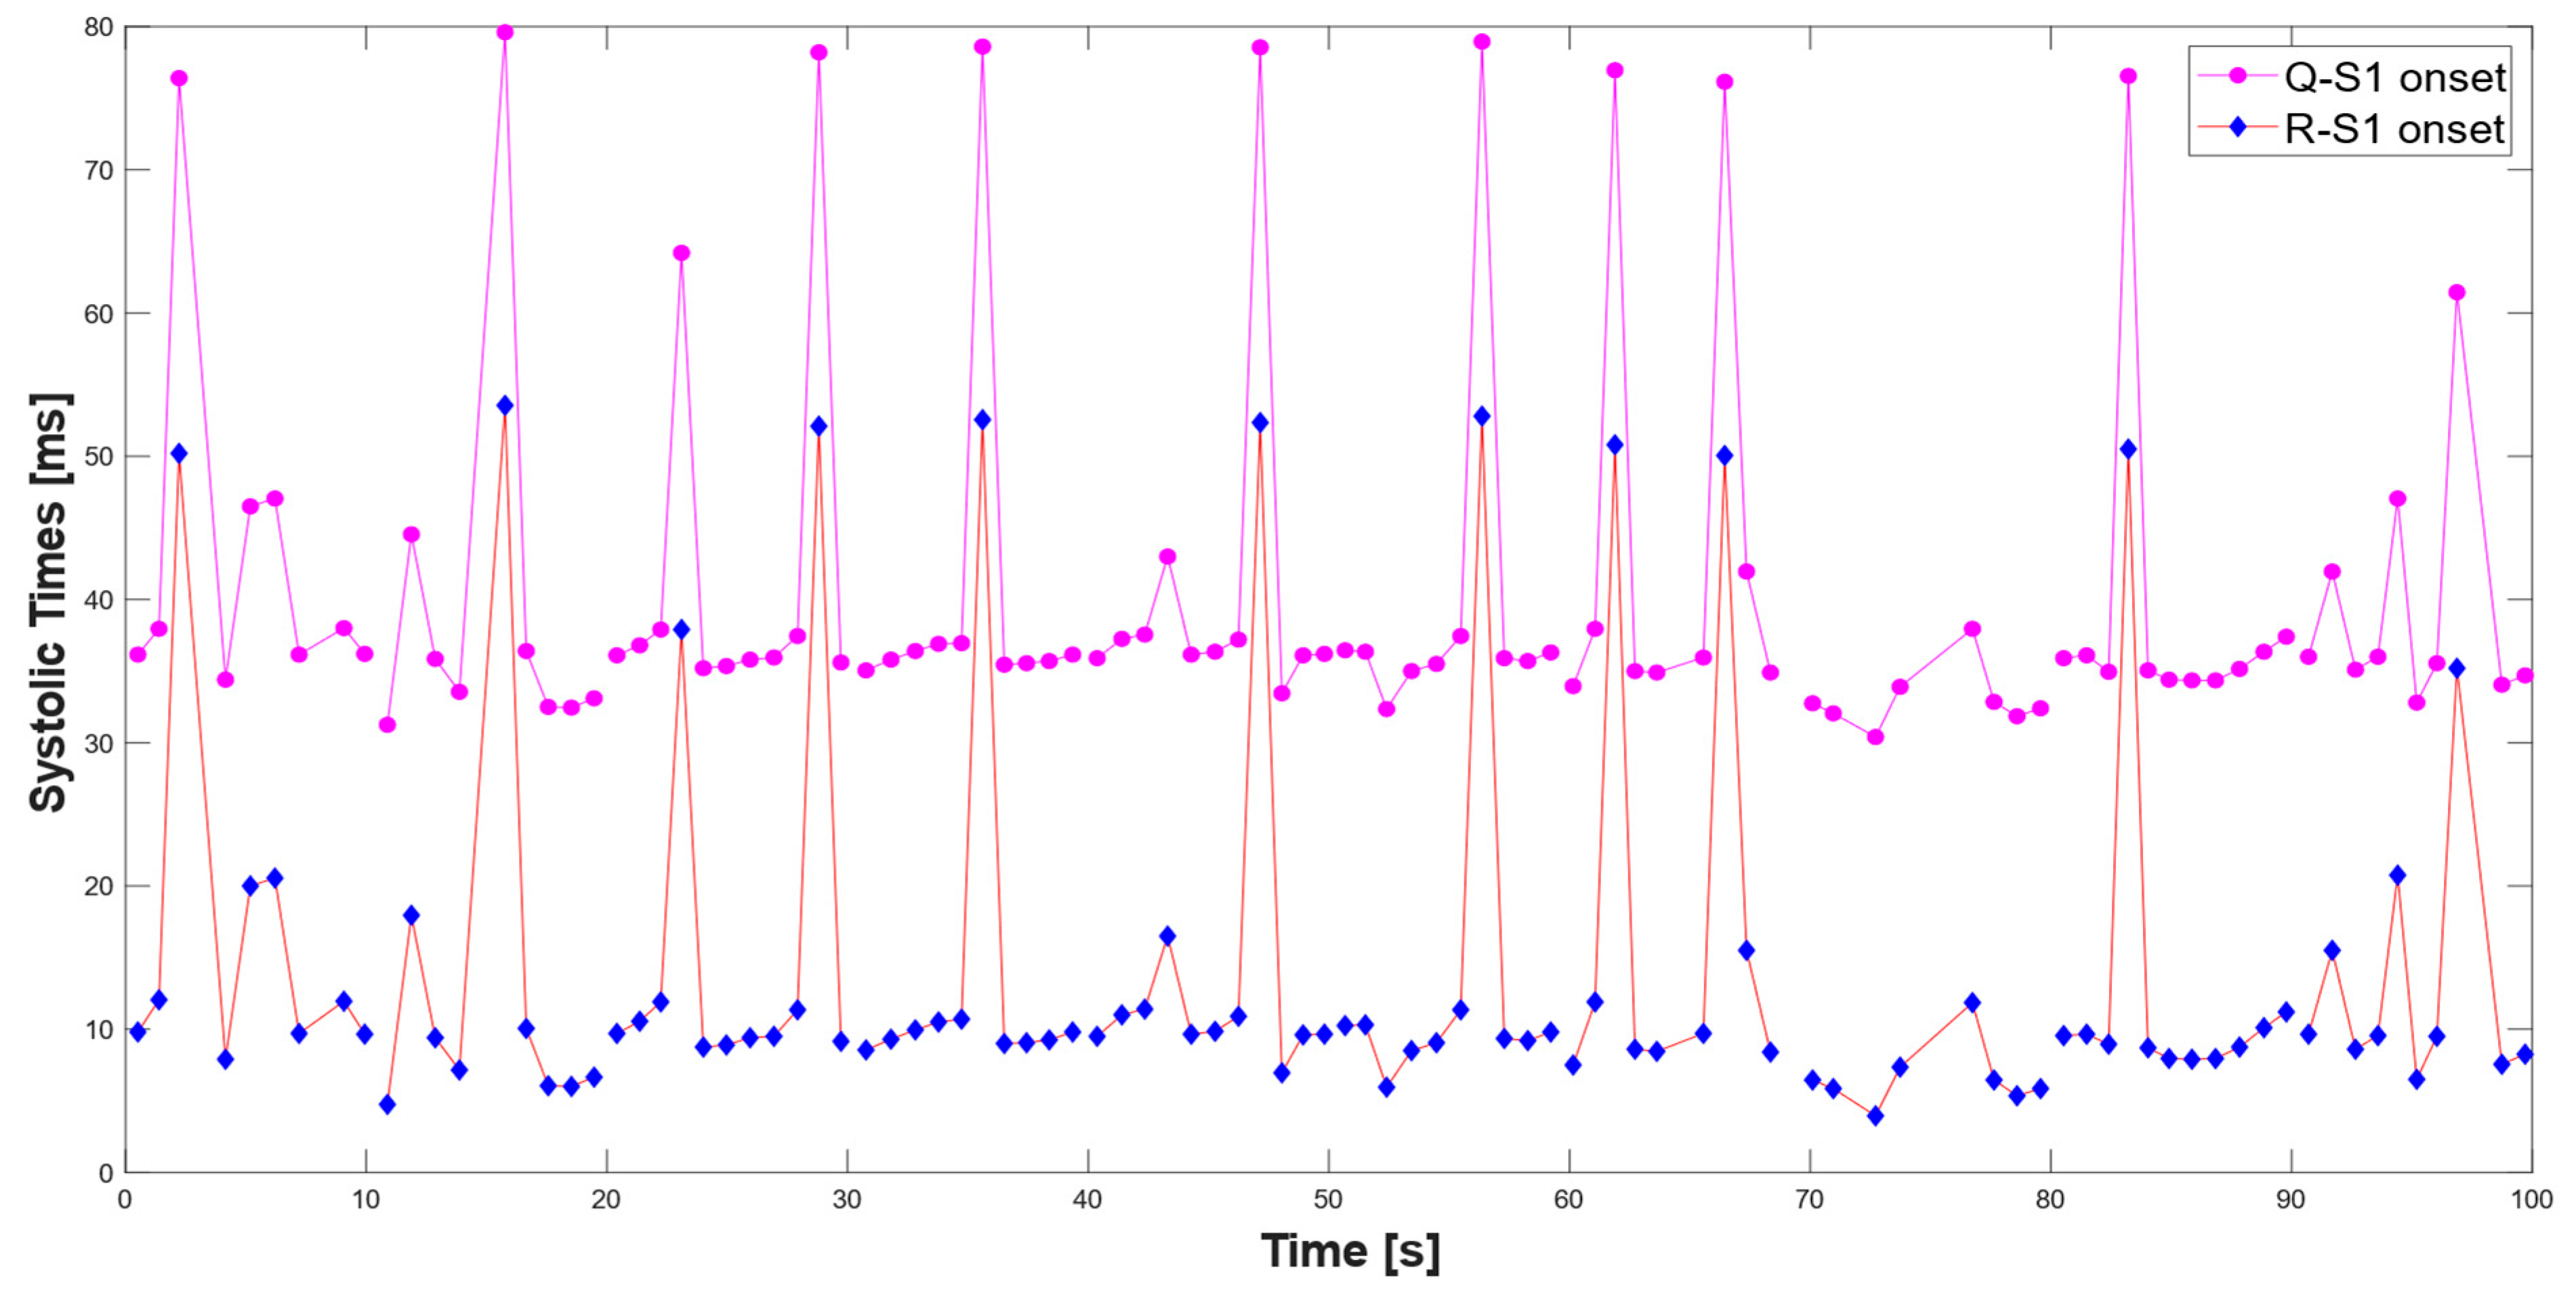
3.2. Validation of the Proposed Method for Systolic Time Estimation
4. Discussion
Analysis of Numerical Results for Validation of the Proposed Algorithm for Systolic Time Measurement
5. Conclusions
Supplementary Materials
Author Contributions
Funding
Institutional Review Board Statement
Informed Consent Statement
Data Availability Statement
Acknowledgments
Conflicts of Interest
Abbreviations
| ECG | Electrocardiography |
| PCG | Phonocardiography |
| EMAT | Electromechanical Activation Time |
| PEP | Pre-Ejection Period |
| LVET | Left Ventricular Ejection Time |
| LVST | Left Ventricular Systolic Time |
| S1 | First Heart Sound |
| S2 | Second Heart Sound |
| S3 | Third Heart Sound |
| S4 | Fourth Heart Sound |
| MEMS | Micro-Electromechanical Systems |
| ECM | Electret Condenser Microphones |
| MCU | Microcontroller Unit |
| FPGA | Field-Programmable Gate Array |
| FIR | Finite Impulse Response |
| SNR | Signal-to-Noise Ratio |
| PPG | Photoplethysmogram |
| EICF | Exercised-Induced Cardiac Fatigue |
| DL | Deep Learning |
| DWT | Discrete Wavelet Transform |
| LR-HSMM | Logistic Regression Hidden Semi-Markov Model |
| FDC-FS | Feature-Based Fusion Model |
| MFCC | Mel-Frequency Cepstrum Coefficient |
| CNNs | Convolutional Neural Networks |
| CAD | Coronary Artery Disease |
| ResNet | Residual Neural Network |
| AS | Aortic Stenosis |
| MR | Mitral Regurgitation |
| MS | Mitral Stenosis |
| MVP | Mitral Valve Prolapse |
| RF | Random Forest |
| CVD | Cardiovascular Disease |
| CHF | Chronic Heart Failure |
| CTIs | Cardiac Time Intervals |
| GKVDLNN | Gaussian Kaiming Variance-based Deep Learning Neural Network |
| IEMD | Improved Empirical Mode Decomposition |
| PEP | Pre-Ejection Period |
| TDNN | Time Delay Neural Network |
| CMRR | Common Mode Rejection Ratio |
| LED | Light-Emitting Diode |
| SoC | System on Chip |
| IoT | Internet of Things |
| BLE | Bluetooth Low Energy |
| IVS | Interventricular Septum |
| HFrEF | Heart Failure with Reduced Ejection Fraction |
| AMI | Acute Myocardial Infarction |
| LVEF | Left Ventricular Ejection Fraction |
| MACE | Major Adverse Cardiovascular Events |
| STEMI | ST-elevated myocardial infarction |
| LVEDP | Left Ventricular End-Diastolic Pressure |
References
- Rosiek, A.; Leksowski, K. The risk factors and prevention of cardiovascular disease: The importance of electrocardiogram in the diagnosis and treatment of acute coronary syndrome. Therap. Clin. Risk Manag. 2016, 12, 1223–1229. [Google Scholar] [CrossRef] [PubMed]
- Al-Naami, B.; Fraihat, H.; Owida, H.A.; Al-Hamad, K.; De Fazio, R.; Visconti, P. Automated Detection of Left Bundle Branch Block from ECG Signal Utilizing the Maximal Overlap Discrete Wavelet Transform with ANFIS. Computers 2022, 11, 93. [Google Scholar] [CrossRef]
- Delgado-Trejos, E.; Quiceno-Manrique, A.F.; Godino-Llorente, J.I.; Blanco-Velasco, M.; Castellanos-Dominguez, G. Digital Auscultation Analysis for Heart Murmur Detection. Ann. Biomed. Eng. 2009, 37, 337–353. [Google Scholar] [CrossRef]
- Ganguly, A.; Sharma, M. Digital Auscultation Analysis for Heart Murmur Detection. J. Appl. Adv. Res. 2017, 2, 200–205. [Google Scholar] [CrossRef]
- Nabih-Ali, M.; El-Dahshan, E.-S.A.; Yahia, A.S. Heart Diseases Diagnosis Using Intelligent Algorithm Based on PCG Signal Analysis. Circuits Syst. 2017, 8, 81–85. [Google Scholar] [CrossRef]
- De Fazio, R.; Spongano, L.; De Vittorio, M.; Patrono, L.; Visconti, P. Machine Learning Algorithms for Processing and Classifying Unsegmented Phonocardiographic Signals: An Efficient Edge Computing Solution Suitable for Wearable Devices. Sensors 2024, 24, 3853. [Google Scholar] [CrossRef]
- Spongano, L.; De Fazio, R.; De Vittorio, M.; Patrono, L.; Visconti, P. PCG Signal Acquisition and Classification for Heart Failure Detection: Recent Advances and Implementation of Memory-Efficient Classifiers for Edge Computing-Based Wearable Devices. In Proceedings of the 2024 9th International Conference on Smart and Sustainable Technologies (SpliTech), Bohr, Croatia, 25–28 June 2024. [Google Scholar]
- Ismail, S.; Siddiqi, I.; Akram, U. Localization and Classification of Heart Beats in Phonocardiography Signals—A Comprehensive Review. EURASIP J. Adv. Signal Process. 2018, 26, 26. [Google Scholar] [CrossRef]
- Abbas, A.K.; Bassam, R. Phonocardiography Signal Processing. In Synthesis Lectures on Biomedical Engineering, 1st ed.; Springer International Publishing: Cham, Switzerland, 2009; Volume 4, p. 218. [Google Scholar]
- Lee, S.-Y.; Huang, P.-W.; Chiou, J.-R.; Tsou, C.; Liao, Y.-Y.; Chen, J.-Y. Electrocardiogram and Phonocardiogram Monitoring System for Cardiac Auscultation. IEEE Trans. Biomed. Circuits Syst. 2019, 13, 1471–1482. [Google Scholar] [CrossRef]
- Chakir, F.; Jilbab, A.; Nacir, C.; Hammouch, A. Recognition of Cardiac Abnormalities from Synchronized ECG and PCG Signals. Phys. Eng. Sci. Med. 2020, 43, 673–677. [Google Scholar] [CrossRef]
- Zang, J.; An, Q.; Li, B.; Zhang, Z.; Gao, L.; Xue, C. A Novel Wearable Device Integrating ECG and PCG for Cardiac Health Monitoring. Microsyst. Nanoeng. 2025, 11, 7. [Google Scholar] [CrossRef]
- Kamavuako, E.; Bao, X. BSSLAB Localized ECG Data 2023, King’s College London. Available online: https://kcl.figshare.com/articles/dataset/BSSLAB_Localized_ECG_Data/21977186/1 (accessed on 24 April 2025).
- Bao, X.; Deng, Y.; Gall, N.; Kamavuako, E. Analysis of ECG and PCG Time Delay around Auscultation Sites. In Proceedings of the 13th International Joint Conference on Biomedical Engineering Systems and Technologies, Valletta, Malta, 24–26 February 2020; pp. 206–213. [Google Scholar]
- Cui, J.; Li, Y.; Yang, Y.; Shi, P.; Wang, B.; Wang, S.; Zhang, G.; Zhang, W. Design and Optimization of MEMS Heart Sound Sensor Based on Bionic Structure. Sens. Actuators A Phys. 2022, 333, 113188. [Google Scholar] [CrossRef]
- Wang, T.; Gong, M.; Yu, X.; Lan, G.; Shi, Y. Acoustic-Pressure Sensor Array System for Cardiac-Sound Acquisition. Biomed. Signal Process. Control 2021, 69, 102836. [Google Scholar] [CrossRef]
- Lee, S.; Wei, Q.; Park, H.; Na, Y.; Jeong, D.; Lim, H. Development of a Finger-Ring-Shaped Hybrid Smart Stethoscope for Automatic S1 and S2 Heart Sound Identification. Sensors 2021, 21, 6294. [Google Scholar] [CrossRef]
- Yin, C.; Zhou, X.; Zhao, Y.; Zheng, Y.; Shi, Y.; Yan, X.; Guo, X. Diagnosis of Exercise-Induced Cardiac Fatigue Based on Deep Learning and Heart Sounds. Appl. Acoust. 2022, 197, 108900. [Google Scholar] [CrossRef]
- Behera, S.; Misra, I.S.; Naveed Siddiqui, K. Phonocardiogram Signal Based Better Prediction of Aortic and Mitral Stenosis Heart Diseases Using Machine Learning. In Proceedings of the 2025 International Conference on Ambient Intelligence in Health Care (ICAIHC), Raipur Chattisgarh, India, 10–11 January 2025; pp. 1–6. [Google Scholar]
- Tariq, Z.; Shah, S.K.; Lee, Y. Feature-Based Fusion Using CNN for Lung and Heart Sound Classification. Sensors 2022, 22, 1521. [Google Scholar] [CrossRef] [PubMed]
- Huang, Y.; Li, H.; Tao, R.; Han, W.; Zhang, P.; Yu, X.; Wu, R. A Customized Framework for Coronary Artery Disease Detection Using Phonocardiogram Signals. Biomed. Signal Process. Control 2022, 78, 103982. [Google Scholar] [CrossRef]
- Li, H.; Wang, X.; Liu, C.; Li, P.; Jiao, Y. Integrating Multi-Domain Deep Features of Electrocardiogram and Phonocardiogram for Coronary Artery Disease Detection. Comput. Biol. Med. 2021, 138, 104914. [Google Scholar] [CrossRef]
- Ma, S.; Chen, J.; Ho, J.W.K. An Edge-Device-Compatible Algorithm for Valvular Heart Diseases Screening Using Phonocardiogram Signals with a Lightweight Convolutional Neural Network and Self-Supervised Learning. Comput. Methods Programs Biomed. 2024, 243, 107906. [Google Scholar] [CrossRef]
- Alkahtani, H.K.; Haq, I.U.; Ghadi, Y.Y.; Innab, N.; Alajmi, M.; Nurbapa, M. Precision Diagnosis: An Automated Method for Detecting Congenital Heart Diseases in Children From Phonocardiogram Signals Employing Deep Neural Network. IEEE Access 2024, 12, 76053–76064. [Google Scholar] [CrossRef]
- Rong, Y.; Fynn, M.; Nordholm, S.; Siaw, S.; Dwivedi, G. Wearable Electro-Phonocardiography Device for Cardiovascular Disease Monitoring. In Proceedings of the IEEE Statistical Signal Processing Workshop, Hanoi, Vietnam, 2–5 July 2023; pp. 413–417. [Google Scholar]
- Giordano, N.; Rosati, S.; Balestra, G.; Knaflitz, M. A Wearable Multi-Sensor Array Enables the Recording of Heart Sounds in Homecare. Sensors 2023, 23, 6241. [Google Scholar] [CrossRef]
- Bian, J.; Chee, K.-H.; Liu, C.; Sun, H.; Zhang, S.; Chen, P.; Renchen, D.; Ting, H.-N. A Novel Scoring System for Heart Failure Screening Utilizing Combined Electrocardiogram, Phonocardiogram, and Radial Artery Features. Sci. Rep. 2025, 15, 14829. [Google Scholar] [CrossRef] [PubMed]
- Jyothi, P.; Pradeepini, G. Heart Disease Detection System Based on ECG and PCG Signals with the Aid of GKVDLNN Classifier. Multimed. Tools Appl. 2023, 83, 30587–30612. [Google Scholar] [CrossRef]
- Gnanapirakasam, S.G.; Manjula, J. A Novel Approach for the Detection of Cardiovascular Abnormalities from Electrocardiogram and Phonocardiogram Signals Using Combined CNN-LSTM Techniques. Int. Inf. Eng. Technol. Assoc. 2024, 41, 3131–3142. [Google Scholar] [CrossRef]
- Klum, M.; Urban, M.; Tigges, T.; Pielmus, A.-G.; Feldheiser, A.; Schmitt, T.; Orglmeister, R. Wearable Cardiorespiratory Monitoring Employing a Multi-modal Digital Patch Stethoscope: Estimation of ECG, PEP, LVET and Respiration Using a 55 Mm Single-Lead ECG and Phonocardiogram. Sensors 2020, 20, 2033. [Google Scholar] [CrossRef] [PubMed]
- Roos, M.; Kobza, R.; Jamshidi, P.; Bauer, P.; Resink, T.; Schlaepfer, R.; Stulz, P.; Zuber, M.; Erne, P. Improved Cardiac Performance through Pacing-Induced Diaphragmatic Stimulation: A Novel Electrophysiological Approach in Heart Failure Management? EP Eur. 2009, 11, 191–199. [Google Scholar] [CrossRef]
- Van Eekelen, A.P.J.; Houtveen, J.H.; Kerkhof, G.A. Circadian Variation in Base Rate Measures of Cardiac Autonomic Activity. Eur. J. Appl. Physiol. 2004, 93, 39–46. [Google Scholar] [CrossRef]
- Reant, P.; Dijos, M.; Donal, E.; Mignot, A.; Ritter, P.; Bordachar, P.; Dos Santos, P.; Leclercq, C.; Roudaut, R.; Habib, G.; et al. Systolic Time Intervals as Simple Echocardiographic Parameters of Left Ventricular Systolic Performance: Correlation with Ejection Fraction and Longitudinal Two-Dimensional Strain. Eur. J. Echocardiogr. 2010, 11, 834–844. [Google Scholar] [CrossRef] [PubMed]
- Zhang, W.L.; Zhang, R.Y. Evaluation of cardiac function and 30-day clinical outcome with synchronized analysis of phonocardiogram and electrocardiogram in patients with acute myocardial infarction. Eur. Heart J. Digit. Health 2022, 43, ehac544.2770. [Google Scholar] [CrossRef]
- Alhakak, A.S.; Teerlink, J.R.; Lindenfeld, J.; Böhm, M.; Rosano, G.M.C.; Biering-Sørensen, T. The Significance of Left Ventricular Ejection Time in Heart Failure with Reduced Ejection Fraction. Eur. J. Heart Fail. 2021, 23, 541–551. [Google Scholar] [CrossRef]
- Boudoulas, H. Systolic time intervals. Eur. Heart J. 1990, 11, 93–104. [Google Scholar] [CrossRef]
- Lewis, R.P.; Rittogers, S.E.; Froester, W.F.; Boudoulas, H. A critical review of the systolic time intervals. Circulation 1977, 56, 146–158. [Google Scholar] [CrossRef] [PubMed]
- Li, X.-C.; Liu, X.-H.; Liu, L.-B.; Li, S.-M.; Wang, Y.-Q.; Mead, R.H. Evaluation of Left Ventricular Systolic Function Using Synchronized Analysis of Heart Sounds and the Electrocardiogram. Heart Rhythm. 2020, 17, 876–880. [Google Scholar] [CrossRef]
- Zhang, J.; Liu, W.-X.; Lyu, S.-Z. Predictive Value of Electromechanical Activation Time for In-Hospital Major Cardiac Adverse Events in Heart Failure Patients. Cardiovasc. Ther. 2020, 2020, 4532596. [Google Scholar] [CrossRef]
- Moyers, B.; Shapiro, M.; Marcus, G.M.; Gerber, I.L.; McKeown, B.H.; Vessey, J.C.; Jordan, M.V.; Huddleston, M.; Foster, E.; Chatterjee, K.; et al. Performance of Phonoelectrocardiographic Left Ventricular Systolic Time Intervals and B-Type Natriuretic Peptide Levels in the Diagnosis of Left Ventricular Dysfunction. Ann. Non-Invasive Electrocardiol. 2007, 12, 89–97. [Google Scholar] [CrossRef]
- Garrard, C.L.; Weissler, A.M.; Dodge, H.T. The Relationship of Alterations in Systolic Time Intervals to Ejection Fraction in Patients with Cardiac Disease. Circulation 1970, 42, 455–462. [Google Scholar] [CrossRef]
- Zeng, Y.; Xia, S. New Auscultation: Can We Detect Heart Failure by Auscultation? J. Community Med. Public Health Rep. 2022, 3. [Google Scholar] [CrossRef]
- Alhakak, A.S.; Sengeløv, M.; Jørgensen, P.G.; Bruun, N.E.; Johnsen, C.; Abildgaard, U.; Iversen, A.Z.; Hansen, T.F.; Teerlink, J.R.; Malik, F.I.; et al. Left ventricular systolic ejection time is an independent predictor of all-cause mortality in heart failure with reduced ejection fraction. Eur. J. Heart Fail. 2021, 23, 240–249. [Google Scholar] [CrossRef] [PubMed]
- Mohamed Sameh, A.; Abbas, M.A.; Hazem, M.; Abd Elazeem, M.H. Automativ Assessment of Systolic Cardiac Performance Using PEP/LVET Index. IOP Conf. Ser. Mater. Sci. Eng. 2021, 1051, 012017. [Google Scholar] [CrossRef]
- Parisi, A.F.; Milton, B.G. Relation of Mitral Valve Closure to the First Heart Sound in Man: Echocardiographic and Phonocardiographic Assessment. Am. J. Cardiol. 1973, 32, 779–782. [Google Scholar] [CrossRef]

| Reference | Construction Technology | Materials Used | Application Area | Parameters/Extracted Signals | Sensitivity |
|---|---|---|---|---|---|
| J. Cui et al. [15] | Cantilever piezo-resistors | Si, SiO2, low B ion, high B ion, Au | Thorax | PCG signal voltage (V) | 189.5 dB @ 500 Hz |
| T. Wang. et al. [16] | Capacitive electret microphone | Layer electret | Thorax | PCG signal array | N. A. |
| S. Lee et al. [17] | MEMS microphone and PPG sensor | Silicon | Finger and chest | PPG and PCG signals simultaneously | N. A. |
| Reference | Approach/Model | Output Classes | Input Features | Accuracy |
|---|---|---|---|---|
| C. Yin et al. [18] | ResNet and attention module | Resting/post-exercise | Durations of segments S1, S2, S3, S4 | 98% |
| S. Behera et al. [19] | DT, RF, SVM, KNN | Severe, Mild AS, Mild, Moderate MS, Healthy | DWT, WPT, and PWPT features | 99.2% |
| Z. Tariq et al. [20] | FDC-FS | Multi-classification CVD (normal, AS, MR, MS, MVP) | Multi-features images | 97% |
| Y. Huang et al. [21] | Clustering, feature fusion, RF | Normal/CAD | MFCC and PCG signal segments | 96.05% |
| H. Li et al. [22] | CNN-1D CNN-2D | Normal/CAD | Signals, spectral images, and time–frequency images of ECG and PCG | 96.51% |
| S. Ma et al. [23] | CNN-1D | Normal/VHD | Features generated from convolutional layers | 99.4% |
| H. K. Alkahtani [24] | CNN-1D | Normal/VHD | Features generated from convolutional layers | 98.56% |
| Reference | PCG Acquisition Channels | Type of PCG Sensor | Application Area | Additional Signals | Algorithm | Type of Measurement/Classification |
|---|---|---|---|---|---|---|
| Y. Rong et al. [25] | 12 in total (6 heart-sensor microphones and 6 background noise microphones) | N. A. | Chest | ECG | CNN-based CVD classifier using both the PCG and ECG signals | Classification Normal/CVD |
| N. Giordano et al. [26] | 48 | Electret microphone and MIMU | Chest | ECG | - | Classification Normal/CVD |
| P. Jyothi et al. [28] | 1 | N. A. | N. A. | ECG | GKVDLNN | Classification arrhythmias, ischemic, prolapsed mitral valve, normal, valvular heart diseases |
| S. Gnanapira-kasam et al. [29] | 1–4 | Littmann® Electronic Stethoscope Model 3200 | N. A. | ECG | CNN-LSTM | Abnormal/Normal ECG, PCG, or both ECG and PCG |
| M. Klum et al. [30] | 1 | Digital stethoscope | Chest | ECG | TDNN | Regression Systolic times |
| Pickup range | 0–20,000 Hz |
| Sensitivity | −52 dB |
| Noise Level | Less than −45 dB |
| Magnification | 4× |
| Bias voltage | DC 2.6–3 V |
| Signal | Analog |
| Signal range | 0–200 mV |
| Sampling rate | 44.1 KHz |
| Interface standard | National Standard or American Standard |
| Systolic Times | Measured Systolic Times | Typical Range |
|---|---|---|
| EMAT [ms] | 74.35 | 50–120 [31] |
| PEP [ms] | 89.00 | 50–120 [32] |
| LVET [ms] | 244.39 | 150–350 [33] |
| LVST [ms] | 258.60 | 150–350 [34] |
| Pathology | EMAT [ms] | PEP [ms] | LVET [ms] | LVST [ms] | Clinical Insight/Thresholds |
|---|---|---|---|---|---|
| Acute myocardial infarction (AMI) [29] | Increased (EMAT% > 12.1%) | Increased (%PEP from 16.23 to 17.29) | Reduced (%LVET from 30.63 to 29.85) | Reduced (%LVST from 38.07 to 37.38 | Associated with lower LVEF, increased LVEDV/LVESV, and higher MACE risk. |
| Depressed left ventricular ejection fraction (dLVEF) [38] | Increased (EMAT ≥ 104 ms) | - | - | - | EMAT ≥ 104 ms predicts LVEF < 50%. |
| Heart failure with reduced EF (HFrEF) [39] | Increased (% EMAT > 13.8%) | - | - | - | % EMAT > 13.8% predicts LVEF < 50%. |
| Left ventricular dysfunction [40] | ≥15 | - | - | - | EMAT/LVST ≥ 0.40 is an indicator of impaired systolic performance. |
| Ischemic heart disease [41] | - | Increased (r = −0.69 with EF) | Reduced (r = 0.67 with EF) | - | PEP/LVET is correlated with the Ejection Fraction (EF) and Stroke index with correlation r = −0.77 and −0.72. |
| Mitral valve disease [41] | - | Increased (r = −0.69 with EF) | Reduced (r = 0.67 with EF) | - | PEP/LVET is correlated with the Ejection Fraction (EF) with a correlation r = −0.87. |
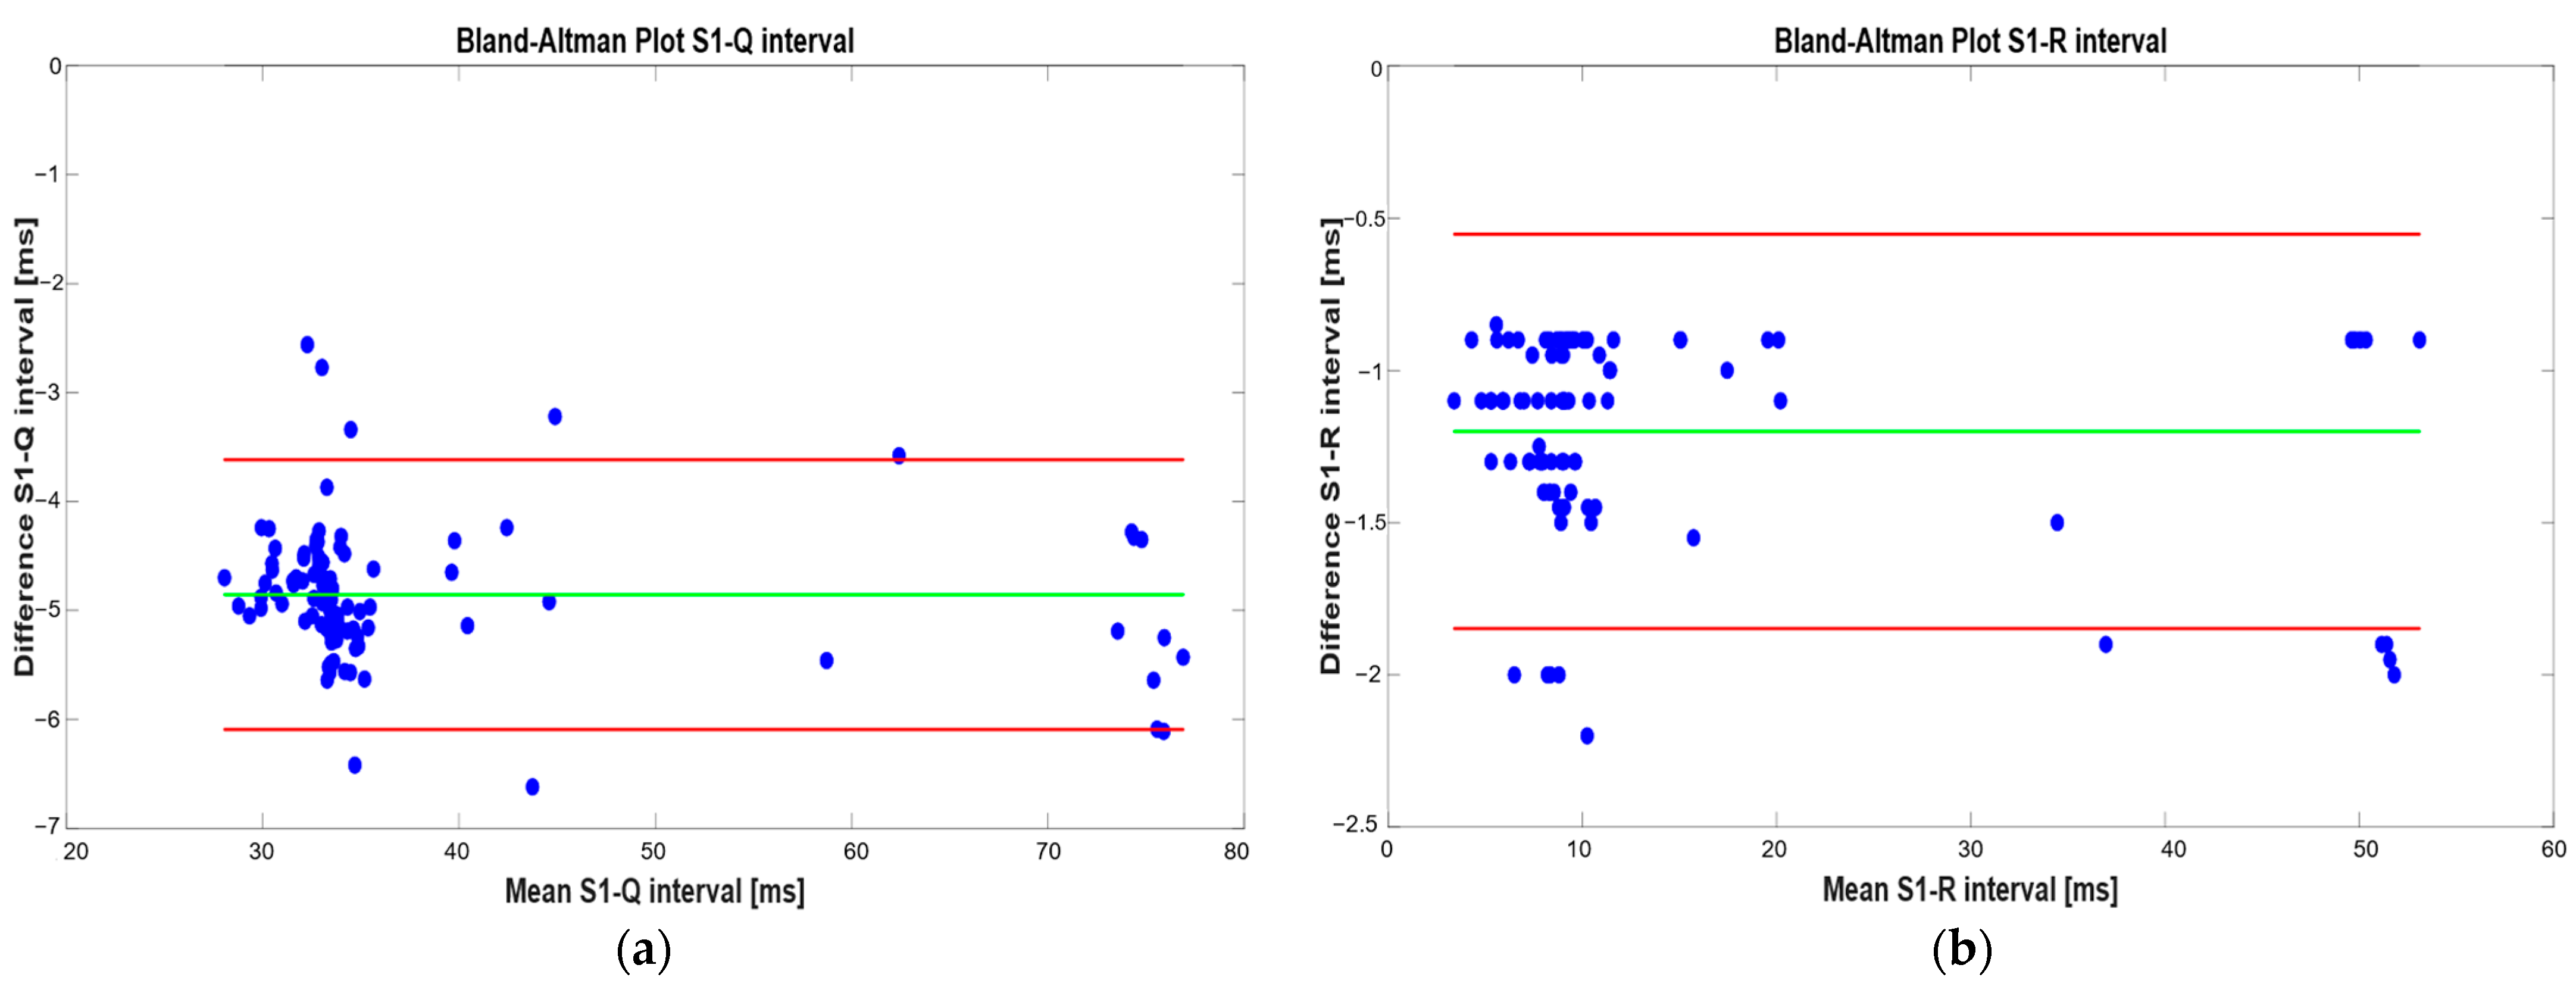
| Metric | S1–Q Interval | S1–R Interval |
|---|---|---|
| Mean difference [ms] | −4.85 | −1.20 |
| LoAs [ms] | −3.42/−6.09 | −0.55/1.85 |
| Mean absolute error [ms] | 4.85 | 1.20 |
| Maximum absolute error [ms] | 6.62 | 2.20 |
| Mean relative error [%] | 8.65 | 12.05 |
| Maximum relative error [%] | 10.39 | 18.60 |
Disclaimer/Publisher’s Note: The statements, opinions and data contained in all publications are solely those of the individual author(s) and contributor(s) and not of MDPI and/or the editor(s). MDPI and/or the editor(s) disclaim responsibility for any injury to people or property resulting from any ideas, methods, instructions or products referred to in the content. |
© 2025 by the authors. Licensee MDPI, Basel, Switzerland. This article is an open access article distributed under the terms and conditions of the Creative Commons Attribution (CC BY) license (https://creativecommons.org/licenses/by/4.0/).
Share and Cite
De Fazio, R.; Cascella, I.; Yalçınkaya, Ş.E.; De Vittorio, M.; Patrono, L.; Velazquez, R.; Visconti, P. Synchronous Acquisition and Processing of Electro- and Phono-Cardiogram Signals for Accurate Systolic Times’ Measurement in Heart Disease Diagnosis and Monitoring. Sensors 2025, 25, 4220. https://doi.org/10.3390/s25134220
De Fazio R, Cascella I, Yalçınkaya ŞE, De Vittorio M, Patrono L, Velazquez R, Visconti P. Synchronous Acquisition and Processing of Electro- and Phono-Cardiogram Signals for Accurate Systolic Times’ Measurement in Heart Disease Diagnosis and Monitoring. Sensors. 2025; 25(13):4220. https://doi.org/10.3390/s25134220
Chicago/Turabian StyleDe Fazio, Roberto, Ilaria Cascella, Şule Esma Yalçınkaya, Massimo De Vittorio, Luigi Patrono, Ramiro Velazquez, and Paolo Visconti. 2025. "Synchronous Acquisition and Processing of Electro- and Phono-Cardiogram Signals for Accurate Systolic Times’ Measurement in Heart Disease Diagnosis and Monitoring" Sensors 25, no. 13: 4220. https://doi.org/10.3390/s25134220
APA StyleDe Fazio, R., Cascella, I., Yalçınkaya, Ş. E., De Vittorio, M., Patrono, L., Velazquez, R., & Visconti, P. (2025). Synchronous Acquisition and Processing of Electro- and Phono-Cardiogram Signals for Accurate Systolic Times’ Measurement in Heart Disease Diagnosis and Monitoring. Sensors, 25(13), 4220. https://doi.org/10.3390/s25134220